Article

Ammonia–Nitrate Mixture Dominated by NH4+–N Promoted Growth, Photosynthesis and Nutrient Accumulation in Pecan (Carya illinoinensis)

1
College of Forestry, Nanjing Forestry University, Nanjing 210037, China
2
Co-Innovation Center for Sustainable Forestry in Southern China, College of Forestry, Nanjing Forestry University, Nanjing 210037, China
3
Department of Ecology, Nanjing Forestry University, Nanjing 210037, China
*
Author to whom correspondence should be addressed.
Submission received: 15 November 2021 / Revised: 16 December 2021 / Accepted: 17 December 2021 / Published: 20 December 2021
(This article belongs to the Section Forest Ecophysiology and Biology)

Abstract

:
Although ammonia–nitrogen (NH4+–N) and nitrate–nitrogen (NO3–N) are the two main forms of N absorbed and utilized by plants, the preferences of plants for these forms are still unclear. In this study, we analyzed the growth, photosynthesis, and nutrients of pecan under different NH4+:NO3 ratios (0/0, 0/100, 25/75, 50/50, 75/25, 100/0) by indoor aerosol incubation. The results showed that additions of different N forms promoted the growth and development of pecan seedlings. When NO3–N was used as the sole N source, it significantly promoted the ground diameter growth of pecan and increased the leaf pigment content and photosynthetic rate. The NH4+:NO3 ratio of 75:25 and NH4+–N as the sole N source significantly increased the soluble sugars in stems and roots, starch in leaves, stems and roots, soluble protein in leaves and stems, and soluble phenols in stems and roots. Additionally, the NH4+:NO3 ratio of 75:25 increased plant height, leaf number, root soluble protein, and leaf soluble phenol contents. In conclusion, regarding the physiological aspects of pecan growth, pecans are more inclined to use NH4+–N. Considering that the NH4+–N as the only N source may lead to nutrient imbalance or even toxicity, the NH4+:NO3 ratio of 75:25 was most favorable for the growth and development of pecan seedlings.

Graphical Abstract

1. Introduction

Nitrogen (N) is a nutrient that plays a key role in plant growth and development, and ammonia–nitrogen (NH4+–N) and nitrate–nitrogen (NO3–N) are the two main N forms absorbed and utilized by plants [1]. NH4+ enters the plant and combines with organic acids to form amino acids and amides [2]; NO3 is absorbed into plants and cannot be used directly by plants: part of it is reduced to NH4+ [3], and part is stored in vacuoles [4]. Different plants have different preferences for the uptake of NH4+ and NO3. When both N forms are present, plants preferentially use one of them [5,6]. The absorption of N by plants varies with environmental conditions, such as the N concentration, temperature, and soil pH [7]. The N concentration directly affects the plant uptake of N, and concentrations either too high or too low may limit the uptake of N [8]. Temperature affects plant N uptake mainly by altering plant metabolic processes, with high temperature promoting N absorption [9] and low temperatures inhibiting N accumulation [10]. The pH affects the proportion of NH4+ and NO3 entering the plant [11]. Generally, plants adapted to growth in acidic soil prefer NH4+ and have significantly higher rates of nutritional and, especially, reproductive growth; in contrast, plants adapted to high pH calcareous soil preferentially utilize NO3 [12]. However, it has also been shown that some woody plants adapted to growth in acidic soil prefer NO3 [13,14].
Moreover, with the rapid development of agroforestry, the application of N fertilizer has become more extensive, and how to use N fertilizer accurately remains a hot research topic. N deficiency can restrict plant growth [15], but excessive application of N fertilizer can also reduce N use efficiency and even damage plants [16]. When the N concentration was too high and N fertilizer was applied alone, plants were prone to ammonium toxicity symptoms, which usually manifested as growth restriction and leaf chlorosis [3,17], while NO3–N generally had no adverse effects. NH4+ and free ammonia (NH3) are the two main forms of inorganic NH4+–N [7], and they are also the main source of ammonium poisoning to plants [18]. Studies have shown that the simultaneous application of NH4+–N and NO3–N can alleviate toxicity [19]. It is easier for plants to adjust their intracellular pH and store a portion of N through a small amount of energy to obtain higher yields and economic effects [20,21].
However, different NH4+:NO3 ratios have different effects on the morphological and physiological characteristics of plants [22,23]. Nicodemus et al. showed that NH4NO3 was more effective in promoting growth and net photosynthetic rate than NH4+ or NO3 alone in black walnut (Juglans nigra L.) [24]. Cyclocarya paliurus (Batal.) Iljinskaja had the highest seedling growth at the NO3/NH4+ ratio of 50/50, while the highest induced polyphenol and flavonoid content in plants occurred at NO3/NH4+ ratios of 100/0 and 0/100 [25]. In addition, studies have reported that NH4+ and NO3 can significantly increase the nutrient concentration of plants, such as soluble sugar, soluble protein, and vitamin C concentrations, when mixed in different proportions [21,26].
Carya illnoinensis (Wangenh.) K. Koch (Pecan) is a member of the Juglandaceae family [27]. It is native to the United States and northern Mexico in North America, characterized by a straight trunk, thin shell, and full and sweet kernels, and is a world-renowned excellent species for both dried fruit, oil, and timber [28]. However, although there have been many studies on pecans [29,30], there has been little research on the preferences of this species for NH4+–N and NO3–N [31]. Therefore, in this study, pecan seedlings were used as materials to study the effects of different NH4+:NO3 ratios on their growth and development. Specifically, the growth, leaf pigment content, photosynthesis, nonstructural carbohydrates, soluble protein, and soluble phenol content were measured to address the following questions: (A) Which NH4+:NO3 ratio is most helpful for the growth and development of pecan seedlings at a given N concentration? (B) How do different NH4+:NO3 ratios affect the distribution of nutrients in various organs of pecan seedlings?

2. Material and Methods

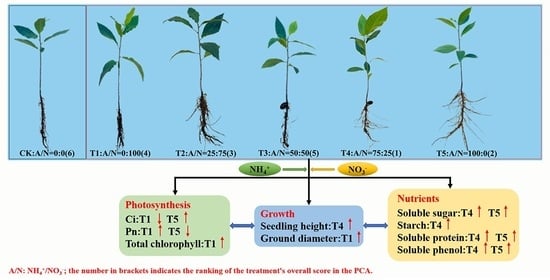
2.1. Plant Material and Experimental Design

The experiment was carried out in the greenhouse of the campus of Nanjing Forestry University from 18 April 2021 to 9 June 2021. Seedlings of the pecan “Pawnee” were used as the test materials. Seedlings with a height of approximately 25 cm were selected, and the roots were cleaned with clean water, disinfected with carbendazim for 20 min, and then transplanted to an aerosol incubator for indoor culture experiment. Each treatment had 18 replicates, arranged in a randomized complete block design. The greenhouse conditions were as follows: natural light, 12 h/12 h day/light, day and night temperature of 30/25 °C, and relative humidity of 70% ± 5%. The nutrient solution was an improved Hoagland nutrient solution with the following formulation: 1.25 mM Ca(NO3)2, 0.5 mM Ca(H2PO4)2, 1.0 mM K2SO4, 0.5 mM MgSO4, 1.0 μM ZnSO4, 12.5 μM H3BO3, 1.0 μM MnSO4, 0.25 μM CuSO4, 0.1 μM (NH4)6Mo7O24, 10 μM EDTA-Fe. The pH was adjusted to approximately 6.0 every other day with 24 h aeration, and the nutrient solution was changed every 7 days. The experimental treatment was first precultured with 1/4 nutrient solution for one week, after which the culture was continued in the full nutrient solution. According to the results in hickory [32], the N concentration in the nutrient solution was determined to be 2 mM. In the case of the same N supply, the five ammonia to nitrate ratios (NH4+:NO3) were 100:0, 75:25, 50:50, 25:75, and 0:100, corresponding to T1, T2, T3, T4, and T5, respectively. The nutrient solution without N was used as the control (CK), and each treatment was repeated three times, each with six seedlings. Regulation of the NH4+:NO3 ratios for each treatment was achieved with specific source compounds (Table 1). Samples were taken after 45 days of treatment for further determination.

2.2. Measurements

2.2.1. Measurement of Growth Parameters

To evaluate the effects of different N forms on the growth of pecans, pecan seedlings cultivated for 0, 15, 30, and 45 d under different treatments were used for the determination of morphological indicators. The main indicators were the leaf number (numbers), seedling height (cm), and stem thickness (mm), which were measured with a straight edge and a Vernier caliper.

2.2.2. Measurement of Chlorophyll and Photosynthetic Parameters

To evaluate the effects of different N forms on the photosynthetic parameters of pecan seedlings, the CIRAS-2 Photosynthetic System (CIRAS-2, PP Systems, Amesbury, UK) was used to determine the net photosynthetic rate (Pn) and stomatal conductance (Gs), intercellular carbon dioxide concentration (Ci), transpiration rate (E), etc. The data were directly obtained and recorded by the instrument. Chlorophyll contents were measured after extraction with pure acetone and calculated following Lichtenthaler [33].

2.2.3. Measurement of Major Nutrient Elements

To evaluate the effect of different N forms on the nutrient absorption of pecans, the starch and soluble sugar concentrations in roots and leaves were determined by anthrone colorimetry. Soluble proteins were extracted by kaumas brilliant blue G-250 method. The determination of soluble phenol was based on the Folin–Ciocalteu colorimetric method.

2.3. Data Analysis

Before analysis of variance (ANOVA), data were checked for normality and homogeneity of variances. One-way ANOVA was performed to test the effects of different N forms on photosynthetic characteristics, leaf health, and nutrient absorption of pecan seedlings. Two-way ANOVA was performed to test the effects of N form, time, and their interactions on the growth properties of pecan seedlings. Differences were considered significant at p < 0.05. Correlation analysis was used to test the correlations between the physiological growth indicators. Finally, principal component analysis (PCA) was carried out on 15 physiological indicators of growth, determining the number of principal components according to characteristic values and cumulative contribution rates and calculating principal component scores based on factor scores [34]. The comprehensive scores of different treatments were calculated and sorted according to the principal component scores.
F i = b i × X
F = i = 1 m V i P F i  
In Equation (1), bi is the factor score and X is the arithmetic square root of eigenvalues in each principal component. In Equation (2), (Vi/P) is the contribution rate of eigenvalues for each principal component; i = 1, 2; Fi is the score of the principal component.
All statistical analyses were performed with SPSS 23.0 software (Version 23.0, Chicago, IL, USA). All charts were drawn with Excel (Version 2019, Redmond, WA, USA) and SigmaPlot (Version 14.0, Barcelona, Spain).

3. Results

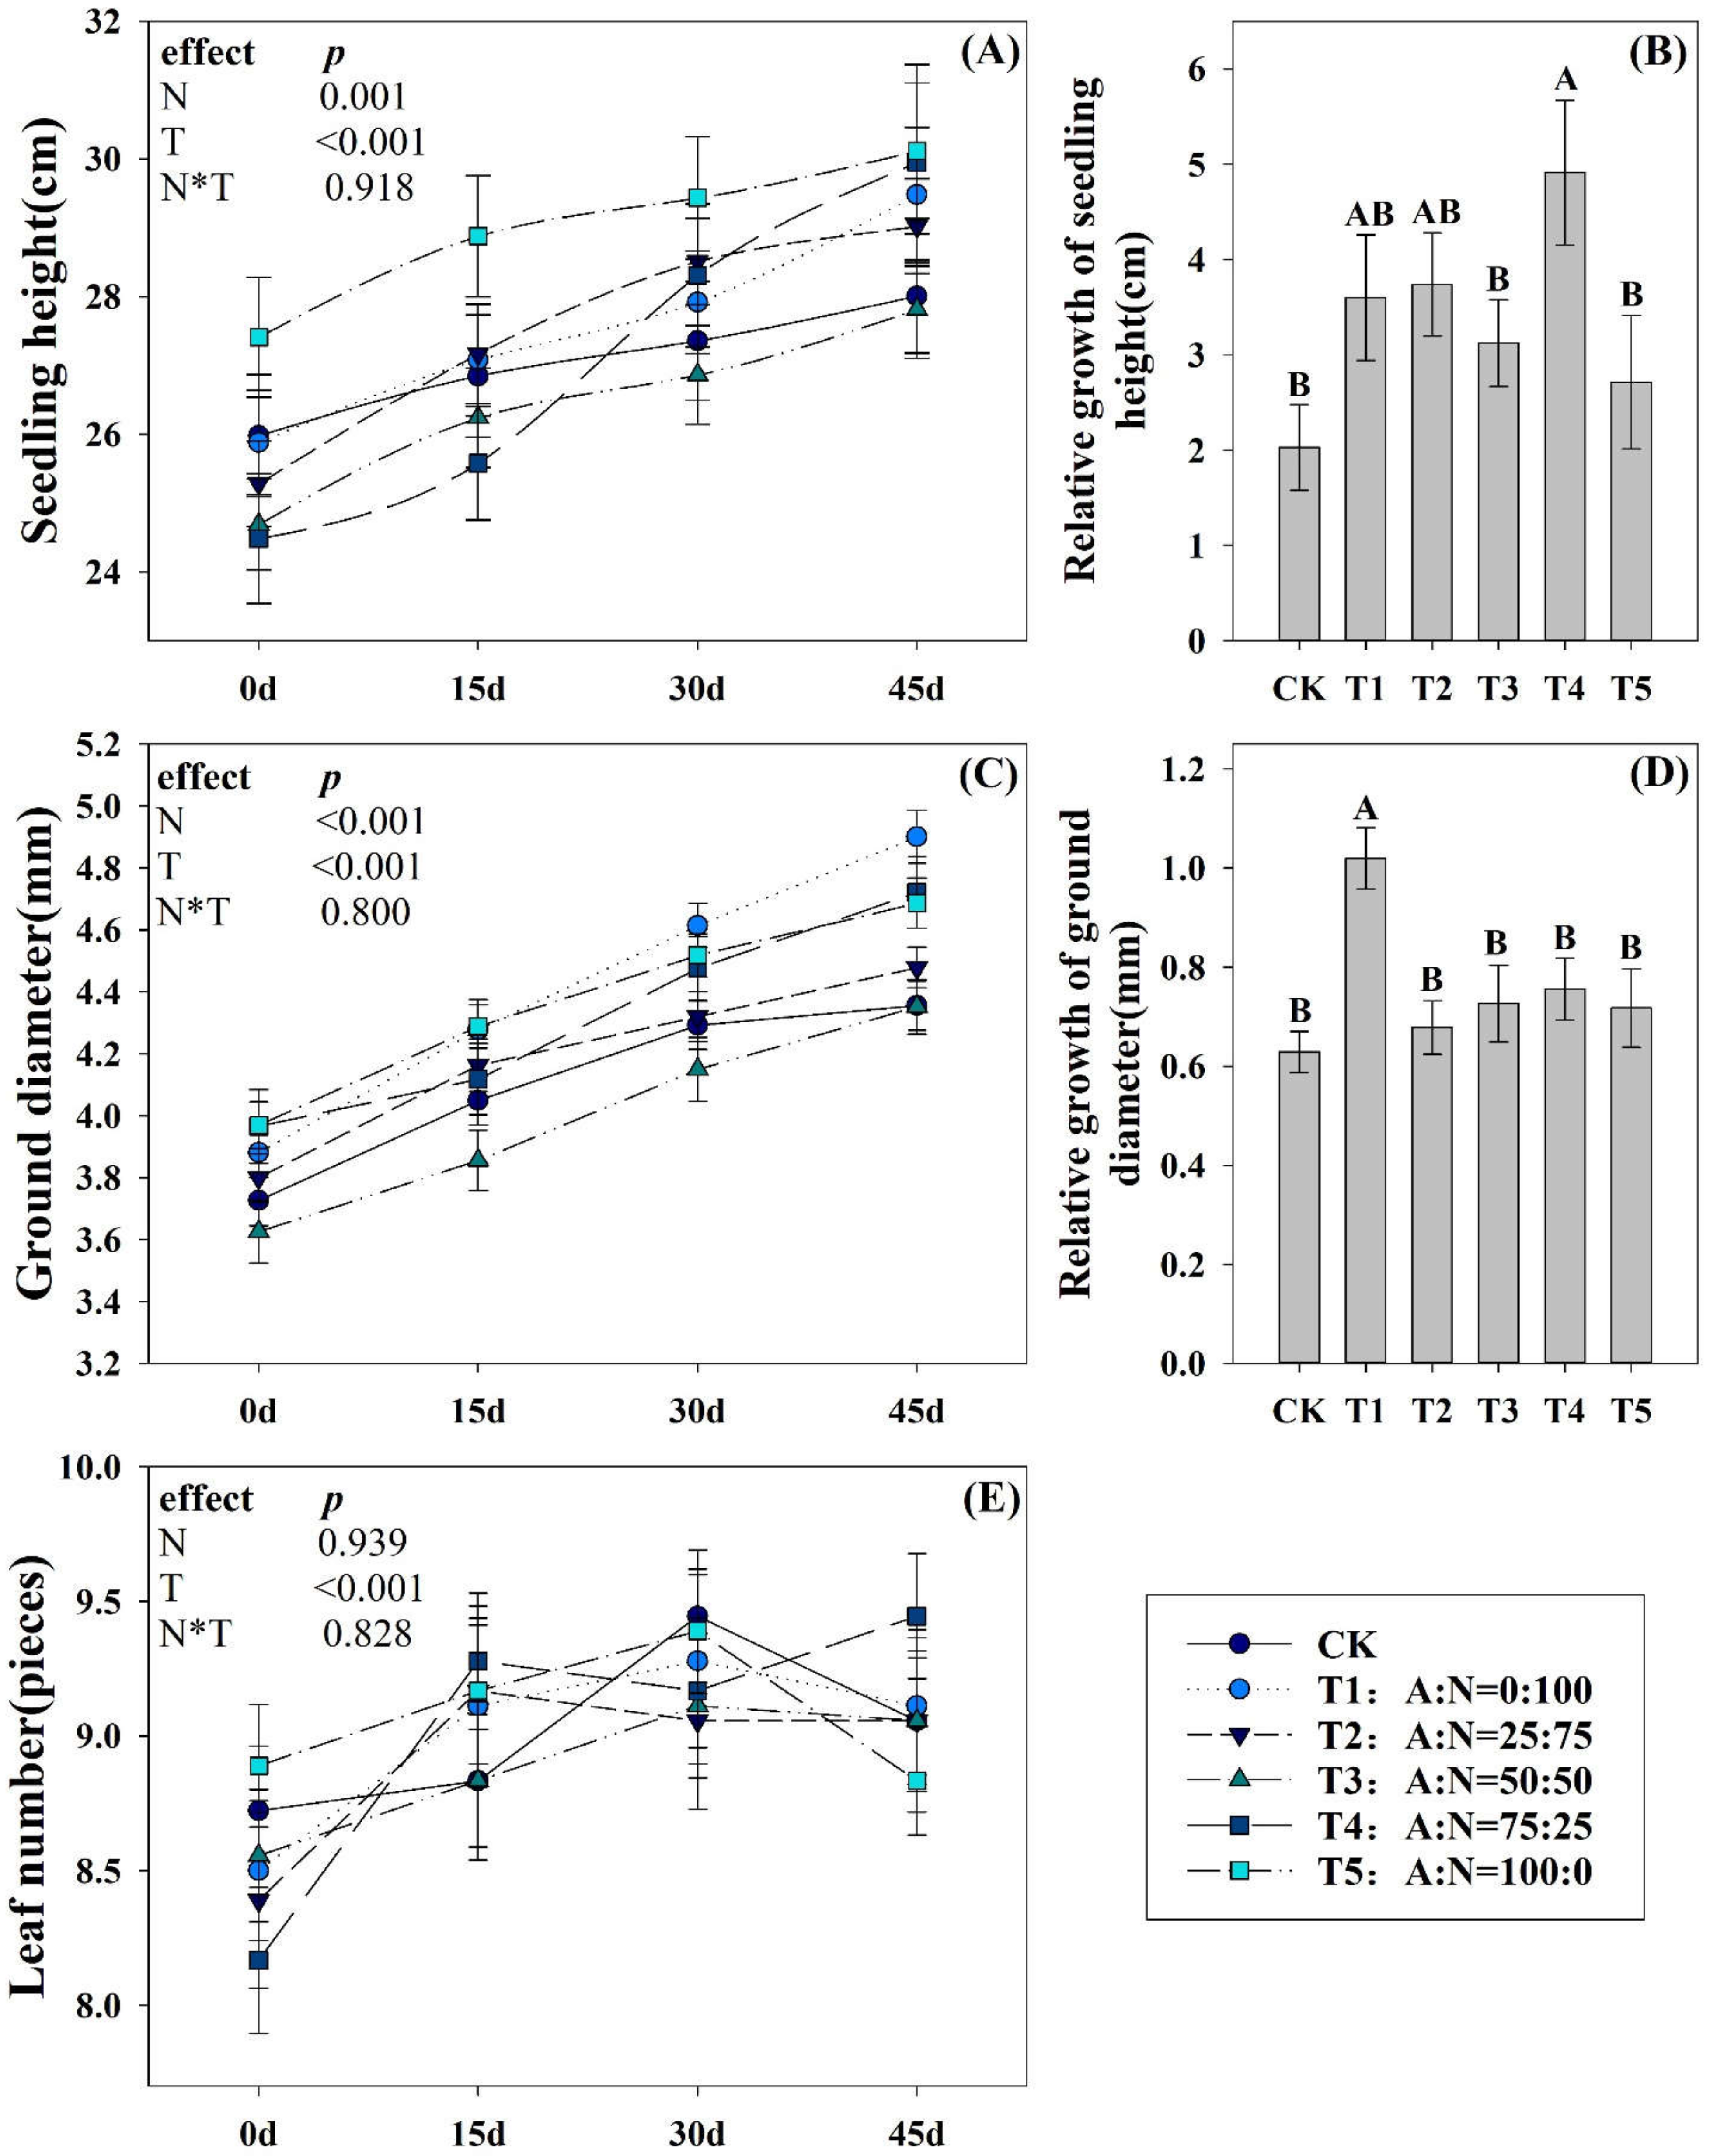
3.1. Effects of N Forms on the Growth Characteristics of Pecan Seedlings

Time had extremely significant effects on the growth indicators of the pecan seedlings (p < 0.01), while the NH4+:NO3 ratios of the nutrient solution only showed a significant impact on the height and ground diameter of the seedlings (p < 0.01). There was no significant interaction between NH4+:NO3 ratios and time factors (Figure 1A,C,E). T4 significantly increased the relative increase in pecan seedling height (p < 0.05) (Figure 1B), and the other NH4+:NO3 treatments also increased this parameter to a certain extent, but there was no significant difference from CK. The height of pecan seedlings of T4 also increased the most over time (Figure 1A), indicating that T4 was the most conducive to the height growth of pecan seedlings compared to the other NH4+:NO3 ratios.
The ground diameter of T1 pecan seedlings increased the fastest with time, and the relative growth was also significantly greater than that under the other NH4+:NO3 ratios and CK (p < 0.05) (Figure 1C,D). This result indicated that T1 had the best effect on promoting the ground diameter increase of pecan seedlings.
The number of leaves of pecan seedlings under each treatment showed a trend of first increasing and then decreasing with time, but the time point of the decrease in the number of leaves was different (Figure 1E). On the 15th day, the number of leaves of pecan seedlings under the NH4+:NO3 treatments was significantly increased relative to that under CK, and the increase in T4 was the most obvious. On the 30th d, the number of leaves of pecan seedlings in T2 and T4 began to decrease, and the lower leaves of the seedlings began to wither and fall; however, for CK, T1, T3, and T5, an obvious drop in the lower leaves was only observed at the 45th d.

3.2. Effects of N Forms on the Photosynthetic Characteristics of Pecan Seedlings

One-way ANOVA showed that the NH4+:NO3 ratios of the nutrient solution had a significant effect on Ci and Pn (p < 0.05) but had no significant effect on E and Gs (Table 2). There was no significant difference in Ci between the NH4+:NO3 treatments and the CK, but that of T5 was significantly greater than that of T1 (p < 0.05). E in this experiment was generally low, which may have been caused by the high humidity in the greenhouse. The changing trend of Pn with the increase in the proportion of NH4+ was completely opposite to that of Ci. The Pn of T1 was significantly larger than that of CK and T5 (p < 0.05). There was no significant difference between T2, T3, T4, T5, and CK. T1 improved the photosynthetic capacity of pecan seedlings.

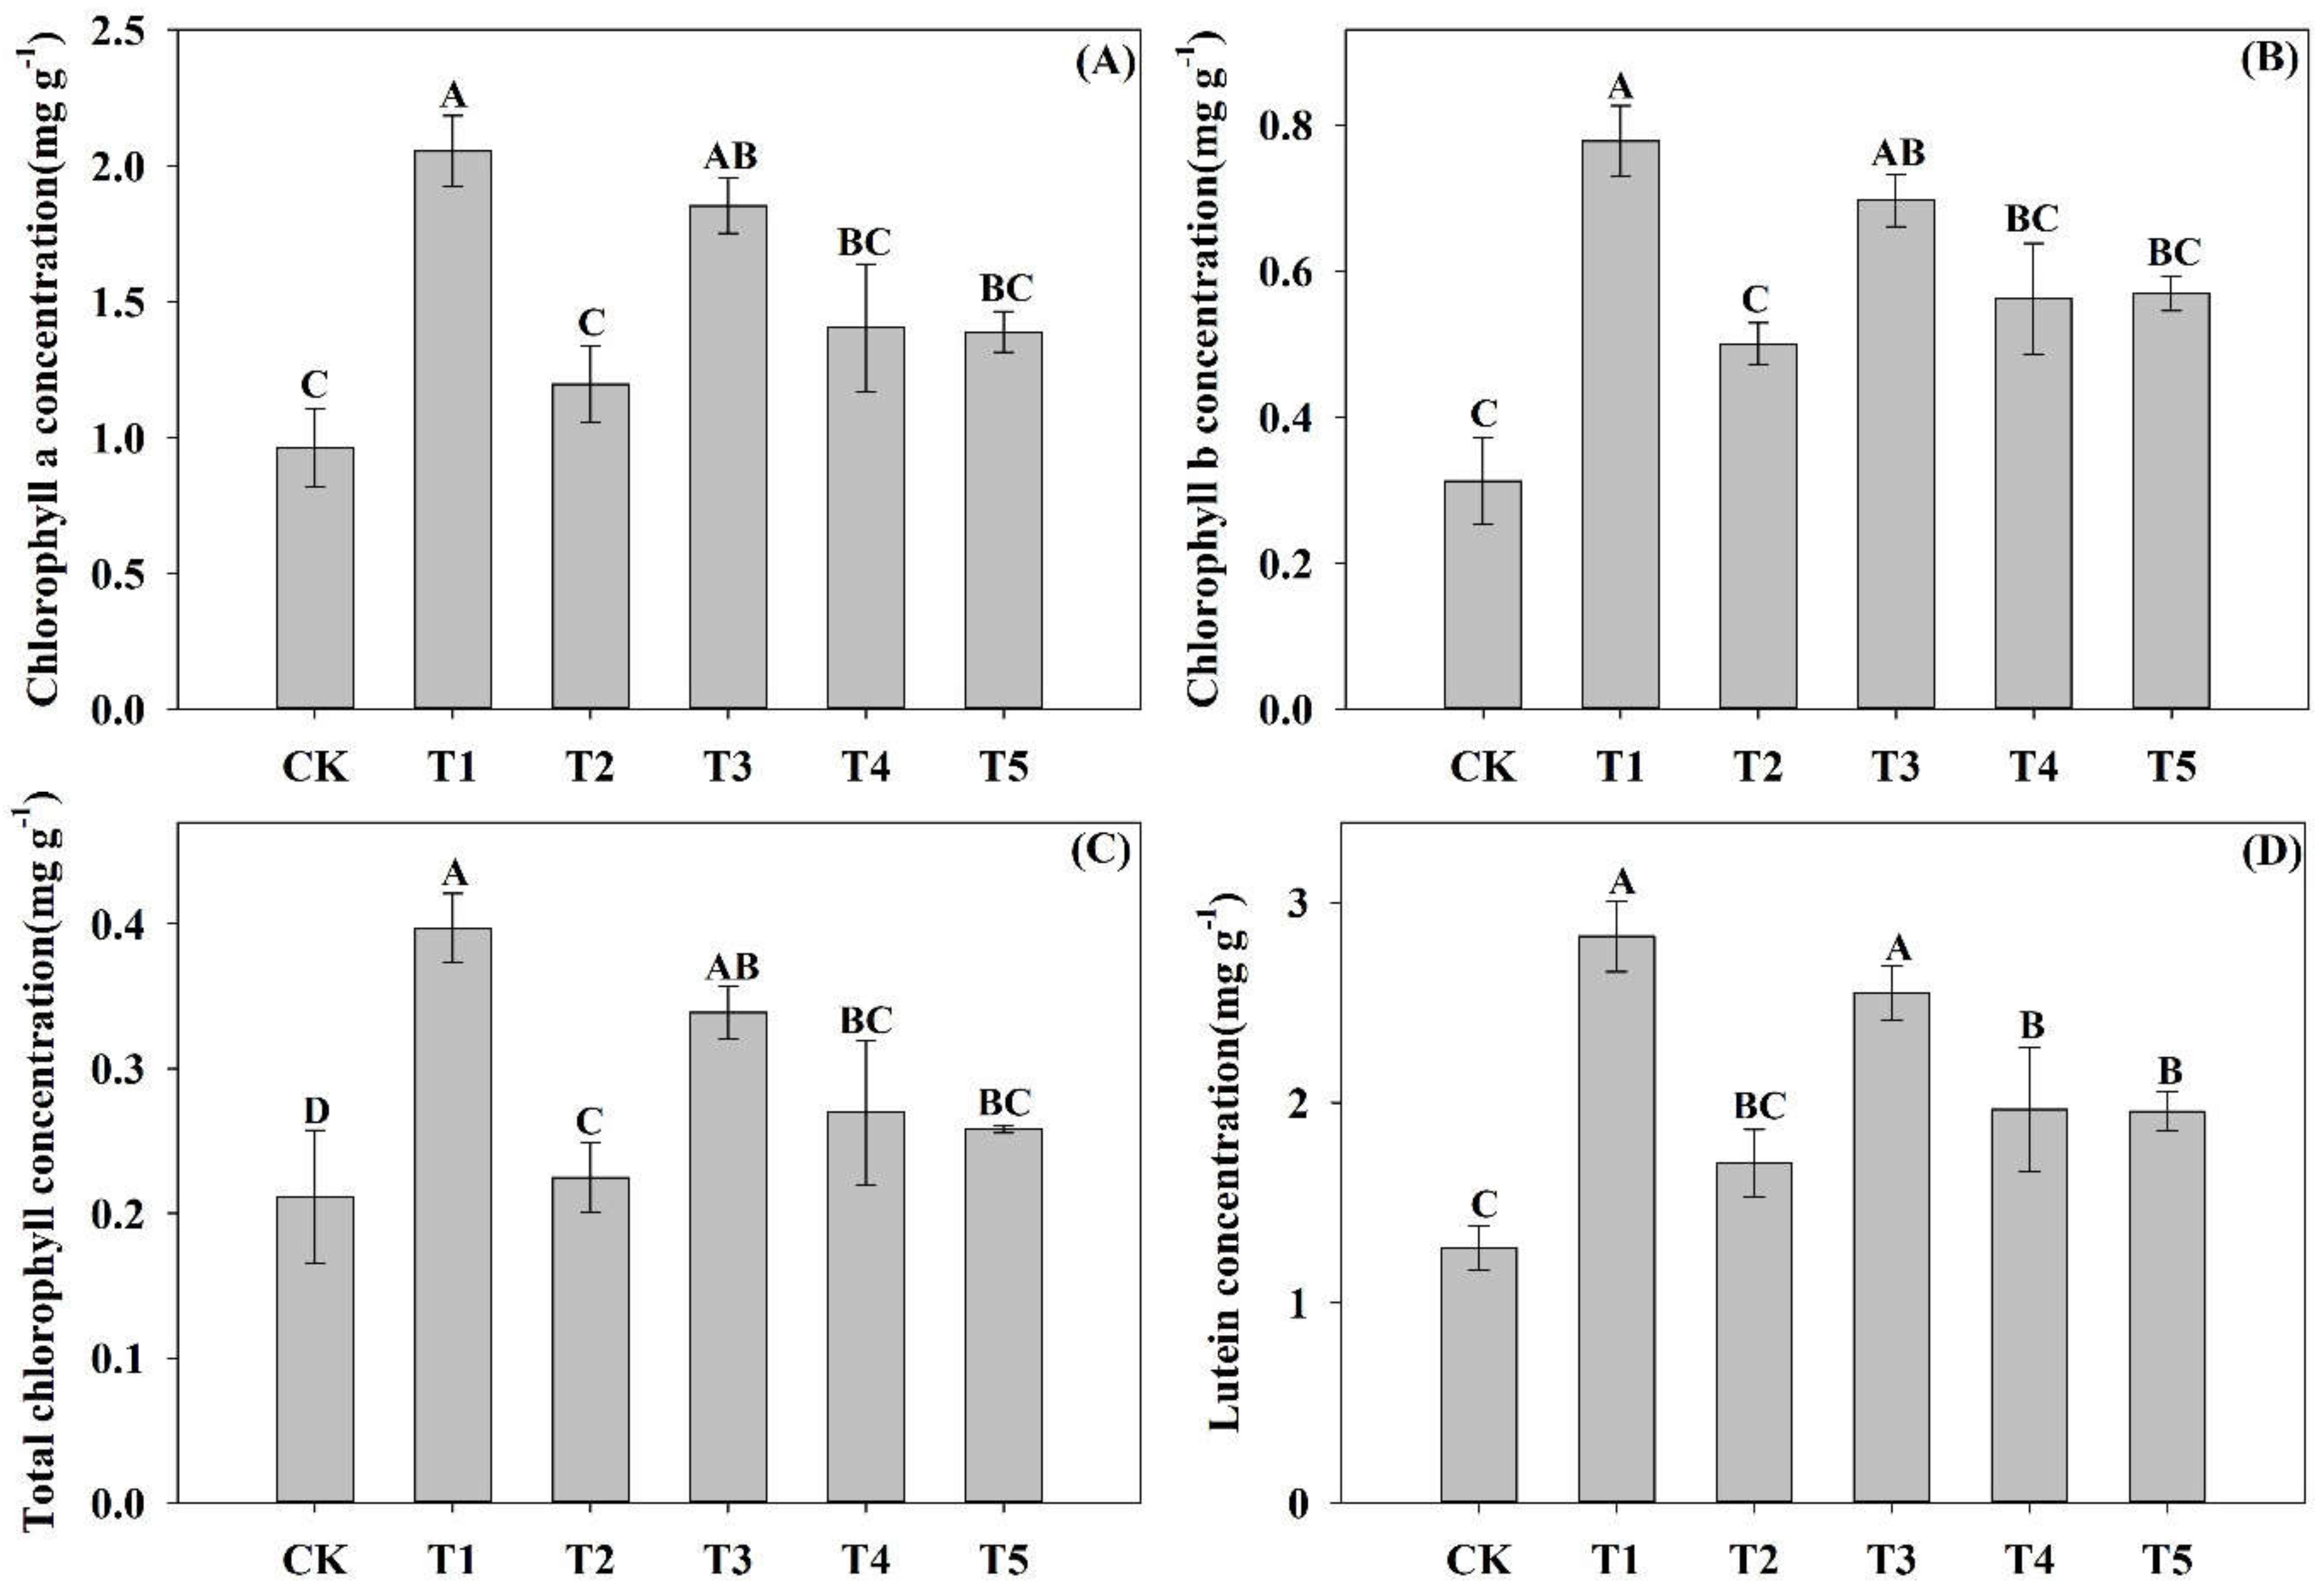
3.3. Effects of N Forms on the Chlorophyll and Lutein Concentrations of Pecan Seedlings

The results showed that the NH4+:NO3 ratios of the nutrient solution had a significant effect on the concentrations of chlorophyll a and b, total chlorophyll and lutein (p < 0.05) (Figure 2). Both T1 and T3 significantly increased the chlorophyll a and b concentrations of pecan seedlings (p < 0.05), and there was no significant difference between the other NH4+:NO3 treatments and the CK (Figure 2A,B). The NH4+:NO3 treatments significantly increased the total chlorophyll concentration (p < 0.05), among which T1 and T3 were not significantly different and were significantly greater than T2, T4, and T5 (p < 0.05) (Figure 2C).
Except for T2, the other NH4+:NO3 treatments significantly increased the lutein concentrations of pecan seedlings (p < 0.05), and T1 and T3 caused significantly greater concentrations than T4 and T5 (p < 0.05) (Figure 2D). This indicated that each NH4+:NO3 treatment promoted the formation of chlorophyll and lutein, but the promoting effect of the T1 and T3 treatments was the most obvious.

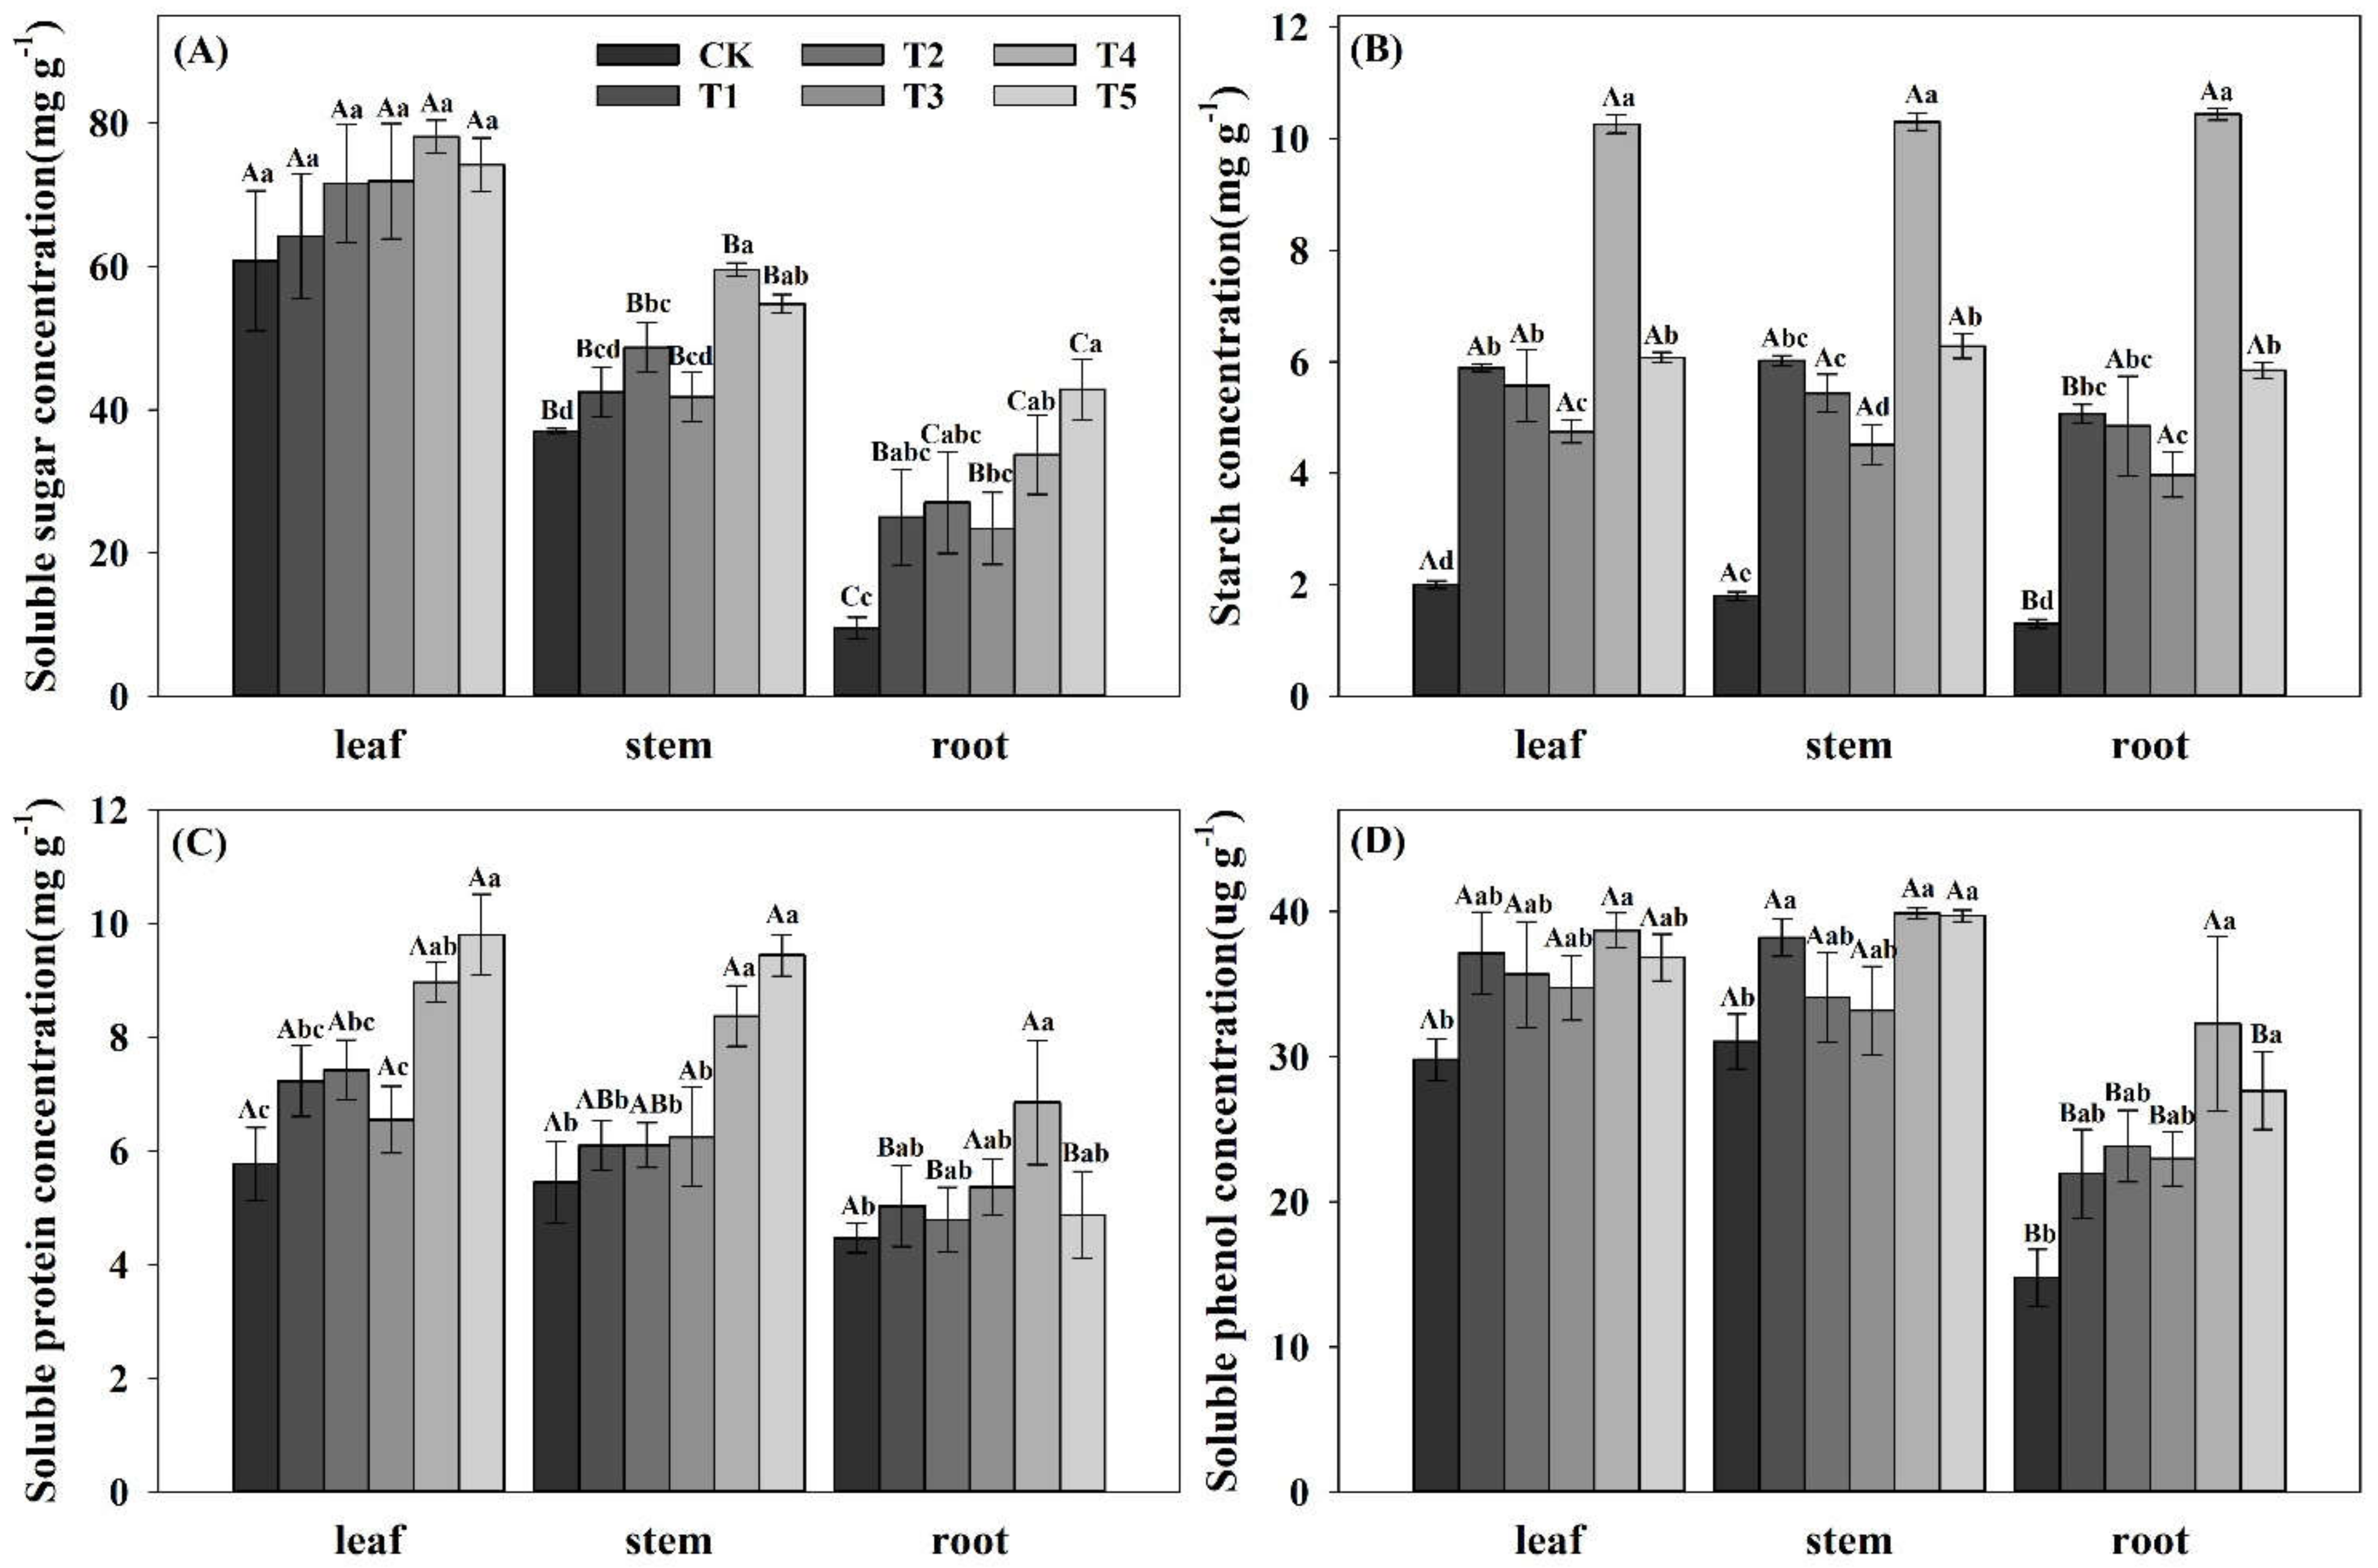
3.4. Effects of N Forms on the Accumulation of Nutrient Substances in Pecan Seedlings

In addition to the soluble sugar concentration in the leaves, the NH4+:NO3 ratios of the nutrient solution had a significant effect on the nutrient concentrations in the tissues of pecan seedlings (p < 0.05) (Figure 3). In the stems of pecan seedlings, except T1 and T3, the other NH4+:NO3 treatments significantly increased the soluble sugar concentration (p < 0.05). Among them, T4 resulted in significantly greater concentrations than T2 (p < 0.05). T4 and T5 significantly increased the soluble sugar concentrations in the roots (p < 0.05). Among them, the values under T5 were significantly greater than under T3, but there was no significant difference in the other NH4+:NO3 treatments (p < 0.05). Among the different organs of pecan seedlings, except for T1 and T3, the soluble sugar concentration in leaves was significantly greater than that in stems and roots (p < 0.05), and under the other NH4+:NO3 treatments, leaves had significantly higher concentrations than stems (p < 0.05), while stems had significantly higher concentrations than roots (p < 0.05) (Figure 3A).
In the different organs of pecan seedlings, the NH4+:NO3 treatments significantly increased the starch concentration (p < 0.05), and that under T4 was significantly greater than under the other NH4+:NO3 treatments (p < 0.05). In addition to CK and T1, the starch concentration between different organs showed no significant difference between leaves and stems and was significantly greater than that of roots (p < 0.05). There was no significant difference between the starch concentrations in the roots, stems, and leaves under the other NH4+:NO3 treatments (Figure 3B).
T4 and T5 significantly increased the soluble protein concentrations in the leaves and stems of pecan seedlings (p < 0.05), while only T4 significantly increased the soluble protein concentration in the roots (p < 0.05). There was no significant difference in the soluble protein concentration between roots, stems, and leaves of CK, T3, and T4, but for T1 and T2, the leaves had significantly higher levels than the roots (p < 0.05); for T5, there was no significant difference between the leaves and the stems, but they had significantly higher levels than the roots (p < 0.05) (Figure 3C).
The concentration of soluble phenol in leaves and stems showed a trend of first decreasing, then increasing and then decreasing with the increase of NH4+ ratio in the nutrient solution. Although the changing trend of soluble phenol in roots was inconsistent, the maximum values were reached under T4, which showed that T4 significantly increased the soluble phenol concentrations of various organs (p < 0.05). At the same time, T5 also significantly increased the soluble phenol concentration in stems and roots (p < 0.05), T1 only increased the soluble phenol concentration in stems (p < 0.05), and the other NH4+:NO3 treatments had no significant difference with CK. Among the different organs, except T4 roots, stems, and leaves, there was no significant difference in the concentrations of soluble phenol. Other NH4+:NO3 ratio treatments showed no significant difference between leaves and stems, but the levels were significantly higher than those of roots (p < 0.05) (Figure 3D). This indicates that T4 and T5 were the most beneficial in promoting the accumulation of nutrients in pecan seedlings.

3.5. Correlation Analysis of Growth Physiological Indexes of Pecan

According to Table 3, the results of the correlation analysis showed that shoot height was significantly positively correlated with starch, soluble protein, and soluble phenol concentrations in stems and starch concentrations in roots (p < 0.05). Pn had a very significant negative correlation with Ci (p < 0.01), and a significant positive correlation with Gs, chlorophyll b, and lutein (p < 0.05). The total chlorophyll concentration was extremely significantly positively correlated with chlorophyll a, chlorophyll b, and lutein (p < 0.01), but was significantly negatively correlated with the leaf soluble sugar concentration (p < 0.05). The soluble sugar, starch, soluble protein, and soluble phenol concentrations of each organ showed a positive correlation with the total concentration, and most of them showed significant (p < 0.05) and extremely significant (p < 0.01) differences.

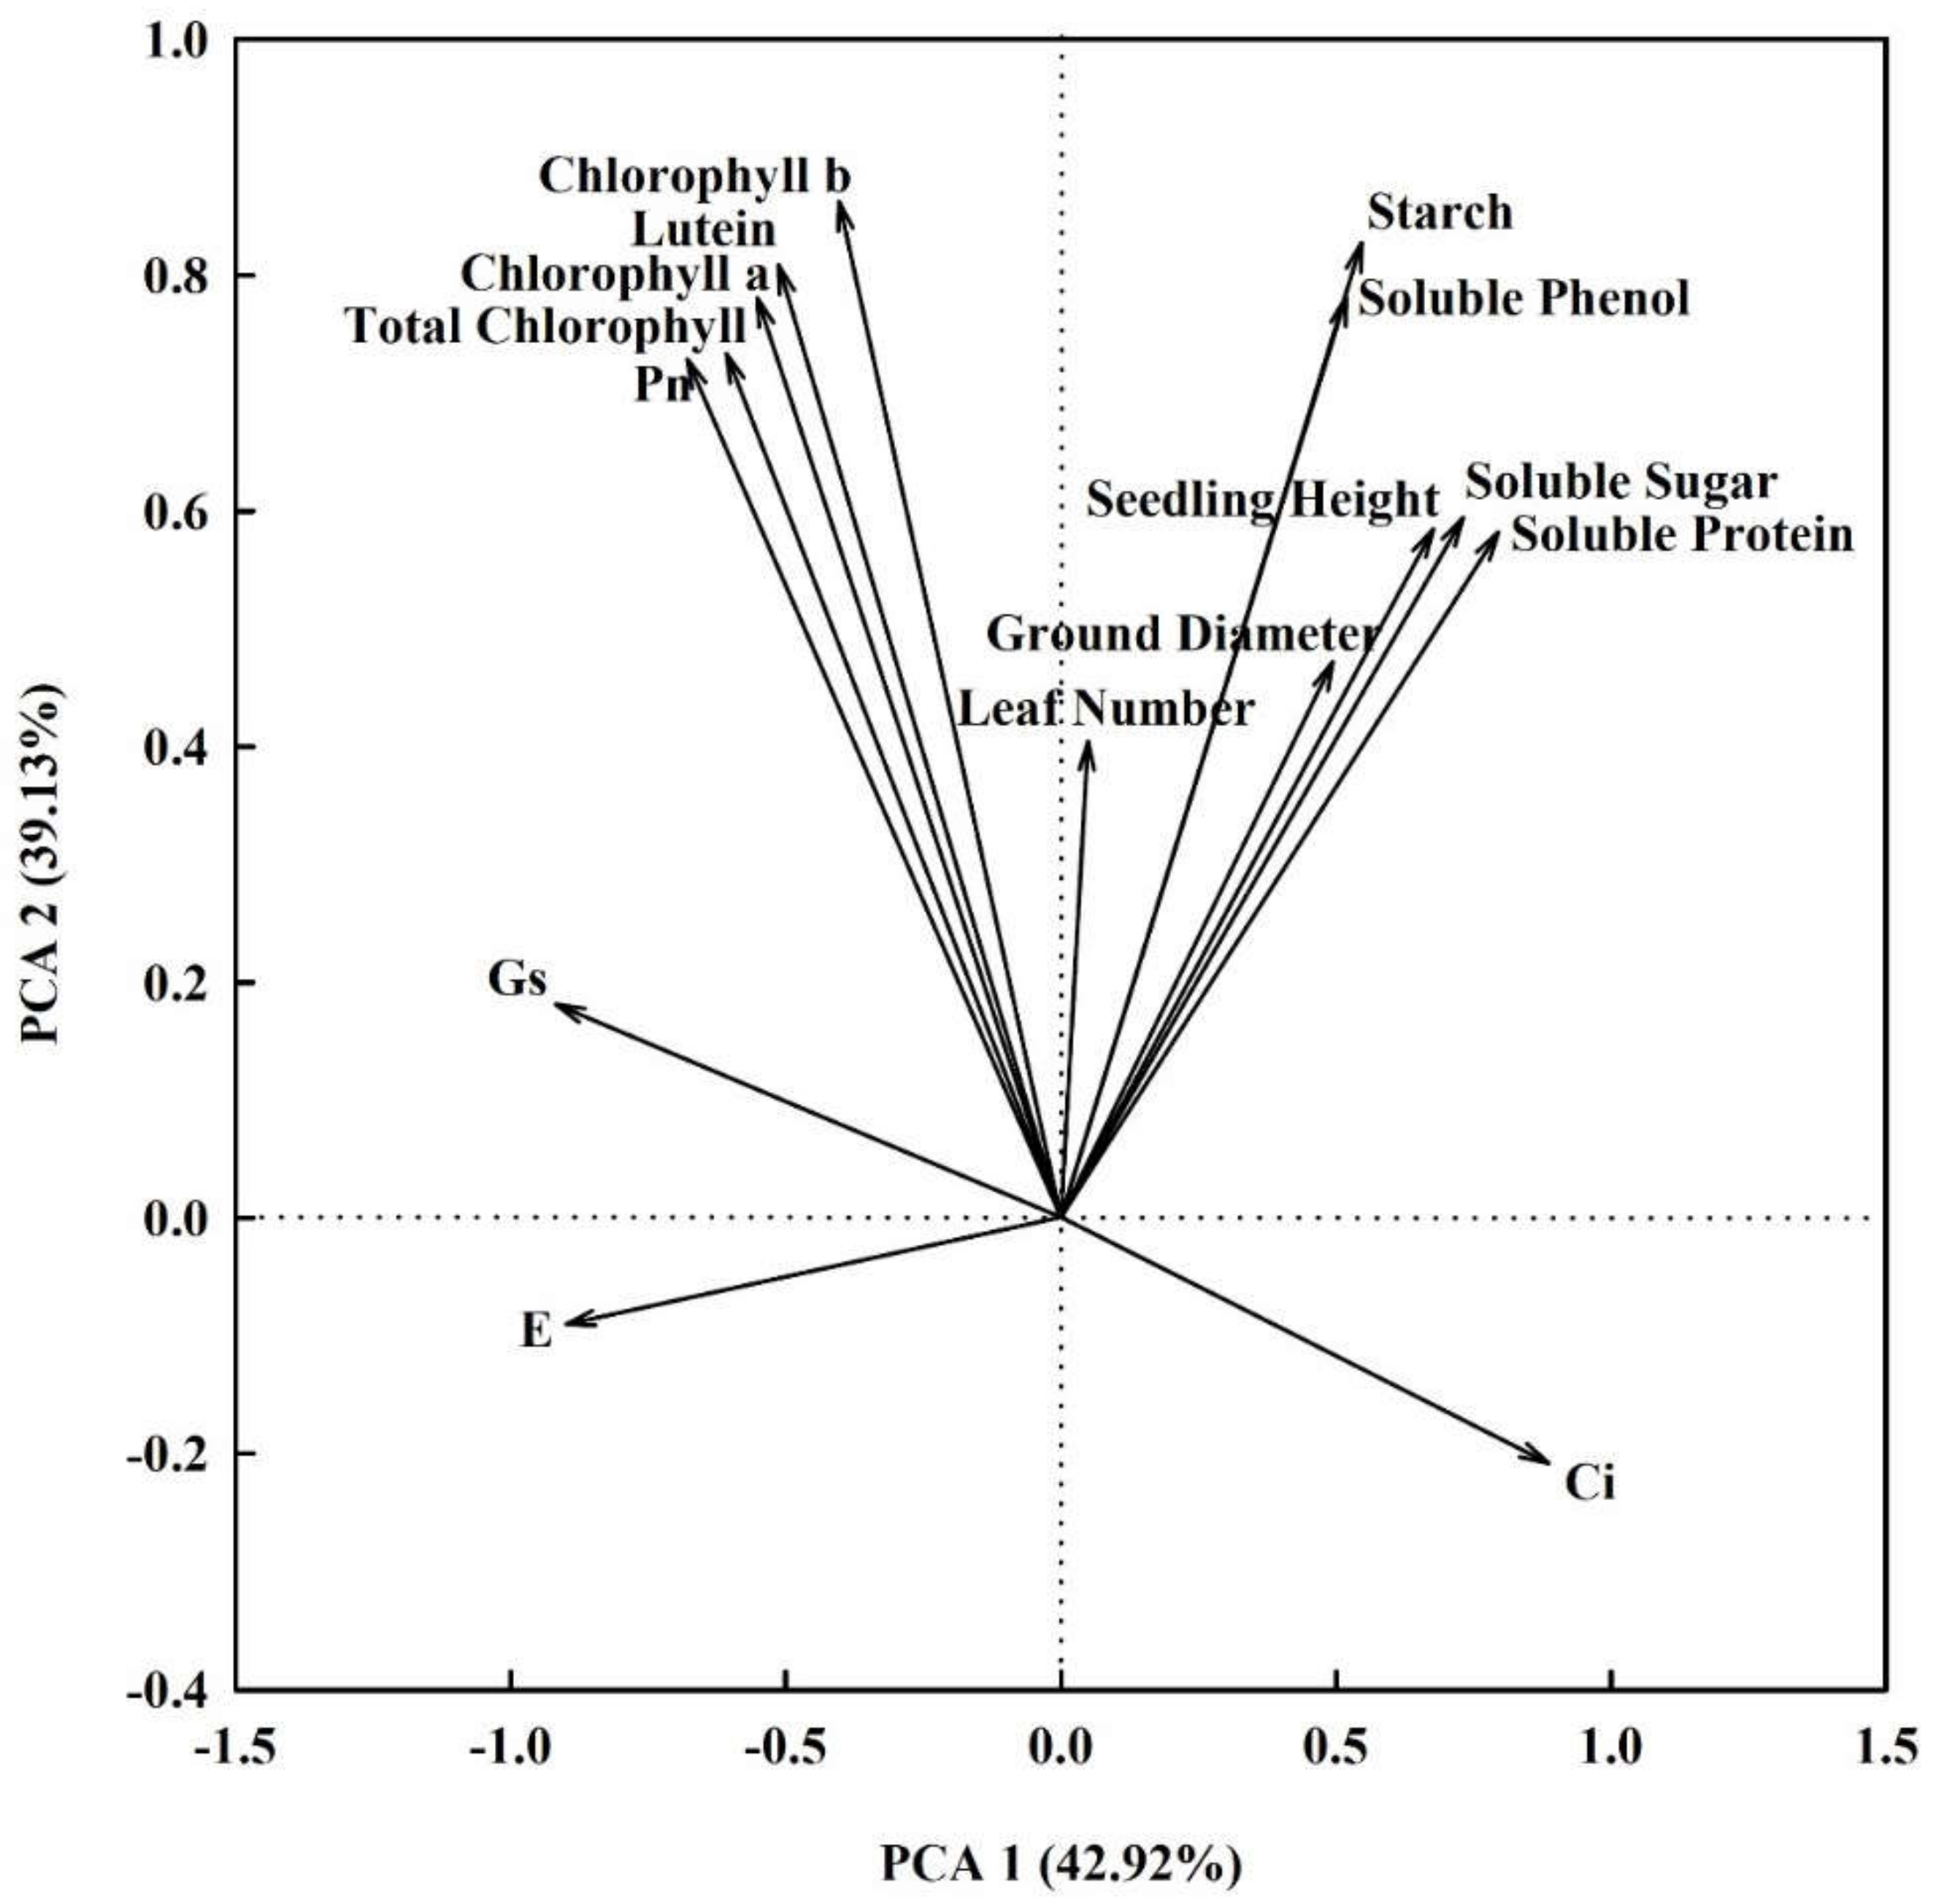
3.6. Comprehensive Evaluation of Photosynthesis and Growth of Pecan

In order to objectively evaluate the effects of the five NH4+:NO3 treatments on the photosynthetic capacity, growth, and development of pecan seedlings, a principal component analysis was carried out on 15 physiological growth traits, and the two principal components with the largest characteristic values were extracted. The characteristic values of the first and second principal components were 6.438 and 5.870, respectively, and the cumulative contribution rate of the two principal components was 82.051% (Table 4), indicating that the common factor can contain 82.051% of the original data information without losing variables. The factor loadings of the first and second principal components were performed on the X-axis and Y-axis, respectively (Figure 4). In the first principal component, the indexes with higher load (>0.7) were Gs, E, Ci, soluble protein, and soluble sugar, indicating that these were the main factors determining the first principal component. In the second principal component, the indicators with larger load (>0.7) were chlorophyll b, soluble phenol, lutein, starch, total chlorophyll, and Pn, which were the main factors determining the second principal component. The contribution rates of principal components were weight, and the comprehensive scores under different NH4+:NO3 treatments were calculated, and then were ranked (Table 5). The results showed that the comprehensive scores of the different treatments were T4 > T5 > T2 > T1 > T3 > CK. Except for T4 and T5, the scores of all other treatments were negative, indicating that T4 and T5 had a better promoting effect on the photosynthetic capacity and growth and development of pecan seedlings than did the other treatments.

4. Discussion

4.1. Growth of Pecan Seedlings under Different NH4+:NO3 Ratios

The nutritional growth of plants is influenced by many intrinsic and extrinsic factors, and productivity can be effectively increased by changing some of them [35,36]. Numerous studies have demonstrated that exogenous N addition is one of the most effective ways to increase productivity [37,38], and the results of this work were consistent with the fact that N addition to the nutrient solution increased the growth of pecan to varying degrees compared to the N deficiency treatment (Figure 1B,D).
However, the relative dominance of NH4+–N and NO3–N as the main forms of inorganic N uptake by higher plants has been controversial for different plants and physiological processes [15]. According to the theory that acid-loving plants prefer to take up NH4+–N, pecan should grow better under treatments dominated by NH4+–N. Our results were not identical, with only a significant increase in seedling height (p < 0.01) under the T4 treatment (Figure 1B). Instead, ground diameter increased significantly (p < 0.05) with NO3–N as the sole N source (Figure 1D), consistent with studies on tomato (Lycopersicon esculentum Miller) [39], and this may have been caused by the culture method, since NO3–N is considered as the main form of N available to rainfed crops [40]. While direct uptake of NH4+ could theoretically reduce energy consumption, the specificity of the assimilation site of NO3 in the plant makes it more energy-available, leading to greater biomass and yield [41].
Previous studies have shown that even though some plants are tolerant to NH4+–N, they are still susceptible to toxicity to varying degrees when NH4+–N is the only N source [17]. In contrast, the growth of pecan in this experiment under sole NH4+–N was not significantly different from that under the N deficiency treatment (Figure 1B,D), and we considered that the poisoning was caused by the ammonium salts, but the poisoning was not significant; however, it could also be that the N deficiency treatment was short, and the N stored in the plant was sufficient to supply the plant’s needs. In addition, the experimental results showed a significant increase in the leaf number of T4-treated pecan seedlings (Figure 1E), which was consistent with the findings of Zhang et al. [42].

4.2. Photosynthetic Capacity of Pecan Seedlings under Different NH4+:NO3 Ratios

Photosynthesis in plants is a very complex photochemical and biochemical process that can be used to reflect plant development, and Pn, Gs, E, Ci, and leaf pigment contents can directly or indirectly indicate the photosynthetic capacity of plants [43]. In the present study, there was a significant positive correlation between Pn and chlorophyll b and lutein (p < 0.05) (Table 3), indicating that the photosynthetic rate of the plant increased with plant pigmentation, which is consistent with previous study results [44].
Proper N fertilization promotes photosynthesis in plants [45], while the N form also affects the consumption of ATP and NADPH produced by the photosynthetic system of plants [23]. The results of this work showed that different NH4+:NO3 ratio treatments increased the leaf pigment content as well as Pn to some extent, compared with the N deficiency treatment, with the T1 treatment having the most significant effects (p < 0.05) (Table 2, Figure 2A–D). Ci, which was highly significantly negatively correlated with Pn, was significantly lower under the T1 treatment than the other treatments (Table 2 and Table 3). This suggests that the photosynthetic capacity of pecan seedlings is strongest when NO3 is used as the sole N source, which was consistent with previous study results [39], suggesting that the increase in photosynthetic rate appears to be driven by changes in the plant–water relationship when NO3 concentrations were higher. However, there are many different views, and studies by Zhang et al. showed that NH4+–N-dominated N fertilization mixes most strongly promote photosynthesis [46], but the discrepancies may be due to species differences. In addition, the photosynthetic rate of plants was significantly inhibited when NH4+ was the only N source (Table 2), and leaf development was directly and negatively affected, which was consistent with the findings of Cruz et al. [47].

4.3. Nutrient Accumulation in Pecan Seedlings under Different NH4+:NO3 Ratios

The N form affects plant nutrient consumption and accumulation [48]. During the plant life cycle, seed germination and seedling growth are dependent on in vivo stores of soluble sugars (sucrose, glucose, and fructose), which are transformed to each other in various plant organs and are necessary for cell growth and maintenance of osmotic homeostasis [49]. In the present study, we found that the N form did not affect the distribution of soluble sugars in the organs of pecan seedlings, with most soluble sugars stored in leaves. However, the treatment dominated by NH4+ significantly increased soluble sugars in stems and roots (p < 0.05) (Figure 3A), indicating that pecan seedlings grew better with increasing NH4+ in the nutrient solution. This is in agreement with previous studies, where Yusuf and Deepa found that using NH4+ as the sole N source significantly increased soluble sugar content [50], while Petropoulos et al. showed that soluble sugar contents were highest when the NH4+:NO3 ratio was 75:25 [51].
Starch is the most widespread and abundant storage carbohydrate in plants and is insoluble glucose that is interconvertible with soluble sugars [52]. In this experiment, starch was equally distributed among the organs, and all NH4+:NO3 ratios significantly increased the starch content of each organ, with NH4+ being the dominant promoter (p < 0.05) (Figure 3B). The study by Poucet et al. [53] showed a significant increase in the starch content of tomatoes when NH4+ was used as the sole N source. However, we found that the promoting effect was significantly reduced when NH4+ was the sole N source, probably because of the high content of NH4+, which has to be converted into organic compounds before it can complete its self-detoxification, a process that may lead to nutrient depletion [23].
Proteins are one of the basic substances that make up plant cells, and soluble proteins refer to those that can be soluble in water or other solvents in a small molecular state and are usually used as important indicators in plant physiological experiments [54]. We found that the distribution of the soluble protein contents among organs in pecan was as follows: leaves > stems > roots (Figure 3C), which was consistent with the study of flowering Chinese cabbage (Brassica campestris L. ssp. chinensis var. utilis Tsen et Lee) [21]. The results of previous studies on the effect of N form on soluble protein content varied. Xun et al. showed that NH4+–N increased soluble protein in roots and leaves [55], while Zhu et al. found that the treatment dominated by NH4+ reduced leaf soluble protein instead [56]. In this experiment, the T4 and T5 treatments significantly increased the soluble protein in each organ (p < 0.05) (Figure 3C). Soluble proteins increase under the conditions of external environmental stress, resulting in increased plant adaptation and thus stress mitigation [57]. Therefore, the increase in soluble protein content of leaves and stems when NH4+ is the sole source of N is likely to be a detoxification mechanism for plant resistance to ammonium toxicity.
A large number of phenolic compounds present in plants as secondary metabolites are commonly referred to as phenolics [58]. These compounds consist of simple phenols, benzoic and cinnamic acids, coumarins, tannins, lignans, lignans, and flavonoids [59]. Among them, lignin provides mechanical strength to plants and has a significant protective function [60]. However, there are limited studies on the effect of N form on plant-soluble phenolic contents, and Petropoulos et al. showed that the highest content of total phenolic compounds occurred at the NH4+:NO3 ratio of 25:75 [51]. However, we found that the dominance of NH4+ significantly increased the soluble phenolic contents in all organs, especially in roots (p < 0.05) (Figure 3D).

5. Conclusions

In this study, we found that not only the N concentration but also the balance between NH4+–N and NO3–N affected the growth and development of pecans. We found that addition of different N forms promoted the growth and development of pecan seedlings in different ways and with different intensities. Among them, using NO3–N as the only N source significantly promoted the ground diameter growth of pecan and increased the leaf pigment content and photosynthetic rate. The NH4+:NO3 ratio of 75:25 and NH4+–N as the sole N source significantly increased the soluble sugar in stems and roots, starch in leaves, stems and roots, soluble protein in leaves and stems, and soluble phenols in stems and roots. Additionally, the NH4+:NO3 ratio of 75:25 promoted increases in the plant height, leaf number, root soluble protein, and leaf soluble phenol contents. In conclusion, regarding the physiological aspects of pecan growth, pecans are more inclined to use NH4+–N. Considering that the NH4+–N as the only N source may lead to nutrient imbalance or even toxicity, the NH4+:NO3 ratio of 75:25 is the most favorable for the growth and development of pecan seedlings.

Author Contributions

F.P. conceived and designed the study. M.C. collected experimental data, analyzed, and wrote the manuscript. M.C., J.L. and G.C. participated in collection of samples. M.C., J.X. and X.Y. performed the experiments. P.T. and K.Z. provided help in data analysis and improving the manuscript. All authors have read and agreed to the published version of the manuscript.

Funding

This research was funded by a grant from the National Key R&D Program of China (2018YFD1000604).

Conflicts of Interest

The authors declare no conflict of interest.

References

  1. Li, S.-X.; Wang, Z.-H.; Stewart, B.A. Responses of Crop Plants to Ammonium and Nitrate N. In Advances in Agronomy; Sparks, D.L., Ed.; Academic Press: Cambridge, MA, USA, 2013; Volume 118, pp. 205–397. [Google Scholar]
  2. Xu, G.; Fan, X.; Miller, A.J. Plant nitrogen assimilation and use efficiency. Annu. Rev. Plant Biol. 2012, 63, 153–182. [Google Scholar] [CrossRef] [PubMed] [Green Version]
  3. Bittsánszky, A.; Pilinszky, K.; Gyulai, G.; Komives, T. Overcoming ammonium toxicity. Plant Sci. 2015, 231, 184–190. [Google Scholar] [CrossRef] [PubMed]
  4. Raza, A.; Asghar, M.A.; Hussain, S.; Bin, C.; Shafiq, I.; Ahmad, I.; Ghafoor, A.; Karim, H.; Iqbal, T.; Yang, W.; et al. Optimal NH4+/NO3 ratios enhance the shade tolerance of soybean seedlings under low light conditions. Plant Biol. 2021, 23, 464–472. [Google Scholar] [CrossRef] [PubMed]
  5. Wang, Y.; Hasbullah, H.; Setia, R.; Marschner, P.; Zhang, F. Potential soil P mobilisation capacity–method development and comparison of rhizosphere soil from different crops. Plant Soil 2011, 354, 259–267. [Google Scholar] [CrossRef]
  6. Daryanto, S.; Wang, L.; Gilhooly, W.P.; Jacinthe, P.-A. Nitrogen preference across generations under changing ammonium nitrate ratios. J. Plant Ecol. 2019, 12, 235–244. [Google Scholar] [CrossRef]
  7. Yenigün, O.; Demirel, B. Ammonia inhibition in anaerobic digestion: A review. Process Biochem. 2013, 48, 901–911. [Google Scholar] [CrossRef]
  8. Mokhele, B.; Zhan, X.; Yang, G.; Zhang, X. Review: Nitrogen assimilation in crop plants and its affecting factors. Can. J. Plant Sci. 2012, 92, 399–405. [Google Scholar] [CrossRef]
  9. Cheng, W.; Sakai, H.; Yagi, K.; Hasegawa, T. Combined effects of elevated CO2 and high night temperature on carbon assimilation, nitrogen absorption, and the allocations of C and N by rice (Oryza sativa L.). Agric. For. Meteorol. 2010, 150, 1174–1181. [Google Scholar] [CrossRef]
  10. Zhang, H.H.; Liu, H.F.; Li, Z.; Ding, H.F.; Xue, Z.X.; Zhao, F.Y.; Yu, S.L.; Yu, K. Effects of temperature and nitrogen application on photosynthetic characteristics and the absorption and distribution of carbon and nitrogen in apple plants. Photosynthetica 2021, 59, 538–546. [Google Scholar] [CrossRef]
  11. Urlić, B.; Jukić Špika, M.; Becker, C.; Kläring, H.-P.; Krumbein, A.; Goreta Ban, S.; Schwarz, D. Effect of NO3 and NH4 concentrations in nutrient solution on yield and nitrate concentration in seasonally grown leaf lettuce. Acta Agric. Scand. Sect. B Soil Plant Sci. 2017, 67, 748–757. [Google Scholar] [CrossRef]
  12. Ohyama, T. Nitrogen as a Major Essential Element of Plants. In Nitrogen Assimilation in Plants; Takuji, O., Kuni, S., Eds.; Research Signpost: Kerala, India, 2010; pp. 1–18. ISBN 9788130804064. [Google Scholar]
  13. Quaggio, J.A.; Souza, T.R.; Bachiega Zambrosi, F.C.; Marcelli Boaretto, R.; Mattos, D., Jr. Nitrogen-fertilizer forms affect the nitrogen-use efficiency in fertigated citrus groves. J. Plant Nutr. Soil Sci. 2014, 177, 404–411. [Google Scholar] [CrossRef]
  14. Epron, D.; Koutika, L.-S.; Tchichelle, S.V.; Bouillet, J.-P.; Mareschal, L. Uptake of soil mineral nitrogen by Acacia mangium and Eucalyptus urophylla × grandis: No difference in N form preference. J. Plant Nutr. Soil Sci. 2016, 179, 726–732. [Google Scholar] [CrossRef]
  15. Boussadia, O.; Steppe, K.; Zgallai, H.; Ben El Hadj, S.; Braham, M.; Lemeur, R.; Van Labeke, M.C. Effects of nitrogen deficiency on leaf photosynthesis, carbohydrate status and biomass production in two olive cultivars ‘Meski’ and ‘Koroneiki’. Sci. Hortic. 2010, 123, 336–342. [Google Scholar] [CrossRef]
  16. Leghari, S.J.; Wahocho, N.; Laghari, G.; Laghari, A.; Bhabhan, G.; HussainTalpur, K.; Ahmed, T.; Wahocho, S.; Lashari, A. Role of nitrogen for plant growth and development: A review. Adv. Environ. Biol. 2016, 10, 209–218. [Google Scholar]
  17. Britto, D.T.; Kronzucker, H.J. NH4+ toxicity in higher plants: A critical review. J. Plant Physiol. 2002, 159, 567–584. [Google Scholar] [CrossRef] [Green Version]
  18. Coskun, D.; Britto, D.T.; Li, M.; Becker, A.; Kronzucker, H.J. Rapid ammonia gas transport accounts for futile transmembrane cycling under NH3/NH4+ toxicity in plant roots. Plant Physiol. 2013, 163, 1859–1867. [Google Scholar] [CrossRef] [Green Version]
  19. Hachiya, T.; Watanabe, C.K.; Fujimoto, M.; Ishikawa, T.; Takahara, K.; Kawai-Yamada, M.; Uchimiya, H.; Uesono, Y.; Terashima, I.; Noguchi, K. Nitrate addition alleviates ammonium toxicity without lessening ammonium accumulation, organic acid depletion and inorganic cation depletion in Arabidopsis thaliana shoots. Plant Cell Physiol. 2012, 53, 577–591. [Google Scholar] [CrossRef]
  20. Serna, M.D.; Borras, R.; Legaz, F.; Primo-Millo, E. The influence of nitrogen concentration and ammonium/nitrate ratio on N-uptake, mineral composition and yield of citrus. Plant Soil 1992, 147, 13–23. [Google Scholar] [CrossRef]
  21. Zhu, Y.; Qi, B.; Hao, Y.; Liu, H.; Sun, G.; Chen, R.; Song, S. Appropriate NH4+/NO3 ratio triggers plant growth and nutrient uptake of flowering Chinese cabbage by optimizing the pH value of nutrient solution. Front. Plant Sci. 2021, 12, 656144. [Google Scholar] [CrossRef]
  22. Guo, J.; Jia, Y.; Chen, H.; Zhang, L.; Yang, J.; Zhang, J.; Hu, X.; Ye, X.; Li, Y.; Zhou, Y. Growth, photosynthesis, and nutrient uptake in wheat are affected by differences in nitrogen levels and forms and potassium supply. Sci. Rep. 2019, 9, 1248. [Google Scholar] [CrossRef] [Green Version]
  23. Guo, S.; Zhou, Y.; Shen, Q.; Zhang, F. Effect of ammonium and nitrate nutrition on some physiological processes in higher plants—Growth, photosynthesis, photorespiration, and water relations. Plant Biol. 2007, 9, 21–29. [Google Scholar] [CrossRef]
  24. Nicodemus, M.A.; Salifu, F.K.; Jacobs, D.F. Growth, nutrition, and photosynthetic response of black walnut to varying nitrogen sources and rates. J. Plant Nutr. 2008, 31, 1917–1936. [Google Scholar] [CrossRef]
  25. Qin, J.; Yue, X.; Ling, Y.; Zhou, Y.; Li, N.; Shang, X.; Fang, S. Nitrogen form and ratio impact phenolic accumulation and relative gene expression in Cyclocarya paliurus. Trees 2021, 35, 685–696. [Google Scholar] [CrossRef]
  26. Tabatabaei, S.J.; Yusefi, M.; Hajiloo, J. Effects of shading and NO3:NH4 ratio on the yield, quality and N metabolism in strawberry. Sci. Hortic. 2008, 116, 264–272. [Google Scholar] [CrossRef]
  27. Mo, Z.; He, H.; Su, W.; Peng, F. Analysis of differentially accumulated proteins associated with graft union formation in pecan (Carya illinoensis). Sci. Hortic. 2017, 224, 126–134. [Google Scholar] [CrossRef]
  28. Zhang, R.; Peng, F.; Li, Y. Pecan production in China. Sci. Hortic. 2015, 197, 719–727. [Google Scholar] [CrossRef]
  29. Zhu, K.; Fan, P.; Mo, Z.; Tan, P.; Feng, G.; Li, F.; Peng, F. Identification, eexpression and co-expression analysis of R2R3-MYB family genes involved in graft union formation in pecan (Carya illinoinensis). Forests 2020, 11, 917. [Google Scholar] [CrossRef]
  30. Smith, M.W.; Wood, B.W.; Raun, W.R. Recovery and partitioning of nitrogen from early spring and midsummer applications to pecan trees. J. Am. Soc. Hortic. Sci. 2007, 132, 758–763. [Google Scholar] [CrossRef] [Green Version]
  31. Kim, T.; Mills, H.A.; Wetzstein, H.Y. Studies on effects of nitrogen form on growth, development, and nutrient uptake in pecan. J. Plant Nutr. 2002, 25, 497–508. [Google Scholar] [CrossRef]
  32. Liu, G.; Huang, J.; Pan, C.; Wang, Z.; Zheng, B.; Jin, S. Analysis of nitrogen nutrient status of hickory seedlings based on reflection spectroscopy. For. Sci. China 2011, 47, 165–171. [Google Scholar] [CrossRef]
  33. Lichtenthaler, H.K. Chlorophylls and Carotenoids: Pigments of Photosynthetic Biomembranes. In Methods in Enzymology: Plant Cell Membranes; Academic Press: Cambridge, MA, USA, 1987; Volume 148, pp. 350–382. [Google Scholar]
  34. Rahmani, M.; Atia, G.K. Coherence pursuit: Fast, simple, and robust principal component analysis. IEEE Trans. Signal. Process. 2017, 65, 6260–6275. [Google Scholar] [CrossRef]
  35. Adams, S.R.; Cockshull, K.E.; Cave, C.R.J. Effect of temperature on the growth and development of tomato fruits. Ann. Bot. 2001, 88, 869–877. [Google Scholar] [CrossRef]
  36. Roba, T.B. Review on: The effect of mixing organic and inorganic fertilizer on productivity and soil fertility. Open Access Libr. J. 2018, 5, 1–11. [Google Scholar] [CrossRef]
  37. Wen, Z.; Shen, J.; Blackwell, M.; Li, H.; Zhao, B.; Yuan, H. Combined applications of nitrogen and phosphorus fertilizers with manure increase maize yield and nutrient uptake via stimulating root growth in a long-term experiment. Pedosphere 2016, 26, 62–73. [Google Scholar] [CrossRef]
  38. Negrini, A.C.A.; Evans, J.R.; Kaiser, B.N.; Millar, A.H.; Kariyawasam, B.C.; Atkin, O.K.; Negrini, A.C.A.; Evans, J.R.; Kaiser, B.N.; Millar, A.H.; et al. Effect of N supply on the carbon economy of barley when accounting for plant size. Funct. Plant Biol. 2020, 47, 368–381. [Google Scholar] [CrossRef]
  39. Li, J.; Zhou, J.; Duan, Z. Effects of elevated CO2 concentration on growth and water usage of tomato seedlings under different ammonium/nitrate ratios. J. Environ. Sci. 2007, 19, 1100–1107. [Google Scholar] [CrossRef]
  40. Hageman, R.H. Ammonium versus Nitrate Nutrition of Higher Plants. In Nitrogen in Crop Production; Roland, D.H., Ed.; ASA-CSSA-SSSA: Madison, WI, USA, 1984; pp. 67–85. [Google Scholar] [CrossRef]
  41. Raven, J.A.; Wollenweber, B.; Handley, L.L. A comparison of ammonium and nitrate as nitrogen sources for photolithotrophs. New Phytol. 1992, 121, 19–32. [Google Scholar] [CrossRef]
  42. Zhang, Y.; Tian, J.-P.; Cui, J.; Hong, Y.-H.; Luan, Y.-S. Effects of different NH4+/NO3 ratios on the photosynthetic and physiology responses of blueberry (Vaccinium spp.) seedlings growth. J. Plant Nutr. 2021, 44, 854–864. [Google Scholar] [CrossRef]
  43. Gaastra, P. Photosynthesis of Crop Plants as Influenced by Light, Carbon Dioxide, Temperature, and Stomatal Diffusion Resistance. Ph.D. Thesis, Wageningen University, Wageningen, The Netherlands, 1959. [Google Scholar]
  44. Bassi, D.; Menossi, M.; Mattiello, L. Nitrogen supply influences photosynthesis establishment along the sugarcane leaf. Sci. Rep. 2018, 8, 2327. [Google Scholar] [CrossRef] [Green Version]
  45. Liang, X.; Zhang, T.; Lu, X.; Ellsworth, D.S.; BassiriRad, H.; You, C.; Wang, D.; He, P.; Deng, Q.; Liu, H.; et al. Global response patterns of plant photosynthesis to nitrogen addition: A meta-analysis. Glob. Change Biol. 2020, 26, 3585–3600. [Google Scholar] [CrossRef]
  46. Zhang, X.; Wang, H.; Hui, X.; Wang, Z.; Liu, J. Effects of different fertilization and fallowing practices on soil carbon and nitrogen mineralization in a dryland soil with low organic matter. J. Soil Sci. Plant Nutr. 2019, 19, 108–116. [Google Scholar] [CrossRef]
  47. Cruz, J.L.; Alves, A.A.C.; LeCain, D.R.; Ellis, D.D.; Morgan, J.A. Effect of elevated CO2 concentration and nitrate: Ammonium ratios on gas exchange and growth of cassava (Manihot esculenta Crantz). Plant Soil 2014, 374, 33–43. [Google Scholar] [CrossRef]
  48. Zhu, Y.; Li, G.; Liu, H.; Sun, G.; Chen, R.; Song, S. Effects of partial replacement of nitrate with different nitrogen forms on the yield, quality and nitrate content of Chinese kale. Commun. Soil Sci. Plant Anal. 2018, 49, 1384–1393. [Google Scholar] [CrossRef]
  49. Rosa, M.; Prado, C.; Podazza, G.; Interdonato, R.; González, J.A.; Hilal, M.; Prado, F.E. Soluble sugars—metabolism, sensing and abiotic stress. Plant Signal. Behav. 2009, 4, 388–393. [Google Scholar] [CrossRef] [Green Version]
  50. Yusuf, A.; Deepa, P. Influence of N nutrients on GS activity and putative ammonium transporter1;2 (SaAMT1;2) expression in sandal plants (Santalum album L.). Trees 2017, 31, 1773–1784. [Google Scholar] [CrossRef]
  51. Petropoulos, S.A.; Fernandes, Â.; Calhelha, R.C.; Di Gioia, F.; Kolovou, P.; Barros, L.; Ferreira, I.C.F.R. Chemical composition and bioactive properties of Cichorium spinosum L. in relation to nitrate/ammonium nitrogen ratio. J. Sci. Food Agric. 2019, 99, 6741–6750. [Google Scholar] [CrossRef] [Green Version]
  52. Pfister, B.; Zeeman, S.C. Formation of starch in plant cells. Cell Mol. Life Sci. 2016, 73, 2781–2807. [Google Scholar] [CrossRef] [Green Version]
  53. Poucet, T.; González-Moro, M.B.; Cabasson, C.; Beauvoit, B.; Gibon, Y.; Dieuaide-Noubhani, M.; Marino, D. Ammonium supply induces differential metabolic adaptive responses in tomato according to leaf phenological stage. J. Exp. Bot. 2021, 72, 3185–3199. [Google Scholar] [CrossRef]
  54. Deans, C.A.; Behmer, S.T.; Fiene, J.; Sword, G.A. Spatio-temporal, genotypic, and environmental effects on plant soluble protein and digestible carbohydrate content: Implications for insect herbivores with cotton as an exemplar. J. Chem. Ecol. 2016, 42, 1151–1163. [Google Scholar] [CrossRef]
  55. Xun, Z.; Guo, X.; Li, Y.; Wen, X.; Wang, C.; Wang, Y. Quantitative proteomics analysis of tomato growth inhibition by ammonium nitrogen. Plant Physiol. Biochem. 2020, 154, 129–141. [Google Scholar] [CrossRef]
  56. Zhu, Z.-B.; Yu, M.-M.; Chen, Y.-H.; Guo, Q.-S.; Zhang, L.-X.; Shi, H.-Z.; Liu, L. Effects of ammonium to nitrate ratio on growth, nitrogen metabolism, photosynthetic efficiency and bioactive phytochemical production of Prunella vulgaris. Pharm. Biol. 2014, 52, 1518–1525. [Google Scholar] [CrossRef] [Green Version]
  57. Guan, G.-F.; Wang, Y.-S.; Cheng, H.; Jiang, Z.-Y.; Fei, J. Physiological and biochemical response to drought stress in the leaves of Aegiceras corniculatum and Kandelia obovata. Ecotoxicology 2015, 24, 1668–1676. [Google Scholar] [CrossRef]
  58. Bravo, L. Polyphenols: Chemistry, dietary sources, metabolism, and nutritional significance. Nutr. Rev. 1998, 56, 317–333. [Google Scholar] [CrossRef]
  59. Khoddami, A.; Wilkes, M.; Roberts, T. Techniques for analysis of plant phenolic compounds. Molecules 2013, 18, 2328–2375. [Google Scholar] [CrossRef]
  60. Liu, Q.; Luo, L.; Zheng, L. Lignins: Biosynthesis and biological functions in plants. Int. J. Mol. Sci. 2018, 19, 335. [Google Scholar] [CrossRef] [Green Version]
Figure 1. Differences of seedling height, ground diameter, and leaf number of pecan seedlings under varying NH4+:NO3 ratios. Changes in seedling height of pecan seedlings over time under varying NH4+:NO3 ratios (A). Relative growth of seedling height of pecan seedlings under varying NH4+:NO3 ratios (B). Changes in ground diameter of pecan seedlings over time under varying NH4+:NO3 ratios (C). Relative growth of ground diameter of pecan seedlings under varying NH4+:NO3 ratios (D). Changes in leaf number of pecan seedlings over time under varying NH4+:NO3 ratios (E). Uppercase letters indicate differences between NH4+:NO3 ratio treatments, at p < 0.05.
Forests 12 01808 g001
Figure 2. Differences of chlorophyll a, chlorophyll b, total chlorophyll, and lutein concentration of pecan seedlings under varying NH4+:NO3 ratios. Chlorophyll a concentration of pecan seedlings under varying NH4+:NO3 ratios (A). Chlorophyll b concentration of pecan seedlings under varying NH4+:NO3 ratios (B). Total chlorophyll concentration of pecan seedlings under varying NH4+:NO3 ratios (C). Lutein concentration of pecan seedlings under varying NH4+:NO3 ratios (D). Uppercase letters indicate differences between NH4+:NO3 ratio treatments, at p < 0.05.
Forests 12 01808 g002
Figure 3. Differences of soluble sugar, starch, soluble protein, and soluble phenol concentrations of pecan seedlings under varying NH4+:NO3 ratios. Soluble sugar concentrations in leaves, stems and roots of pecan seedlings under varying NH4+:NO3 ratios (A). Starch concentrations in leaves, stems and roots of pecan seedlings under varying NH4+:NO3 ratios (B). Soluble protein concentrations in leaves, stems and roots of pecan seedlings under varying NH4+:NO3 ratios (C). Soluble phenol concentrations in leaves, stems and roots of pecan seedlings under varying NH4+:NO3 ratios (D). Uppercase letters indicate differences between NH4+:NO3 treatments, and lowercase letters indicate differences between organs, at p < 0.05.
Forests 12 01808 g003
Figure 4. Factor loads of PCA. The soluble sugar, starch, soluble protein, and soluble phenol in the figure represent the total concentration of roots, stems and leaves.
Forests 12 01808 g004
Table 1. Composition of the nutrient solution under different NH4+:NO3 ratio treatments.
Nutrient
Source
Treatment
CKT1T2T3T4T5
Ca(H2PO4)2(mM)0.50.50.50.50.50.5
K2SO4(mM)111111
MgSO4(mM)0.50.50.50.50.50.5
ZnSO4(μM)111111
H3BO3(μM)12.512.512.512.512.512.5
MnSO4(μM)111111
CuSO4(μM)0.250.250.250.250.250.25
EDTA-Fe(μM)101010101010
DCD(μM)777777
(Na)6Mo7O24(μM)0.10.10.10.10.10.1
CaCl2(mM)1.251.251.251.251.251.25
(NH4)2SO4(mM)000.250.50.751
Ca(NO3)2(mM)010.750.50.250
Table 2. Differences of Ci (internal CO2 concentration), E (transportation rate), Gs (stomatal conductance) and Pn (photosynthesis rate) of pecan seedlings under varying NH4+:NO3 ratios. Uppercase letters indicate differences between NH4+:NO3 ratio treatments, at p < 0.05.
TreatmentCi (ppm)E (mmol m−2 s−1)Gs (mmol m−2 s−1)Pn (μmol m−2 s−1)
CK453.33 ± 29.95 AB0.68 ± 0.1357.25 ± 13.292.93 ± 1.03 B
T1310.00 ± 35.68 B0.70 ± 0.1368.00 ± 10.6511.00 ± 1.40 A
T2455.50 ± 60.19 AB0.68 ± 0.1464.25 ± 12.635.7 ± 0.84 AB
T3409.00 ± 50.42 AB0.73 ± 0.0872.00 ± 9.908.25 ± 2.00 AB
T4470.67 ± 62.41 AB0.58 ± 0.0554.50 ± 2.536.57 ± 2.77 AB
T5528.00 ± 64.84 A0.53 ± 0.0847.75 ± 6.264.10 ± 1.40 B
Table 3. Correlation analysis of growth physiological indexes of pecan. * p < 0.05; ** p < 0.01.
Seedling HeightGround DiameterPnTotal ChlorophyllTotal Soluble SugarTotal StarchTotal Soluble ProteinTotal Soluble Phenol
Ci0.0410.173−0.727 **0.3330.1010.0320.510 *0.331
E0.0450.0650.3440.0010.1250.0080.2830.413
Gs0.0060.0960.497 *0.1550.1160.0300.2710.328
Chlorophyll a0.3020.1980.5020.990 **0.2790.2030.1090.023
Chlorophyll b0.1940.1800.519 *0.986 **0.0600.3410.1090.041
Lutein0.2780.1970.518 *0.991 **0.2230.2460.0500.008
Leaf Soluble Sugar0.2310.0730.047−0.514 *0.863 **0.3340.3900.308
Stem Soluble Sugar0.2630.2720.0260.1530.808 **0.740 **0.748 **0.617 **
Root Soluble Sugar0.2680.0160.2580.0480.910 **0.610 **0.501 *0.338
Leaf Starch0.3020.3610.1770.1580.530 *0.994 **0.689 **0.718 **
Stem Starch0.505 *0.4000.3110.1680.501 *0.991 **0.588 **0.694 **
Root Starch0.491 *0.4030.3390.0750.506 *0.993 **0.620 **0.640 **
Leaf Soluble Protein0.3500.2180.1410.0040.441 *0.566 **0.876 **0.687 **
Stem Soluble Protein0.460 *0.0270.1330.3250.526 *0.509 *0.863 **0.487 *
Root Soluble Protein0.1460.3220.3060.0360.1930.3340.587 **0.644 **
Leaf Soluble Phenol0.3600.2090.3050.1700.2520.3960.533 *0.822 **
Stem Soluble Phenol0.453 *0.1900.1970.0320.447 *0.520 *0.514 *0.820 **
Root Soluble Phenol0.0350.3860.2330.0090.3530.605 **0.719 **0.756 **
Table 4. The rate of eigenvalue, contribution, and cumulative contribution in principal components.
Principal ComponentsEigenvaluesContribution Rate/%Cumulative Contribution Rate/%
16.43842.92042.920
25.87039.13182.051
Table 5. Scores of NH4+:NO3 ratio treatments in the principal component and comprehensive evaluation.
TreatmentsZ1Z2Comprehensive ScoreRanking
CK−0.45−3.29−1.486
T1−2.761.50−0.604
T20.06−0.76−0.273
T3−2.67−0.09−1.185
T42.572.342.021
T53.260.291.512
Publisher’s Note: MDPI stays neutral with regard to jurisdictional claims in published maps and institutional affiliations.

