
High Rainfall Inhibited Soil Respiration in an Asian Monsoon Forest in Taiwan


1
TheExperimental Forest, National Taiwan University, College of Bio-Resources and Agriculture, Nantou 55750, Taiwan
2
School of Forestry and Resource Conservation, National Taiwan University, Taipei 10617, Taiwan
*
Author to whom correspondence should be addressed.
Forests 2021, 12(2), 239; https://0-doi-org.brum.beds.ac.uk/10.3390/f12020239
Submission received: 19 December 2020
/
Revised: 2 February 2021
/
Accepted: 16 February 2021
/
Published: 20 February 2021
(This article belongs to the Special Issue Forest Soil Carbon and Climate Changes)
Abstract
:Soil respiration represents the second largest carbon flux, next to photosynthesis of the terrestrial biosphere, and thus plays a dual role in regional and global carbon cycles. However, soil respiration in Asian monsoon forests with high rainfall has rarely been studied. In this study, we continuously measured soil respiration using a 12-channel automated chamber system in a 61-year-old Japanese cedar forest in central Taiwan with annual rainfall greater than 2500 mm. A 4-year (2011–2014) continuous half-hourly dataset was used to quantify the influences of soil temperature and moisture, especially rainfall events, on both total soil respiration (Rs) and heterotrophic respiration (Rh). The annual mean Rs was approximately 10.8 t C ha−1 (ranging from 10.7 to 10.9) t C ha−1, with Rh contributing approximately 74.6% (ranging from 71.7% to 80.2%). Large seasonal variations in both Rs and Rh were primarily controlled by soil temperature. Over 45.8% of total annual rainfall amounts were provided by strong rainfall events (over 50 mm), and over 40% of rainfall events occurred during summers between 2012 and 2014. These strong rainfall events caused rainwater to enter soil pores and cover the soil surface, which resulted in limited soil microorganism activity and, consequently, restricted CO2 production. The mean Q10 values were 2.38 (ranging from 1.77 to 2.65) and 2.02 (ranging from 1.71 to 2.34) for Rs and Rh, respectively. The Q10 values in this study, which were lower than in global forest ecosystems, may imply that the interannual Rs values observed in this study that were caused by high rainfall were less temperature-dependent than the Rs levels in global forest ecosystems. Both Rs and Rh were negatively correlated with soil moisture, which indicated that the soil moisture levels in the studied forest were usually under saturated conditions. These results also provide the lack of data for respiration in the Asian monsoon region under high-rainfall conditions.
1. Introduction
Forest ecosystems significantly impact the global carbon cycle and serve as carbon sinks for the atmosphere [1]. The amount of biomass stored in forest ecosystems is estimated to be approximately 80% of the global terrestrial biomass [2]. Global forests contain approximately 1146 Pg of carbon, which represents 69% of the total carbon stored in forest soil and litter [3]. Greenhouse gas release rates of forest soil also affect global climate change. Soil carbon cycling processes have received much attention from ecological scientists and policy makers because of their possibility of influencing the soil carbon cycle through land use management. Therefore, accounting for forest carbon to clarify the response of carbon cycles to control mechanisms and to climate change is necessary to predict carbon magnitudes and identify possible mitigation and adaptation methods. Soil respiration (Rs) is mainly derived from autotrophic respiration (Rr) and heterotrophic respiration (Rh) in soil and is one of the largest carbon flux components in terrestrial ecosystems [4,5,6,7]. Of the total ecosystem respiration in temperate forests, 60–90% is contributed by Rs [8,9]. Rs is affected by biotic factors, such as root biomass and soil microorganism activity [10,11], and abiotic factors, such as soil temperature and soil moisture [12,13,14,15,16]. Rs generally has a positive relationship with soil temperature and can be described by a simple exponential function [12,17,18,19,20,21] and by the exponential “Q10” value in temperate and tropical regions. Recently, however, more studies have focused on subtropical regions to fill the gaps in Rs data [19,21,22,23,24,25,26]. On the other hand, Rs shows an inconsistent relationship with soil moisture. The inconsistent relationship between Rs and soil moisture is due to the effects of unusually low or high soil moisture levels, which suppress Rs production [15]. Liang et al. [12] found that Rs in a 45-year-old Japanese larch plantation in northern Japan had low correlation coefficients (R2 < 0.05) with soil moisture. Adachi et al. [27] also demonstrated a weak relationship between soil moisture and Rs in primary and secondary tropical forests. However, Kosugi et al. [28] found that Rs had a strong linear relationship with soil moisture in a Southeast Asian tropical rainforest, while Adachi et al. [29] demonstrated a polynomial relationship between Rs and soil moisture in a dry tropical forest in Thailand.
Seasonal variations in Rs and their relationships with environmental factors, such as soil temperature and soil moisture, have been documented [15,26,30]. Although previous reports have explained the interannual variability in Rs as being due to spring soil temperatures or summer rainfall and soil moisture [15], the inconsistency of the results suggests that the cause of interannual Rs variability may depend on climate. The terrestrial carbon cycle is strongly influenced by climate [31]. Extreme climate events, such as droughts or storms, lead to disturbances in the carbon cycle of Southeast Asia, but scientific understanding of the impact on the carbon cycle is still obscure [31]. Extreme climate events intensify typhoon damage and affect Rs, Rh, and Rh/Rs. It is necessary to be able to forecast Rs and Rh and their relationships with climate change. However, Rs and Rh in Asian monsoon forests with high rainfall have rarely been reported. Taiwan is struck by typhoons at a rate of approximately three times per year, which also brings high rainfall [32]. Soil moisture is high during the typhoon season, especially in forest ecosystems that receive high rainfall amounts. Conducting field studies in subtropical forests is challenging because of typhoon damage and high rainfall, which make the quantification of soil carbon magnitudes difficult. Therefore, long-term Rs and Rh monitoring is necessary to clarify the dominant cause of variations and how this cause changes over years and seasons.
Cryptomeria japonica (L.) D. Don (Japanese cedar), an evergreen coniferous tree, is naturally distributed in Japan and China and is one of the most important and dominant plantation species in Japan and Taiwan. Japanese cedar plantations cover approximately 4.5 million ha in Japan and comprise approximately 45% of the total forest plantation area [33]. Japanese cedar was first introduced in Xitou, central Taiwan, in 1910 and was widely grown in the mountains of northern and central Taiwan between 1950 and 1980 and represented 10% of the total forest plantation area [34]. Investigating the intra- and interannual responses of Rs in these Japanese forests can help explain how forest ecosystems respond to climate change. Therefore, long-term Rs data are necessary to support such analyses. We installed a multichannel automated chamber Rs and Rh observation system in a Japanese cedar forest in Xitou in late 2011 and continuously measured Rs and Rh for 4 years. The objectives of this study were to (1) estimate Rs magnitudes at interannual timescales, (2) determine the relationships between Rs and environmental factors, and (3) quantify the influences of soil temperature and moisture, especially rainfall events, on both Rs and Rh.
2. Materials and Methods
2.1. Site Description
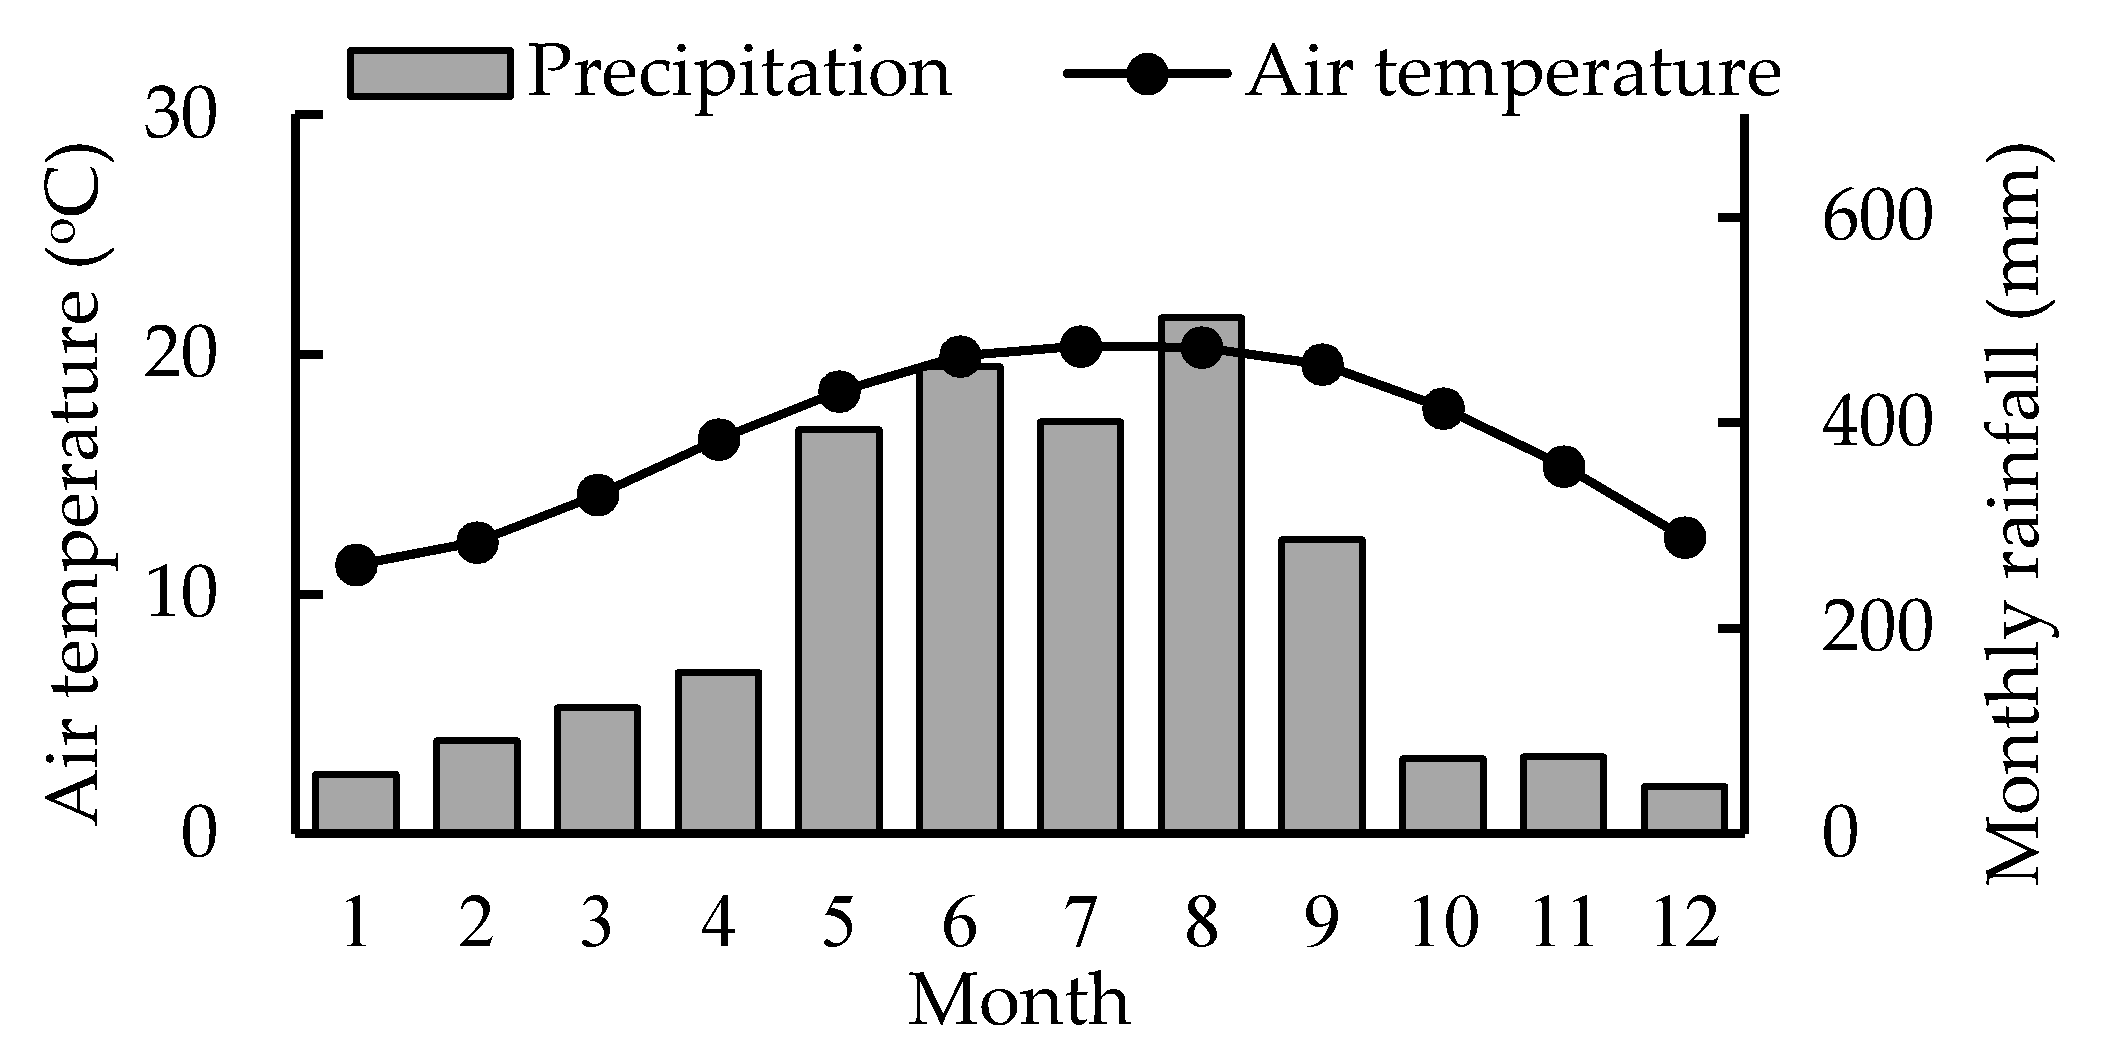
The Xitou Long-Term Ecosystem Research Site (XT, 23°39′ N, 120°47′ E) was established in 1950 in the Experimental Forest, National Taiwan University (EXFO, NTU), central Taiwan. In 2009, a flux tower was built at XT to observe carbon fluxes. This evergreen coniferous forest site is located at an altitude of 800–2000 m a.s.l. and the average slope is 15°. The dominant species, C. japonica, was planted over 60 years ago. The stand density is 721 stems ha−1, and the total basal area is 20.6 m2 ha–1 in 2011. The soil is an Inceptisol, and the bedrock consists of lithic sandstone. Soil depths range from 40 to 50 cm. Soil pH is below 5.0 and contains low levels of base cations above the O horizon because of the high rainfall and subsequent leaching. Long-term weather data that were obtained from the Xitou agricultural weather station (270 m away from the studied plot) between 1941 and 2012 showed that the mean annual temperature (MAT) was 16.6 °C, with a mean maximum of 20.8 °C in July and mean minimum of 12 °C in January and the mean annual rainfall (MAP) was 2635 mm (Figure 1).
2.2. Automated Chamber Installation and Measurement
Rs is usually measured by the chamber-based method [12]. In this study, Rs was measured using a multichannel, automated chamber system [6,12]. Briefly, the main components consisted of a control unit (i.e., a control panel with infrared gas analyzer, IRGA, LI-840, LI-COR, Lincoln, NE, USA), data logger (CR1000, Campbell Scientific Inc., Logan, UT, USA), gas sampler and air compressor. There were 12 automated chambers (65 cm × 50 cm × 50 cm) that were constructed with aluminum bars and PVC plates as the frame and walls, respectively. The automated chambers were also equipped with two microfans for mixing air and with sampling tubes for controlling the chamber lids. The chamber lids are controlled by two pneumatic cylinders at a pressure of 0.2 MPa that are driven by a microcompressor (M-10, Hitachi Ltd., Tokyo, Japan). The chamber air was made to flow through the IRGA by a microdiaphragm pump (5 Lmin−1; CH-50, Enomoto Ltd., Tokyo, Japan), and the flow rate was 700 mL min−1 when the IRGA was measuring CO2 concentrations. During the measurements, the chamber air was mixed by two microfans when the lid was closed. Between measurements, the chamber lid was raised by air pressure. The chambers were closed sequentially, and Rs data were collected. The sampling period for each chamber was 150 s. Finally, datasets from each chamber were collected every half-hour. In September 2011, 12 chambers were installed randomly on the forest floor within a circular area of 20 m diameter near the flux tower, and all understory plants inside the chambers were cut every two weeks. From January 2012 to 2014, all chambers were divided into total Rs and heterotrophic groups, each with six chambers. Around the chambers used for measuring Rh, a 5 cm wide × 50 cm deep trench was dug along the chamber boundary using a sharp shovel to cut any roots. PVC plates (200 cm long × 50 cm wide × 0.4 cm thick) were then inserted into the trench to prevent root growth into the chambers.
Soil temperatures at 5-cm depth were monitored in each chamber using a thermocouple probe that was connected to a data logger. The volumetric soil water contents at 10-cm depth were measured around the chambers with a soil moisture sensor (SM300, Delta-T Device Ltd., Cambridge, UK). This soil moisture sensor was also connected to the data logger for data collection.
2.3. Data Analysis
Soil respiration rates (Rs, μmol CO2 m−2 s−1) that were obtained from the chamber measurements (six chambers per treatment) were used to calculate mean soil respiration values, and the equation used is as follows
where V is the chamber volume (m3), P is the atmospheric pressure (Pa), R is the ideal gas constant (8.314 Pa m3 K–1 mol–1), S is the soil surface area in the chamber (m2), T is the air temperature in the chamber (K), and δC/δt is the slope of the CO2 ratio (μmol mol−1 s−1). The chamber volume and soil surface area were 0.1625 m3 and 0.325 m2, respectively. To analyze the influence of soil temperature on soil respiration in each chamber, the equation was transformed as follows (Lloyd and Taylor, 1994)
where Tsoil is the soil temperature at a depth of 5 cm, a is the soil respiration at 0 °C, and b is the temperature sensitivity constant. The parameters of the different regression equations for the control and trench treatments were compared using analysis of covariance, and statistical significance was defined as p < 0.05.
The value of b was also used to calculate the temperature sensitivity index (Q10 coefficient), which is the relative increase in Rs with a 10 °C increase in soil temperature
To analyze the response of Rs to soil moisture, we subtracted the simulated values of Rs by using Equation (2), and the residual values (RRs, the temperature-normalized Rs, μmol CO2 m−2 s−1) were used for analysis. The relationship was fitted with the following concave-down regression equation
where RRs (μmol CO2 m−2 s−1) is the temperature-normalized Rs, θ is the volumetric soil moisture content (%), and c1, c2, and c3 are curve-fitting parameters. The parameters of the different regression equations for the control and trench treatments were compared using analysis of covariance.
Missing Rs and Rh data (gaps) in each chamber were estimated based on the annual temperature-response equation derived from Equation (2). The number of gap days totaled 102 during the 1487 days of measurements from September 2011 to December 2014, which corresponded to 6.8% of the entire measurement period. The largest gap was from 13 March to 7 April 2013 due to an IRGA problem, and this gap was the only gap longer than 30 days during the four years of observations. Finally, regression analysis and variance analysis of the continuous data were performed using Sigmaplot 14.0 software (Systat Software Inc., San Jose, CA, USA).
3. Results
3.1. Environmental Factor Magnitudes on Interannual Timescales
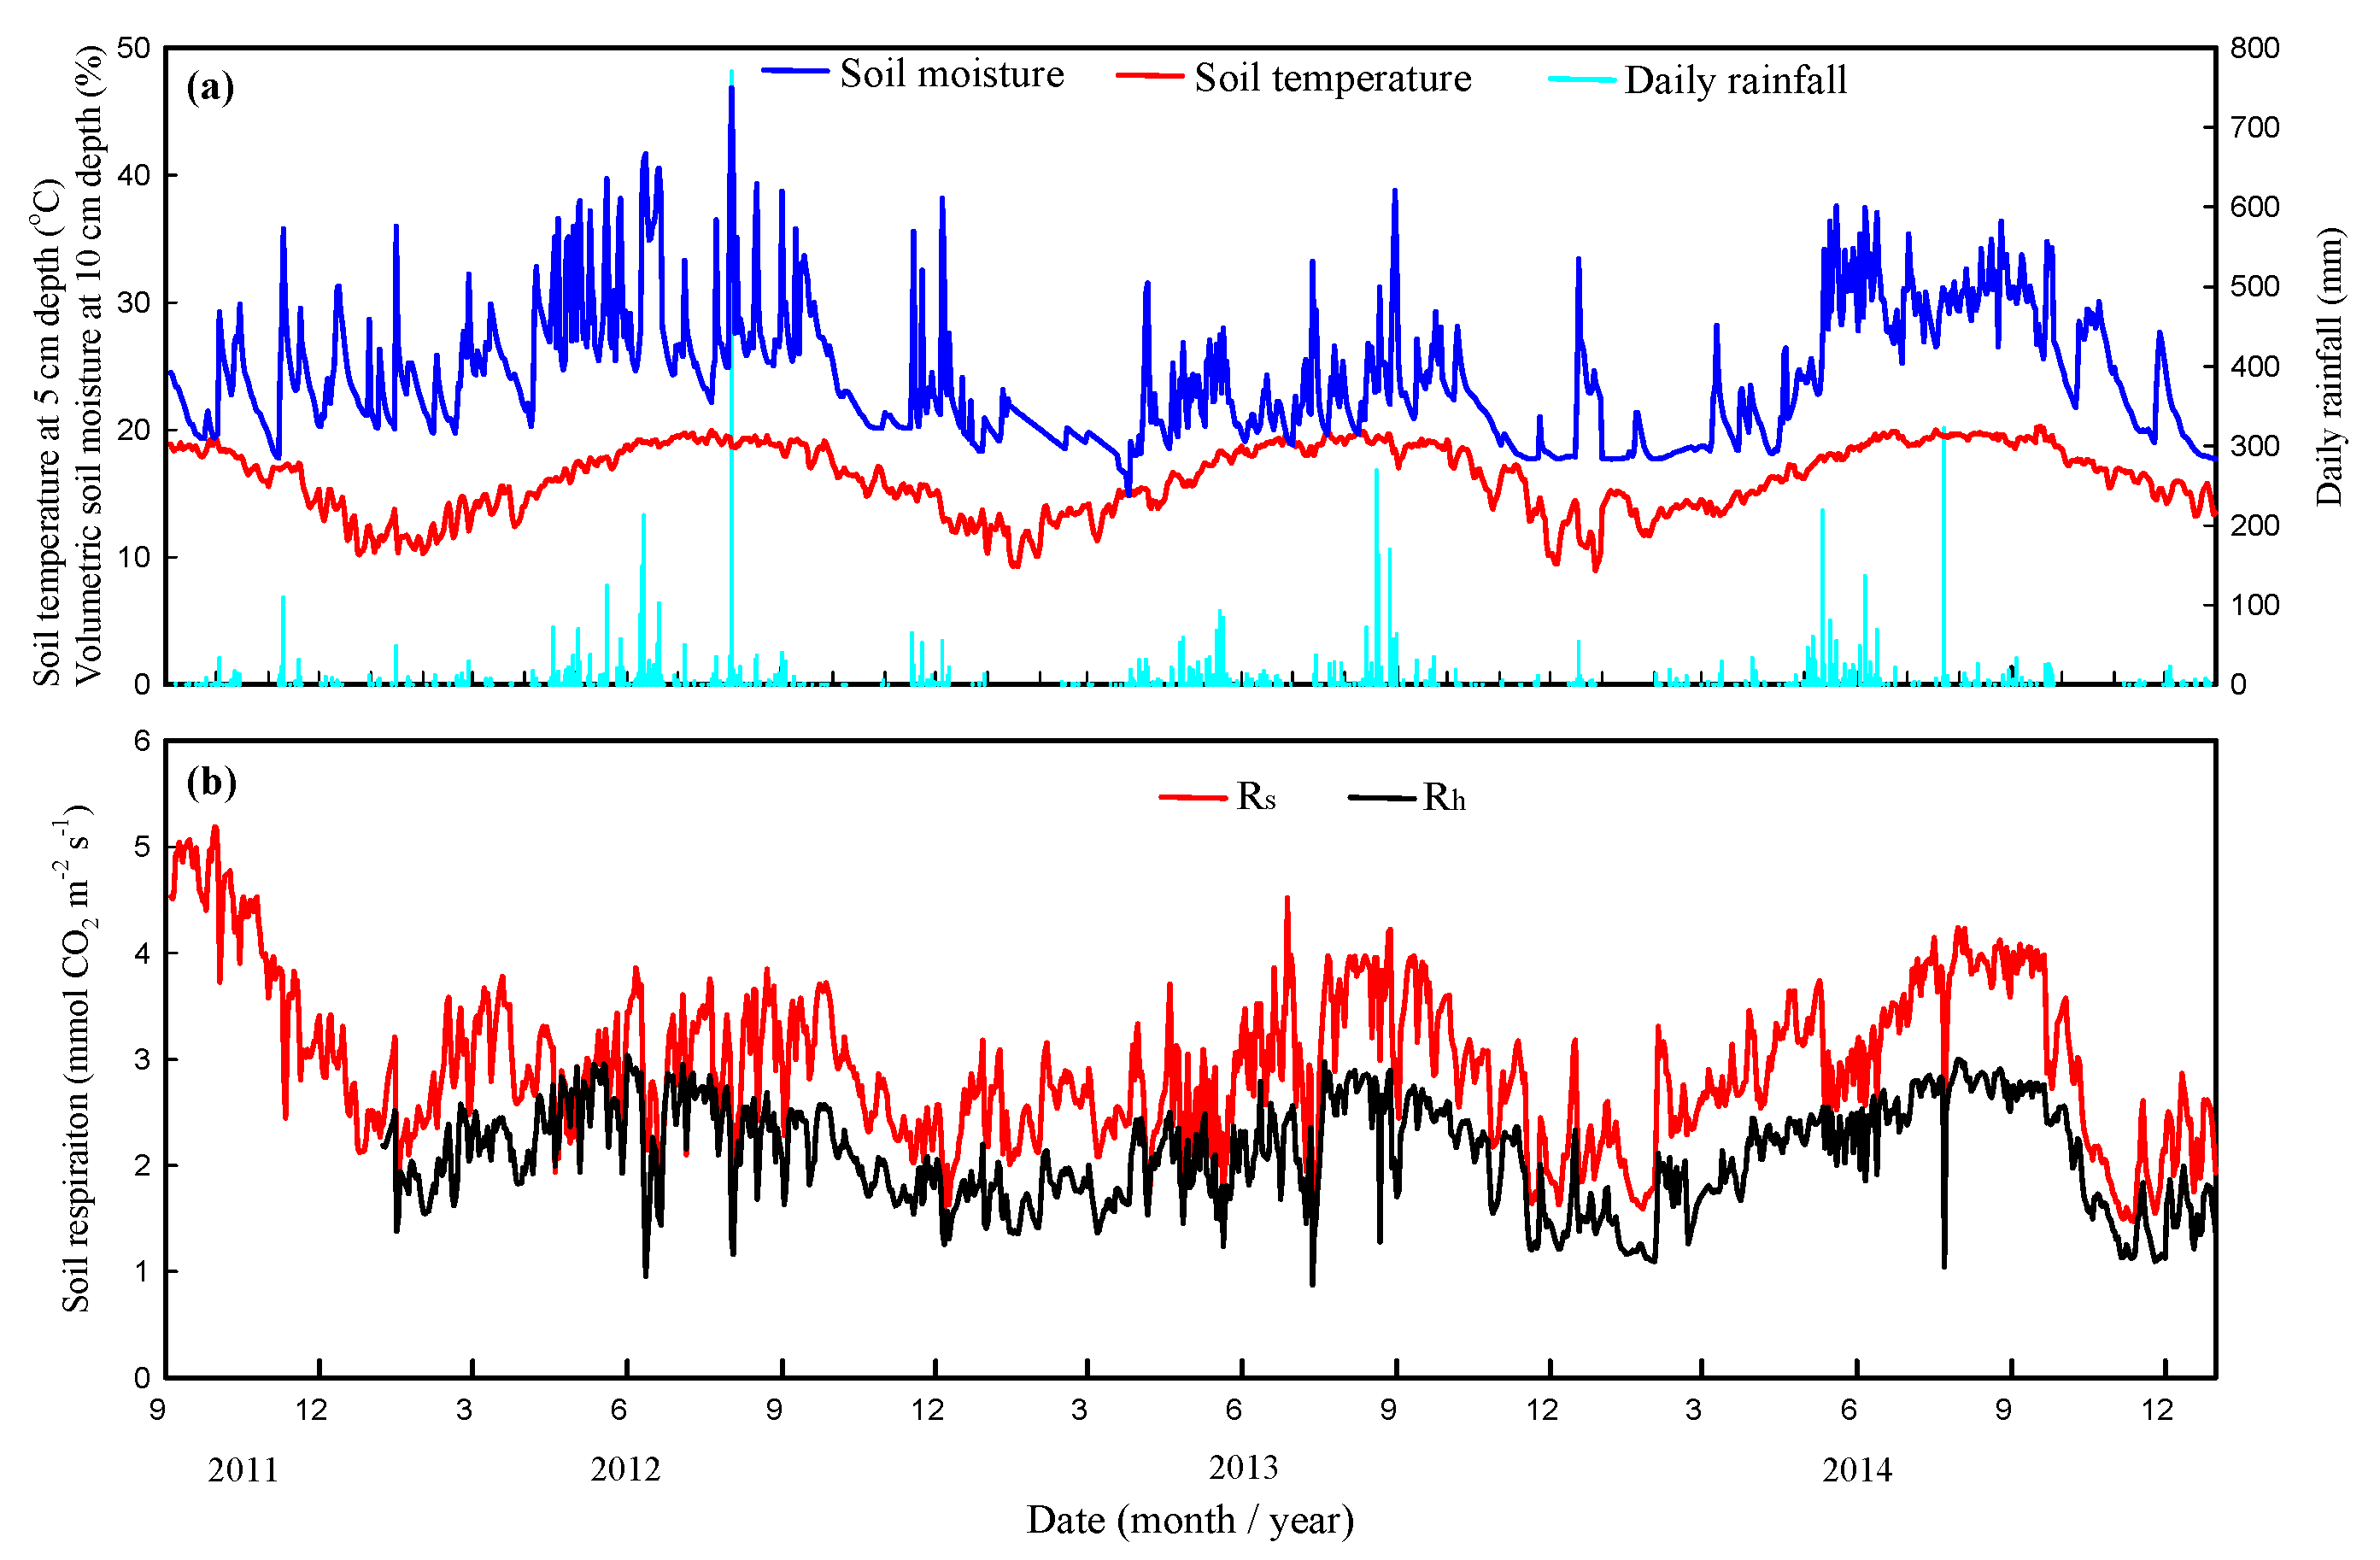
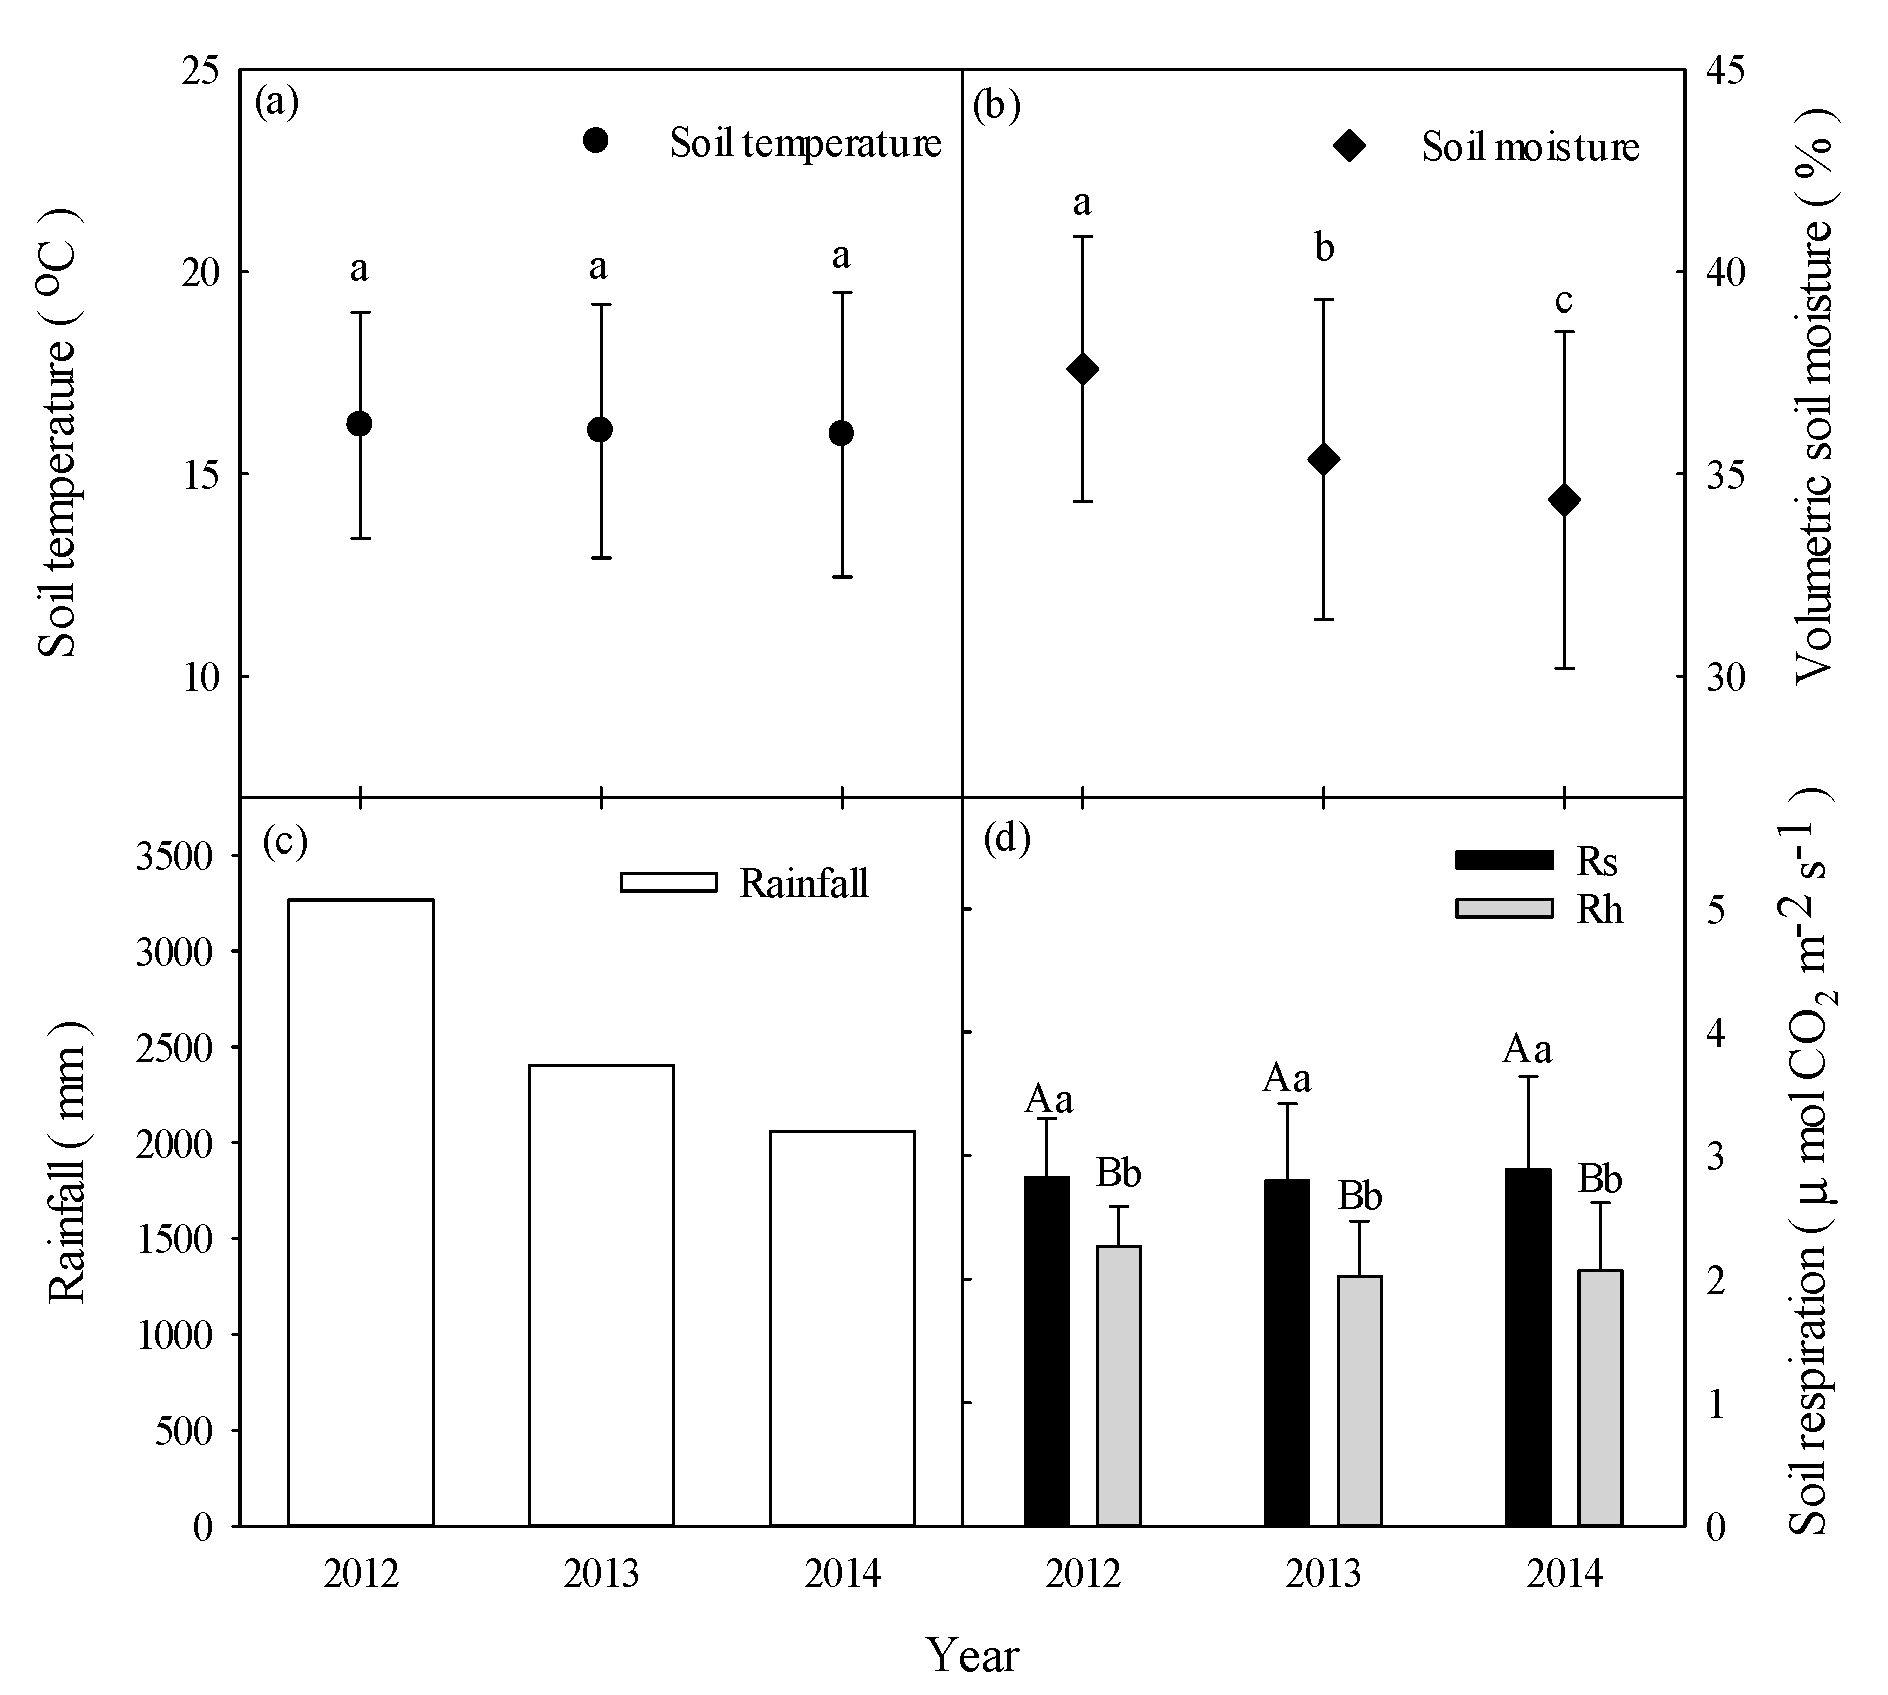
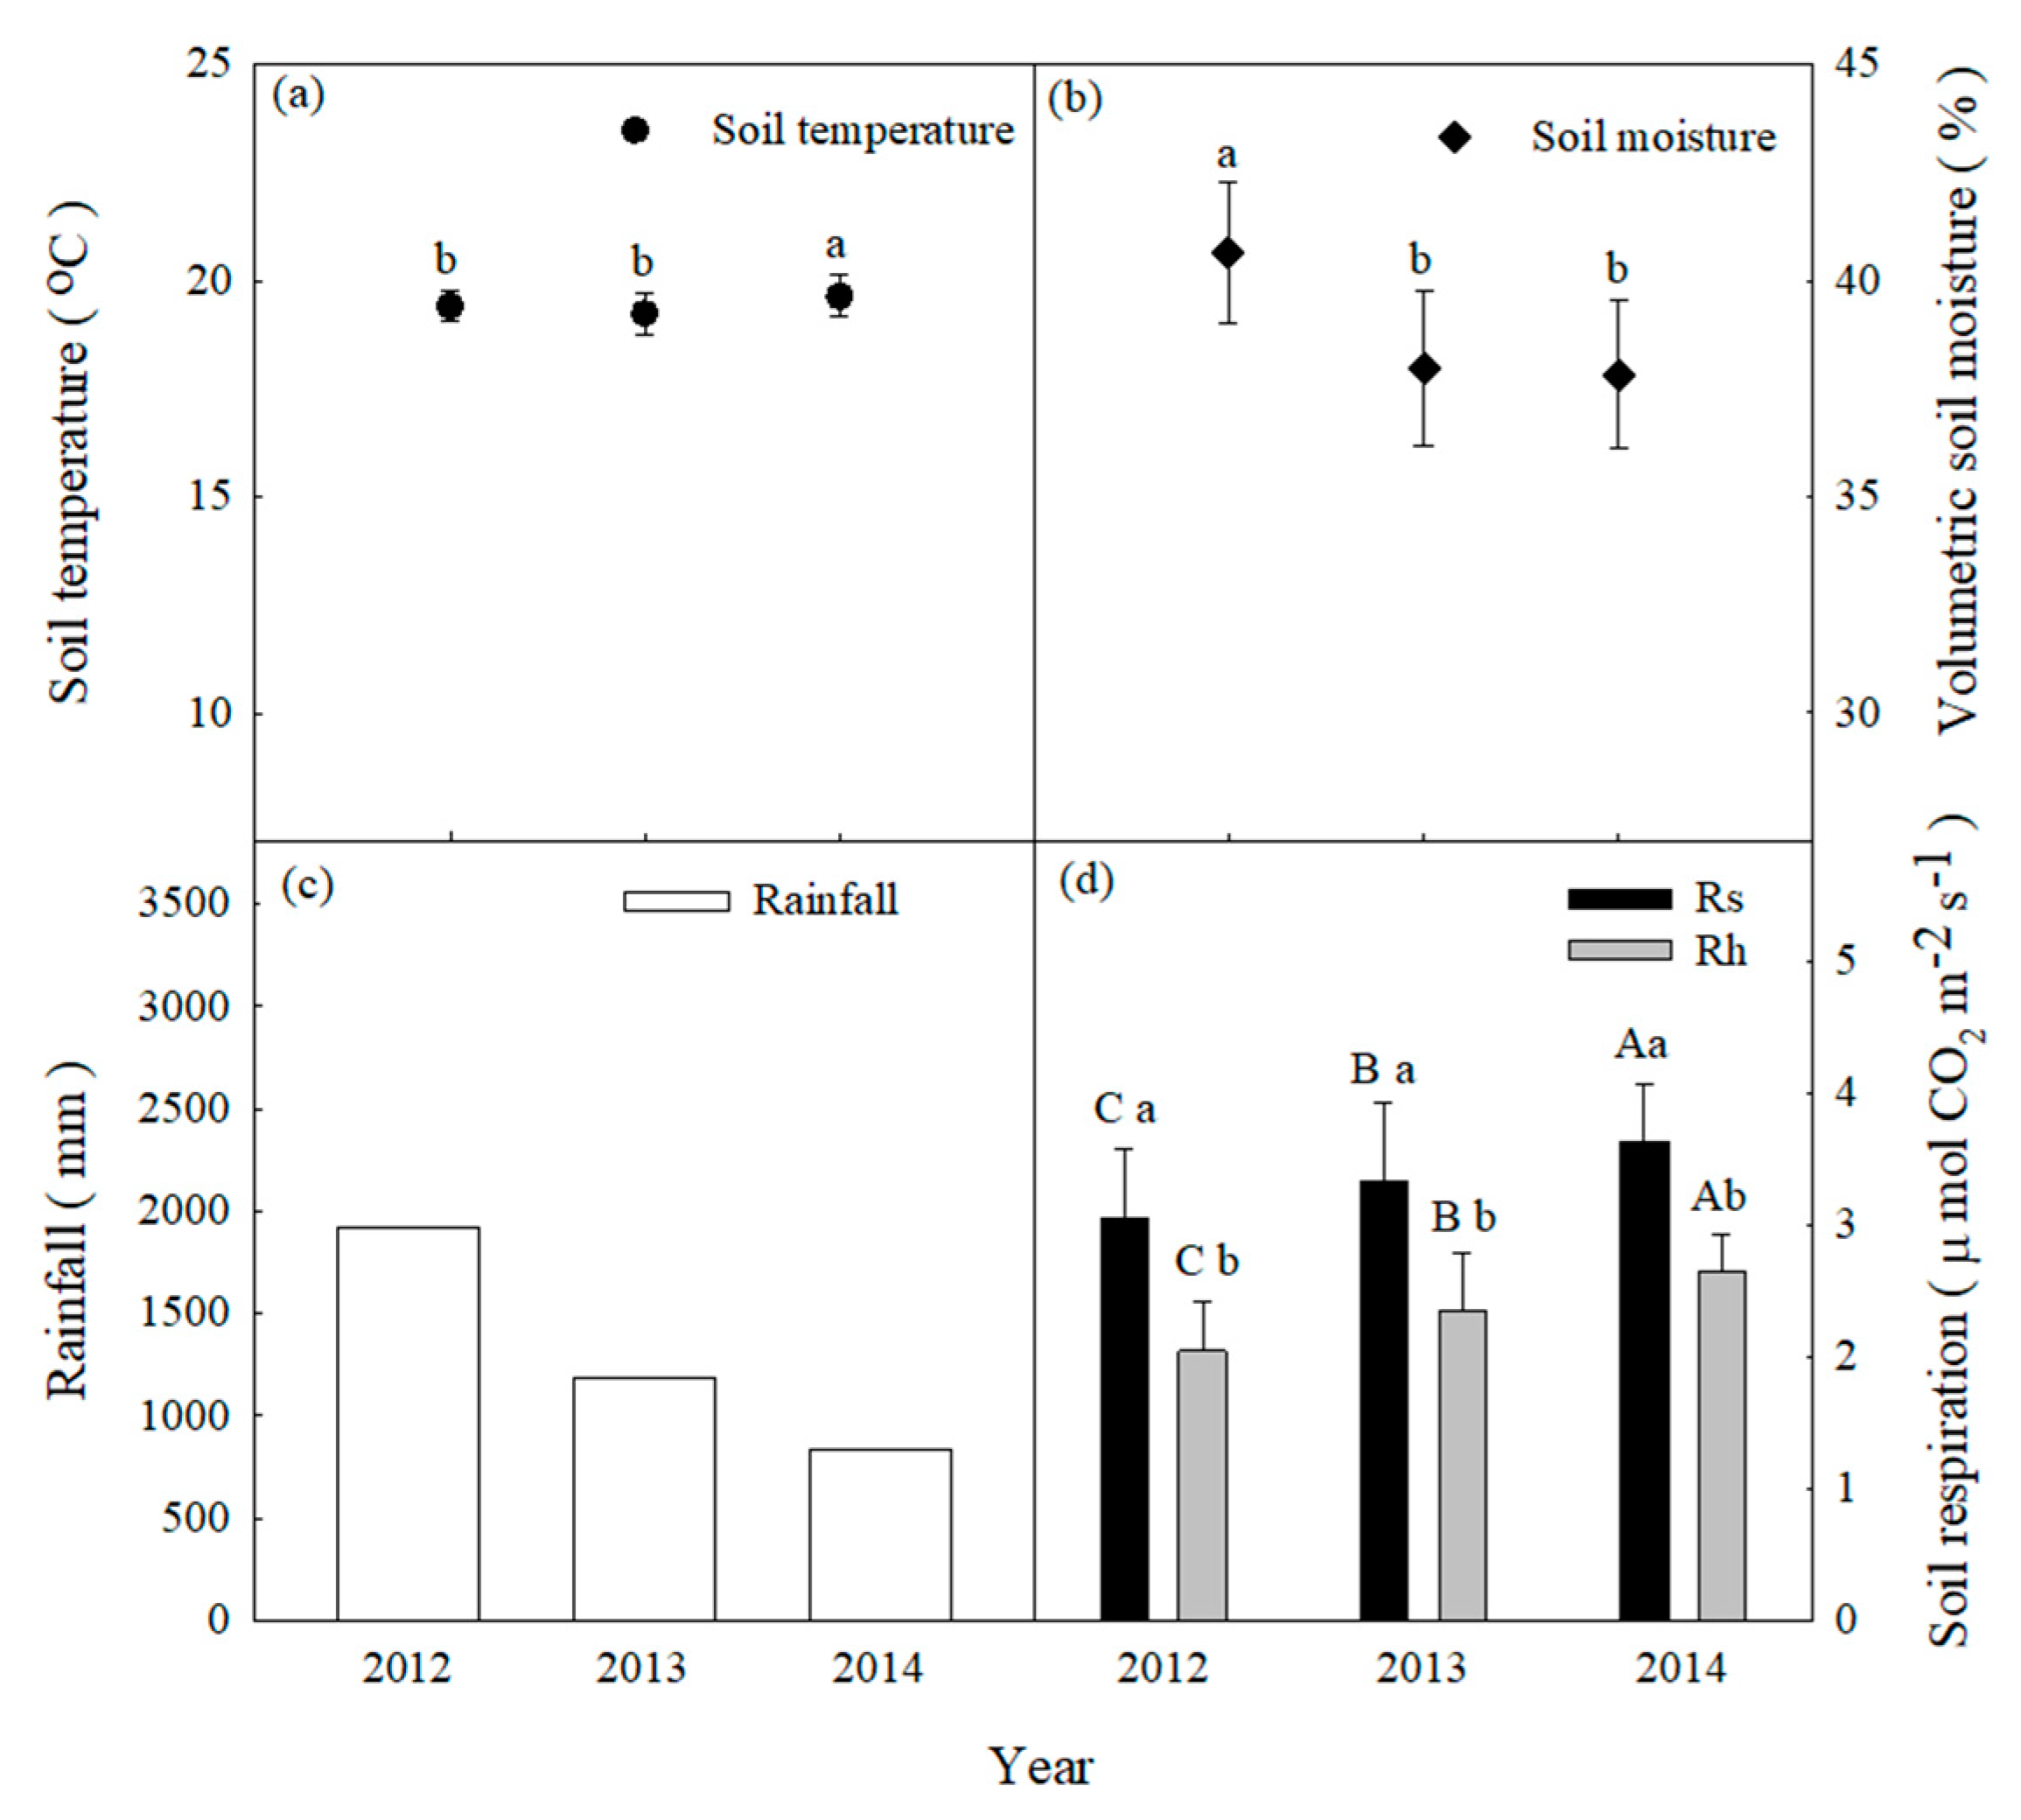
Daily soil temperatures at 5-cm depths exhibited a typical seasonal pattern with a range of 8.9–20.3 °C and peaks in July and August (Figure 2). The mean annual soil temperatures exhibited no differences from 2012 to 2014 (p > 0.05, Figure 3a). Daily soil moisture varied between 14.8% and 46.9%, with peaks generally occurring on days with high rainfall. Soil moisture gradually decreased from 40% to 20% because of a lack of rainfall from September to November and from January to April (Figure 2). Mean annual soil moisture showed significant differences from 2012 to 2014 (p < 0.05, Figure 3b). From January 2011 to December 2014, the climatic conditions exhibited patterns that were typical for central Taiwan at the study site. The annual rainfall amounts were 3267 mm (24% higher than MAP), 2403 mm (9% lower than MAP) and 2062 mm (22% lower than MAP) from 2012 to 2014, respectively (Figure 2 and Figure 3c). High-intensity rainfall events generally occurred from April to August (Figure 2). The characteristics of rainfall events in the study area are shown in Table 1.
Annual rainfall events with levels greater than 50 mm comprised 45.8% to 57.4% of strong rainfall events between 2012 and 2014 (Table 1). Rainfall event frequencies of 59%, 49%, and 40% were concentrated in the summer (June–August) from 2012 to 2014, respectively. Six-day periods with over 100 mm of daily rainfall occurred in April–August, and the highest recorded daily rainfalls were 770 mm in 2012, 269 mm in 2013, and 322 mm in 2014, due to typhoon movement. In contrast to the strong rainfall events, the total accumulation from small rainfall events (<10 mm) comprised 9.6% to 16.4% of annual rainfall between 2011 and 2014 (Table 1). Short-term drought occurred from January to March 2013, especially in March (less than 64% of the mean monthly rainfall). Minimum soil moisture occurred in late autumn and early spring when rainfall stopped.
3.2. Estimates of Rs and Rh Magnitudes at Interannual Timescales
After excluding the data from 2011, the mean annual values of Rs and Rh between 2012 and 2014 were 2.83 ± 0.47, 2.80 ± 0.62, and 2.89 ± 0.75 and 2.27 ± 0.32, 2.02 ± 0.45, and 2.07 ± 0.55 μmol m−2 s−1, respectively (Figure 3d). From the differences between Rs and Rh, the mean annual root respiration (Rr) values between 2012 and 2014 were estimated to be 0.56 ± 0.15, 0.78 ± 0.17, and 0.82 ± 0.20 μmol m−2 s−1, respectively. The mean annual Rh/Rs ratios between 2012 and 2014 were 71.9%, 72.1%, and 71.6%, respectively. The mean annual Rs values showed significant differences from those of Rh in each year (p < 0.0.5, Figure 3d). However, the mean annual values of Rs and Rh did not show differences between 2012 and 2014 (Figure 3d).
3.3. Interannual Variations in Rs and Rh with Soil Temperature, Temperature Sensitivity, and Soil Moisture
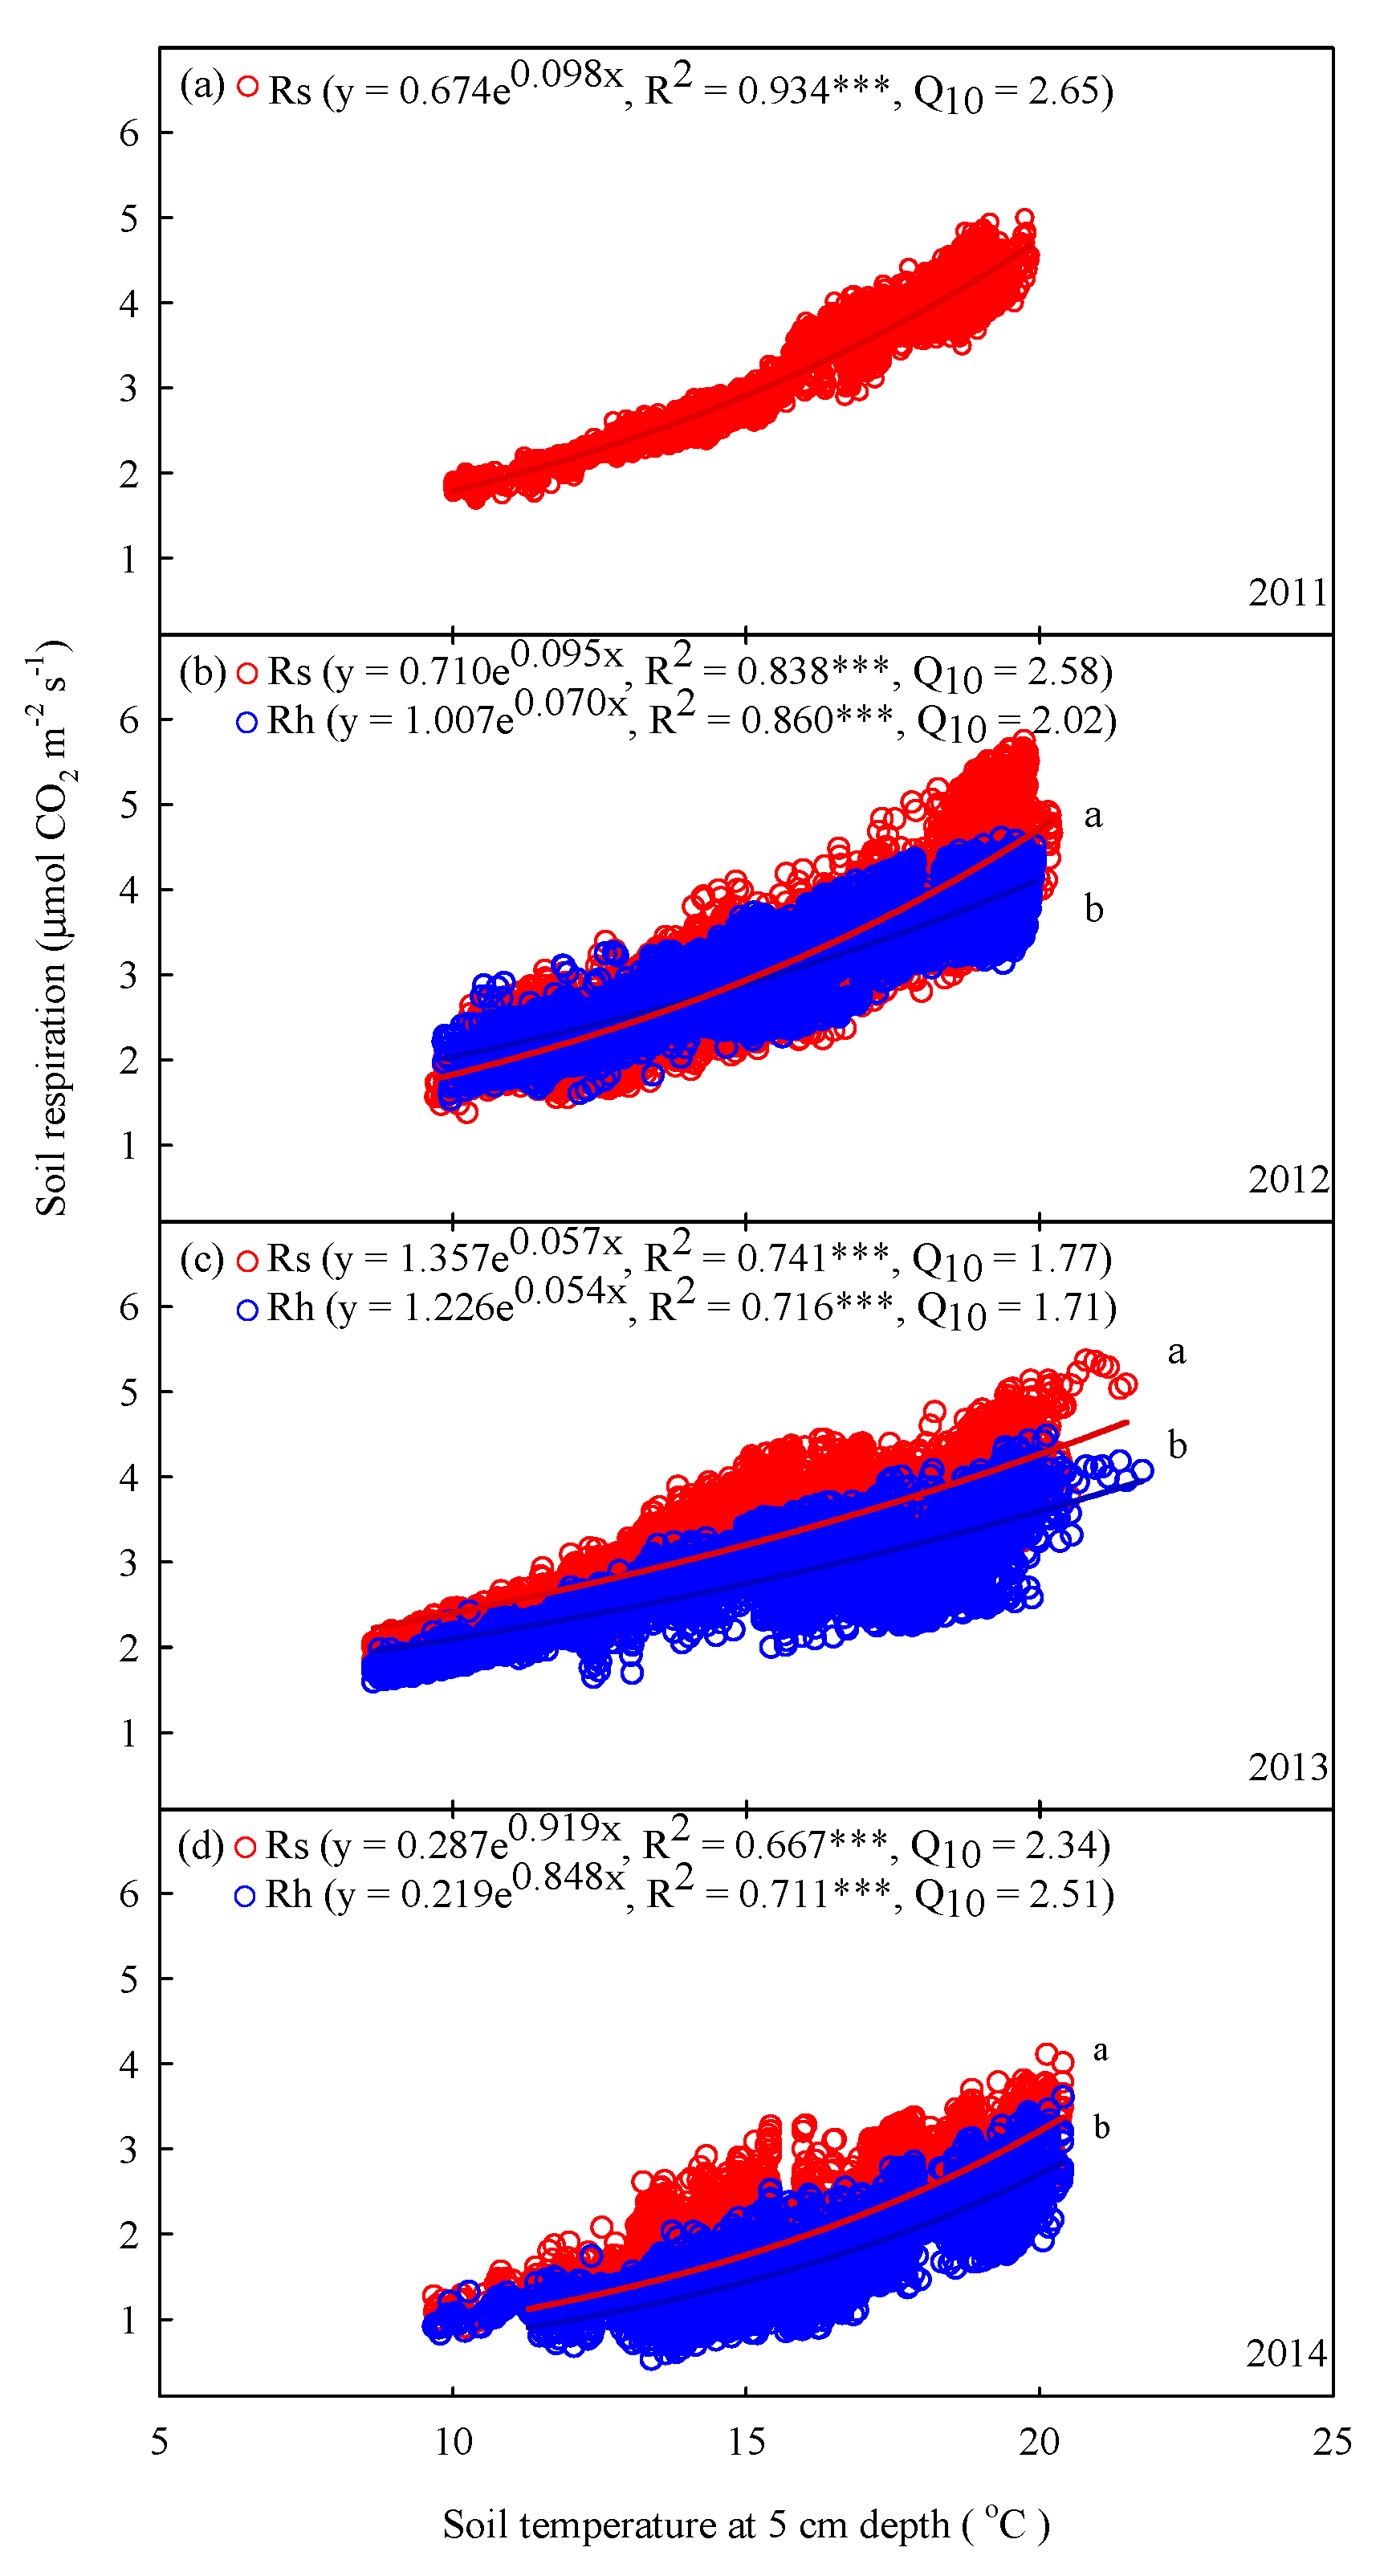
Rs and Rh exhibited significant exponential relationships with soil temperature at 5 cm depth for each year (p < 0.001, Figure 4). The regression curves of the relationships with soil temperature at 5 cm depth of Rs exhibited significant differences with those of Rh in each year (p < 0.05, Figure 4b–d). Specifically, the coefficients of determination (R2) of Rs and Rh between 2011 and 2014 varied from 0.667 to 0.934 and from 0.711 to 0.860, respectively (Figure 4). Across the 4-year period, the mean interannual Q10 values of Rs and Rh were 2.23 and 2.03, respectively (Figure 4).
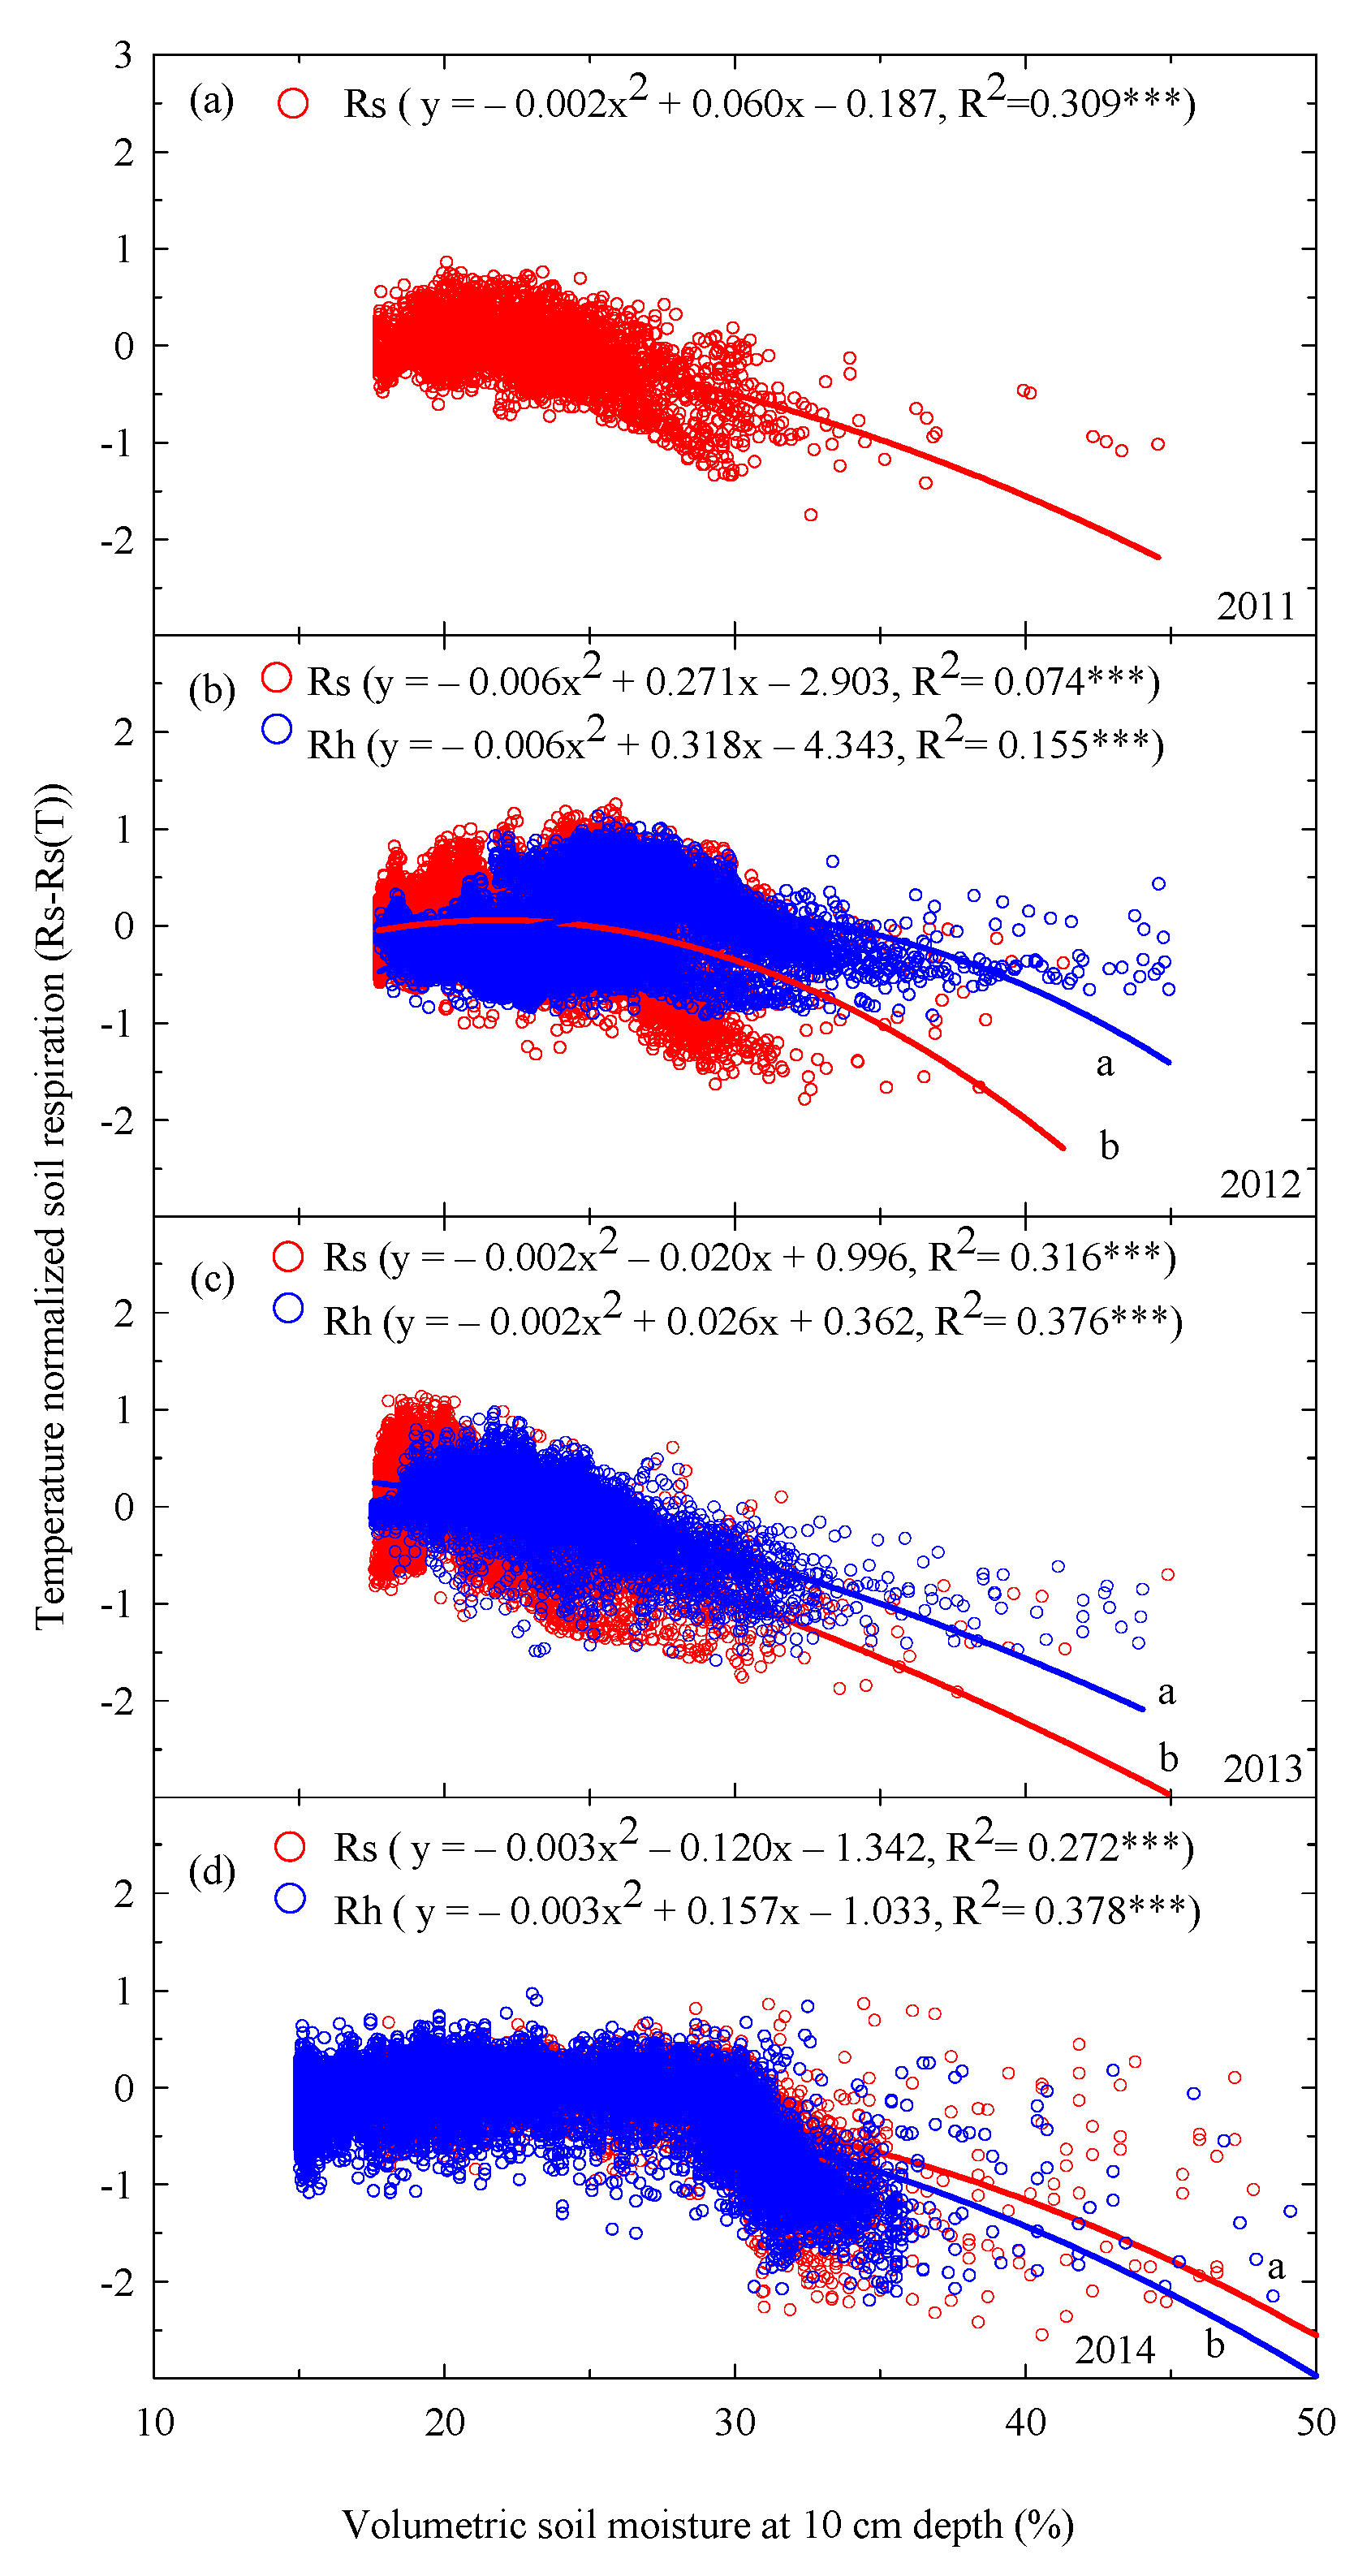
Significant relationships between temperature-normalized soil respiration and volumetric soil moisture were observed over the 4 years (p < 0.001, Figure 5). The regression curves of the relationships with volumetric soil moisture at 10 cm depth of Rs exhibited significant differences to those of Rh in each year (p < 0.05, Figure 5b–d). Specifically, the coefficients of determination of Rs and Rh between 2011 and 2014 varied from 0.074 to 0.316 and from 0.155 to 0.378, respectively (Figure 5).
3.4. Response of Rainfall Intensity to Rs and Rh Magnitudes in the Summer Season
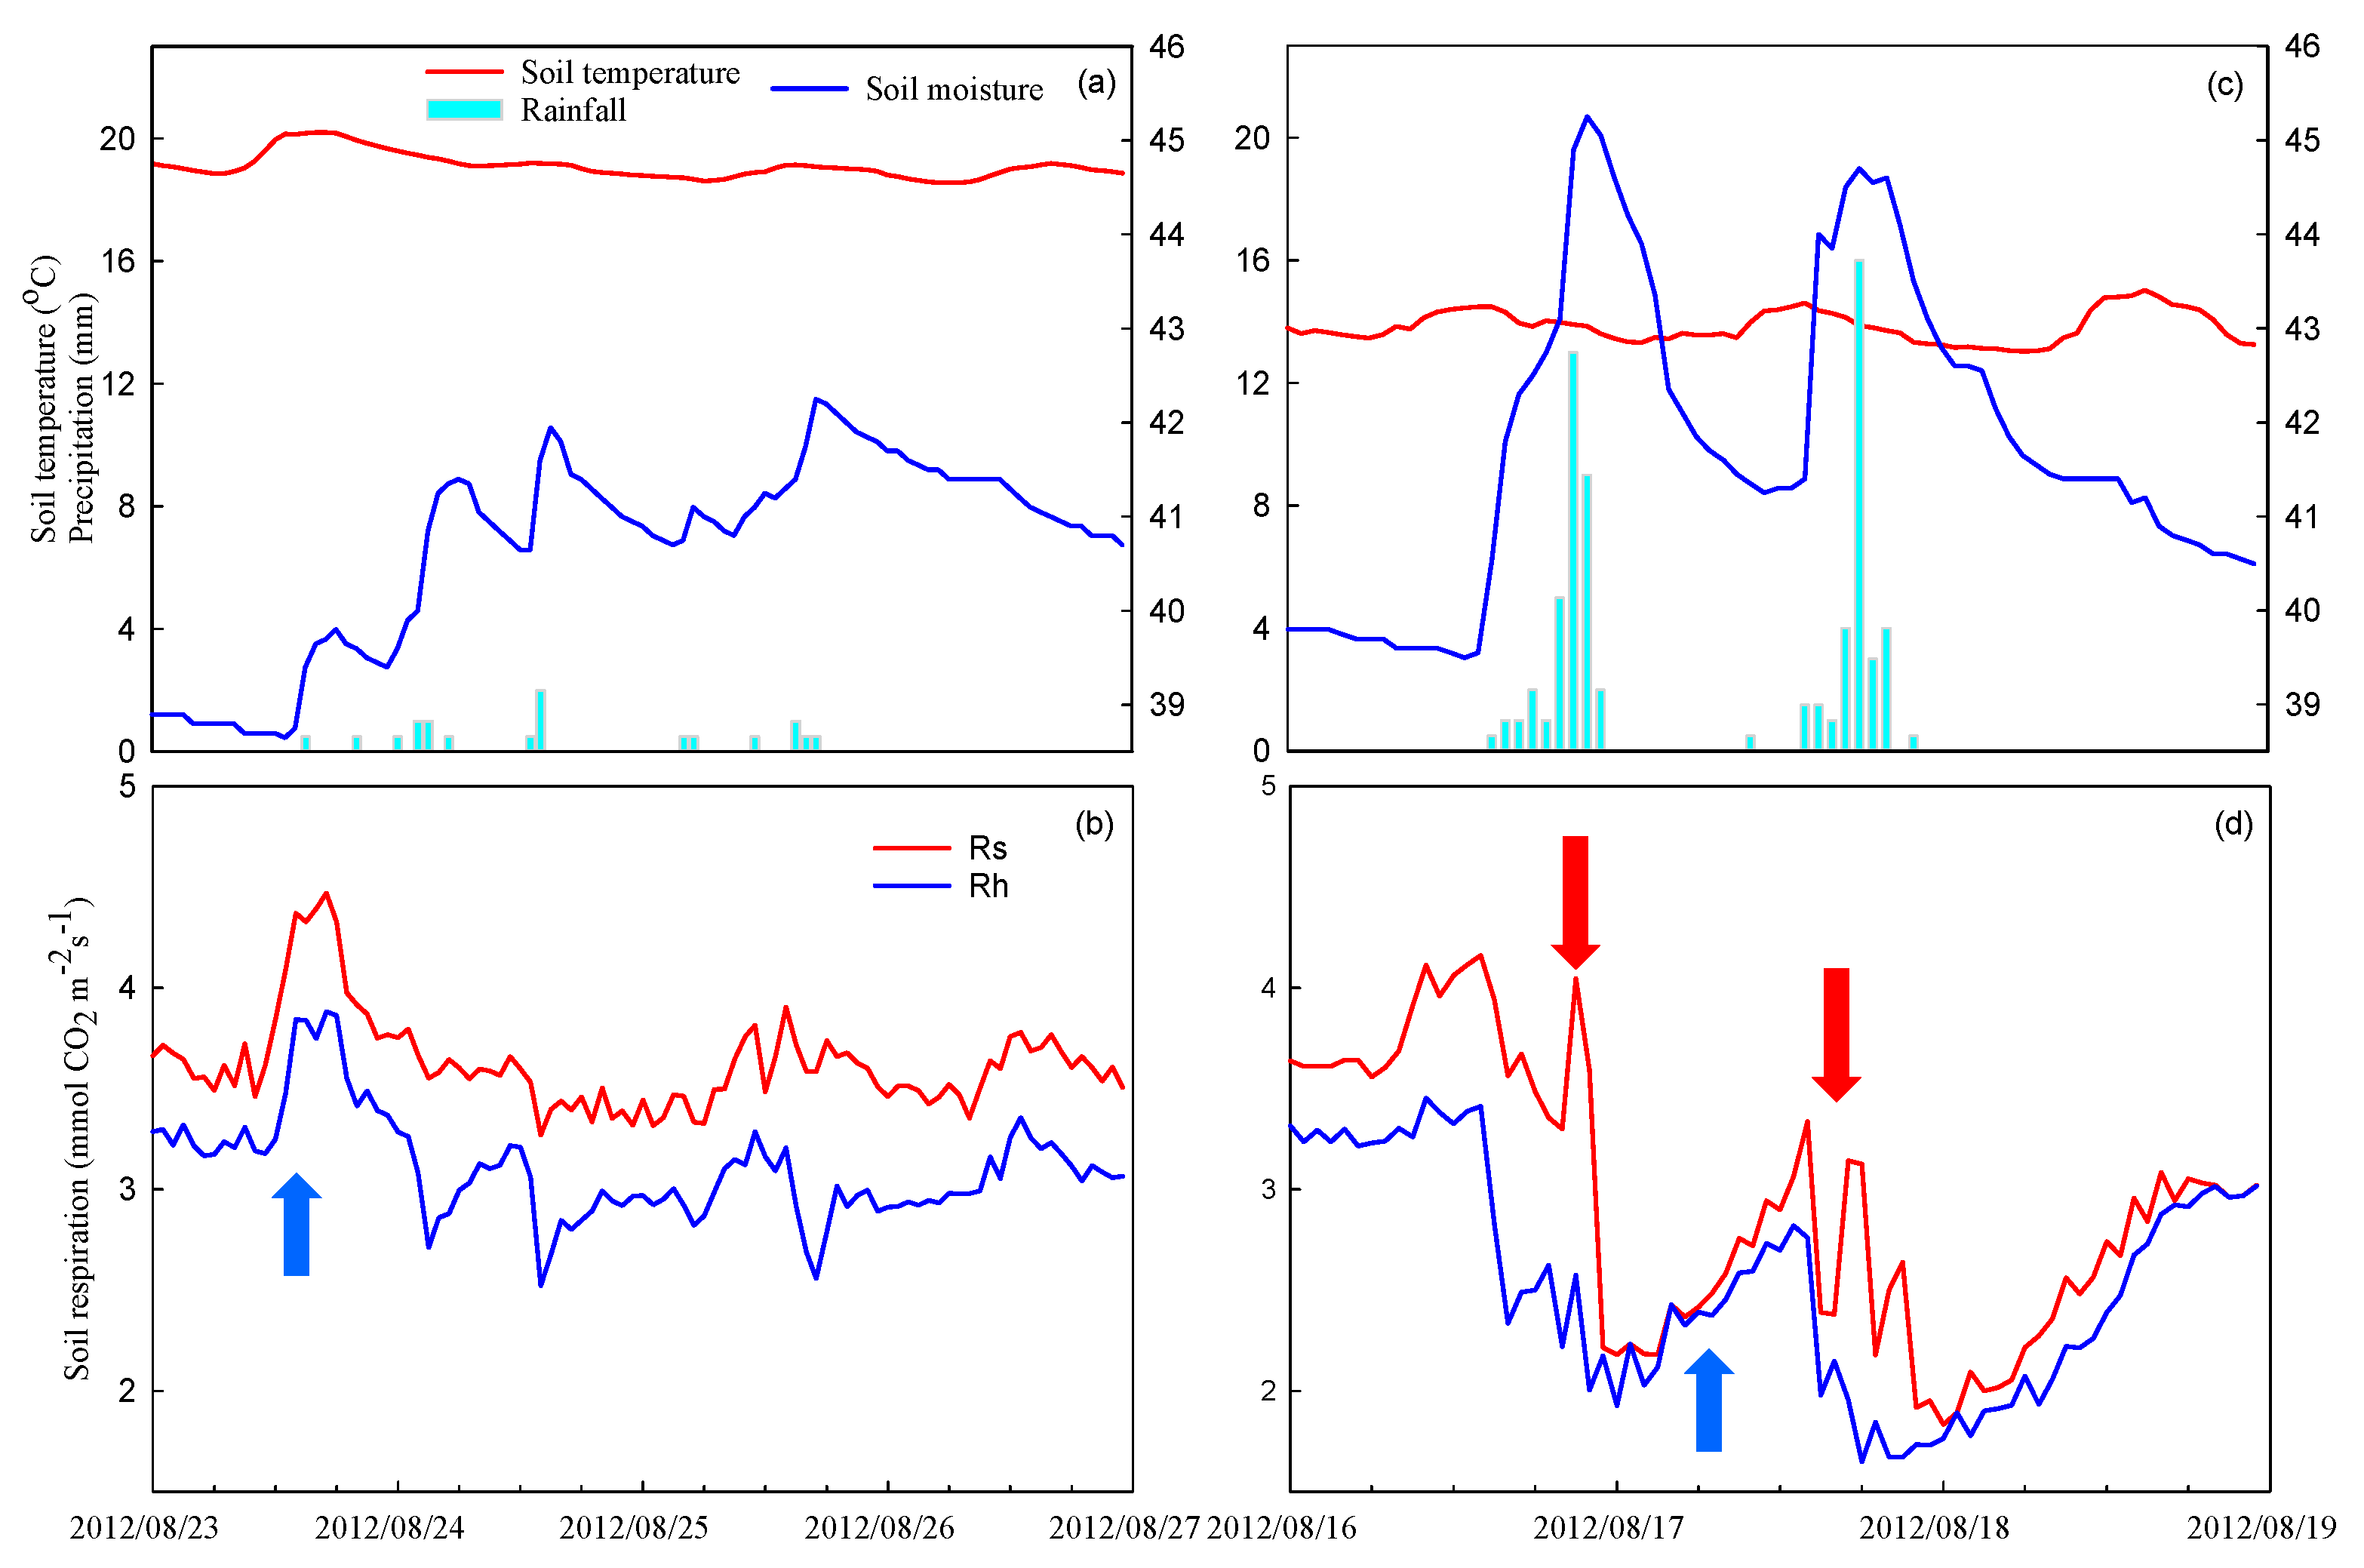
Pulse increases in Rs occurred after light rainfall events, and these increases continued for 2 to 3 days (Figure 6a,b). The soil moisture also increased immediately after rainfall events and decreased when rainfall stopped until the next rainfall event (Figure 6b). However, pulse decreases in Rs occurred immediately after strong rainfall events for which the hourly rainfall amounts exceeded 12 mm (Figure 6c,d).
3.5. Variations of Rs and Rh with Soil Temperature, Temperature Sensitivity, and Soil Moisture in Summer
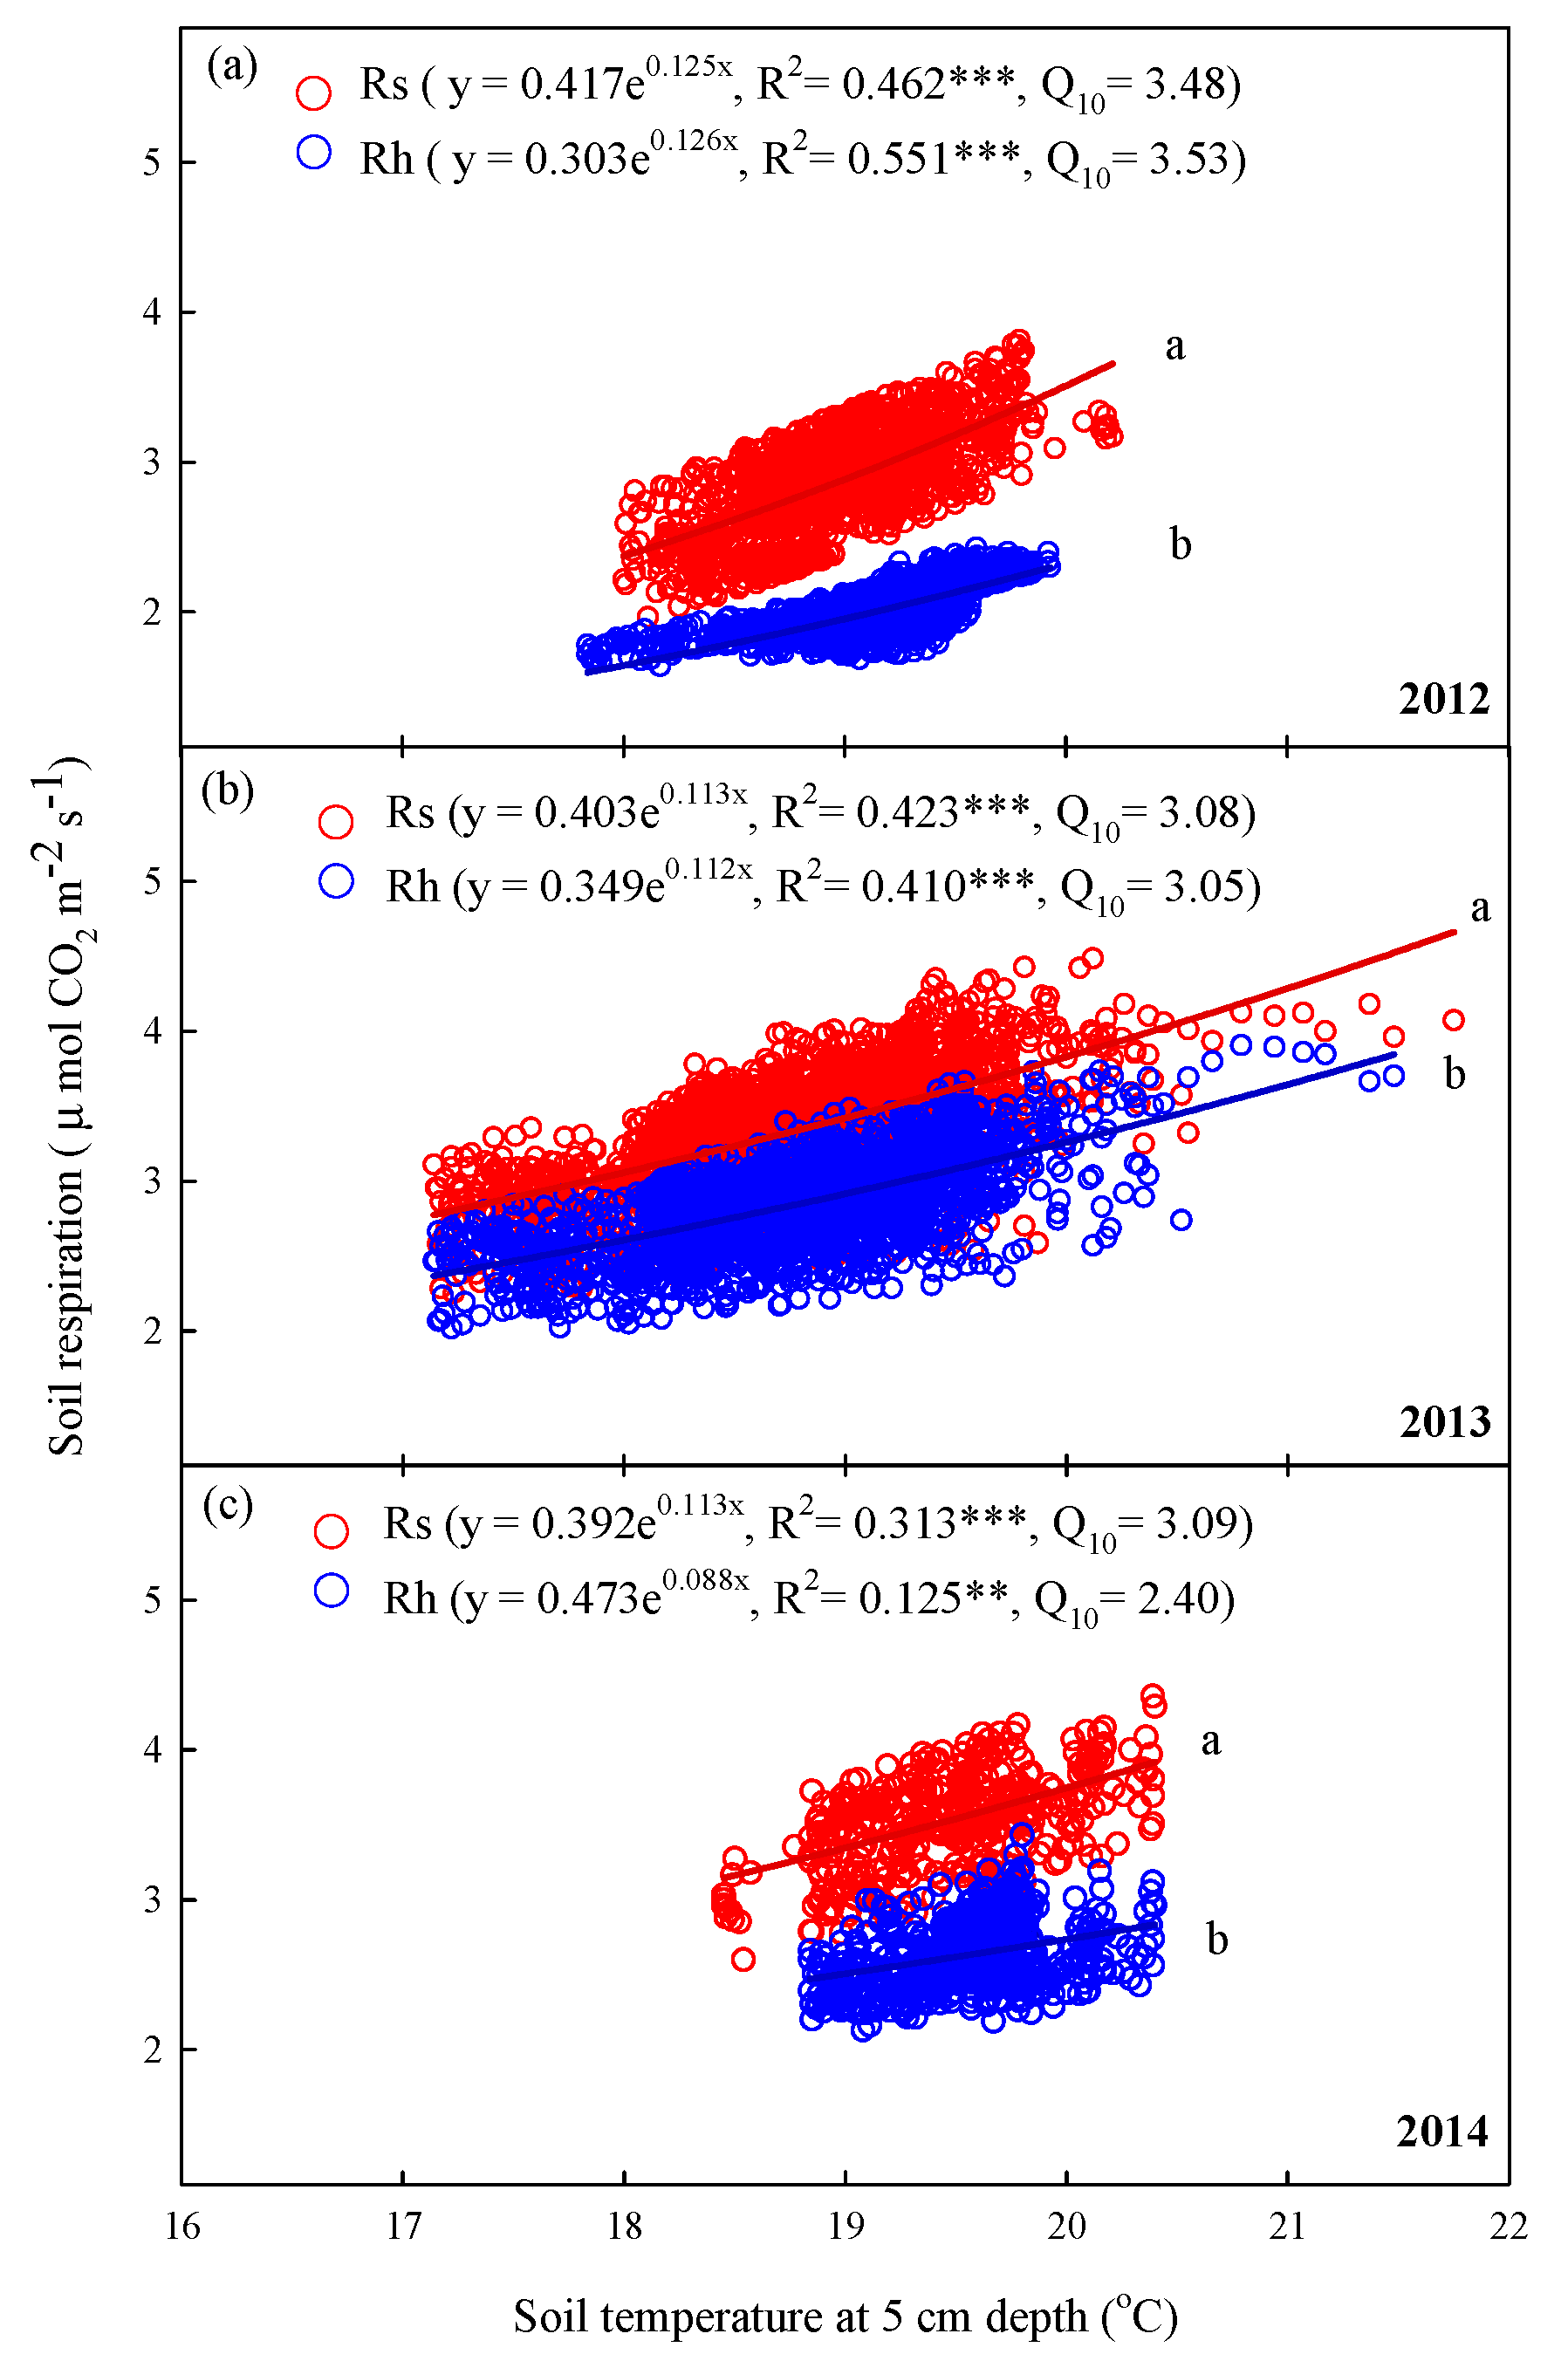
Rs and Rh showed significant exponential relationships with soil temperature at 5 cm depths in summer for each year (p < 0.001, Figure 7). The regression curves of the relationships with soil temperature at 5 cm depth of Rs exhibited significant differences to those of Rh in summer in each year (p < 0.05, Figure 7a–c). Specifically, the coefficients of determination (R2) of Rs and Rh in summer between 2012 and 2014 varied from 0.313 to 0.462 and from 0.125 to 0.551, respectively (Figure 7). Across the 3-year period in summer, Q10 values ranged from 3.08 to 3.48 for Rs and from 2.40 to 3.53 for Rh (Figure 7).
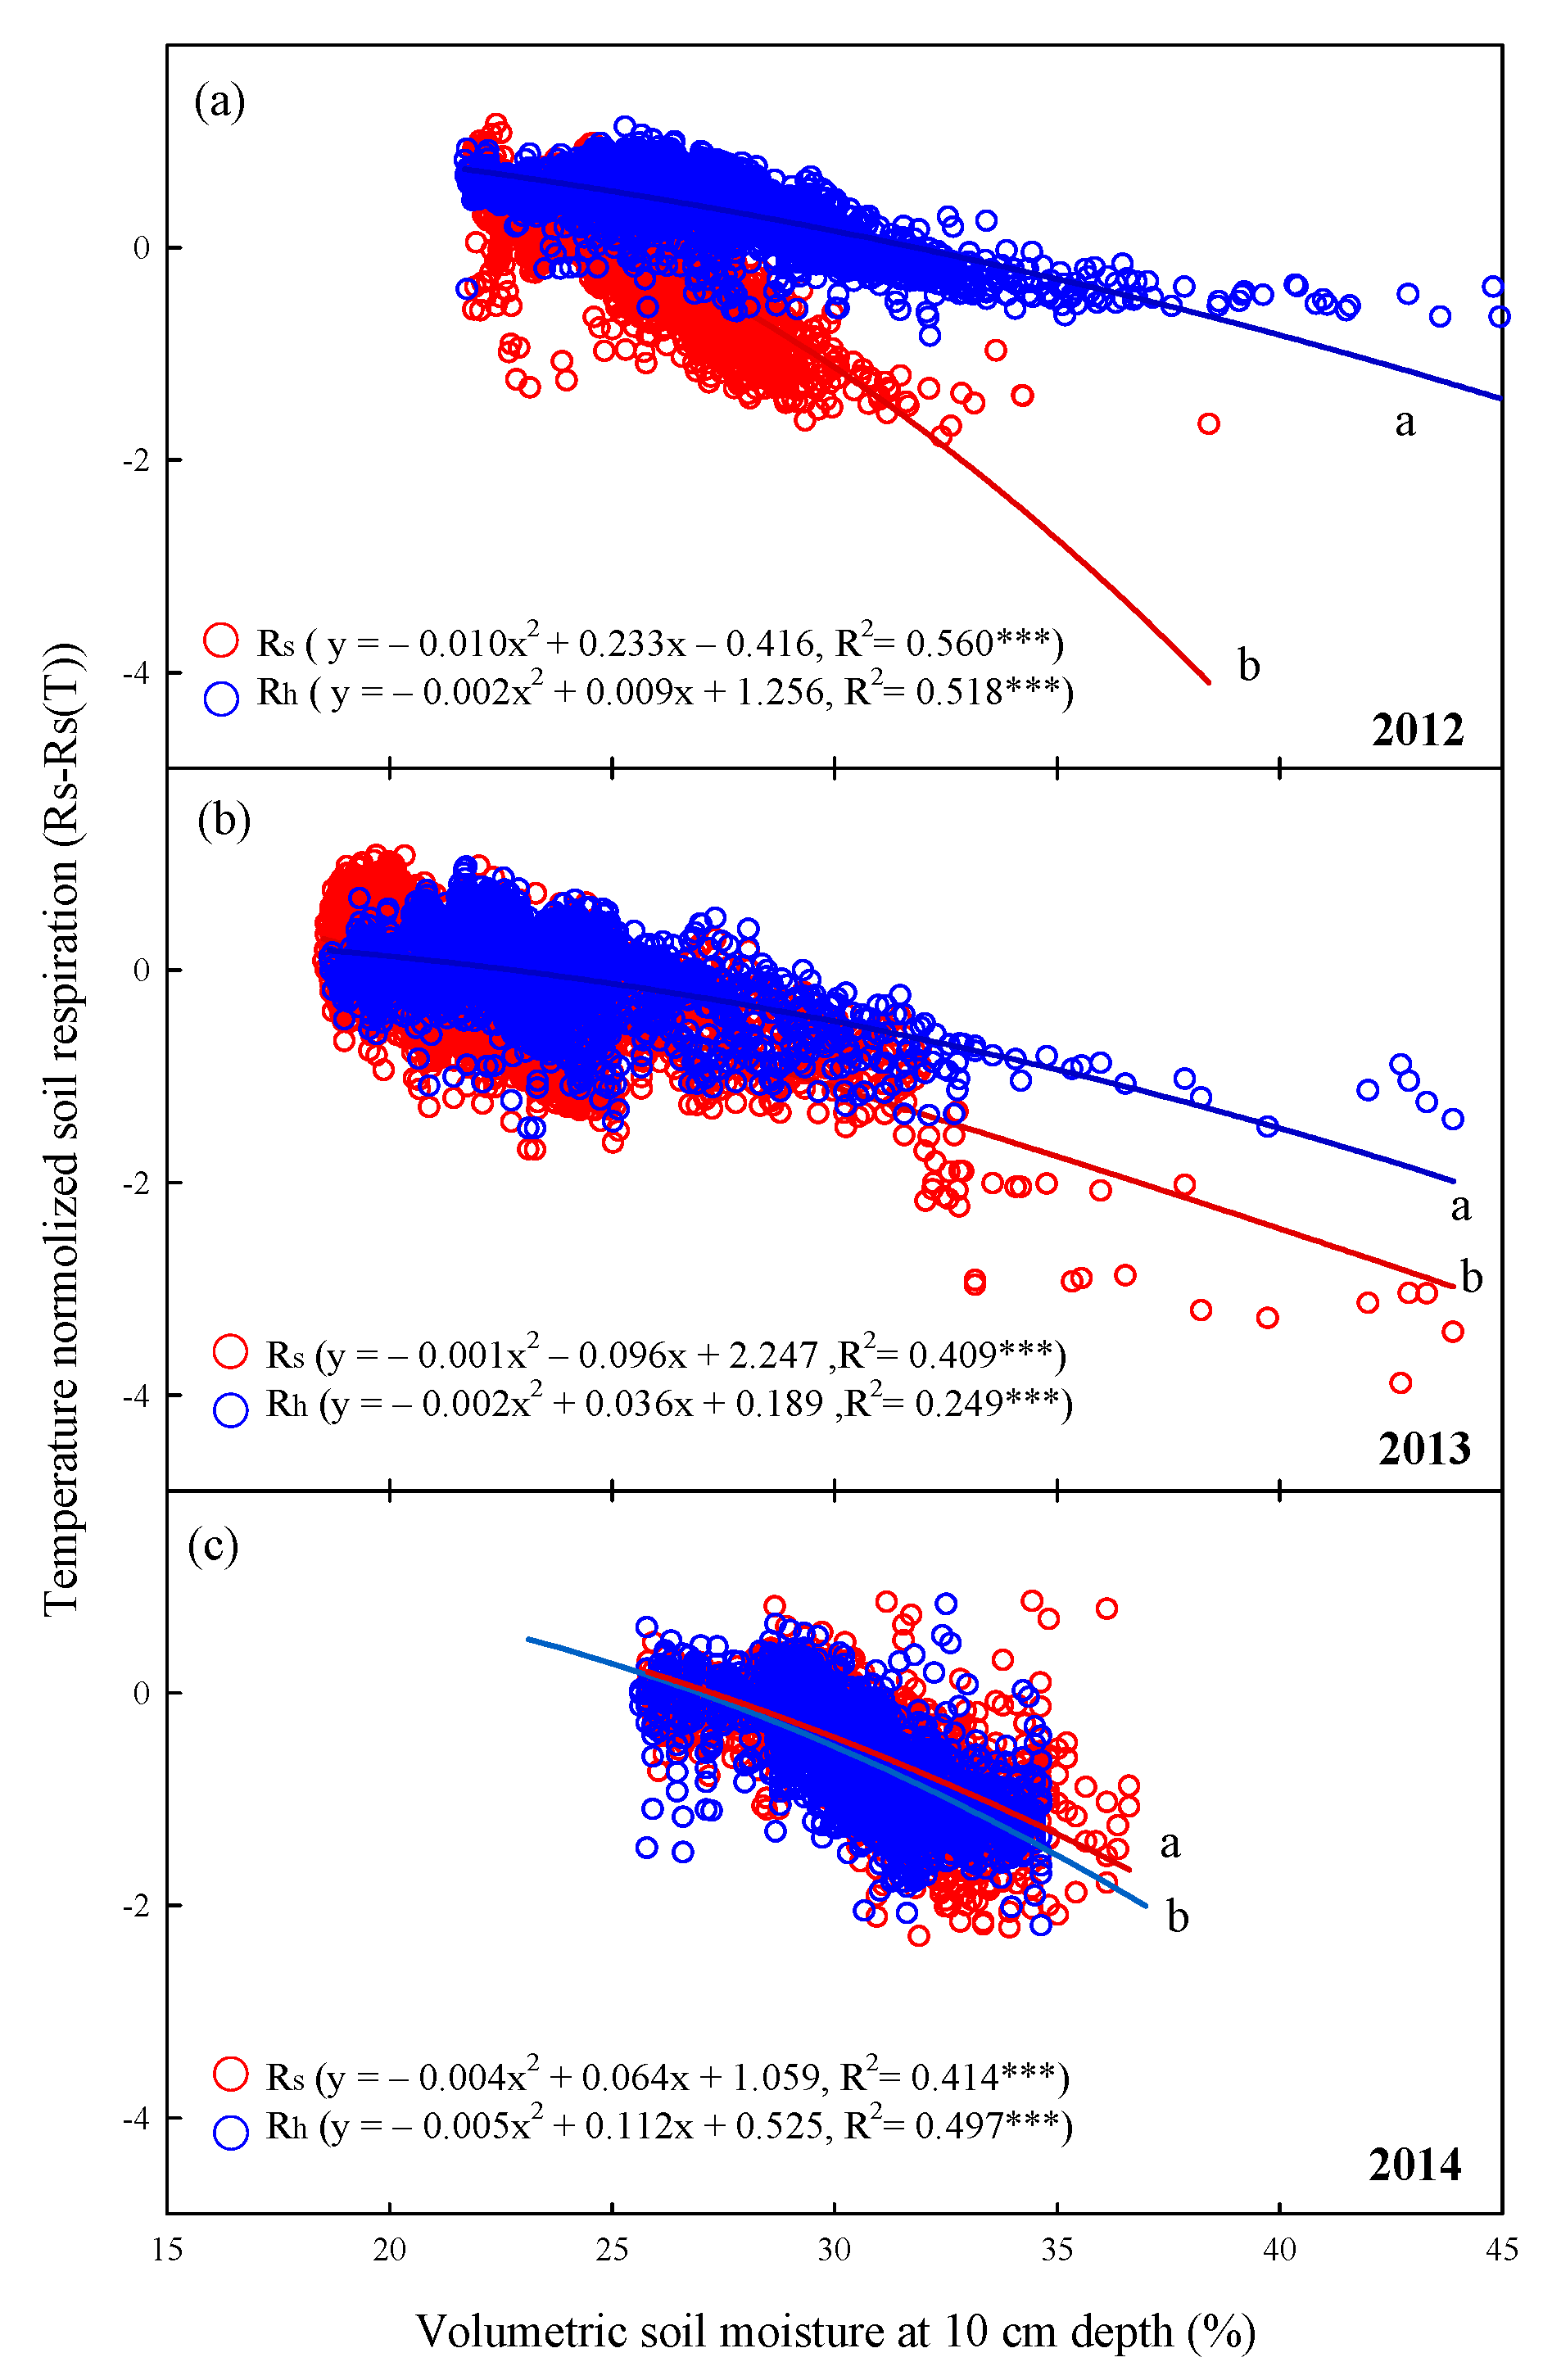
The relationships between temperature-normalized soil respiration and volumetric soil moisture in summer over the 3-year period were calculated (p < 0.001, Figure 8). The regression curves of the relationships with volumetric soil moisture at 10 cm depth of Rs exhibited significant differences with those of Rh in each year (p < 0.05, Figure 8a–c). Specifically, the coefficients of determination (R2) of Rs and Rh between 2012 and 2014 varied from 0.409 to 0.560 and from 0.249 to 0.518, respectively (Figure 8). Temperature-normalized Rs and Rh values clearly demonstrated a soil moisture threshold, above which Rs was limited by soil moisture, whereas, below this threshold, soil moisture had no influence on Rs variations.
3.6. Environmental Factors, Rs, and Rh Magnitude in Summer
The mean summer value of soil temperature in 2014 was significantly higher than those in 2012 and 2013 (p < 0.05, Figure 9a). Furthermore, the mean summer value of volumetric soil moisture in 2012 was significantly higher than those in 2013 and 2014 (p < 0.05, Figure 9c). The sum of summer rainfall decreased with increasing years.
After excluding data from 2011, the mean summer values of Rs and Rh between 2012 and 2014 were 3.04 ± 0.53, 3.33 ± 0.59, and 3.63 ± 0.42 and 2.04 ± 0.38, 2.35 ± 0.43, and 2.64 ± 0.28 μmol m−2 s−1, respectively (Figure 9d). The percentages of Rh/Rs between 2012 and 2014 were 67.1%, 70.7%, and 72.7%, respectively. The mean summer values of Rs were significantly higher than those of Rh in each year (p < 0.0.5, Figure 9d). The mean summer values of both Rs and Rh significantly increased with increasing years (p < 0.05, Figure 9d).
4. Discussion
4.1. Annual Rs and Rh Magnitudes for the Forest Ecosystem Carbon Magnitudes
The annual mean Rs values were approximately 10.8 (ranging from 10.7 to 10.9) t C ha−1, with Rh contributing approximately 74.6% (ranging from 71.7% to 80.2%) during the study period (2012–2014). The annual Rs values were within the range of other reported estimates from subtropical forests in Southwest China (12.5 t C ha−1 y−1 [26], South China (10.2 t C ha−1 y−1 [35], and Taiwan (8.93 t C ha−1 y−1) [36].
4.2. Effects of Environmental Factors (e.g., Soil Temperature, Soil Moisture, and Rainfall) on Interannual Changes in Rs and Rh
In general, interannual changes in Rs are predominantly controlled by soil temperature [14,15,36,37,38]. However, high rainfall occurred from 2012–2013, which resulted in well-watered conditions in the Xitou area (Figure 2). Therefore, a weak relationship between Rs and soil temperature was observed in summer due to the high rainfall frequency and well-watered conditions (Figure 2, Figure 7 and Figure 9 and Table 1).
Soil moisture exhibited a concave-down relationship with temperature-normalized soil respiration (Figure 5). The relationships of Rs and Rh with soil moisture were weaker than those with soil temperature in terms of interannual changes. Cook et al. [39] reported that microbial decomposition was promoted in the early summer rainy season and was inhibited in late summer drought conditions. A shortened dry spring occurred in 2013, with the lowest mean soil moisture in March (28%, versus an annual mean of 36%, Figure 2). The relatively lower soil moisture may have reduced microorganism activity and root respiration, especially in the initial growing season. Therefore, soil temperatures showed a weaker relationship with Rs and Rh in 2013 than in the other years (Figure 4).
Pulse increases in Rs after rainfall events have been demonstrated in incubation [40], temperate forests [5,12,41,42,43,44], semiarid steppes [45], and subtropical forests [46]. Rainfall events stimulate the mineralization of soil organic carbon by microorganisms, which lead to rapid CO2 release (Figure 6a,b). On the other hand, when a rainfall event occurred, rainwater filled the soil pores and forced CO2 from the soil pores into the atmosphere, which resulted in increased soil respiration. However, high rainfall occurred and brought strong rainfall events due to the monsoons in this area during the research period (Table 1); therefore, high soil moisture is the threshold to restrict Rs and Rh (Figure 8c). The strong rainfall events caused rainwater to not only enter the soil pores, but also to cover soil surfaces, which resulted in limited oxygen and CO2 diffusion. Therefore, oxygen deficiency in soil pores decreased soil microorganism activity and consequently restricted CO2 production, as shown in Figure 6c,d. On the other hand, the mean summer values of both Rs and Rh significantly increased with increasing years, which resulted in decreased rainfall sums and soil moisture in summer (Figure 9). Annual rainfall amounts and strong rainfall events tended to decrease (Table 1), which indicated a decrease in water cover of the soil surface and an increase in Rs and Rh releases from the soil. However, both Rs and Rh were negatively correlated with soil moisture, which indicated that soil moisture in the studied forest usually represented saturated conditions (Figure 8). The reason for this finding may be that the higher MAP in this study area when compared to those in previous subtropical forest studies (i.e., MAP 1243 mm, Yang et al. [47]; MAP 1,840 mm, Tan et al. [26]), and the subsequent high soil moisture, suppressed Rs and Rh.
4.3. Trench Treatment and Interannual Changes in Rh
Rh accounted for more than 70% of Rs (Figure 3d), and the contribution of Rr was less than 30% of Rs. The contribution of Rh to Rs in the study was in the upper range of those in previous reports [48]. The trench method is widely used to measure Rh [5]. The initial Rh was high due to the disturbances and decomposition of the dying roots following installation of the trench treatment (Figure 2 and Figure 3d). Ohashi et al. [49] reported that the acceleration of microbial respiration offset the decline in root respiration in the first year in a 10-year-old Japanese cedar forest. The rapid decomposition of dead roots may have offset the decrease in root respiration at this study site. Makita et al. [30] indicated that Rh is sensitive to seasonal rainfall patterns because soil moisture strongly affects microbial activity. However, the studied forest is mature (64 years old); at this forest age, the biomass of fine roots tends to decrease, and the biomass of coarse roots tends to increase. Zhang and Wang [50] reported that the decomposition rates of fine and coarse roots were different among conifer species. Nevertheless, the fine roots rapidly decomposed in the trench treatment, and the coarse roots consequently decomposed and offset the decrease in root respiration. Diaz-Pines et al. [51] suggested that the influence of dead root decomposition continued for several years after the installation of a trench treatment. In our study, the interannual value of Rh gradually decreased from 2012 (6.6 t C ha−1 y−1) to 2014 (7.8 t C ha−1 y−1), which resulted in a decreased biomass of dead roots (Figure 9d).
4.4. Interannual Changes in Temperature Sensitivity
Seasonal patterns in temperature sensitivity may be related to the decomposition of soil C and microbial metabolic activity [30,52]. Lee et al. [53] found similar results: Rs was lower in spring and early summer and higher in autumn. This difference may be explained by seasonal changes in soil heat transport and CO2 fluxes [30]. Rs contributions from root and microbial activity are reduced due to the low temperatures and soil moisture in deeper soil layers in spring. In contrast, Rs increased in response to the warming of deeper soil layers in late summer and autumn, which resulted in the higher Q10 observed in summer (Figure 7). Soil heat increases and decreases from the top downward in spring and in autumn, respectively. Therefore, the variations in CO2 production with soil depth during the growing season may affect heat-transport-based hysteresis [30]. In this study, the mean Q10 values were 2.38 (ranging from 1.77 to 2.65) and 2.02 (ranging from 1.71 to 2.34) for Rs and Rh, respectively, which were similar to the mean values found for coniferous forests (1.69) [54], Japanese cedar plantations (1.91) [40,53] and subtropical China (1.82) [40] but were lower than the mean value estimated for global forest ecosystems (3.0) [55]. The Q10 values observed in this study, which were lower than those in global forest ecosystems, may imply that the interannual Rs caused by high rainfall in this study is less temperature-dependent than the Rs values in global forest ecosystems.
5. Conclusions
The present study provides important information for understanding the dominant cause of variations in soil respiration and how the dominant cause changes among years. The Rs and Rh values in this Japanese cedar plantation showed high interannual variations. Based on the 4-year continuous monitoring results, the primary environmental factor that controlled interannual variations in both Rs and Rh was soil temperature. With frequent, high rainfall and minimal drought in this study area, soil moisture may be the limiting factor for annual Rs and Rh. However, the temperature sensitivity of interannual Rs and Rh was lower than the mean value estimated for global forest ecosystems and may have been affected by the high rainfall in the study area. We did find that a significant effect of soil moisture in the studied forest usually occurred under saturated conditions, and high rainfall events inhibited both Rs and Rh, especially in summer. In conclusion, our results suggest that the annual mean Q10 values under high rainfall in this study were lower than those of global forest ecosystems. These results also alleviate the lack of data on respiration in the Asian monsoon region under high rainfall conditions.
Author Contributions
Conceptualization, J.-C.Y., P.-N.C., Y.-J.L., M.-J.T., and Y.-N.W.; methodology, J.-C.Y., P.-N.C., Y.-J.L., M.-J.T., and Y.-N.W.; formal analysis, J.-C.Y., and Y.-J.L.; writing—original draft preparation, J.-C.Y., and P.-N.C.; writing—review and editing, J.-C.Y., P.-N.C., Y.-J.L., M.-J.T., and Y.-N.W.; visualization, J.-C.Y., P.-N.C., and Y.-J.L.; funding acquisition, P.-N.C. All authors have read and agreed to the published version of the manuscript.
Funding
This research was partially supported by the Ministry of Science Technology, grant number NSC 102-2621-M-002-022.
Data Availability Statement
The data presented in this study are available on request from the corresponding author. The data are not publicly available due to privacy.
Acknowledgments
This work was financially supported by the Experimental Forest, National Taiwan University. This work was also partially supported by the Ministry of Science Technology (NSC 102-2621-M-002-022). We also thank Chen-Seng Chang and Chih-Yuan Hong for their help with the field and laboratory components of this work. Data from the publication are available from the Experimental Forest, National Taiwan University.
Conflicts of Interest
The authors declare no conflict of interest.
References
- Lal, R.; Smith, P.; Jungkunst, H.F.; Mitsch, W.J.; Lehmann, J.; Nair, P.K.R.; McBratney, A.B.; Sa, J.C.D.; Schneider, J.; Zinn, Y.L.; et al. The carbon sequestration potential of terrestrial ecosystems. J. Soil Water Conserv. 2018, 73, A145–A152. [Google Scholar] [CrossRef] [Green Version]
- Kindermann, G.E.; Mcallum, I.; Fritz, S.; Obersteiner, M. A global forest growing stock, biomass and carbon map based on FAO statistics. Silva Fenn. 2008, 42, 387–396. [Google Scholar] [CrossRef] [Green Version]
- Dixon, R.K.; Solomon, A.M.; Brown, S.; Houghton, R.A.; Trexier, M.C.; Wisniewski, J. Carbon pools and flux of global forest ecosystems. Science 1994, 263, 185–190. [Google Scholar] [CrossRef]
- Bond-Lamberty, B.; Thomson, A. Temperature-associated increases in the global soil respiration record. Nature 2010, 464, 579. [Google Scholar] [CrossRef] [PubMed]
- Teramoto, M.; Liang, N.; Ishida, S.; Zeng, J. Long-term stimulatory warming effect on soil heterotrophic respiration in a cool-temperate broad-leaved deciduous forest in northern Japan. J. Geophys. Res. Biogeosci. 2018, 123, 1161–1177. [Google Scholar] [CrossRef]
- Teramoto, M.; Liang, N.S.; Takahashi, Y.; Zeng, J.Y.; Saigusa, N.; Ide, R.; Zhao, X. Enhanced understory carbon flux components and robustness of net CO2 exchange after thinning in a larch forest in central Japan. Agric. For. Meteorol. 2019, 274, 106–117. [Google Scholar] [CrossRef]
- Yan, T.; Song, H.H.; Wang, Z.Q.; Teramoto, M.; Wang, J.S.; Liang, N.S.; Ma, C.; Sun, Z.Z.; Xi, Y.; Li, L.L.; et al. Temperature sensitivity of soil respiration across multiple time scales in a temperate plantation forest. Sci. Total Environ. 2019, 688, 479–485. [Google Scholar] [CrossRef] [PubMed]
- Law, B.E.; Kelliher, F.M.; Baldocchi, D.D.; Anthoni, P.M.; Irvine, J.; Moore, D.; Van Tuyl, S. Spatial and temporal variation in respiration in a young ponderosa pine forests during a summer drought. Agric. For. Meteorol. 2001, 110, 27–43. [Google Scholar] [CrossRef]
- Valentini, R.; Matteucci, G.; Dolman, A.J.; Schulze, E.D.; Rebmann, C.; Moors, E.J.; Granier, A.; Gross, P.; Jensen, N.O.; Pilegaard, K.; et al. Respiration as the main determinant of carbon balance in European forests. Nature 2000, 404, 861–865. [Google Scholar] [CrossRef]
- Ferre, C.; Zenone, T.; Comolli, R.; Seufert, G. Estimating heterotrophic and autotrophic soil respiration in a semi-natural forest of Lombardy, Italy. Pedobiologia 2012, 55, 285–294. [Google Scholar] [CrossRef]
- Zhu, M.X.; Xue, W.L.; Xu, H.; Gao, Y.; Chen, S.N.; Li, B.; Zhang, Z.Q. Diurnal and seasonal variations in soil respiration of four plantation forests in an urban park. Forests 2019, 10, 513. [Google Scholar] [CrossRef] [Green Version]
- Liang, N.; Hirano, T.; Zheng, Z.M.; Tang, J.; Fujinuma, Y. Soil CO2 efflux of a larch forest in northern Japan. Biogeosciences 2010, 7, 3447–3457. [Google Scholar] [CrossRef] [Green Version]
- Liang, N.S.; Teramoto, M.; Takagi, M.; Zeng, J.Y. Data descriptor: High-resolution data on the impact of warming on soil CO2 efflux from an Asian monsoon forest. Sci. Data 2017, 4, 11. [Google Scholar] [CrossRef] [Green Version]
- Teramoto, M.; Liang, N.S.; Takagi, M.; Zeng, J.Y.; Grace, J. Sustained acceleration of soil carbon decomposition observed in a 6-year warming experiment in a warm-temperate forest in southern Japan. Sci. Rep. 2016, 6, 14. [Google Scholar] [CrossRef] [PubMed]
- Teramoto, M.; Liang, N.S.; Zeng, J.Y.; Saigusa, N.; Takahashi, Y. Long-term chamber measurements reveal strong impacts of soil temperature on seasonal and inter-annual variation in understory CO2 fluxes in a Japanese larch (Larix kaempferi Sarg.) forest. Agric. For. Meteorol. 2017, 247, 194–206. [Google Scholar] [CrossRef]
- Zhao, Y.-L.; Goldberg, S.D.; Xu, J.-C.; Harrison, R.D. Spatial and seasonal variation in soil respiration along a slope in a rubber plantation and a natural forest in Xishuangbanna, Southwest China. J. Mt. Sci. 2018, 15, 695–707. [Google Scholar] [CrossRef]
- Kirschbaum, M.U.F. The temperature dependence of organic matter decomposition: Seasonal temperature variations turn a sharp short-term temperature response into a more moderate annually averaged response. Glob. Chang. Biol. 2010, 16, 2117–2129. [Google Scholar] [CrossRef]
- Goldberg, S.D.; Zhao, Y.; Harrison, R.D.; Monkai, J.; Li, Y.; Chau, K.; Xu, J. Soil respiration in sloping rubber plantations and tropical natural forests in Xishuangbanna, China. Agric. Ecosys. Environ. 2017, 249, 237–246. [Google Scholar] [CrossRef]
- Liu, X.F.; Chen, S.D.; Yang, Z.J.; Lin, C.F.; Xiong, D.C.; Lin, W.S.; Xu, C.; Chen, G.S.; Xie, J.S.; Li, Y.Q.; et al. Will heterotrophic soil respiration be more sensitive to warming than autotrophic respiration in subtropical forests? Eur. J. Soil Sci. 2019, 70, 655–663. [Google Scholar] [CrossRef]
- Lloyd, J.; Taylor, J.A. On the temperature-dependence of soil respiration. Funct. Ecol. 1994, 8, 315–323. [Google Scholar] [CrossRef]
- Machmuller, M.B.; Ballantyne, F.; Markewitz, D.; Thompson, A.; Wurzburger, N.; Frankson, P.T.; Mohan, J.E. Temperature sensitivity of soil respiration in a low-latitude forest ecosystem varies by season and habitat but is unaffected by experimental warming. Biogeochemistry 2018, 141, 63–73. [Google Scholar] [CrossRef]
- Hsieh, I.F.; Kume, T.; Lin, M.Y.; Cheng, C.H.; Miki, T. Characteristics of soil CO2 efflux under an invasive species, Moso bamboo, in forests of central Taiwan. Trees Struct. Funct. 2016, 30, 1749–1759. [Google Scholar] [CrossRef]
- Huang, S.D.; Ye, G.F.; Lin, J.; Chen, K.T.; Xu, X.; Ruan, H.H.; Tan, F.L.; Chen, H.Y.H. Autotrophic and heterotrophic soil respiration responds asymmetrically to drought in a subtropical forest in the Southeast China. Soil Biol. Biochem. 2018, 123, 242–249. [Google Scholar] [CrossRef]
- Shi, L.L.; Feng, W.T.; Jing, X.; Zang, H.D.; Mortimer, P.; Zou, X.M. Contrasting responses of soil fungal communities and soil respiration to the above- and below-ground plant C inputs in a subtropical forest. Eur. J. Soil Sci. 2019, 70, 751–764. [Google Scholar] [CrossRef]
- Singh, N.; Parida, B.R. Environmental factors associated with seasonal variations of night-time plant canopy and soil respiration fluxes in deciduous conifer forest, Western Himalaya, India. Trees Struct. Funct. 2019, 33, 599–613. [Google Scholar] [CrossRef]
- Tan, Z.-H.; Zhang, Y.-P.; Liang, N.; Song, Q.-H.; Liu, Y.-H.; You, G.-Y.; Li, L.-H.; Yu, L.; Wu, C.-S.; Lu, Z.-Y.; et al. Soil respiration in an old-growth subtropical forest: Patterns, components, and controls. J. Geophys. Res. Atmos. 2013, 118, 2981–2990. [Google Scholar] [CrossRef]
- Adachi, M.; Bekku, Y.S.; Rashidah, W.; Okuda, T.; Koizumi, H. Differences in soil respiration between different tropical ecosystems. Appl. Soil Ecol. 2006, 34, 258–265. [Google Scholar] [CrossRef]
- Kosugi, Y.; Mitani, T.; Ltoh, M.; Noguchi, S.; Tani, M.; Matsuo, N.; Takanashi, S.; Ohkubo, S.; Nik, A.R. Spatial and temporal variation in soil respiration in a Southeast Asian tropical rainforest. Agric. For. Meteorol. 2007, 147, 35–47. [Google Scholar] [CrossRef]
- Adachi, M.; Ishida, A.; Bunyavejchewin, S.; Okuda, T.; Koizumi, H. Spatial and temporal variation in soil respiration in a seasonally dry tropical forest, Thailand. J. Trop. Ecol. 2009, 25, 531–539. [Google Scholar] [CrossRef]
- Makita, N.; Kosugi, Y.; Sakabe, A.; Kanazawa, A.; Ohkubo, S.; Tani, M. Seasonal and diurnal patterns of soil respiration in an evergreen coniferous forest: Evidence from six years of observation with automatic chambers. PLoS ONE 2018, 13, e0192622. [Google Scholar] [CrossRef] [PubMed] [Green Version]
- Reichstein, M.; Bahn, M.; Ciais, P.; Frank, D.; Mahecha, M.D.; Seneviratne, S.I.; Zscheischler, J.; Beer, C.; Buchmann, N.; Frank, D.C.; et al. Climate extremes and the carbon cycle. Nature 2013, 500, 287–295. [Google Scholar] [CrossRef]
- Wu, C.C.; Kuo, Y.H. Typhoons affecting Taiwan: Current understanding and future challenges. B. Am. Meteorol. Soc. 1999, 80, 67–80. [Google Scholar] [CrossRef]
- Yashiro, Y.; Lee, N.Y.M.; Ohtsuka, T.; Shizu, Y.; Saitoh, T.M.; Koizumi, H. Biometric-based estimation of net ecosystem production in a mature Japanese cedar (Cryptomeria japonica) plantation beneath a flux tower. J. Plant Res. 2010, 123, 463–472. [Google Scholar] [CrossRef]
- Cheng, C.H.; Hung, C.Y.; Chen, C.P.; Pei, C.W. Biomass carbon accumulation in aging Japanese cedar plantations in Xitou, central Taiwan. Bot. Stud. 2013, 54, 60. [Google Scholar] [CrossRef] [Green Version]
- Yan, J.H.; Zhang, D.Q.; Zhou, G.Y.; Liu, J.X. Soil respiration associated with forest succession in subtropical forests in Dinghushan Biosphere Reserve. Soil Biol. Biochem. 2009, 41, 991–999. [Google Scholar] [CrossRef]
- Huang, Y.H.; Hung, C.Y.; Lin, I.R.; Kume, T.; Menyailo, O.V.; Cheng, C.H. Soil respiration patterns and rates at three Taiwanese forest plantations: Dependence on elevation, temperature, precipitation, and litterfall. Bot. Stud. 2017, 58, 49. [Google Scholar] [CrossRef] [PubMed] [Green Version]
- Song, Q.H.; Tan, Z.H.; Zhang, Y.P.; Cao, M.; Sha, L.Q.; Tang, Y.; Liang, N.S.; Schaefer, D.; Zhao, J.F.; Zhao, J.B.; et al. Spatial heterogeneity of soil respiration in a seasonal rainforest with complex terrain. iForest 2013, 6, 65–72. [Google Scholar] [CrossRef]
- Chang, S.-C.; Tseng, K.-H.; Hsia, Y.-J.; Wang, C.-P.; Wu, J.-T. Soil respiration in a subtropical montane cloud forest in Taiwan. Agric. For. Meteorol. 2008, 148, 788–798. [Google Scholar] [CrossRef]
- Cook, E.R.; Anchukaitis, K.J.; Buckley, B.M.; D’Arrigo, R.D.; Jacoby, G.C.; Wright, W.E. Asian monsoon failure and megadrought during the last millennium. Science 2010, 328, 486–489. [Google Scholar] [CrossRef] [Green Version]
- Yu, S.Q.; Chen, Y.Q.; Zhao, J.; Fu, S.L.; Li, Z.; Xia, H.P.; Zhou, L.X. Temperature sensitivity of total soil respiration and its heterotrophic and autotrophic components in six vegetation types of subtropical China. Sci. Total Environ. 2017, 607, 160–167. [Google Scholar] [CrossRef] [PubMed]
- Lee, X.; Wu, H.-J.; Sigler, J.; Oishi, C.; Siccama, T. Rapid and transient response of soil respiration to rain. Glob. Chang. Biol. 2004, 10, 1017–1026. [Google Scholar] [CrossRef]
- Xu, L.; Baldocchi, D.D.; Tang, J. How soil moisture, rain pulses, and growth alter the response of ecosystem respiration to temperature. Glob. Biogeochem. Cycles 2004, 18. [Google Scholar] [CrossRef]
- Wang, Q.; He, N.P.; Liu, Y.; Li, M.L.; Xu, L. Strong pulse effects of precipitation events on soil microbial respiration in temperate forests. Geoderma 2016, 275, 67–73. [Google Scholar] [CrossRef]
- Song, H.H.; Yan, T.; Wang, J.S.; Sun, Z.Z. Precipitation variability drives the reduction of total soil respiration and heterotrophic respiration in response to nitrogen addition in a temperate forest plantation. Biol. Fert. Soils 2020, 56, 273–279. [Google Scholar] [CrossRef]
- Yan, L.M.; Chen, S.P.; Xia, J.Y.; Luo, Y.Q. Precipitation regime shift enhanced the rain pulse effect on soil respiration in a semi-arid steppe. PLoS ONE 2014, 9, e104217. [Google Scholar] [CrossRef] [PubMed] [Green Version]
- Deng, Q.; Zhang, D.; Han, X.; Chu, G.; Zhang, Q.; Hui, D. Changing rainfall frequency rather than drought rapidly alters annual soil respiration in a tropical forest. Soil Biol. Biochem. 2018, 121, 8–15. [Google Scholar] [CrossRef]
- Yang, K.J.; Yang, Y.L.; Xu, Z.F.; Wu, Q.G. Soil respiration in a subtropical forest of southwestern China: Components, patterns and controls. PLoS ONE 2018, 13, e0204341. [Google Scholar] [CrossRef]
- Hanson, P.; Qvortrup, K.; Magnusson, S.P. The superficial anulus fibrosus ligament—An incipient description of a separate ligament between the lumbar anterior longitudinal ligament and the intervertebral disc. Cells Tissues Organs 2000, 167, 259–265. [Google Scholar] [CrossRef]
- Ohashi, M.; Gyokusen, K.; Saito, A. Contribution of root respiration to total soil respiration in a Japanese cedar (Cryptomeria japonica D. Don) artificial forest. Ecol. Res. 2000, 15, 323–333. [Google Scholar] [CrossRef]
- Zhang, Q.; Katul, G.G.; Oren, R.; Daly, E.; Manzoni, S.; Yang, D. The hysteresis response of soil CO2 concentration and soil respiration to soil temperature. J. Geophys. Res. Biogeosci. 2015, 120, 1605–1618. [Google Scholar] [CrossRef]
- Diaz-Pines, E.; Schindlbacher, A.; Pfeffer, M.; Jandl, R.; Zechmeister-Boltenstern, S.; Rubio, A. Root trenching: A useful tool to estimate autotrophic soil respiration? A case study in an Austrian mountain forest. Eur. J. For. Res. 2010, 129, 101–109. [Google Scholar] [CrossRef] [Green Version]
- Makita, N.; Kawamura, A. Temperature sensitivity of microbial respiration of fine root litter in a temperate broad-leaved forest. PLoS ONE 2015, 10, e0117694. [Google Scholar] [CrossRef] [PubMed]
- Lee, M.S.; Lee, J.S.; Koizumi, H. Temporal variation in CO2 efflux from soil and snow surfaces in a Japanese cedar (Cryptomeria japonica) plantation, central Japan. Ecol. Res. 2008, 23, 777–785. [Google Scholar] [CrossRef]
- Zhou, T.; Shi, P.J.; Hui, D.F.; Luo, Y.Q. Global pattern of temperature sensitivity of soil heterotrophic respiration (Q (10)) and its implications for carbon-climate feedback. J. Geophys. Res. Biogeosci. 2009, 114. [Google Scholar] [CrossRef] [Green Version]
- Wang, W.; Chen, W.L.; Wang, S.P. Forest soil respiration and its heterotrophic and autotrophic components: Global patterns and responses to temperature and precipitation. Soil Biol. Biochem. 2010, 42, 1236–1244. [Google Scholar]
Figure 1.
Long-term monthly average air temperatures and monthly rainfall at the Xitou agricultural meteorological station (1941–2012).
Figure 1.
Long-term monthly average air temperatures and monthly rainfall at the Xitou agricultural meteorological station (1941–2012).

Figure 2.
Time series for (a) environmental data (e.g., soil temperature, soil moisture, and total daily rainfall) and (b) soil respiration data (e.g., Rs and Rh).
Figure 2.
Time series for (a) environmental data (e.g., soil temperature, soil moisture, and total daily rainfall) and (b) soil respiration data (e.g., Rs and Rh).

Figure 3.
Mean annual values of (a) soil temperature, (b) soil moisture, and (c) annual rainfall and mean annual values of (d) soil respiration (Rs) and heterotrophic respiration (Rh). Different capital letters indicate differences among treatments within the same year at p < 0.05. Different lowercase letters indicate differences among years at p < 0.05. Error bars indicate standard deviations (SD).

Figure 4.
Relationships between half-hourly mean soil respiration (Rs, μmol CO2 m−2 s−1), heterotrophic respiration (Rh), and hourly soil temperature at 5 cm depth (°C) in (a) 2011, (b) 2012, (c) 2013, and (d) 2014. Asterisks indicate a significance: *** p < 0.001. Different letters indicate differences between regression lines within the same year at p < 0.05.

Figure 5.
Relationships between half-hourly temperature-normalized soil respiration (Rs), heterotrophic respiration (Rh), and hourly volumetric soil moisture at 10 cm depth (%) in (a) 2011, (b) 2012, (c) 2013, and (d) 2014. Asterisks indicate significance: *** p < 0.001. Different letters indicate differences between regression lines within the same year at p < 0.05.

Figure 6.
Hourly environmental factors (a,c) for soil temperature, soil moisture and rainfall. Pulse increases and decreases in soil respiration data were related to normal (a,b) and strong (c,d) rainfall events. The blue arrows in (b) and (d) represent pulse increases in respiration, while the red arrows in (d) represent pulse decreases in soil respiration caused by strong rainfall events.

Figure 7.
Relationships between hourly mean soil respiration (Rs, μmol CO2 m−2 s−1) and heterotrophic respiration (Rh) and half-hourly soil temperature at 5 cm depth (°C) in summer (June–August) in (a) 2012, (b) 2013, and (c) 2014. Asterisks indicate significance: *** p < 0.001; ** p < 0.01. Different letters indicate differences between regression lines within the same year at p < 0.05.

Figure 8.
Relationships between half-hourly temperature-normalized soil respiration (Rs) and heterotrophic respiration (Rh) and hourly volumetric soil moisture at 10 cm depth (%) in summer (June–August) in (a)2012, (b) 2013, and (c) 2014. Asterisks indicate significance: *** p < 0.001. Different letters indicate differences between regression lines within the same year at p < 0.05.

Figure 9.
Mean values of (a) soil temperature, (b) soil moisture, (c) sum of rainfall, (d) mean soil respiration (Rs), and heterotrophic respiration (Rh) in the summer season (June–August). Different capital letters indicate differences among years in the same treatment at p < 0.05. Different lowercase letters indicate differences between treatments in the same year at p < 0.05. Error bars indicate standard deviations (SD).


Table 1.
Rainfall event characteristics in the study area. Numbers in parentheses indicate percentages of annual rainfall.
Table 1.
Rainfall event characteristics in the study area. Numbers in parentheses indicate percentages of annual rainfall.
| Year | Total (mm) | 0.5–10 mm | 10–20 mm | 20–50 mm | >50 mm |
|---|---|---|---|---|---|
| 2012 | 3267 | 315 (9.6%) | 446 (13.6%) | 632 (19.3%) | 1875 (57.4%) |
| 2013 | 2403 | 324 13.5%) | 358 (14.9%) | 460 (19.1%) | 1261 (52.5%) |
| 2014 | 2062 | 338 (16.4%) | 249 (12.1%) | 532 (25.7%) | 945 (45.8%) |
Publisher’s Note: MDPI stays neutral with regard to jurisdictional claims in published maps and institutional affiliations. |
© 2021 by the authors. Licensee MDPI, Basel, Switzerland. This article is an open access article distributed under the terms and conditions of the Creative Commons Attribution (CC BY) license (http://creativecommons.org/licenses/by/4.0/).
Share and Cite
MDPI and ACS Style
Yu, J.-C.; Chiang, P.-N.; Lai, Y.-J.; Tsai, M.-J.; Wang, Y.-N. High Rainfall Inhibited Soil Respiration in an Asian Monsoon Forest in Taiwan. Forests 2021, 12, 239. https://0-doi-org.brum.beds.ac.uk/10.3390/f12020239
AMA Style
Yu J-C, Chiang P-N, Lai Y-J, Tsai M-J, Wang Y-N. High Rainfall Inhibited Soil Respiration in an Asian Monsoon Forest in Taiwan. Forests. 2021; 12(2):239. https://0-doi-org.brum.beds.ac.uk/10.3390/f12020239
Chicago/Turabian StyleYu, Jui-Chu, Po-Neng Chiang, Yen-Jen Lai, Ming-Jer Tsai, and Ya-Nan Wang. 2021. "High Rainfall Inhibited Soil Respiration in an Asian Monsoon Forest in Taiwan" Forests 12, no. 2: 239. https://0-doi-org.brum.beds.ac.uk/10.3390/f12020239
Note that from the first issue of 2016, this journal uses article numbers instead of page numbers. See further details here.