
Precommercial Thinning Increases Spruce Yields in Boreal Mixedwoods in Alberta, Canada


1
Department of Renewable Resources, University of Alberta, Edmonton, AB T6G 2H1, Canada
2
Westfraser Mills Ltd., Hinton, AB T7V 1V7, Canada
3
The Forest Growth Organization of Western Canada, Hinton, AB T7V 1V3, Canada
*
Author to whom correspondence should be addressed.
Forests 2021, 12(4), 412; https://0-doi-org.brum.beds.ac.uk/10.3390/f12040412
Submission received: 2 March 2021
/
Revised: 20 March 2021
/
Accepted: 26 March 2021
/
Published: 30 March 2021
(This article belongs to the Special Issue Silviculture and Management of Boreal Forests)
Abstract
:A few studies in young mixedwood stands demonstrate that precommercial thinning of aspen at early ages can improve the growth of spruce and increase stand resilience to drought. However, information on tree and stand responses to thinning in older mixedwood stands is lacking. To address this need, a study was initiated in 2008 in Alberta, Canada in 14 boreal mixedwood stands (seven each at ages 17 and 22). This study investigated growth responses following thinning of aspen to five densities (0, 1000, 2500, 5000 stems ha−1 and unthinned (control)). Measurements were collected in the year of establishment, and three and eight years later. Mortality of aspen in the unthinned plots was greater than in the thinned plots which were not significantly different amongst each other. Eight years following treatment, aspen diameter was positively influenced by thinning, while there was no effect on aspen height. The density of aspen had no significant effect on the survival of planted spruce. Spruce height and diameter growth increased with both aspen thinning intensity and time since treatment. Differentiation among treatments in spruce diameter growth was evident three years from treatment, while differentiation in height was not significant until eight years following treatment. Yield projections using two growth models (Mixedwood Growth Model (MGM) and Growth and Yield Projection System (GYPSY)) were initialized using data from the year eight re-measurements. Results indicate that heavy precommercial aspen thinning (to ~1000 aspen crop trees ha−1) can result in an increase in conifer merchantable volume without reducing aspen volume at the time of harvest. However, light to moderate thinning (to ~2500 aspen stems ha−1 or higher), is unlikely to result in gains in either deciduous or conifer merchantable harvest volume over those of unthinned stands.
1. Introduction
Species composition in the western boreal forests of Canada ranges from deciduous-dominated, to aspen-spruce mixtures, to conifer-dominated, and varies with the successional stage of stand development [1] among other factors. Mixed stands of trembling aspen (Populus tremuloides Michx.) and white spruce (Picea glauca (Moench) Voss) are common across Canada’s boreal landscape and provide raw materials for the wood products industry in addition to ecological benefits. Measures of biodiversity are higher in mixedwood than in single-species boreal forests [2] and there is evidence that mixed stands of spruce and aspen are more productive, achieving higher stocking levels than pure stands of either of these species, due to differences in their growth rates and shade tolerances [3,4,5,6]. Growing spruce in mixtures with aspen may have added benefits of improving spruce wood quality [7,8], reducing damage from leader weevil [9] and other insects, reducing competition from understory vegetation [10], and reducing frost injury [11].
However, aspen overtops spruce during the first 50 to 100 years of stand development and reduces its growth [12]. Reducing aspen densities through precommercial thinning in young boreal mixed stands generally increases spruce growth [13,14,15]. Reducing aspen density by thinning of boreal aspen or mixed stands can also increase growth of residual aspen [13,14,15,16,17,18], accelerate achievement of merchantable diameters, and improve resistance and resilience of aspen and spruce to drought [15].
The Dynamic Aspen Density Experiment (DADE) was initiated in 2008 by the Mixedwood Management Association of Alberta, which became the Mixedwood Project Team of the Forest Growth Organization of Western Canada (FGrOW) in 2015, to examine the response of white spruce to varying aspen densities. The objectives of the Dynamic Aspen Density Experiment are to: (1) examine effects of aspen density on stand development; (2) examine effects of aspen density on survival and growth of white spruce; and (3) evaluate the impacts of optimizing white spruce survival and growth on hardwood production.
In this paper we describe growth responses over the first eight years following thinning of the aspen and use data from the latest measurement to initialize two forest growth models, the Mixedwood Growth Model (MGM) and the Growth and Yield Projection System (GYPSY). We first analyzed the effects of the thinning treatments on aspen and spruce survival, size (height, diameter), and growth (height, diameter). Finally, we use plot level data from the second re-measurement to initialize the MGM and GYPSY growth models to complete growth simulations for each plot to age 200. Analysis of treatment effects on culmination age, density, mean annual increment (MAI), and volume were performed for spruce, aspen and total volume as well as on final yields.
2. Materials and Methods
2.1. Experimental Design and Study Sites
Seven 17-year-old and seven 22-year-old stands were selected for this experiment. Each stand had deciduous (aspen, balsam poplar (Populus balsamifera L.), and birch (Betula papyrifera Marsh.)) densities greater than 6000 stem ha−1 and white spruce at densities of at least 1000 stems ha−1, with both species evenly distributed throughout the stand. Selected stands had regenerated following clear-cut harvesting with natural regeneration of deciduous species and planting of white spruce with no further treatments prior to establishment of the experiment. In addition, some natural regeneration of spruce occurred in these plots and was thinned only in situations where spruce were growing closer than 1.15 m apart.
Five treatment plots were established in each stand (installation) and thinning treatments were applied to achieve each of the following aspen densities: 0 stems ha−1, 1000 stems ha−1, 2500 stems ha−1, 5000 stems ha−1, and unthinned (control). Thinning treatments focused on retaining the largest diameter aspen that were free of defects. When a suitable aspen was not present then a balsam poplar was selected for retention and a birch was selected when an aspen or poplar was not available. The target intertree spacings for deciduous trees were: 3.2 m × 3.2 m for 1000 stems ha−1, 2.0 m × 2.0 m for 2500 stems ha−1, and 1.4 m × 1.4 m for 5000 stems ha−1. All conifer species other than spruce were removed from the plots at the time of thinning. In addition, to reduce intraspecific competition, when spruce were growing closer than 1.15 m to each other and the smaller spruce was more than half the height of the larger spruce, then the smaller spruce was removed. The DADE permanent sample plots are fixed area squares consisting of a 50 m × 50 m treatment plot, a 20 m × 20 m measurement (main) plot, and a 10 m × 10 m deciduous subplot, all sharing a common plot center. Treatments were randomly assigned to plots in a randomized block design with each of the five treatments replicated once within each stand (installation), and blocks representing each stand (installation).
All study sites are located in the Central Mixedwood Natural Subregion [19] of central Alberta, Canada (Figure 1). Climatic conditions for the period 1985–2018 for the 14 study sites are summarized in Table 1. Mean annual temperature ranged between −0.7 and 3.3 °C for all sites, frost-free period ranged between 104 and 113 days, mean annual precipitation ranged from 433 to 538 mm y−1 with between 280 and 383 mm y−1 (64.7 to 71.4%) of precipitation falling during summer, and Climatic Moisture Index (CMI) ranged between 0.8 and 6.3 cm y−1. According to mapped ecological site classification [20], all plots are situated in ecosite d (low-bush cranberry), and have mesic soil moisture regime, medium soil nutrient regime, with silty clay loam or clay loam soil textures. Parent materials on these sites are fine textured glacial till or lacustrine.
2.2. Measurements
2.2.1. Pre-Treatment
Following plot establishment and prior to treatment application, four circular 1.78 m radius temporary plots were established at each of the four corner posts in the 10 × 10 m deciduous subplot for use in characterizing stand conditions and tree sizes prior to thinning. These plots were used to measure conifer (≥0.3 m) and deciduous (≥1.3 m) attributes prior to thinning. For each tree, a species code, tree origin, diameter at breast height of 1.3 m (DBH), height, and crown class were recorded. In these temporary pre-treatment plots, trees were not tagged or numbered. Crown class describes the relative position of the top of a tree within the entire canopy of a stand. Four classes were used for crown class: D—Dominant, crown extends to the top of the canopy; C—Co-dominant, tree is in the main canopy; I—Intermediate, top of the tree is below the main canopy but extends into the lower part of tree crowns in the main canopy; and S—Suppressed, tree is below the crown base of the main canopy.
2.2.2. Post-Treatment
In the 20 m × 20 m measurement plot, all live deciduous trees ≥ 5.1 cm DBH and spruce trees ≥ 1.3 m tall were selected for measurement and permanently tagged with pre-numbered metal tags attached to the tree using wire loops. For each tagged tree in the main plot, the following were recorded: (1) species code; (2) DBH (nearest 0.1 cm); (3) total height (nearest 0.01 m); (4) tree origin; (5) crown class; and, (6) up to 3 condition codes, in order of priority. Commonly used condition codes were: 0 = live and healthy, 1 = dead but standing, 2 = dead but down, 3 = broken or dead top, 4 = bole damage, 5 = crown damage, 6 = root damage, 7 = crook, 8 = sweep, 9 = fork, 10 = lean, and 11 = poor form.
In the 10 m × 10 m deciduous subplot, all live deciduous saplings ≥1.3 m tall and < 5.1 cm DBH were tagged and marked for repeated measurements. For each tagged sapling in the deciduous subplots, the following was recorded: (1) species code; (2) DBH (nearest 0.1 cm); (3) total height (nearest 0.01 m); (4) crown class; and (5) up to 3 condition codes, in order of priority.
Measurements were conducted in the year of establishment following the thinning (Measurement 1, 3 installations in 2007, 3 installations in 2008, 5 installations in 2009, 2 installations in 2013, and 1 installation in 2015), in year 3 (Measurement 2, 3 installations in 2010, 3 installations in 2011, 5 installations in 2013, 2 installations in 2016, and 1 installation in 2018), and in year 8 (Measurement 3, 3 installations in 2015, 3 installations in 2016, and 5 installations in 2017). Three installations had not reached the age for the second (year 8) re-measurement at the time of analysis (Table 1).
2.3. Data Screening and Processing
Prior to analysis the dataset was screened for errors following standardized procedures for quality checking, including outlier analysis, visual inspection of growth trajectories (diameter change, and height change), and height-diameter ratio. Missing or incorrect diameter and height values were corrected using height-diameter equations in use in Alberta [23]. When negative height growth was associated with records of severe lean, soil failure, dead top, or snow press, the recorded value was retained in the dataset.
Periodic annual increment (PAI) for diameter and height was calculated as the difference between successive measurements and then annualized. In order to account for effects of initial size, relative growth (growth ratio) [24,25] was calculated for each tree as percent gain in size during the eight year growth period, between Measurements 1 and 3, e.g., using equation:
Idr = ((DBH1 − DBH0)/DBH0) × 100.
Height-diameter ratio, or slenderness, was calculated by dividing tree height by DBH. Stand level means and totals were calculated at the plot level and per hectare by applying appropriate weighting factors according to plot size. Survival rate (SR) is the percentage of stand density at the end of a given growth period related to the density at the beginning of the growth period [13]. Since SR includes both mortality and ingress, SR values below 100% indicate that mortality was greater than ingress, while SR values above 100% indicate that mortality was less than ingress.
Data for both planted and natural origin spruce were available in most sample plots, however, natural origin spruce was clearly in a lower size class (DBH and height) than the planted spruce, and there was substantial variability in the abundance of natural origin spruce. Since the density of planted spruce above the 1.3 m tagging limit at establishment was close to the 1000 stems ha−1 target for all plots, analysis of growth and survival focused on just the planted spruce. However, both planted and naturally regenerated spruce were included in the yield projections, for both MGM and GYPSY.
2.4. Site Index Estimates
Aspen Site Index (SI), at a reference age of 50 years total age, was estimated at the plot level using top height sub-models [23] from the average height of the four largest (DBH) aspen trees (representing 100 trees ha−1) from the most recent measurement (11 installations at Year 8; 3 installations at Year 3). Where plots did not have aspen (i.e., pure spruce plots), the mean installation aspen SI value was used.
Since spruce was growing under the canopy of aspen prior to the establishment of the experiment, it was not appropriate to use spruce measurements for determining site index. Spruce SI was indirectly estimated using an aspen-to-white spruce SI species conversion model to estimate plot level spruce SI from plot level aspen SI [22].
2.5. Assessing Growth Response to Thinning Treatments
Growth response to treatments (aspen thinning) was tested using a linear mixed-effect Analysis of Variance (ANOVA) model fitted using the lme function from the nlme package [26] in R statistical software [27]. Analysis was conducted separately for each measurement year and treatment age. The hierarchical data structure was represented by specifying treatment as a fixed effect and installation as a random effect. For all statistical analysis a significance level of α = 0.05 was used. Assumptions of homogeneity of variances and normality of residuals were examined using diagnostic plots of the residuals and the Shapiro–Wilk test. When significant effects of treatment were found, Tukey’s post-hoc test with Bonferroni’s multiple comparison adjustment was used to group responses to similar treatments using the function glht from multicomp package [28].
Aspen and spruce density, survival, height, height increment, height-diameter ratio, diameter, diameter increment, and relative diameter growth were used as response variables in the analysis. The aspen height, diameter and growth analysis was based exclusively on dominant aspen trees (the 8 largest diameter aspen in each 20 × 20 m plot, 200 stems ha−1 top DBH aspen in each plot) to minimize the influence of the “chain-saw effect” from the thinning treatment. Removal of trees during thinning results in a change in the size distribution of trees in a stand which is referred to as the “chain-saw” effect. When thinning focuses on removal of smaller trees an upward shift in average tree size (height, diameter and associated variables) occurs. Removing effects of this upward shift by selecting a subsample of dominant trees is often used when analyzing data from thinning experiments. Separate models to account for the randomized block design were built for the two treatment ages in order to simplify inferences, and overcome the effects of initial tree size resulting from differences in stand ages at trial establishment. In our study, there were no significant differences among treatments within treatment age for initial (post-treatment) mean height and diameter, and consequently initial size was not used as covariate in height and diameter increment models.
2.6. Yield Projections
Long term volume predictions were created using the Mixedwood Growth Model (MGM18, MGM hereafter) [29] (https://mgm.ualberta.ca; accessed on 28 March 2021) and the Growth and Yield Projection System (GYPSY) [23] (https://www.alberta.ca/growth-and-yield-projection-system.aspx; accessed on 28 March 2021). Volume projections were initialized using Measurement 3 (year 8) for seven installations in younger stands (25 years starting stand age), and four installations in older stands (30 years starting stand age). Simulations of the growth of each plot were run to age 200. Installation level SI was used for both MGM and GYPSY simulations, while birch was included in MGM and removed from GYPSY, as suggested by Huang et al. [23]. Both gross total volume (all trees above 1.3 m height), and net merchantable volume using a “15/10” utilization standard (minimum 15 cm diameter at stump height, 10 cm minimum diameter inside bark, and 0.3 m stump height) were calculated for both aspen and spruce.
MGM (https://mgm.ualberta.ca/mgm18/; accessed on 28 March 2020) projections were initialized using tree lists for each plot which included species, diameter at breast height, total height, total age, and corresponding tree factor. Total age refers to the age of the tree in terms of number of years since seed germination. Tree factor refers to the number of trees that a single tree represents and is calculated as 10,000/plot area in m2. The latest provincial site index curves [23], Central Mixedwood Natural Subregion, and a gap loss factor of 0% were also set for each plot. MAT and CMI (30-year normal, 1981–2010) calculated from ClimateNA v6.11 [21] outputs were included to accommodate application of climate-sensitive survival functions implemented in MGM.
For GYPSY projections, stand age, stand density, SI, top height, total age, and basal area (BA) by species were used as input while percent stocking (spatial GYPSY) was not used. Basal area is an optional parameter in GYPSY but was used in this analysis in order to localize (adjust) predictions according to the density treatments applied in our study. In addition, GYPSY requires total age, together with either SI or top height for each species. We used total age and SI for aspen, except for aspen ingress in the pure spruce treatment where we used SI and top height. Since the spruce in this study were suppressed under the aspen overstory prior to thinning, we tested three combinations of input parameters for spruce and compared them to MGM (Figure 2). Even though age and SI (obtained from conversion models) for spruce are known variables in our study, projected height trajectories did not account for the time spent under suppression, which could result in overestimates of yield. When top height and age are provided GYPSY solves for SI; however, since suppressed top height was used, it would lead to an underprediction of productivity (SI) which would affect yields. Although GYPSY recalculates an incorrect age for spruce, we used top height and SI in our study as predictions appeared more realistic and more closely matched MGM projections.
Treatment effects on culmination age, density, mean annual increment (MAI), and volume (for spruce, aspen, and total volume) were analyzed using mixed-model ANOVA. We calculated culmination age and volume based on culmination for total (stand) MAI.
3. Results
3.1. Initial Conditions
While variation in initial aspen density across installations was evident, total deciduous densities exceeded 6000 stems ha−1. Mean planted spruce density ranged from 1100 to 2125 stems ha−1 in the 17-year-old stands and from 750 to 1250 stems ha−1 in the 22-year-old stands, with no significant differences between installations within stand age classes. Aspen mean DBH ranged from 4.5 to 5.3 cm and mean height ranged from 6.2 to 7.6 m, indicative of relatively uniform conditions in the younger installations (17 years). However, more variability was evident in the older installations (22 years) with DBH ranging from 5.1 to 8.0 cm and height ranging from 7.9 to 10.4 m. Variability in the size of planted spruce was consistent across the 17-year-old installations, but showed substantial variability in the 22-year-old installations. Natural and planted spruce differentiated into two height classes with the naturally regenerated spruce being distinctly smaller. Densities of natural spruce regeneration varied substantially among installations, ranging from 0 in CM-22-08 to an extreme of 20,700 stems ha−1 in the CM-17-02 installation. Natural spruce abundance ranged from 250 to 3000 stems ha−1 for all other installations.
Following treatment randomization, pre-treatment means of all variables (stand density, DBH, and height) for planted spruce did not differ significantly between treatments (results not shown). For aspen, some differences in mean DBH and height resulted from differences in stand density. However, when the upper canopy layer, dominant and codominant crown classes, of aspen trees was examined separately, ranges in younger stands were 1.3 cm and 1.0 m, and in older stands 3.3 cm and 1.0 m for DBH and height, respectively.
3.2. Survival
Changes in aspen and spruce density across measurement periods are presented in Figure 3. Aspen density reflects three targeted overall deciduous treatment density. At the time of trial establishment “Control” had higher variability and between 4283 and 4921 more aspen trees than the “5000” plots. For the three thinning treatments, aspen survival rate over the first 3 years after thinning ranged from 94 to 101% and 96% to 99% for treatment ages 17 and 22 respectively. By the end of the second growth period, years three to eight, survival rate remained stable at 90% to 100% for both treatment ages. In contrast, survival in the unthinned “Control” treatment showed a 17% to 18% decrease in density during the first re-measurement interval, and an additional 23% to 34% decrease in aspen density during the second re-measurement interval, resulting in 59%–64% of initial density remaining after the whole 8-year interval.
Changes in density of planted spruce vary between 95% and 107% for the two treatment ages and over the two measurements periods, as related to mortality events or ingress crossing the tagging limit. However, no significant impact of aspen density on the survival rate of planted spruce was detected for either treatment age (Figure 3).
3.3. Aspen Growth Response to Thinning Treatments
Since the removal of aspen at the time of thinning targeted smaller trees, there is an immediate “chain-saw effect” on average tree size. To compensate for this effect, analysis was completed using only the dominant subset of aspen in each plot (200 stems ha−1 top DBH aspen). Similar studies in this region have used 256 aspen ha−1 [30] or 100 aspen ha−1 [13,14,15] for analysis of aspen growth response to silvicultural treatments.
Results from the mixed model ANOVA showed that height and height increment of top aspen trees were not significantly affected by aspen density (Table 2). Significant differences in diameter increment were becoming evident at Measurement 2, while differences in DBH were not yet significant at Measurements 2. Aspen diameter was significantly larger in the “1000” treatment than in the unthinned “Control” resulting in a difference of 3.0 to 3.2 cm eight years following thinning. The 2500 and 5000 stems ha−1 treatments had intermediate values. Slenderness (H-DBH Ratio) showed a similar response to treatment. Absolute and relative diameter increments in the “1000” and “2500” treatments were statistically different from “Control”, while “5000” was intermediate in response. Treatment “1000” demonstrated a 74% and 75% greater annual diameter increment in the second measurement period and 54% and 44% in the third measurement period when compared to “Control” for the age 17 and 22 groups, respectively. Relative diameter increment was significantly larger in the “1000” and “2500” stems ha−1 treatments than in the “control” for both treatment ages, while relative height increment of aspen did not differ between treatments.
3.4. Spruce Growth Response to Thinning Treatments
Diameter response of spruce was evident immediately following thinning (Table 3) and followed a positive trend with decreasing aspen densities. Differentiation between treatments for spruce diameter and slenderness increased over time. The largest response was found following complete aspen removal (0 aspen) where diameter increased about 2 to 2.5 times over the eight years following treatment. Spruce diameter increment was also affected by treatment in the first period, in younger stands (17-year treatment age) where it ranged from 0.34 cm y−1 for “Control” to 0.63 cm y−1 for pure spruce treatments, and was similar in magnitude in the second period (0.29–0.68 cm y−1). In terms of mean relative diameter growth, treatments fell into three groups: in pure spruce (253%–376%), thinning treatments (134%–269%), and unthinned (72%–167%), with the magnitude of increase being higher in the younger stands.
Height response of white spruce was delayed. Height did not differ significantly between treatments at Measurement 2, while significant differences were evident only for age 17 treatments at Measurement 3 (age eight). While the 0 and 1000 stems ha−1 aspen densities for age 22 treatments were increasing in height, differences between these two treatments were still not statistically significant eight years following treatment. Height increment was significantly lower at Measurement 2 in pure spruce than in the unthinned “Control” for both treatment ages, while height growth from age three to eight and relative height growth over the full eight years since treatment were significantly higher in pure spruce than in the unthinned “Control” for both treatment ages.
3.5. Yield Implications
3.5.1. Site Index
Similar levels of productivity, SI values between 22.2 and 23.9 m, were observed among the younger (age 17) treatment installations, while more variability, with SI ranging between 19.6 and 24.7 m, was found across older (22 years) installations (Table 1). No significant differences in SI of either species were found between treatments using mixed model ANOVA separately for the two treatment ages (Figure 4).
3.5.2. Yield Projections
MGM-predicted culmination age, stand density, MAI, and volume (deciduous, conifers, total) based on culmination for total (stand) MAI calculations, with utilization standards applied, are shown in Table 4. Maximizing total stand growth rate (stand MAI) in intimate mixtures (treatments with presence of aspen) showed similar timing across treatments: 73 to 79 years for stands thinned at age 17, and 79 to 85 years for stands thinned at age 22, with no significant differences between treatments with aspen densities of 1000 stems ha−1 or higher. Pure spruce culmination age was 92 and 96 years, with a MAI of 5.4 and 4.3 m3 ha−1 y−1 and total merchantable volume of 495 and 405 m3 ha−1 for age 17 and 22 thinning treatments, respectively. In intimate mixtures, maximum stand MAI estimated using MGM ranged from 4.7 to 7.2 m3 ha−1 y−1 with treatment “1000” giving significantly higher stand MAI than “Control” or “0”. Similarly, total stand volume for the 1000 aspen ha−1 treatment was larger than for the unthinned control or “0 aspen” treatment. Conifer volume at culmination was 304 m3 ha−1 within treatment “1000” for installations thinned at age 17 and was significantly larger than all other mixture treatments. Interestingly, aspen thinning intensity had no significant effect on deciduous volume, due to increases in aspen diameter associated with thinning intensity, while conifer volumes are highest in the pure spruce treatment and decline with increasing initial aspen density. In terms of variables important to utilization, deciduous average DBH and merchantable volume per tree (VPT) were significantly larger in the ”1000” treatment than in treatments with higher aspen densities, for both treatment ages, and were slightly smaller for the age 22 thinning than for the age 17 thinning.
For GYPSY model forecasts, culmination age decreases with increasing aspen density for stand MAI (Table 4). MAI shows a progressive decrease with thinning intensity, peaking with 6.4 m3 ha−1 in “5000” treatment stands thinned at age 17. Total volume at the time of stand MAI culmination was 416–450 m3 ha−1 following thinning at age 17 and 390–431 m3 ha−1 following thinning at age 22, while the conifer:deciduous ratio declines with increasing initial aspen density.
4. Discussion
4.1. Tree Survival
Aspen survival rates in the thinned plots, representing the combined effects of mortality and ingress, ranged between 90 and 100% over the first eight years following thinning, with no significant differences among the three thinning levels. This is in agreement with findings of other studies of young natural aspen stands that starting with low densities these stands tend to maintain initial density, or increase density over short periods [13,15]. Consistent with our findings of no difference in aspen survival rates between thinning intensities, Kabzems et al. [14] observed that mortality of aspen over a 20-year period ranged from 2.5% to 10.4% with no significant impact of aspen density, among four aspen densities created by thinning, on aspen mortality. However, in our study, survival in the unthinned “Control” treatment showed a 36% to 41% density decrease over the whole 8-year observed period. Comeau [15] found a survival rate of approximately 27% over the first 26 years following regeneration for unthinned aspen stands in central Saskatchewan. Self-thinning, due primarily to intraspecific competition, is considered to be the primary contributor to these density changes in high density (ie. unthinned) aspen stands during the stem exclusion phase in boreal mixedwoods [1,3,13].
There was no evidence of suppression-induced spruce mortality associated with any of the aspen densities in this study. Kabzems et al. [14] also reported that spruce mortality was not affected by aspen density ranging between 1000 and 10,000 stems ha−1 in young boreal mixedwood stands. Higher survival and a lack of treatment effects on spruce survival reflects the moderate shade tolerance of spruce [10], and the fact that aspen competition has not yet reached levels that lead to spruce mortality [31]. While survival of spruce across northwestern North America is affected by both deciduous and coniferous competition, the effect of deciduous competition is much weaker than that of spruce [31,32]. In a case study in Alberta, naturally regenerated spruce was found to survive in the understory at light levels as low as 10% of open sky values which is less than typically found under aspen canopies which generally transmit over 15% but greater than spruce canopies which transmit between 6 and 10% [10]. In addition, fall and spring leaf-off periods under deciduous canopies result in increased light transmittance which can lead to increased growth and survival of understory spruce when compared to persistent year-round reductions in understory light under conifer canopies [33].
4.2. Effects of Thinning on Aspen Size and Growth
The lack of treatment effects on height of dominant aspen has also been reported in similar studies in western Canada [13,14,15,29]. Diameter growth responses differ significantly between treatments due to increased growing space in thinned stands where thinning to 1000 aspen ha−1 resulted in a 44% to 54% increase in diameter growth when compared to unthinned eight years later. Thinning treatments have resulted in similar increases in diameter growth of dominant trees in other studies [13,14,15,16,17,18,24,34,35,36]. For instance, precommercial thinning in boreal mixedwoods increased aspen relative DBH increment 66% to 85%, when compared to the unthinned control over a 10-year period [24].
In our study, increases in aspen density led to increases in stem slenderness (ratio of height to DBH), with the strongest differences being evident between the “0” aspen and unthinned control treatments. This is consistent with other studies showing increases in slenderness in response to increases in levels of competition [13,14,15].
4.3. Effects of Thinning on Spruce Size and Growth
Both diameter and height growth of spruce declined with increasing aspen density, with the highest growth rates occurring where all aspen had been removed. Positive effects of thinning of aspen on spruce growth have also been reported by other studies [13,14,15] and are primarily associated with increased light levels [12,37]. Height increment over the first three years following thinning was less than in the pure spruce treatment than in any other treatment at either treatment age. However, this treatment had the largest height increment during the subsequent five-year period (three to eight years following thinning). Similarly, Bokalo et al. [13] found that thinning aspen in mixed stands had no significant impact on spruce height three to four years following treatment. Bokalo and Comeau (unpublished) and Comeau [15] showed significant effects of aspen density on spruce height after age 15 from the WESBOGY long-term experiment. Krebs [38] reported that diameter growth of white spruce advanced regeneration increased in the year following removal of mature aspen canopies, while there was a three to five-year delay for height growth response. Claveau et al. [37] report a one-year delay in growth responses following release of young interior spruce, Douglas-fir, and subalpine fir in British Columbia, which was attributed to a short-term increase in allocation to root growth required to overcome increased drought stress and a reaction to increased wind exposure following removal of the overtopping deciduous canopy. Bending, leaning, or breakage from wind or heavy snow can also result in negative height growth.
While potential for facilitation of spruce by aspen has been proposed [2,4] there is no evidence of benefits of aspen (facilitative effects) on spruce over the first eight years of the DADE experiment. However, it should be recognized that our results reflect the net outcome, in terms of growth, from the combined influences of competition and facilitation, which may vary temporally as well as with aspen density. In addition, facilitative effects may be of greater importance during younger ages, predominantly during the establishment phase for spruce through reductions in herbaceous competition [10,39] and frost injury [11]. In a study in central Saskatchewan, Comeau [15] found that resistance and resilience of spruce to drought was the highest when aspen was at a stocking of seven m2 ha−1 basal area or lower in mixed plantations similar to those established for DADE.
Slenderness of spruce is strongly influenced by the social status of individual trees and by both intra- and inter-specific competition [14,40]. As for aspen, spruce slenderness increases in response to increases in levels of competition [12,13,14], as was also found in the DADE study, with the strongest differences being evident between the “0” aspen and the two highest treatment densities of “5000” and unthinned. Significant differences in spruce slenderness were evident three years following thinning for both treatment ages, with the “0” and “1000” aspen treatments being smaller than the “5000” aspen and “unthinned” control treatments.
4.4. Thinning Effects on Growth and Yield
MGM yield outcomes are similar to results reported by Kabzems et al. [14] and Comeau [15]. However, while spruce yield decreased with increasing aspen density, aspen yield did not increase. This contrasts with results from Bella and Yang [41] who found that thinning of aspen to 1000 trees ha−1 resulted in reduced volumes at harvest. For all but the pure spruce treatment, thinning did not affect stand level culmination age, while culmination age was much higher for the pure spruce “0” aspen treatment.
Pure spruce yields in our study are similar to MGM predictions for similar conditions in north-eastern B.C. at age 90 with MAI of 4.2 m3 ha−1 y−1 and merchantable volume of 375 m3 ha−1 y−1 [14]. Treatment “1000” had greater spruce volume than all other treatments which is consistent with MGM predictions of 345 m3 ha−1 at age 90 in a mixture of 2000 stems ha−1 aspen and 1300 stems ha−1 spruce [14], and to a spruce volume of 326 m3 ha−1 following repeated aerial herbicide treatments [42].
Total, aspen plus spruce, MAI for MGM model runs averaged 5.4 m3 ha−1 y−1 (age 17 treatment) and 4.3 m3 ha−1 y−1 (age 22 treatment) for the “0” aspen treatment, 6.1 m3 ha−1 y−1 (age 17 treatment) and 4.9 m3 ha−1 y−1 (age 22 treatment) in the unthinned, and 7.2 m3 ha−1 y−1 (age 17) and 5.3 m3 ha−1 y−1 (age 22 treatment) for the 1000 aspen ha−1 treatment (Table 4). The “1000” treatment provided significantly higher total (aspen plus spruce) MAI over the pure spruce stands. This overyielding in aspen-spruce mixtures has been reported at similar densities by others [3,14,15] and is thought to result from differences in growth rates and shade tolerance of aspen and white spruce which leads to niche separation, and the ability of the mixed stand to use more light and carry a larger total number of trees than is the case for pure stands. Alternative management strategies could see removal of aspen at earlier ages selected to maximize aspen yield while leaving spruce to grow to its culmination. The application of this “understory protection” approach has the potential to increase yields of both aspen and spruce [14,43,44].
Culmination age (stand MAI) for the pure spruce treatment in our study was from 92 to 97 years for both models used. Lieffers et al. [45] reported culmination of spruce MAI at age of 92 years for GYPSY model of planted spruce growing in stands after removal of 50% of a mature aspen canopy and mounding. In our study results from MGM showed, with the exception of the pure spruce treatment, culmination age and deciduous volume (at the time of maximum stand MAI) was not significantly affected by thinning (Table 4) for either treatment age. However, deciduous tree size (VPT) was significantly higher in “1000” then in other treatments. In addition, conifer volume in “1000” was 35% to 40% and 17% to 35% greater for 17 and 22 year treatment ages respectively, than in any of the other treatments. Results show that heavy precommercial thinning of aspen (~1000 aspen crop trees ha−1) in boreal mixedwoods can lead to an increase in conifer merchantable volume without reducing aspen volume at the time of harvest. Additionally, results demonstrated that light to moderate thinning, such as reducing the density of aspen trees to 2500 stems ha−1 or higher, is unlikely to result in gains in either deciduous or conifer merchantable harvest volume over those of unthinned stands. These findings are supported by Kabzems et al. [14] who also found the greatest merchantable yields, from MGM predictions, at aspen densities of 1000 and 2000 stems ha−1, in a similar study in British Columbia. In another study in Saskatchewan, mixtures of 1500 aspen ha−1 and 1000 spruce ha−1 provided a 23% increase in MAI at age 100 compared to unthinned stands, based on MGM predictions [15].
Generally, early (age 17) thinning treatments resulted in earlier culmination ages and higher MAI values and volumes than age 22 thinning treatments. These differences reflect differences in productivity (SI) with average aspen SI for stands treated at age 17 of 23.3 m (ranging from 22.2 to 23.9 m), and average SI of 21.8 m (ranging from 19.6 to 24.7 m) in stands treated at age 22. Differences in sample size also contribute to differences in SI values and in results from yield projections. Consequently, comparison of yield results between the two treatment ages should be done with caution.
4.5. Comparison of MGM Volume Projections to the Alberta GYPSY Model
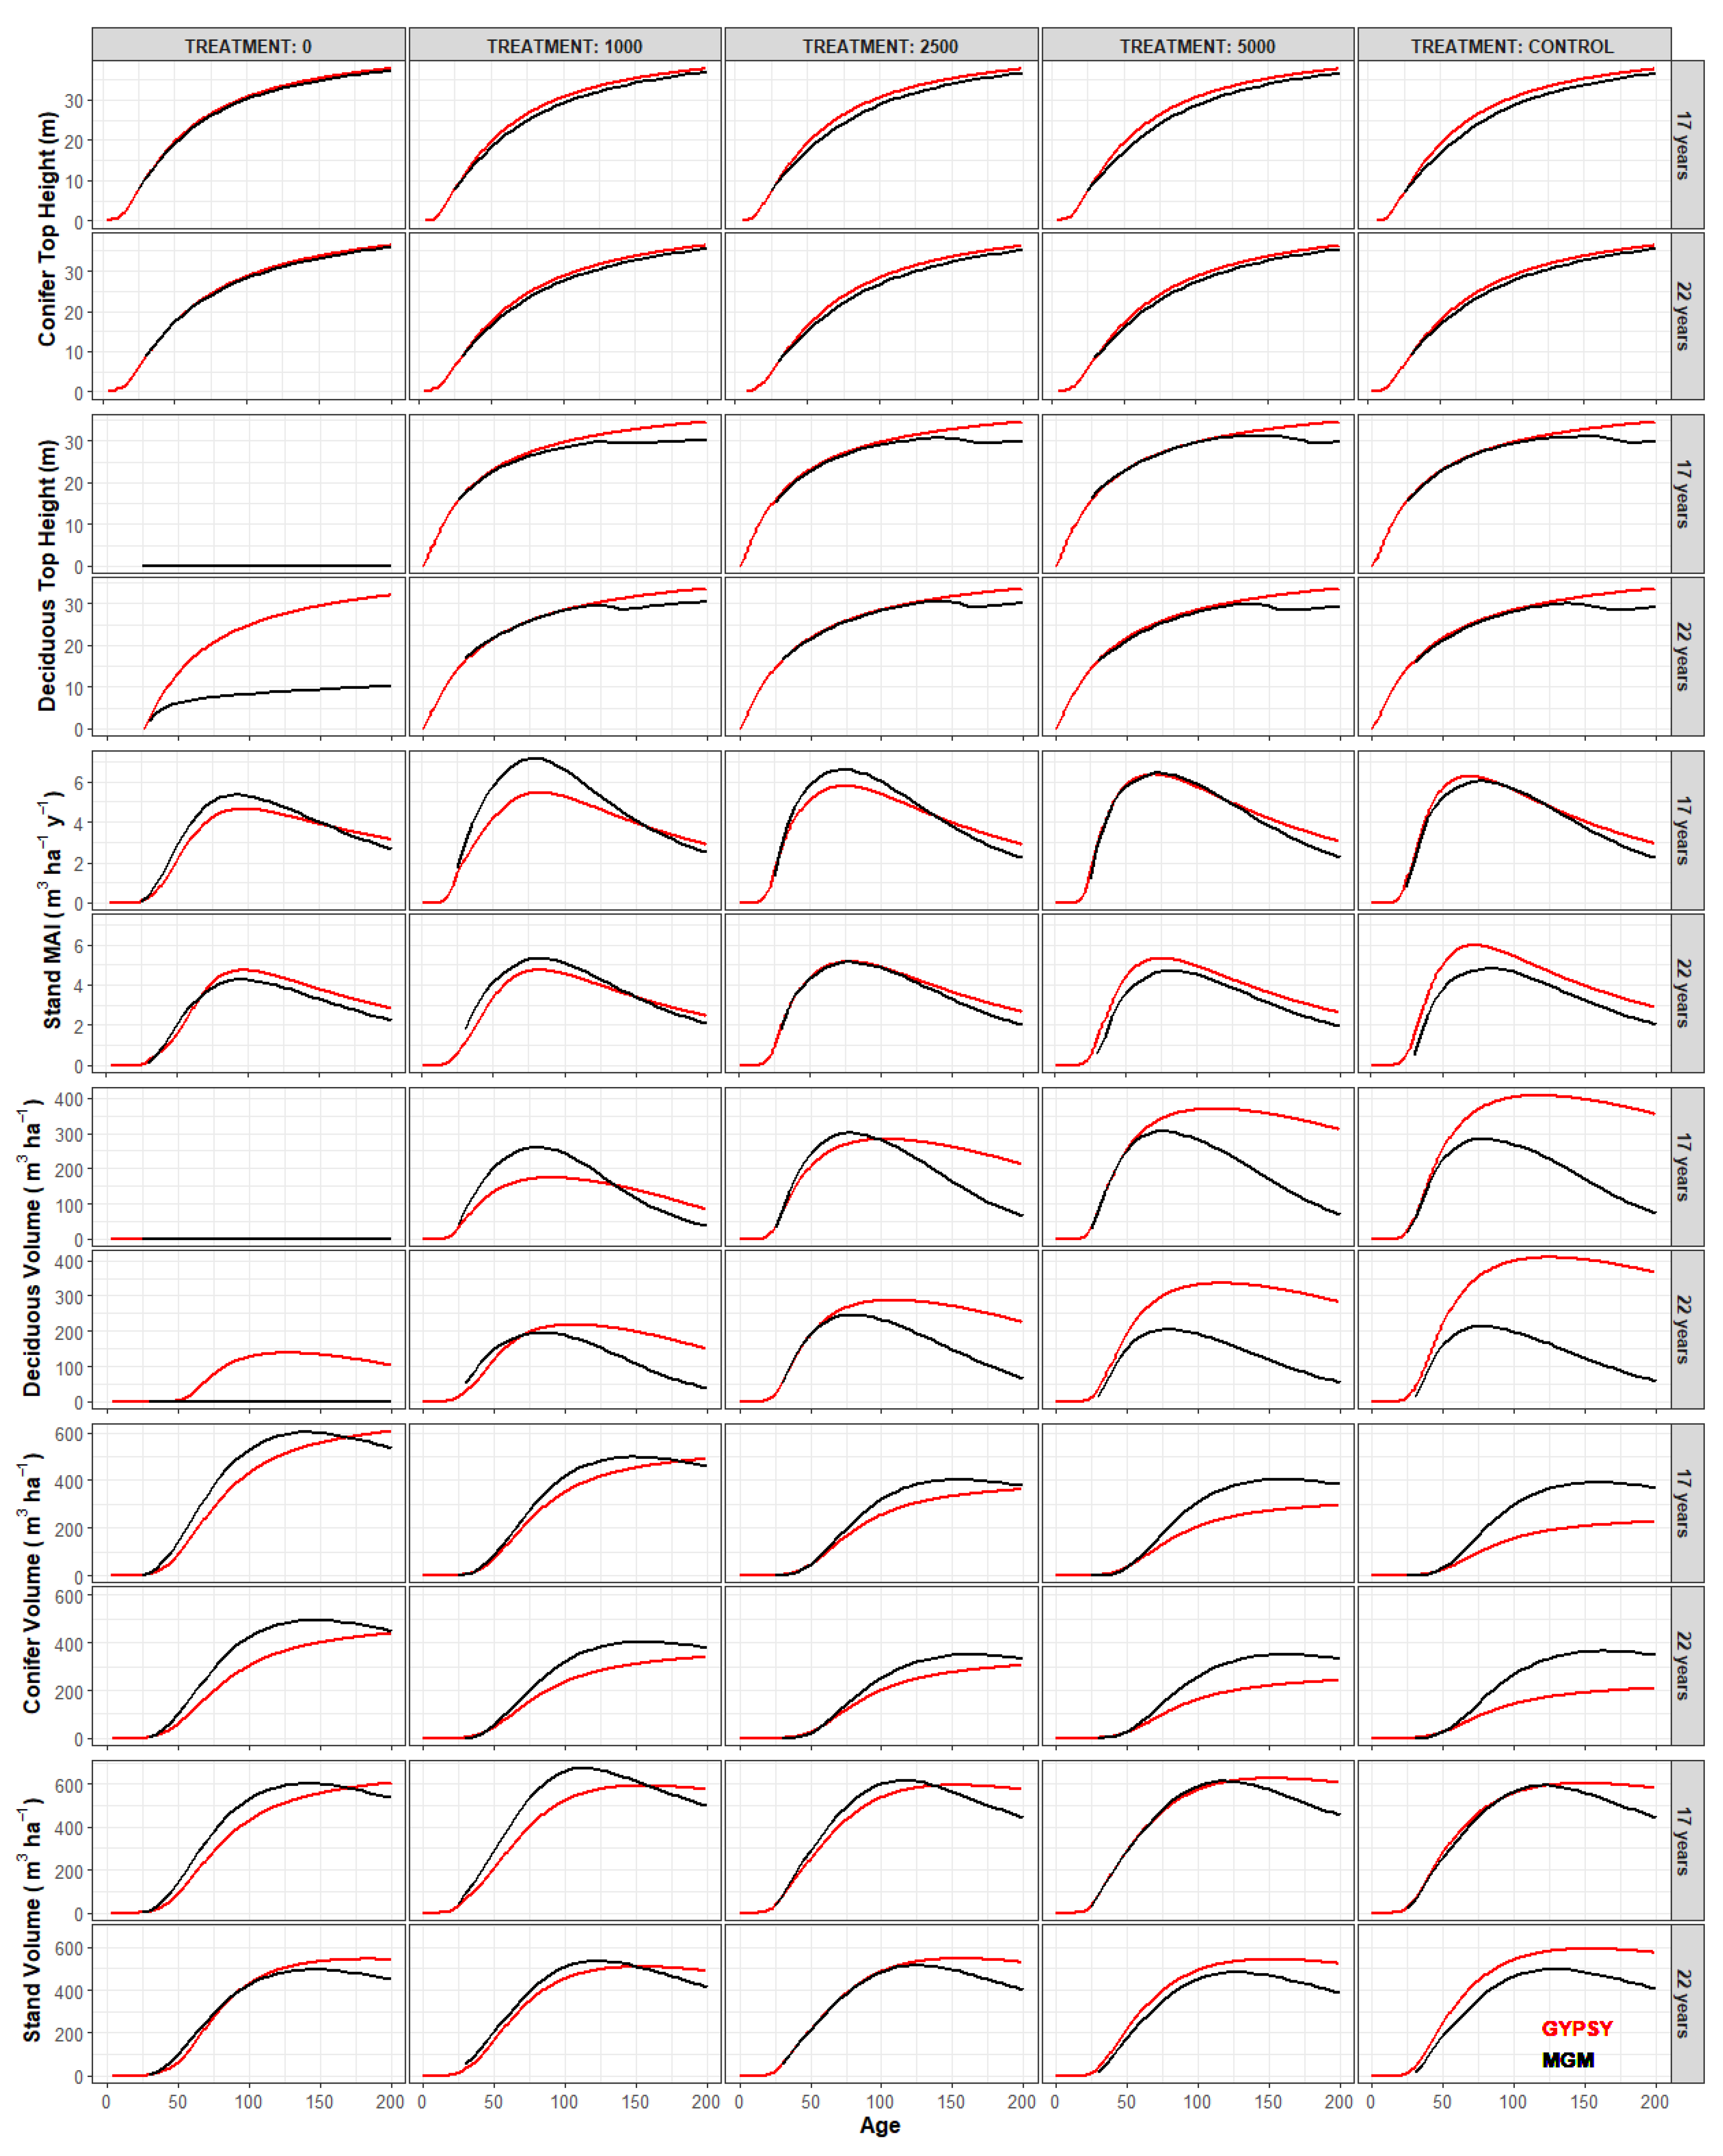
The Growth and Yield Projection System (GYPSY) [23] forest growth and yield model is currently used in Alberta for general growth and yield purposes and for the estimation of MAI used in evaluating plantation performance. Yield projections for both MGM and GYPSY were run to 200 years. Figure 5 shows average treatment trajectories for top height, MAI and volume from both models. Both models showed similar projections of spruce top height in the pure spruce stand while differences between the models increase with increases in aspen density as a reflection of MGM growth functions that cause reductions in spruce height growth by overtopping aspen. The two models provide similar predictions of aspen top height overlaps until the period of canopy transition (i.e., when spruce begin to enter the dominant tree canopy) [1] when MGM predicts a decline in aspen top height, with the decline starting earliest, before 100 years, in the “1000” aspen treatment. In addition, since MGM does not currently model ingrowth, aspen ingrowth in pure spruce stands (which occurred between measurements 2 and 3) was predicted differently by the two models.
Magnitudes of GYPSY predictions are related to BA adjustments at the time of initialization, while MGM is designed to directly model complex multi-species multi-cohort stands at a tree level accounting for the effects of competition. Differences in MAI prediction were related to thinning intensity. The greatest difference between MGM and GYPSY of 7.2 to 5.5 m3 ha−1 y−1 was observed for age 17 thinning to 1000 deciduous stems ha−1. Trends in culmination age values also differ between MGM and GYPSY, with MAI decreasing as initial aspen density increased for MGM but increasing with increasing initial aspen density for GYPSY. The greatest difference between MGM and GYSPY is in the deciduous volume predictions, where MGM peaks earlier and then shows a sharp decline in older ages which reflects a dramatic increase in aspen mortality when DBH exceeds 60 cm [31]. MGM predicts higher conifer volumes than GYPSY, with differences increasing with aspen density. MGM also shows that culmination in conifer volumes happens earlier if aspen density is lower, while GYPSY shows a positive trend in conifer volumes throughout the entire 200-year simulations. Reasons for differences between MGM and GYPSY include: (1) MGM does not model ingrowth, while this is included in the GYPSY simulations; and (2) behavioral testing (unpublished) of MGM (the version used for this study) indicates that MGM tends to overestimate white spruce volumes and MAI in some cases.
5. Conclusions
Three and eight years following thinning of mixed stands, aspen mortality in the unthinned plots was greater than in plots that received spacing treatments, with no significant impact of aspen density on aspen mortality among the three thinning treatments (“1000”, “2500”, and “5000”). Diameter growth of dominant aspen trees increased eight years following thinning, while there was no effect of thinning on aspen height growth. Results from this study demonstrate that aspen responds positively to precommercial thinning, even at ages as late as 22 years.
Aspen densities had no significant effect on the survival of planted spruce over the eight year period following treatment; however, increasing aspen densities resulted in significant reductions in spruce diameter and height growth. Spruce height and diameter growth increased with time following treatment. Differentiation in diameter growth between treatments was evident after three years, while differentiation of height response was not evident until three to eight years following treatment.
Generally, yield predictions from MGM and GYPSY are similar. Where differences were observed, they were due to differences in modelling approaches, with GYPSY forecasting the growth and yield of stands on a per hectare (stand) basis, while MGM is a deterministic, distance-independent, individual tree growth model. Hence boreal mixedwood stand dynamics are modeled differently and, therefore, predictions differ during the stand initiation phase (i.e., top height of aspen ingress in pure spruce) or during the canopy transition and gap dynamics phases (i.e., decline in volume after age 100 for aspen and after age 150 for spruce). In addition, ignoring ingrowth when using MGM results in predicting declines in spruce volume after age 150. However, both models indicate a decline in conifer yields with increasing aspen density. MGM predicts a stand level MAI of 7.2 m3 ha−1 y−1 culminating at 79 years in stands thinned at age 17 years to 1000 aspen ha−1, suggesting the potential for increases in conifer merchantable volume without sacrificing aspen volume at the time of harvest compared to unthinned stands. While results also suggest that thinning at age 17 provides higher yields and earlier culmination ages than thinning at age 22, these should be interpreted with caution since the differences may be due to differences in sample size, site index and other factors.
Continuing periodic monitoring and measurement of the plots established for this study, as planned by the FGrOW Mixedwood Project Team is encouraged.
Author Contributions
I.B. and P.C.—Analysis and writing of the manuscript; S.M.—secured funding for and coordinated measurements, secured funding to support data analysis; S.M. and B.R. contributed to writing of the final manuscript. All authors have read and agreed to the published version of the manuscript.
Funding
The Project was funded by the Mixedwood Project Team (MPT) of the Forest Growth Organization of Western Canada (FGrOW). Project #: 234.2.2.
Data Availability Statement
Data from this study may be made available on application to FGrOW. Any request for data should include a detailed explanation of the purpose of the request and plans for use of these data.
Acknowledgments
The DADE experiment was established by the Mixedwood Management Association of Alberta which became the MPT in 2015 with the creation of FGrOW. Development of the study design was led by Gitte Grover and Willi Fast. We are grateful to the MPT membership for their support of this project and for funding to support analysis and reporting of the DADE data by the senior author. We are thankful to Kirk Johnson for his assistance with MGM and GYPSY model runs, and to the contractors and NAIT Center for Boreal Research instructors and students who completed measurements of the plots established for this study.
Conflicts of Interest
The authors declare no conflict of interest.
References
- Chen, H.Y.; Popadiouk, R.V. Dynamics of North American boreal mixedwoods. Environ. Rev. 2002, 10, 137–166. [Google Scholar] [CrossRef]
- Macdonald, S.E.; Lecomte, N.; Bergeron, Y.; Brais, S.; Chen, H.Y.H.; Comeau, P.; Drapeau, P.; Lieffers, V.J.; Quideau, S.; Spence, J.; et al. Ecological Implications of Changing the Composition of Boreal Mixedwood Forests; A State of Knowledge Report; Sustainable Forest Management Network: Edmonton, AB, Canada, 2010; ISBN 9781552612255. [Google Scholar]
- Kweon, D.; Comeau, P.G. Factors influencing overyielding in young boreal mixedwood stands in western Canada. For. Ecol. Manag. 2019, 432, 546–557. [Google Scholar] [CrossRef]
- Man, R.; Lieffers, V.J. Are mixtures of aspen and white spruce more productive than single species stands? For. Chron. 1999, 75, 505–513. [Google Scholar] [CrossRef]
- Lieffers, V.J.; Macmillan, R.B.; MacPherson, D.; Branter, K.; Stewart, J.D. Semi-natural and intensive silvicultural systems for the boreal mixedwood forest. For. Chron. 1996, 72, 286–292. [Google Scholar] [CrossRef] [Green Version]
- Comeau, P.G.; Kabzems, R.; McClarnon, J.; Heineman, J.L. Implications of selected approaches for regenerating and managing western boreal mixedwoods. For. Chron. 2005, 81, 559–574. [Google Scholar] [CrossRef] [Green Version]
- Comeau, P.G. Effects of aspen and spruce density on size and number of lower branches 20 years after thinning of two boreal mixed- wood stands. Forests 2021, 12, 211. [Google Scholar] [CrossRef]
- Forintek Canada Corporation. Influence of Growth Rate on Strength and Related Wood Properties of Boreal White Spruce; Technote 00-08W; Forintek Canada Corp.: Vancouver, BC, Canada, 2000; p. 4. [Google Scholar]
- Taylor, S.P.; Alfaro, R.I.; DeLong, C.; Rankin, L. The effects of overstory shading on white pine weevil damage to white spruce and its effect on spruce growth rates. Can. J. For. Res. 1996, 26, 306–312. [Google Scholar] [CrossRef]
- Lieffers, V.J.; Stadt, K. Growth of understory Picea glauca, Calamagrostis canadensis and Epilobium angustifolium in relation to overstory light. Can. J. For. Res. 1994, 24, 1193–1198. [Google Scholar] [CrossRef]
- Filipescu, C.N.; Comeau, P.G. Influence of Populus tremuloides density on air and soil temperature. Scand. J. For. Res. 2011, 26, 421–428. [Google Scholar] [CrossRef]
- Filipescu, C.N.; Comeau, P.G. Aspen competition affects light and white spruce growth across several boreal sites in western Canada. Can. J. For. Res. 2007, 37, 1701–1713. [Google Scholar] [CrossRef]
- Bokalo, M.; Comeau, P.G.; Titus, S.J. Early development of tended mixtures of aspen and spruce in western Canadian boreal forests. For. Ecol. Manag. 2007, 242, 175–184. [Google Scholar] [CrossRef]
- Kabzems, R.; Bokalo, M.; Comeau, P.G.; MacIsaac, D.A. Managed mixtures of aspen and white spruce 21 to 25 years after establishment. Forests 2016, 7, 5. [Google Scholar] [CrossRef] [Green Version]
- Comeau, P.G. Effects of thinning on dynamics and drought resistance of aspen-white spruce mixtures: Results from two study sites in Saskatchewan. Front. For. Glob. Chang. 2020, 3, 621752. [Google Scholar] [CrossRef]
- Bickerstaff, A. The Effect of Thinning upon the Growth and Yield of Aspen Stands; Project P-19. Silviculture Research Note; Dominion Forest Service: Ottawa, ON, Canada, 1946. [Google Scholar]
- Perala, D.A. Thinning Strategies for Aspen: A Predictive Model; NC-RP-161; USDA: Washington, DC, USA, 1976.
- Steneker, G.A. Guide to the Silvicultural Management of Trembling Aspen in the Prairie Provinces; Information Report NOR-X-164; Canadian Forestry Service, Northern Forest Research Centre: Edmonton, AB, Canada, 1976.
- Alberta Natural Regions Committee. Natural Regions and Subregions of Alberta; Downing, D.J., Pettapiece, W.W., Eds.; Pub. No. T/852; Government of Alberta: Edmonton, AB, Canada, 2006.
- Alberta Agriculture and Forestry Derived Ecosite Phase (DEP). 2017. Available online: https://open.alberta.ca/dataset/3158c470-d6e8-48b1-92c0-fdc4342659c1 (accessed on 28 March 2020).
- Wang, T.; Hamann, A.; Spittlehouse, D.; Carroll, C. Locally downscaled and spatially customizable climate data for historical and future periods for North America. PLoS ONE 2016, 11, e0156720. [Google Scholar] [CrossRef] [PubMed]
- Bjelanovic, I.; Comeau, P. Species SI Conversion Equations for Alberta and Saskatchewan; MGM Reserch Note #2019-2. 2019. Available online: https://mgm.ualberta.ca/mgm18/research-notes/ (accessed on 28 March 2020).
- Huang, S.; Meng, S.X.; Yang, Y. A Growth and Yield Projection System (GYPSY) for Natural and Post-Harvest Stands in Alberta. T/216. 2009; pp. 1–22. Available online: https://www.alberta.ca/growth-and-yield-projection-system.aspx (accessed on 25 March 2020).
- Prévost, M.; Gauthier, M.M. Precommercial thinning increases growth of overstory aspen and understory balsam fir in a boreal mixedwood stand. For. Ecol. Manag. 2012, 278, 17–26. [Google Scholar] [CrossRef]
- D’Amato, A.W.; Troumbly, S.J.; Saunders, M.R.; Puettmann, K.J.; Albers, M.A. Growth and Survival of Picea glauca following Thinning of Plantations Affected by Eastern Spruce Budworm. North. J. Appl. For. 2011, 28, 72–78. [Google Scholar] [CrossRef] [Green Version]
- Pinheiro, J.; Bates, D.; DebRoy, S.; Sarkar, D. Package “nlme”: Linear and Nonlinear Mixed Effects Models. R Package Version 3.1-143. 2019. Available online: https://svn.r-project.org/R-packages/trunk/nlme (accessed on 28 March 2020).
- R Core Team. R: A Language and Environment for Statistical Computing; R Foundation for Statistical Computing: Vienna, Austria, 2019; Available online: https://www.R-project.org/ (accessed on 28 March 2020).
- Bretz, F.; Westfall, P.; Heiberger, R.M.; Schuetzenmeister, A.; Scheibe, S. Package “Multcomp”: Simultaneous Inference in General Parametric Models Version. 2019. Available online: http://multcomp.R-forge.R-project.org (accessed on 28 March 2020).
- Bokalo, M.; Stadt, K.; Comeau, P.; Titus, S. The validation of the mixedwood growth model (MGM) for use in forest management decision making. Forests 2013, 4, 1–27. [Google Scholar] [CrossRef]
- Pitt, D.G.; Comeau, P.G.; Parker, W.C.; Hoepting, M.K.; MacIsaac, D.; McPherson, S.; Mihajlovich, M. Early vegetation control for the regeneration of a single-cohort, intimate mixture of white spruce and aspen on upland boreal sites-10th year update. For. Chron. 2015, 91, 238–251. [Google Scholar] [CrossRef] [Green Version]
- Cortini, F.; Comeau, P.G.; Strimbu, V.C.; Hogg, E.H.; Bokalo, M.; Huang, S. Survival functions for boreal tree species in northwestern North America. For. Ecol. Manag. 2017, 402, 177–185. [Google Scholar] [CrossRef]
- Stadt, K.J.; Huston, C.; Coates, K.D.; Feng, Z.; Dale, M.R.T.; Lieffers, V.J. Evaluation of competition and light estimation indices for predicting diameter growth in mature boreal mixed forests. Ann. For. Sci. 2007, 64, 477–490. [Google Scholar] [CrossRef] [Green Version]
- Constabel, A.J.; Lieffers, V.J. Seasonal patterns of light transmission through boreal mixedwood canopies. Can. J. For. Res. 1996, 1008–1014. [Google Scholar] [CrossRef]
- Rice, J.A.; MacDonald, G.B.; Weingartner, D.H. Precommercial thinning of trembling aspen in northern Ontario: Part 1—Growth responses. For. Chron. 2001, 77, 893–901. [Google Scholar] [CrossRef] [Green Version]
- Peterson, E.B.; Peterson, N.M. Ecology, Management and Use of Aspen and Balsam Poplar in the Prairie Provinces, Canada; Northern Forestry Centre: Edmonton, AB, Canada, 1992.
- Diaconu, D.; Kahle, H.-P.; Spiecker, H. Tree- and stand-level thinning effects on growth of European beech (Fagus sylvatica L.) on a northeast- and a southwest-facing slope in southwest Germany. Forests 2015, 6, 3256–3277. [Google Scholar] [CrossRef] [Green Version]
- Claveau, Y.; Comeau, P.G.; Messier, C.; Kelly, C.P. Early above- and below-ground responses of subboreal conifer seedlings to various levels of deciduous canopy removal. Can. J. For. Res. 2006, 36, 1891–1899. [Google Scholar] [CrossRef] [Green Version]
- Krebs, V.S. White Spruce Advanced Regeneration Response to Strip Cut Understory Protection Harvesting. Master’s Thesis, University of Alberta, Edmonton, AB, Canada, 2016. [Google Scholar] [CrossRef]
- Voicu, M.F.; Comeau, P.G. Microclimatic and spruce growth gradients adjacent to young aspen stands. For. Ecol. Manag. 2006, 221, 13–26. [Google Scholar] [CrossRef]
- Groot, A.; Schneider, R. Predicting maximum branch diameter from crown dimensions, stand characteristics and tree species. For. Chron. 2011, 87, 542–551. [Google Scholar] [CrossRef] [Green Version]
- Bella, I.E.; Yang, R.C. Should We Thin Young Aspen Stands? Navratil, S., Chapman, P.B., Eds.; North Forest Centre: Edmonton, AB, Canada, 1991; pp. 135–139.
- Comeau, P.G.; Fraser, E.C. Plant community diversity and tree growth following single and repeated glyphosate herbicide applications to a white spruce plantation. Forests 2018, 9, 107. [Google Scholar] [CrossRef] [Green Version]
- Grover, B.E.; Bokalo, M.; Greenway, K.J. White spruce understory protection: From planning to growth and yield. For. Chron. 2014, 90, 35–43. [Google Scholar] [CrossRef] [Green Version]
- Comeau, P. Effects of aerial strip spraying on mixedwood stand structure and tree growth. For. Chron. 2014, 90, 479–485. [Google Scholar] [CrossRef] [Green Version]
- Lieffers, V.J.; Sidders, D.; Keddy, T.; Solarik, K.A.; Blenis, P. A partial deciduous canopy, coupled with site preparation, produces excellent growth of planted white spruce. Can. J. For. Res. 2019, 49, 270–280. [Google Scholar] [CrossRef]
Figure 1.
Locations of the 14 Dynamic Aspen Density Experiment (DADE) installations across the Central Mixedwood Natural Subregion in Alberta, Canada.
Figure 1.
Locations of the 14 Dynamic Aspen Density Experiment (DADE) installations across the Central Mixedwood Natural Subregion in Alberta, Canada.

Figure 2.
Projected spruce top height trajectories by treatment using different combinations of input attributes. Growth and Yield Projection System (GYPSY) (SI, age) = GYPSY results based on input of site index and age; GYPSY (topH, SI) = GYPSY results based in input of top height and SI; GYPSY (topH, age) = GYPSY results based on input of top height and age; MGM = Mixedwood Growth Model (MGM) results.

Figure 3.
Density (stems ha−1) and survival rate (%) for aspen and spruce by treatment age group, measurement and treatment target density. Bars represent the treatment mean plus one standard error of the mean; numbers are the p-values from mixed-model Analysis of Variance (ANOVA) for a treatment difference; groups of bars within treatment age and measurement years with different letters indicate significant differences between treatments based on Tukey’s post-hoc test with Bonferroni’s adjustment. Survival rates for measurement periods two and three were calculated over a three- and five-year period respectively.

Figure 4.
Summary of site index by treatment by species. Site index (SI) represents tree height at a reference age of 50 years total age. Numbers show mean values. p-values are from mixed-model ANOVA.
Figure 4.
Summary of site index by treatment by species. Site index (SI) represents tree height at a reference age of 50 years total age. Numbers show mean values. p-values are from mixed-model ANOVA.

Figure 5.
Predicted growth trajectories from MGM and GYPSY. Top heights show predictions with no utilization standards applied, MAI and volume predictions are with “15/10” utilization standards applied. Treatments consider aspen thinned to the following densities: 0 stems ha−1, 1000 stems ha−1, 2500 stems ha−1, 5000 stems ha−1, and unthinned (control).


Table 1.
Study site (installation) information and characteristics. Treatment age represents stand age in the year of thinning and refers to years after harvest. Climate information represents means for the 1985–2018 period obtained from ClimateNA v6.11 [21]. MAT = Mean Annual Temperature; FFP = Frost Free Period; MAP = Mean Annual Precipitation; MSP = Mean Summer Precipitation; CMI = Climate Moisture Index (Hogg et al. 2013). SIaw = Site Index for aspen, calculated as an average of Site index for 4 aspen dominated treatment plots at the installation, and represents tree height at a reference age of 50 years total age; SIsw = Site Index for white spruce obtained using an aspen-to-spruce SI conversion model [22].
| Installation | Latitude (°) | Longitude (°) | Elevation (m) | MAT (°C) | FFP (days) | MAP (mm y−1) | MSP (mm y−1) | CMI (cm y−1) | SIAw (m) | SISw (m) |
|---|---|---|---|---|---|---|---|---|---|---|
| Age 17 | ||||||||||
| CM-17-1 | 54.8557 | −111.6737 | 644 | 1.6 | 113 | 450 | 308 | 1.4 | 23.9 | 22.9 |
| CM-17-2 | 55.1175 | −113.0397 | 604 | 1.8 | 110 | 450 | 312 | 0.8 | 22.5 | 21.0 |
| CM-17-3 | 53.3401 | −115.2576 | 878 | 3.3 | 107 | 537 | 383 | 6.1 | 23.9 | 22.9 |
| CM-17-4 | 53.3399 | −115.2661 | 870 | 3.3 | 107 | 538 | 384 | 6.3 | 23.5 | 22.3 |
| CM-17-5 | 53.3402 | −115.2643 | 874 | 3.3 | 107 | 537 | 383 | 6.3 | 22.2 | 20.6 |
| CM-17-6 | 53.3390 | −115.2628 | 873 | 3.3 | 107 | 537 | 383 | 6.3 | 23.8 | 22.7 |
| CM-17-7 | 53.3372 | −115.2417 | 877 | 3.3 | 107 | 535 | 382 | 6.1 | 23.1 | 21.9 |
| Age 22 | ||||||||||
| CM-22-2 | 55.2065 | −113.3787 | 623 | 1.7 | 110 | 457 | 317 | 2.3 | 24.7 | 24.0 |
| CM-22-5 | 56.0944 | −116.6290 | 716 | 1.4 | 104 | 458 | 299 | 3.8 | 19.6 | 17.1 |
| CM-22-6 | 55.9752 | −116.5754 | 760 | 1.5 | 105 | 473 | 312 | 4.5 | 21.3 | 19.4 |
| CM-22-7 | 56.0996 | −116.6179 | 725 | 1.4 | 104 | 464 | 304 | 4.0 | 21.7 | 19.9 |
| CM-22-8 * | 54.5726 | −114.7611 | 746 | 2.7 | 109 | 487 | 342 | 3.5 | 23.3 | 22.1 |
| CM-22-9 * | 54.5977 | −114.7909 | 758 | 2.7 | 109 | 491 | 345 | 4.1 | 21.8 | 20.0 |
| CM-22-10 * | 58.5602 | −117.6888 | 417 | −0.7 | 106 | 433 | 280 | 3.3 | 21.6 | 19.8 |
* Note: CM-22-8, CM-22-9, and CM-22-10 8-year re-measurement data was not available to include in this analysis.
Table 2.
Treatment means and standard deviations (shown in parentheses) from post-treatment measurements of dominant (200 stems ha−1 top diameter at breast height, 1.3 m (DBH) aspen) aspen trees. p-values are from mixed-model ANOVA; numbers with different letters within each measurement and treatment age, show significant differences between treatments based on Tukey’s post-hoc test with Bonferroni’s adjustment. N—sample size; DBH—mean diameter at breast height (1.3 m); HT—mean height; H-DBH—mean height-to-DBH ratio; Id—mean periodic annual diameter increment; Ih—mean periodic annual height increment. Idr—mean relative diameter growth; Ihr—mean relative height growth. Id and Ih were calculated over the three-year period for Measurement 2, and over the five-year period for Measurement 3. Idr and Ihr were calculated over the eight-year period between Measurements 1 and 3.
| Treatment Age | Measurement | Treatment | N | DBH (cm) | HT (m) | H-DBH | Id (cm) | Ih (m) | Idr (%) | Ihr (%) | |||||||
|---|---|---|---|---|---|---|---|---|---|---|---|---|---|---|---|---|---|
| 17 years | 1 | 1000 | 7 | 10.8 | (1.1) | 11.9 | (1.3) | 1.1 | (0.1) | ||||||||
| 2500 | 7 | 10.3 | (1.5) | 11.0 | (0.9) | 1.1 | (0.1) | ||||||||||
| 5000 | 7 | 10.9 | (1.8) | 12.1 | (1.4) | 1.1 | (0.1) | ||||||||||
| Control | 7 | 10.2 | (1.0) | 11.5 | (1.1) | 1.1 | (0.1) | ||||||||||
| p-value | 0.6592 | 0.2920 | 0.6317 | ||||||||||||||
| 2 | 1000 | 7 | 13.7 | (1.3) | 13.5 | (1.1) | 1.0 b | (0.0) | 0.96 a | (0.15) | 0.57 | (0.20) | |||||
| 2500 | 7 | 12.6 | (1.5) | 12.6 | (0.9) | 1.0 b | (0.1) | 0.79 b | (0.18) | 0.56 | (0.07) | ||||||
| 5000 | 7 | 12.8 | (1.7) | 14.0 | (1.6) | 1.1 ab | (0.1) | 0.64 c | (0.08) | 0.63 | (0.13) | ||||||
| Control | 7 | 11.7 | (1.0) | 13.4 | (0.9) | 1.2 a | (0.1) | 0.55 c | (0.08) | 0.61 | (0.07) | ||||||
| p-value | 0.1040 | 0.2129 | 0.0111 | <0.0001 | 0.5222 | ||||||||||||
| 3 | 1000 | 7 | 16.7 a | (1.7) | 15.6 | (1.1) | 0.9 c | (0.1) | 0.63 a | (0.14) | 0.41 | (0.11) | 57 a | (11) | 33 | (10) | |
| 2500 | 7 | 15.1 ab | (2.0) | 15.2 | (1.5) | 1.0 bc | (0.1) | 0.54 ab | (0.11) | 0.54 | (0.13) | 51 a | (12) | 40 | (5) | ||
| 5000 | 7 | 15.1 ab | (1.7) | 16.2 | (1.4) | 1.1 ab | (0.1) | 0.46 bc | (0.04) | 0.45 | (0.07) | 40 b | (8) | 34 | (4) | ||
| Control | 7 | 13.7 b | (0.8) | 15.6 | (0.8) | 1.2 a | (0.1) | 0.41 c | (0.09) | 0.46 | (0.14) | 38 b | (9) | 37 | (10) | ||
| p-value | 0.0249 | 0.4135 | 0.0013 | <0.0001 | 0.1749 | <0.0001 | 0.2607 | ||||||||||
| 22 years | 1 | 1000 | 7 | 12.5 | (1.5) | 14.0 | (1.1) | 1.1 | (0.1) | ||||||||
| 2500 | 7 | 12.5 | (1.7) | 13.8 | (1.7) | 1.1 | (0.0) | ||||||||||
| 5000 | 7 | 11.9 | (1.1) | 13.5 | (1.2) | 1.1 | (0.1) | ||||||||||
| Control | 7 | 12.1 | (1.2) | 14.0 | (1.4) | 1.2 | (0.1) | ||||||||||
| p-value | 0.6925 | 0.8536 | 0.7217 | ||||||||||||||
| 2 | 1000 | 7 | 14.5 | (1.6) | 15.1 | (1.2) | 1.0 | (0.1) | 0.70 a | (0.12) | 0.37 | (0.09) | |||||
| 2500 | 7 | 13.8 | (1.9) | 14.9 | (1.9) | 1.1 | (0.1) | 0.50 b | (0.16) | 0.35 | (0.14) | ||||||
| 5000 | 7 | 13.2 | (1.3) | 14.3 | (1.1) | 1.1 | (0.1) | 0.45 bc | (0.11) | 0.24 | (0.20) | ||||||
| Control | 7 | 13.2 | (1.3) | 15.0 | (1.8) | 1.1 | (0.0) | 0.40 c | (0.13) | 0.32 | (0.18) | ||||||
| p-value | 0.1344 | 0.6478 | 0.1487 | <0.0001 | 0.1677 | ||||||||||||
| 3 | 1000 | 4 | 17.2 a | (1.4) | 16.9 | (1.8) | 1.0 c | (0.0) | 0.39 a | (0.15) | 0.22 | (0.21) | 33 a | (8) | 17 | (8) | |
| 2500 | 4 | 15.8 ab | (2.1) | 16.5 | (2.4) | 1.1 bc | (0.0) | 0.35 ab | (0.14) | 0.28 | (0.25) | 28 ab | (9) | 19 | (12) | ||
| 5000 | 4 | 14.5 bc | (2.1) | 16.0 | (2.5) | 1.1 ab | (0.1) | 0.31 bc | (0.13) | 0.38 | (0.22) | 25 bc | (6) | 21 | (10) | ||
| Control | 4 | 14.0 c | (1.8) | 15.9 | (1.7) | 1.1 a | (0.1) | 0.27 c | (0.14) | 0.29 | (0.11) | 21 c | (7) | 17 | (6) | ||
| p-value | 0.0021 | 0.2094 | 0.0062 | 0.0112 | 0.2214 | 0.0074 | 0.6524 | ||||||||||
Table 3.
Treatment means and standard deviations (shown in parentheses) for post-treatment measurements of planted white spruce. p-values are from mixed-model ANOVA; means within measurement and treatment age followed by different letters are significantly different based on Tukey’s post-hoc test with Bonferroni’s adjustment. N—sample size; DBH—mean diameter at breast height (1.3 m); HT—mean height; H-DBH—mean height-to-DBH ratio; SR—mean periodic survival rate; Id—mean periodic annual diameter increment; Ih—mean periodic annual height increment; Idr—mean relative diameter growth; Ihr—mean relative height growth. Id, and Ih are calculated over the three-year period for Measurement 2, and over the five-year period for Measurement 3. Idr and Ihr were calculated over the eight-year period between measurements 1 and 3.
| Treatment Age | Measurement | Treatment | N | DBH (cm) | HT (m) | H-DBH | Id (cm) | Ih (m) | Idr (%) | Ihr (%) | |||||||
|---|---|---|---|---|---|---|---|---|---|---|---|---|---|---|---|---|---|
| 17 years | 1 | 0 | 7 | 2.5 | (0.7) | 2.9 | (0.6) | 1.6 | (0.3) | ||||||||
| 1000 | 7 | 2.5 | (1.0) | 2.9 | (0.6) | 1.5 | (0.3) | ||||||||||
| 2500 | 7 | 2.3 | (0.7) | 2.7 | (0.5) | 1.6 | (0.3) | ||||||||||
| 5000 | 7 | 2.2 | (0.7) | 2.6 | (0.5) | 1.7 | (0.3) | ||||||||||
| Control | 7 | 2.2 | (1.0) | 2.7 | (0.7) | 1.6 | (0.3) | ||||||||||
| p-value | 0.2575 | 0.1814 | 0.3021 | ||||||||||||||
| 2 | 0 | 7 | 4.0 a | (1.3) | 3.3 | (0.8) | 1.0 b | (0.1) | 0.63 a | (0.09) | 0.21 b | (0.09) | |||||
| 1000 | 7 | 3.9 a | (1.4) | 3.6 | (0.9) | 1.1 b | (0.2) | 0.54 a | (0.08) | 0.29 a | (0.09) | ||||||
| 2500 | 7 | 3.6 ab | (1.0) | 3.5 | (0.7) | 1.2 b | (0.1) | 0.46 b | (0.07) | 0.28 ab | (0.07) | ||||||
| 5000 | 7 | 3.1 b | (0.7) | 3.3 | (0.6) | 1.4 a | (0.1) | 0.38 bc | (0.07) | 0.28 ab | (0.09) | ||||||
| Control | 7 | 3.1 b | (1.3) | 3.3 | (1.0) | 1.3 a | (0.2) | 0.34 c | (0.10) | 0.26 ab | (0.10) | ||||||
| p-value | 0.0023 | 0.3441 | <0.0001 | <0.0001 | 0.0379 | ||||||||||||
| 3 | 0 | 7 | 7.3 a | (1.3) | 5.0 a | (1.1) | 0.7 c | (0.0) | 0.68 a | (0.05) | 0.36 ab | (0.06) | 376 a | (128) | 99 a | (18) | |
| 1000 | 7 | 6.3 b | (1.8) | 5.3 a | (1.2) | 0.9 bc | (0.1) | 0.53 b | (0.04) | 0.39 a | (0.07) | 269 b | (75) | 108 b | (16) | ||
| 2500 | 7 | 5.3 c | (1.3) | 4.8 ab | (1.1) | 1.0 ab | (0.2) | 0.40 c | (0.04) | 0.31 b | (0.06) | 224 bc | (64) | 92 bc | (8) | ||
| 5000 | 7 | 4.4 c | (1.1) | 4.3 b | (0.9) | 1.2 a | (0.2) | 0.34 cd | (0.03) | 0.24 c | (0.05) | 203 bc | (56) | 83 bc | (11) | ||
| Control | 7 | 4.4 c | (1.7) | 4.3 b | (1.4) | 1.2 a | (0.2) | 0.29 d | (0.08) | 0.22 c | (0.08) | 167 c | (45) | 73 c | (11) | ||
| p-value | <0.0001 | <0.0001 | <0.0001 | <0.0001 | <0.0001 | <0.0001 | <0.0001 | ||||||||||
| 22 years | 1 | 0 | 7 | 4.6 | (1.6) | 4.8 | (1.4) | 1.2 | (0.2) | ||||||||
| 1000 | 7 | 4.5 | (1.5) | 4.6 | (1.1) | 1.2 | (0.2) | ||||||||||
| 2500 | 7 | 4.3 | (1.9) | 4.5 | (1.6) | 1.3 | (0.2) | ||||||||||
| 5000 | 7 | 4.5 | (1.6) | 4.6 | (1.3) | 1.2 | (0.2) | ||||||||||
| Control | 7 | 4.5 | (1.1) | 4.8 | (1.0) | 1.2 | (0.1) | ||||||||||
| p-value | 0.9307 | 0.8837 | 0.5728 | ||||||||||||||
| 2 | 0 | 7 | 6.7 a | (1.9) | 5.1 | (1.3) | 0.8 c | (0.1) | 0.73 a | (0.15) | 0.10 b | (0.15) | |||||
| 1000 | 7 | 6.1 ab | (1.7) | 5.2 | (1.2) | 0.9 b | (0.1) | 0.53 b | (0.13) | 0.20 ab | (0.09) | ||||||
| 2500 | 7 | 5.5 b | (2.0) | 5.1 | (1.7) | 1.0 a | (0.1) | 0.39 c | (0.10) | 0.21 a | (0.06) | ||||||
| 5000 | 7 | 5.6 ab | (1.8) | 5.3 | (1.5) | 1.0 a | (0.1) | 0.36 c | (0.10) | 0.25 a | (0.06) | ||||||
| Control | 7 | 5.3 b | (1.1) | 5.5 | (1.0) | 1.1 a | (0.1) | 0.26 d | (0.04) | 0.23 a | (0.04) | ||||||
| p-value | 0.0160 | 0.6763 | <0.0001 | <0.0001 | 0.0009 | ||||||||||||
| 3 | 0 | 4 | 9.1 a | (1.1) | 6.3 | (0.8) | 0.7 c | (0.0) | 0.76 a | (0.02) | 0.42 a | (0.06) | 253 a | (47) | 84 a | (13) | |
| 1000 | 4 | 7.9 ab | (1.8) | 6.3 | (1.1) | 0.8 b | (0.1) | 0.58 b | (0.13) | 0.37 ab | (0.03) | 167 b | (30) | 71 ab | (13) | ||
| 2500 | 4 | 6.5 b | (1.4) | 5.5 | (1.0) | 0.9 b | (0.1) | 0.51 bc | (0.14) | 0.33 ac | (0.07) | 177 b | (42) | 75 ab | (9) | ||
| 5000 | 4 | 6.5 b | (1.5) | 5.7 | (1.0) | 0.9 b | (0.1) | 0.42 cd | (0.12) | 0.29 bc | (0.05) | 134 b | (39) | 62 bc | (3) | ||
| Control | 4 | 6.2 b | (0.8) | 6.2 | (0.6) | 1.0 a | (0.1) | 0.32 d | (0.11) | 0.25 c | (0.07) | 72 c | (23) | 45 c | (8) | ||
| p-value | 0.0067 | 0.2620 | <0.0001 | <0.0001 | 0.002 | <0.0001 | <0.0001 | ||||||||||
Table 4.
Summary of treatment means for culmination age yields predicted by two forest growth and yield models (MGM and GYPSY) by stand age at thinning. Culmination age is determined for total (stand) MAI with “15/10” utilization standards in use. N is sample size (number of plots). VPT is merchantable volume per tree. Different letters show significantly different treatments within treatment age determined using Tukey’s post-hoc test (Bonferroni’s adjustment) after mixed-model ANOVA.
| Model | Treatment Age | Treatment | N | Age | Stand Dens. | Stand MAI | Volume | Avg. DBH | VPT | ||||
|---|---|---|---|---|---|---|---|---|---|---|---|---|---|
| Dec. | Con. | Total | Dec. | Con. | Dec. | Con. | |||||||
| Years | ha−1 | m3 ha−1 y−1 | m3 ha−1 | cm | m3 tree−1 | ||||||||
| MGM | 17y | 0 | 7 | 92 a | 945 b | 5.4 c | / | 495 a | 495 ab | / | 25.2 a | / | 0.54 a |
| 1000 | 7 | 79 b | 1302 a | 7.2 a | 261 a | 304 b | 565 a | 29.2 a | 20.7 b | 0.75 a | 0.31 b | ||
| 2500 | 7 | 73 b | 1380 a | 6.7 ab | 294 a | 195 c | 489 ab | 24.8 b | 18.7 bc | 0.51 b | 0.23 b | ||
| 5000 | 7 | 74 b | 1463 a | 6.5 ab | 302 a | 184 c | 486 ab | 23.5 b | 18.3 c | 0.47 b | 0.22 b | ||
| Control | 7 | 77 b | 1356 a | 6.1 bc | 279 a | 195 c | 474 b | 23.9 b | 19.0 bc | 0.49 b | 0.25 b | ||
| p-value | <0.0001 | <0.0001 | <0.0001 | <0.0001 | <0.0001 | <0.0001 | <0.0001 | <0.0001 | <0.0001 | <0.0001 | |||
| 22y | 0 | 4 | 96 a | 793 b | 4.3 c | / | 405 a | 405 ab | / | 25.4 a | / | 0.52 a | |
| 1000 | 4 | 82 b | 1051 a | 5.3 a | 195 a | 241 b | 436 a | 27.6 a | 21.4 b | 0.65 a | 0.32 b | ||
| 2500 | 4 | 79 b | 1214 a | 5.1 ab | 245 a | 157 c | 402 ab | 23.7 b | 18.9 c | 0.46 b | 0.23 c | ||
| 5000 | 4 | 80 b | 1166 a | 4.7 b | 205 a | 172 bc | 377 b | 22.3 b | 19.7 bc | 0.40 b | 0.26 bc | ||
| Control | 4 | 85 b | 1215 a | 4.9 b | 211 a | 201 bc | 412 ab | 22.7 b | 19.6 bc | 0.43 b | 0.27 bc | ||
| p-value | <0.0001 | <0.0001 | <0.0001 | <0.0001 | 0.0345 | <0.0001 | <0.0001 | <0.0001 | <0.0001 | ||||
| GYPSY | 17y | 0 | 7 | 97 a | 1121 b | 4.7 c | / | 416 a | 416 a | ||||
| 1000 | 7 | 82 b | 1027 b | 5.5 b | 173 c | 277 b | 450 a | ||||||
| 2500 | 7 | 74 c | 1149 b | 5.8 ab | 267 b | 164 c | 431 a | ||||||
| 5000 | 7 | 69 d | 1554 a | 6.4 a | 326 a | 110 d | 436 a | ||||||
| Control | 7 | 69 d | 1845 a | 6.3 a | 348 a | 82 d | 430 a | ||||||
| p-value | <0.0001 | <0.0001 | <0.0001 | <0.0001 | <0.0001 | <0.0001 | |||||||
| 22y | 0 | 4 | 96 a | 1040 b | 4.7 d | 123 c | 291 a | 414 ab | |||||
| 1000 | 4 | 82 b | 1242 b | 4.7 cd | 206 bc | 184 b | 390 b | ||||||
| 2500 | 4 | 78 c | 1180 b | 5.2 bc | 271 ab | 130 b | 401 b | ||||||
| 5000 | 4 | 75 cd | 1479 b | 5.3 b | 299 ab | 99 b | 398 b | ||||||
| Control | 4 | 72 d | 1972 a | 6.0 a | 347 a | 84 b | 431 a | ||||||
| p-value | <0.0001 | 0.0012 | <0.0001 | <0.0001 | <0.0001 | 0.0164 | |||||||
Publisher’s Note: MDPI stays neutral with regard to jurisdictional claims in published maps and institutional affiliations. |
© 2021 by the authors. Licensee MDPI, Basel, Switzerland. This article is an open access article distributed under the terms and conditions of the Creative Commons Attribution (CC BY) license (http://creativecommons.org/licenses/by/4.0/).
Share and Cite
MDPI and ACS Style
Bjelanovic, I.; Comeau, P.; Meredith, S.; Roth, B. Precommercial Thinning Increases Spruce Yields in Boreal Mixedwoods in Alberta, Canada. Forests 2021, 12, 412. https://0-doi-org.brum.beds.ac.uk/10.3390/f12040412
AMA Style
Bjelanovic I, Comeau P, Meredith S, Roth B. Precommercial Thinning Increases Spruce Yields in Boreal Mixedwoods in Alberta, Canada. Forests. 2021; 12(4):412. https://0-doi-org.brum.beds.ac.uk/10.3390/f12040412
Chicago/Turabian StyleBjelanovic, Ivan, Phil Comeau, Sharon Meredith, and Brian Roth. 2021. "Precommercial Thinning Increases Spruce Yields in Boreal Mixedwoods in Alberta, Canada" Forests 12, no. 4: 412. https://0-doi-org.brum.beds.ac.uk/10.3390/f12040412
Note that from the first issue of 2016, this journal uses article numbers instead of page numbers. See further details here.