Article

Rheological Properties of Wood–Plastic Composites by 3D Numerical Simulations: Different Components

1
Key Laboratory for Bio-Based Materials and Energy of Ministry of Education, College of Materials and Energy, South China Agricultural University, Guangzhou 510642, China
2
Guangdong Laboratory of Lingnan Modern Agriculture, Guangzhou 510642, China
3
College of Food Science, South China Agricultural University, Guangzhou 510642, China
4
Key Laboratory of Bio-based Material Science and Technology (Ministry of Education), Northeast Forestry University, Harbin 150040, China
*
Author to whom correspondence should be addressed.
Submission received: 4 March 2021 / Revised: 25 March 2021 / Accepted: 29 March 2021 / Published: 31 March 2021
(This article belongs to the Special Issue Evaluation and Protection of Wood and Wood Products)

Abstract

:
The rheological properties of wood–plastic composites (WPCs) with different wood fiber contents were investigated using a rotational rheometer under low shear rates. The flow field information was analyzed and simulated by Ansys Polyflow software. The results showed that the WPCs with different wood fiber contents behaved as typical power-law fluids. A higher wood fiber content increased the shear thinning ability and pseudoplasticity of the WPCs. The pressure, velocity, shear rate, and viscosity distributions of the WPC during extrusion could be predicted by computational fluid dynamics (CFD) Ansys Polyflow software to explore the effects of different components on the flow field of WPCs.

1. Introduction

Wood–plastic composites (WPCs) are made of wood fiber and thermoplastics and are used in many fields, including decoration, construction, and transport fields, due to their easy processability, relatively high mechanical strength, and weather resistance [1,2,3]. Polymeric materials are typically processed using injection, compression, and extrusion molding. Extrusion molding is one of the main processing methods for preparing WPCs because of its stable product quality and low cost [4,5]. To reduce the cost of WPC products, the fiber content in commercial WPCs is usually between 50 and 70 wt% [6]; however, such high wood fiber content increases the melt flow instability and surface defects during WPC extrusion, which great limit the extrusion speed profile [7,8].
Rheological properties are the most important properties during the extrusion of WPCs [9,10]. Many experimental studies have been conducted in recent years. Laufer et al. [11] combined the volume fraction of wood fibers with the rheological properties of WPCs to explore the relationship between the power law and the shear-thinning behavior of WPC melts. The viscosity of WPCs typically increases upon increasing the wood fiber content, while the non-Newton index (n) decreases [12,13]. The higher the wood fiber content, the more sensitive a WPC is to changes in the shear rate. Mazzanti et al. [12] also investigated the influence of the wood powder content and compatibilizer on the rheological properties and were the first to consider both temperature and natural fibers percentage. Mazzanti et al. [14] also investigated the influence of temperature and filler concentration on the rheology of wood fiber filled poly(lactic acid) to validate the program for predicting the complex viscosity of the composites at any temperature and filler amount. Altug et al. [15] investigated the rheological and mechanical properties of poly-propylene reinforced with wood fiber. Studies have shown that the flow property reduces depending on the reinforcement wood fiber content added to the reinforced plastics. The amount of wood fiber added is an important factor affecting the rheological properties of WPCs [7,15,16]. The rheological phenomenon caused by high fiber contents, such as a high viscosity, and strong shear thinning behavior, must be understood to properly formulate WPCs.
With the development of polymer extrusion molding, simulation methods of slit die have been extensively used to better understand the factors that influence the extrusion of polymers [17,18,19]. Sun et al. [18] used computational fluid dynamics (CFD) Ansys Polyflow software to analyze the effects of the screw rotating speed, stagger angle of kneading blocks, inlet flow rate, and initial temperature of the barrel on the mixing and reaction process in a twin-screw extruder. Liu et al. [20] used Polyflow to calculate the velocity, local shear rate, viscosity, and pressure distributions of materials during extrusion and the relationships among the rheological properties and flow field distribution of the materials were obtained. The effects of the die structure including expansion-die and dam-expansion-die on the extrusion flow field of short fiber and rubber composite during extrusion were also investigated using Polyflow [21]. The non-isothermal extrusion of hollow-profile viscoelastic fluids was simulated and the influence of processing conditions and die structure parameters on the polymer melt flow was studied [22]. Based on the residence time distribution (RTD) method, the die structure during the extrusion of polyolefin control products was optimized by the finite element method, which greatly improved the melt hysteresis and reflux. However, researchers have not extensively performed numerical simulations of WPC extrusion molding, such as the flow field analysis of WPCs with different components in the slit die.
Many recent experiments and numerical simulations have investigated the effects of polymer melt transport and polymer extrusion molding equipment on the extrusion process [23]; however, there are few studies on the extrusion of WPCs using numerical simulations based on computational fluid dynamics (CFD). Polyflow software based on the finite element method (FEM) has powerful functions for solving non-Newtonian fluids and nonlinear flow problems [24]. This software has been widely used for simulating/modeling plastics processing, screw-based extrusion, and pipe flow simulations [23]. For the extrusion of WPCs with different components, the effect of different fiber contents on the rheological properties of WPCs were studied. Numerical simulations were used to reveal the distribution of the flow field during the extrusion of power-law fluid and the effect of WPC with different components on the pressure, velocity, shear rate and viscosity distribution were reported in this article. This work provide a theoretical basis for the extrusion of WPCs with different wood fiber contents.

2. Materials and Methods

2.1. Materials

Poplar wood fiber was supplied by Lingshou Junyi Mineral Processing Factory. HDPE was supplied by China National Petroleum Corporation and had a melt flow index (MFI) of 20 g/10 min (at 190 °C and 2.16 kg according to ASTM D1238) and density of 0.95 g/cm3. Maleic anhydride grafted polyethylene (MAPE) with a grafting ratio of ca. 1% and a melt flow rate of 1.7 g/10 min (190 °C, 2.16 kg) was provided by Guangzhou Hecheng Chemical Co., Ltd., (Guangzhou, China). Lubricant (grade 530D, sodium stearate) was obtained from Guangzhou Hecheng Chemical Co., Ltd.

2.2. Preparation of Composites

The wood fiber (WF), HDPE, MAPE, and the lubricant were mixed in a high-speed mixer (100 rpm, HRS-10, Dongguan Huanxin Machinery Co., Ltd., Dongguan, China) for 10 min at 80 °C. All samples shown in Table 1 were manufactured using a twin-screw extruder (CTW100, Seymour Schir Technologies, Germany) with a screw speed of 30 rpm to fabricate a profile with dimensions of 25 mm × 4 mm (width × thickness).

2.3. Rheological Parameters

Rheological measurements of samples were performed by a hybrid rheometer (Discovery HR-2, DHR, TA Instruments, USA) using a 25 mm anti-slip parallel plate. Before experiments, excess materials outside the plate were scraped out and the samples were rested for 2 min to reach a steady state. Experiments were performed at 160 °C, 170 °C, and 180 °C, and the viscosity parameters were obtained at shear rates ranging from 0.01 to 1 s−1. For frequency sweeps, strain sweeps were performed first at the desired temperature to define a strain within the linear viscoelastic range. The dynamic viscoelastic properties were characterized at frequencies from 0.01 to 100 rad/s, and all measurements were performed within the identified linear viscoelastic region and at 0.02% strain. Experiments were conducted using seven replicates for each type of sample.

2.4. Polyflow Software Numerical Analysis

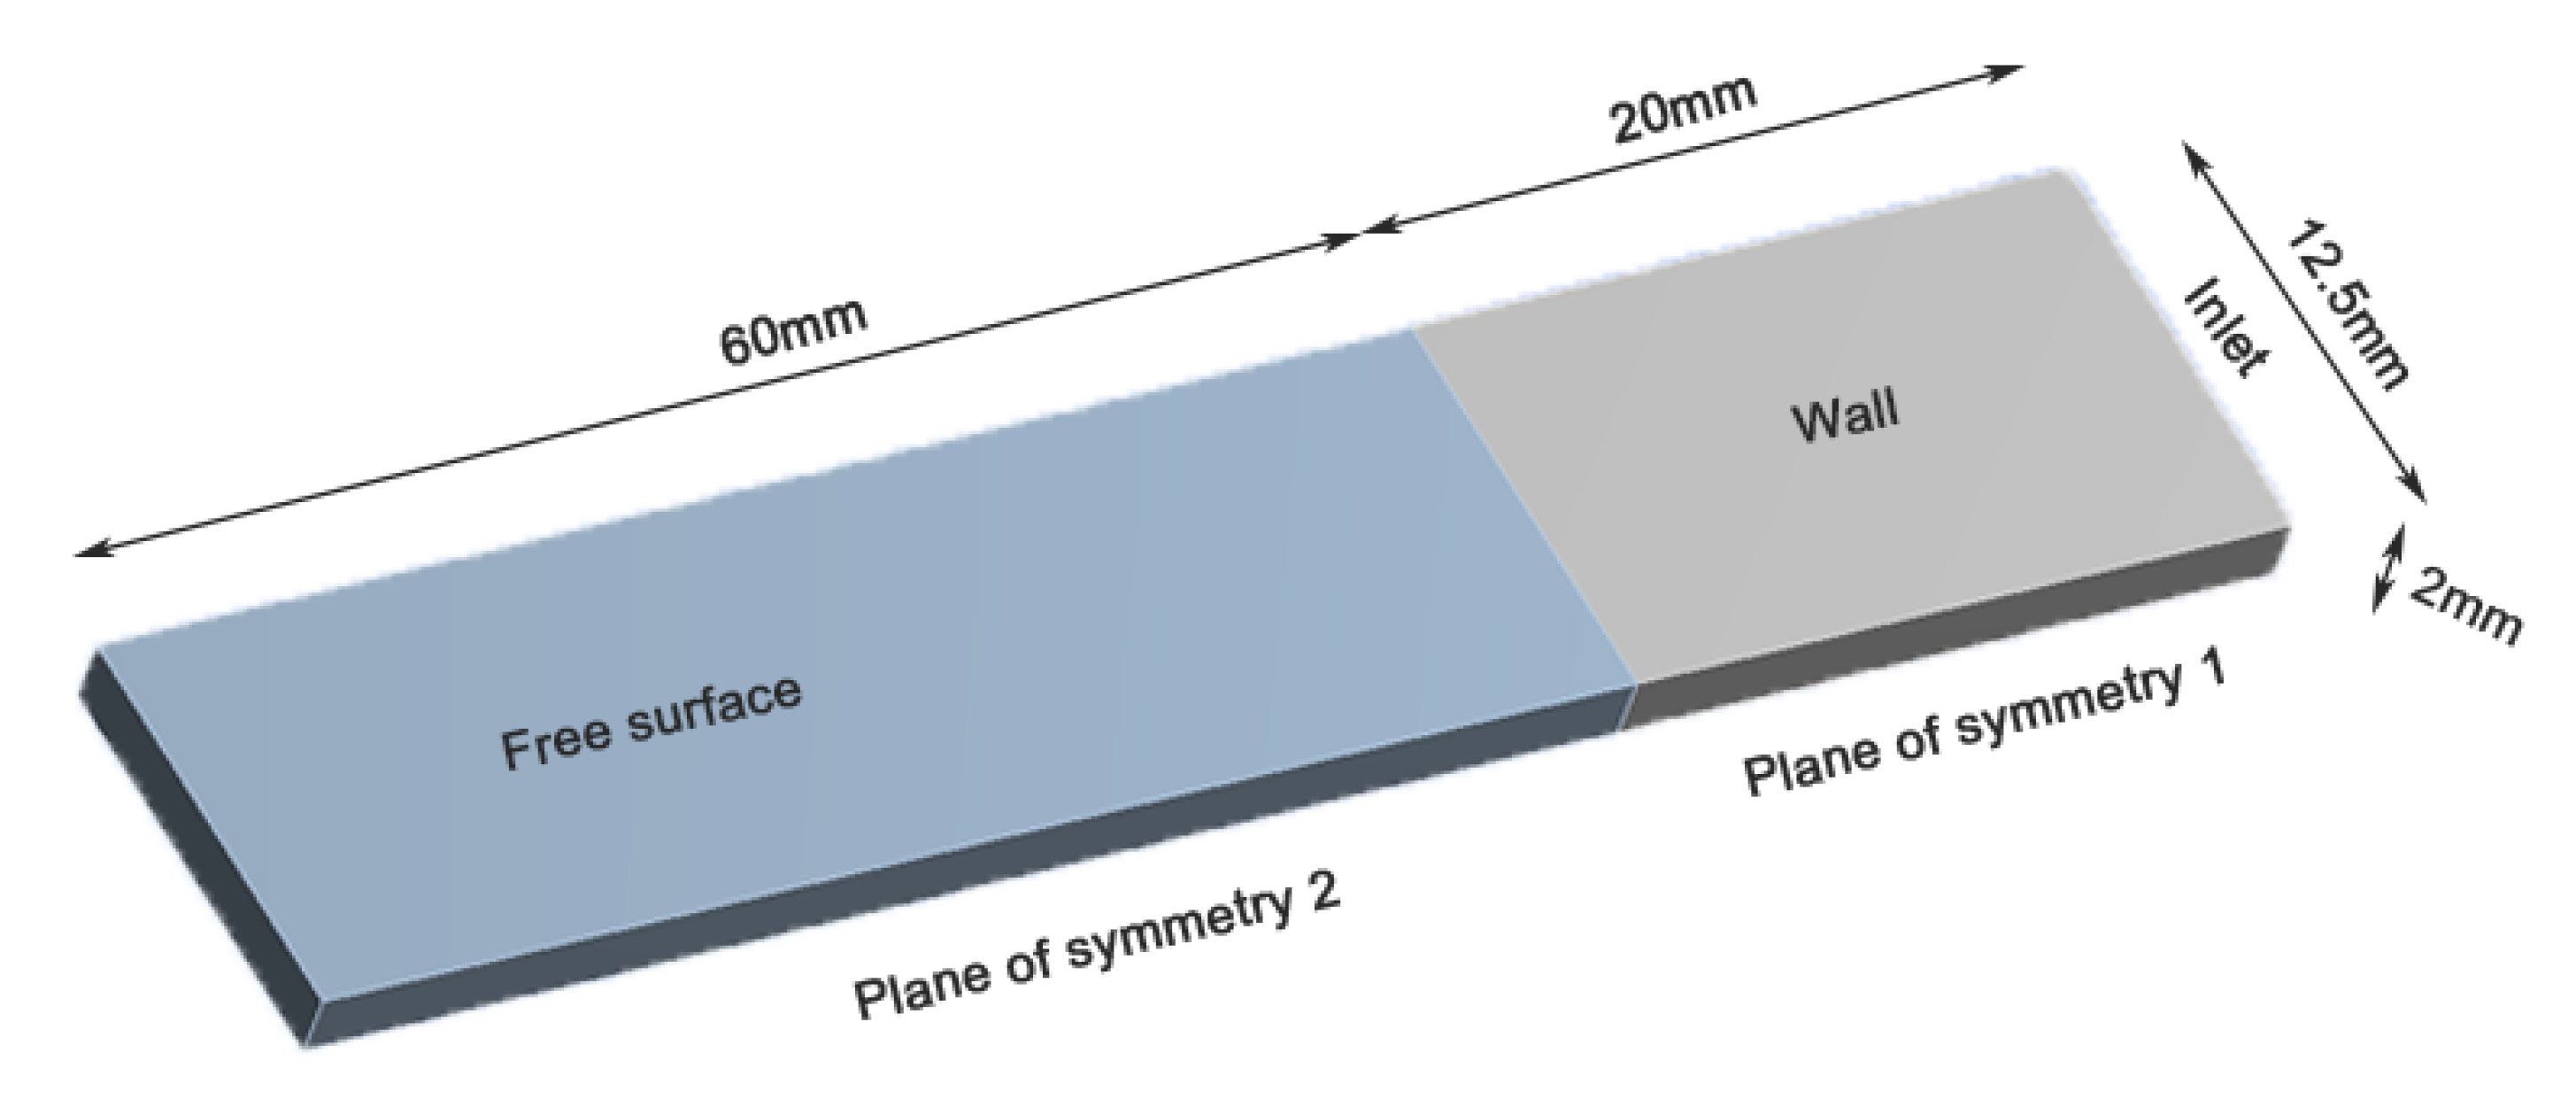
2.4.1. Finite Element Model

According to the slit die used in extrusion processing, a 3D flow domain physical model created by Space Claim software (Hot-World GmbH & Co. KG, Willich, Germany) is shown in Figure 1. Considering the symmetry of the geometry, 3D 1/4 axisymmetric graphics were used to simplify the model. The dimensions of the model are shown in Figure 1. The slit die model of the flow channel consisted of 3700 cells and 8888 nodes. The mesh was generated by the sweep mode. The source surface selected by the sweep was the inlet, the sweep bias was 3. For the slit die model, tetrahedral cells were used for partitioning, and the grids were arranged so that the denser grids were located near the die exit singularity while larger grids were used in other flow regions.

2.4.2. Simulation Condition

As a result of the complexity of the material flow state, it is difficult to accurately describe the flow characteristics, so some assumptions were used to simplify the flow behavior.
(1)
The material used for extrusion was an incompressible, highly viscous, non-Newtonian fluid.
(2)
The material fully filled the mold and underwent isothermal, steady, and laminar flow in the flow channel.
(3)
Inertia and gravity were neglected due to the slow flow velocity and high viscosity.
(4)
There was no slip between the material and the channel wall during extrusion [25].

2.4.3. Details of the Finite Element Calculations

The boundary of the model is shown in Figure 1. The flow boundary condition is defined as follows: The volume flow rate at the inlet was set to the actual extrusion flow rate. The volume flow rate was 3.2 × 10⁻⁷ m3/s. On the die walls, non-slip condition was assumed for the calculation to converge: v n   =   v s   =   0   ( mm / s ) , where v n and v s are the normal and tangential flow velocities of the melt, respectively. On the symmetry planes, usual symmetry conditions were applied: v n   =   0   ( mm / s ) , f s   =   0   ( n ) , where f s is the tangential stress of melt. On the free surface, the surface tension of the melt was ignored when the melt was extruded from the outlet of slit die, which is defined as f s   =   f n   =   0   ( n ) and v n   =   0 where f n is the normal stress of melt. At the flow domain outlet, it was assumed that no tangential velocity or normal forces were imposed on the exit boundary of the melt, and the force conditions are set as f s   =   f n   =   0   ( n ) .
The governing equations used in this paper are as follows:
· V   =   0
p     · τ   =   0
where ∇ is differential operator, V is the velocity, p is the pressure, and τ is the extra stress tension of the melt [26,27].
The shear rate has a significant effect on the viscosity of wood–plastic composites, the greater the shear rate, the lower the shear viscosity. In addition, the shear viscosity of the WPCs increased upon decreasing the temperature. All the shear viscosity curves of WPCs showed typical shear-thinning behavior. Thus, the shear viscosity of the WPCs can be described by the power law [9,28].
For the power law model, the viscosity, η , can be written as:
η = K ( λ γ ̇ ) n 1
where η is the viscosity, K is the viscosity coefficient, λ is the relaxation time, γ ̇ is the shear rate, n is the non-Newtonian index. The viscosity consistency index ( K ), non-Newton index ( n ), and relaxation time (λ) were calculated from the fitting curve of the rotational rheological test results.
The power law has broad application scope and can accurately describe the rheological curve of fluids at low and moderate shear rates.

2.4.4. Simulation Scheme

To ensure numerical accuracy, several interpolation methods of linear coordinates, linear velocities, pressure constants, and Picard iterations on viscosity were used [29,30]. An evolutionary scheme is applied on the moving boundaries to gradually solve the highly non-linear problems of the calculations [31].
The viscosity of the material, the shear rate, and the inlet flow rate are all important factors that affect the flow channel parameters. By changing a certain parameter, while keeping the other parameter constant, the effects of the rheological parameters of WPCs with different formulations on the flow field of gap molds were studied.

3. Results

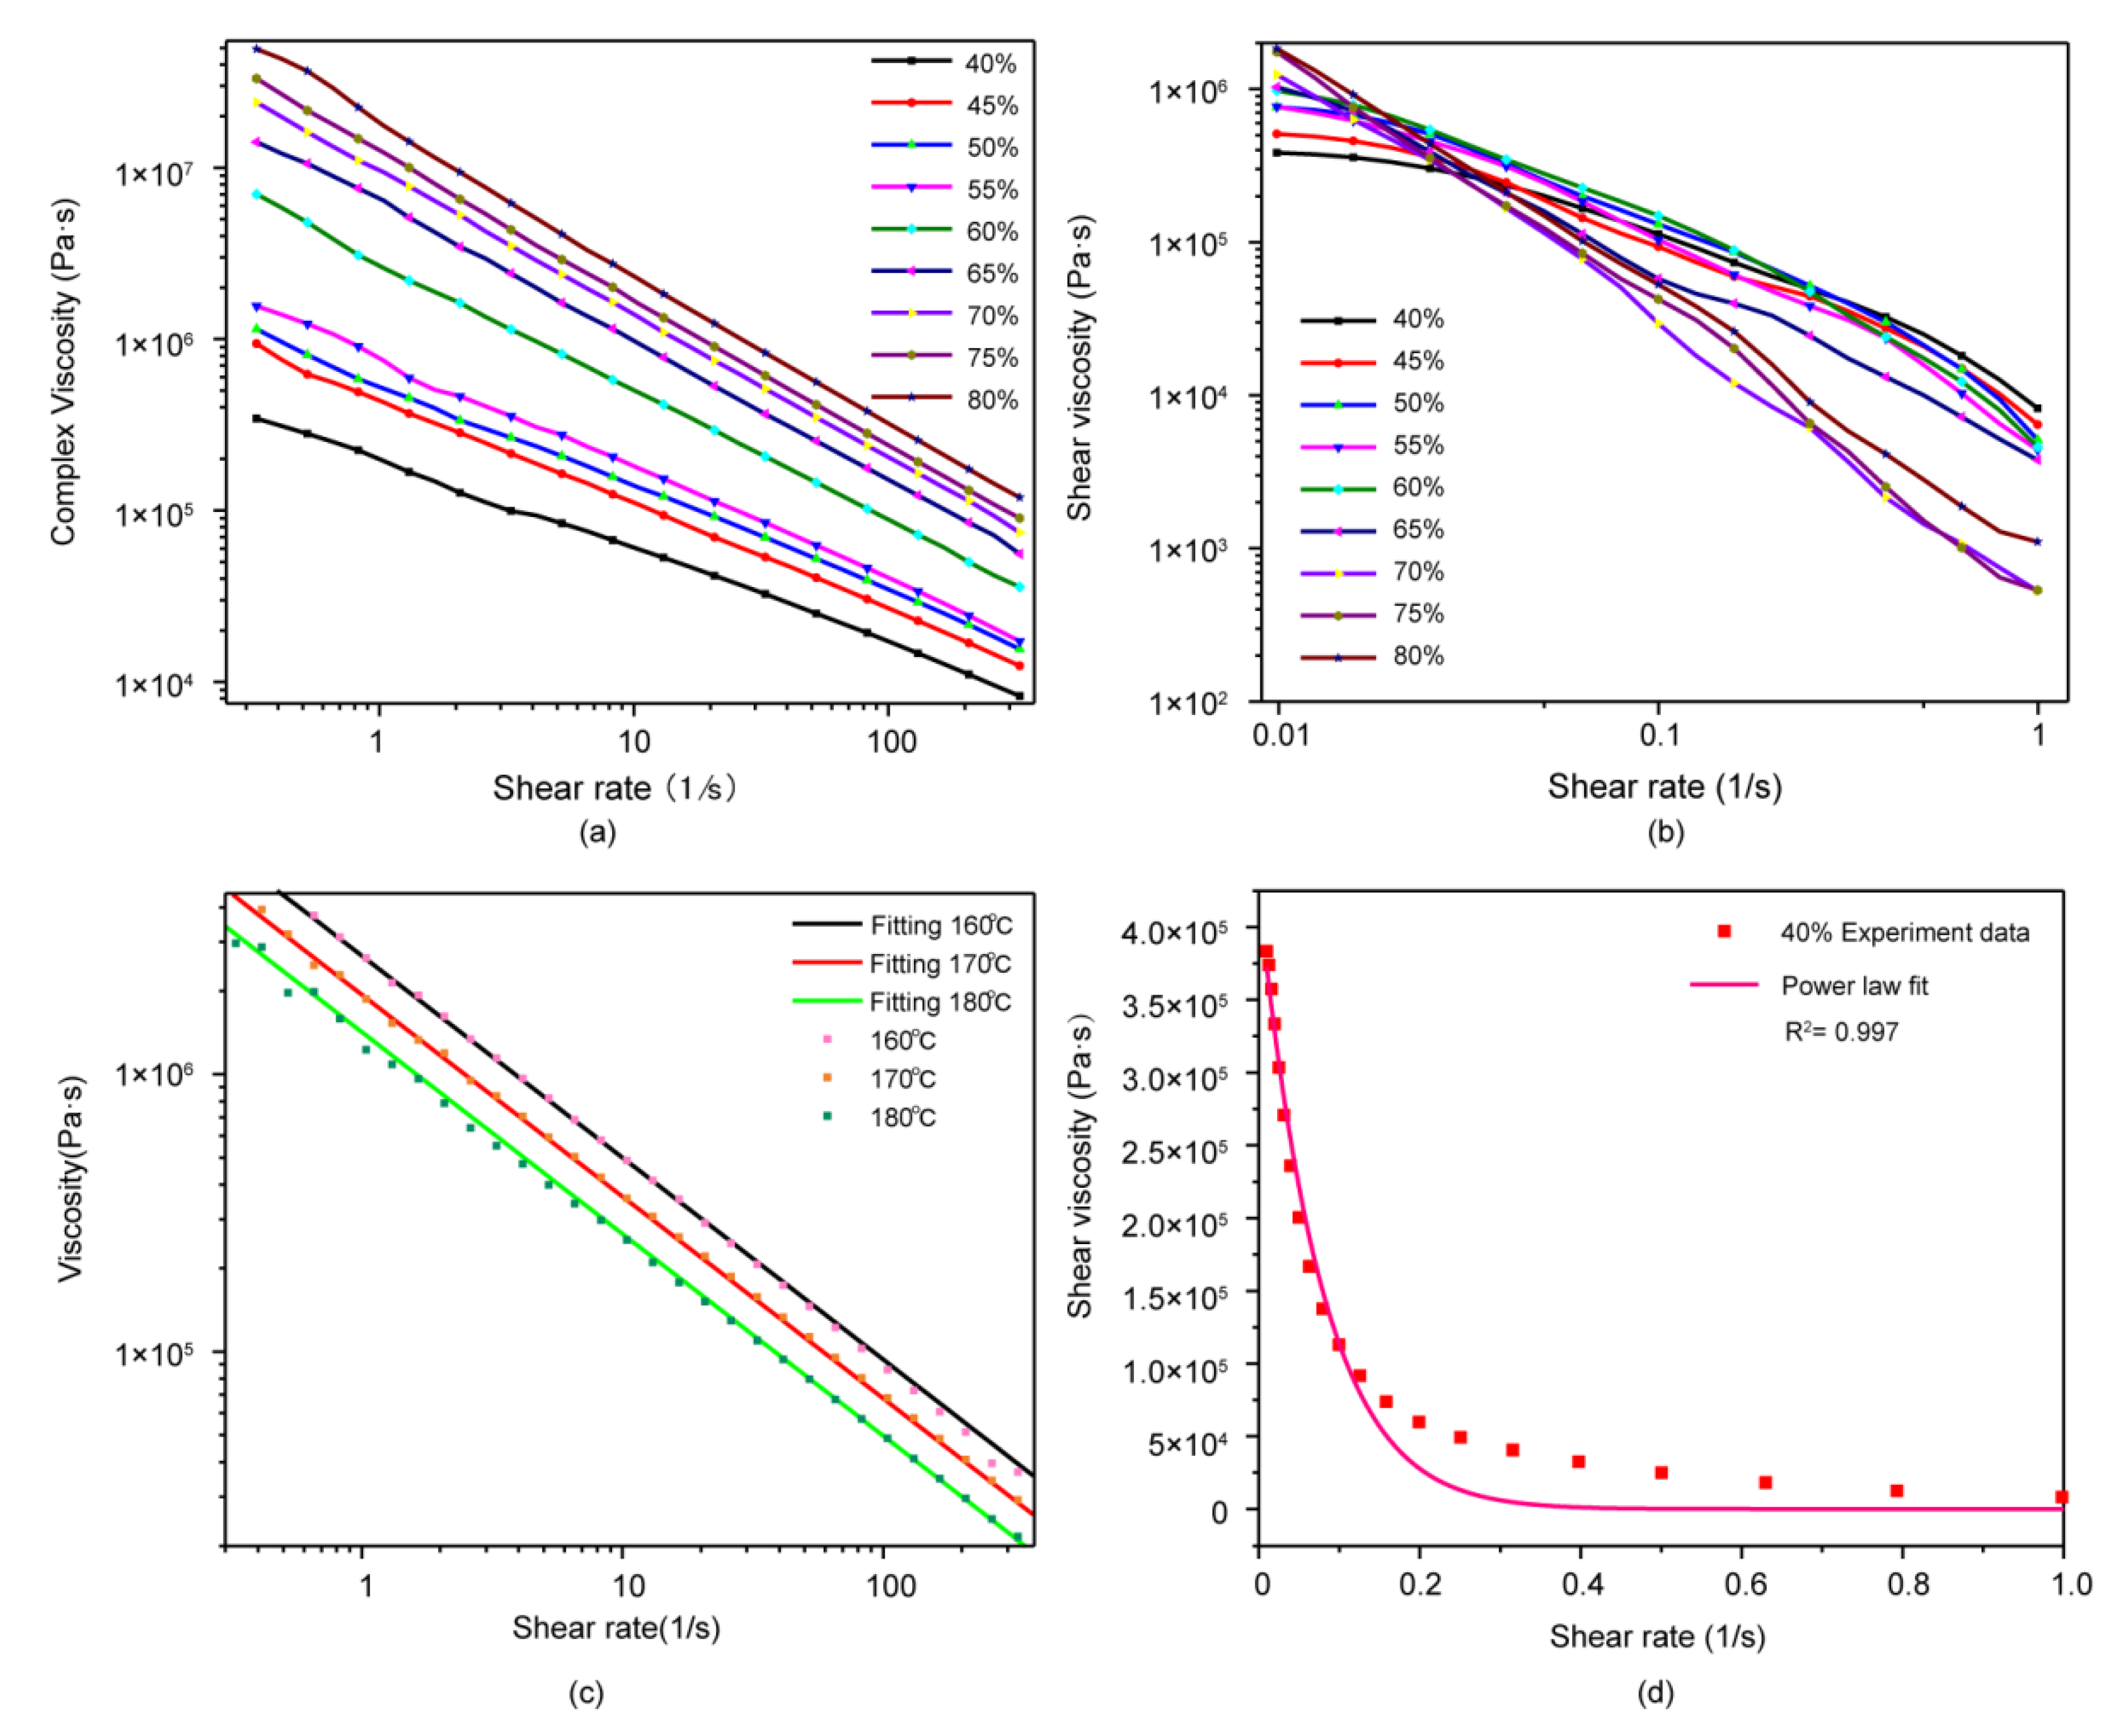
3.1. Rheological Behavior of Materials

Rheological property tests were conducted to investigate the performance of the composites during extrusion. By analyzing the experimental data obtained from a rotational rheometer, the flow curve was obtained, which visually represents the shear viscosity distribution at different shear rates.
Figure 2a shows the complex viscosity versus frequency for samples with different percentages of the wood fiber. Although the complex viscosity versus shear rate is reported, the shape of the curve was similar to that the shear viscosity versus shear rate. The complex viscosity increased upon increasing the wood content and decreased with frequency. The complex viscosity continuously increased at very low-shear rate but showed a smaller increase at high-shear rates [31].
The changes in the shear viscosity with the shear rate for nine different wood fiber concentrations are illustrated in Figure 2b. In all shear rate ranges, the shear rate significantly affected the viscosity of the WPCs. Generally, the shear viscosity decreases when the temperature increases. The WPC with 40% wood fiber showed the lowest shear viscosity compared with other samples over the entire shear rate range. The greater the shear rate, the lower the shear viscosity. In addition, the shear viscosities of the WPCs increased upon decreasing the temperature. All shear viscosity curves of the WPCs showed typical shear thinning behavior, as expected.
In this section, the power-law model was used to fit the viscosity-shear rate curves of the rheological data of WPCs, as shown in Figure 3c. The R2 values varied between 0.977 and 0.996 (Table 2), and the correlation coefficient between the Polymat curve fitting and experimental data was high (Figure 2d). Simultaneously, the viscosity consistency index (K) increased, and the non-Newton index (n) decreased upon increasing the wood fiber content. The K and n values both affect the rheological properties of WPCs, which obey the power-law model. The shear-thinning ability of the material increased when the n value decreased. A higher wood fiber content increased the shear-thinning ability and pseudoplasticity of the materials. The high R2 proved that the constitutive model better described the rheological properties of the WPCs, while the power-law model better characterized the pseudoplasticity of the WPC melt [32].

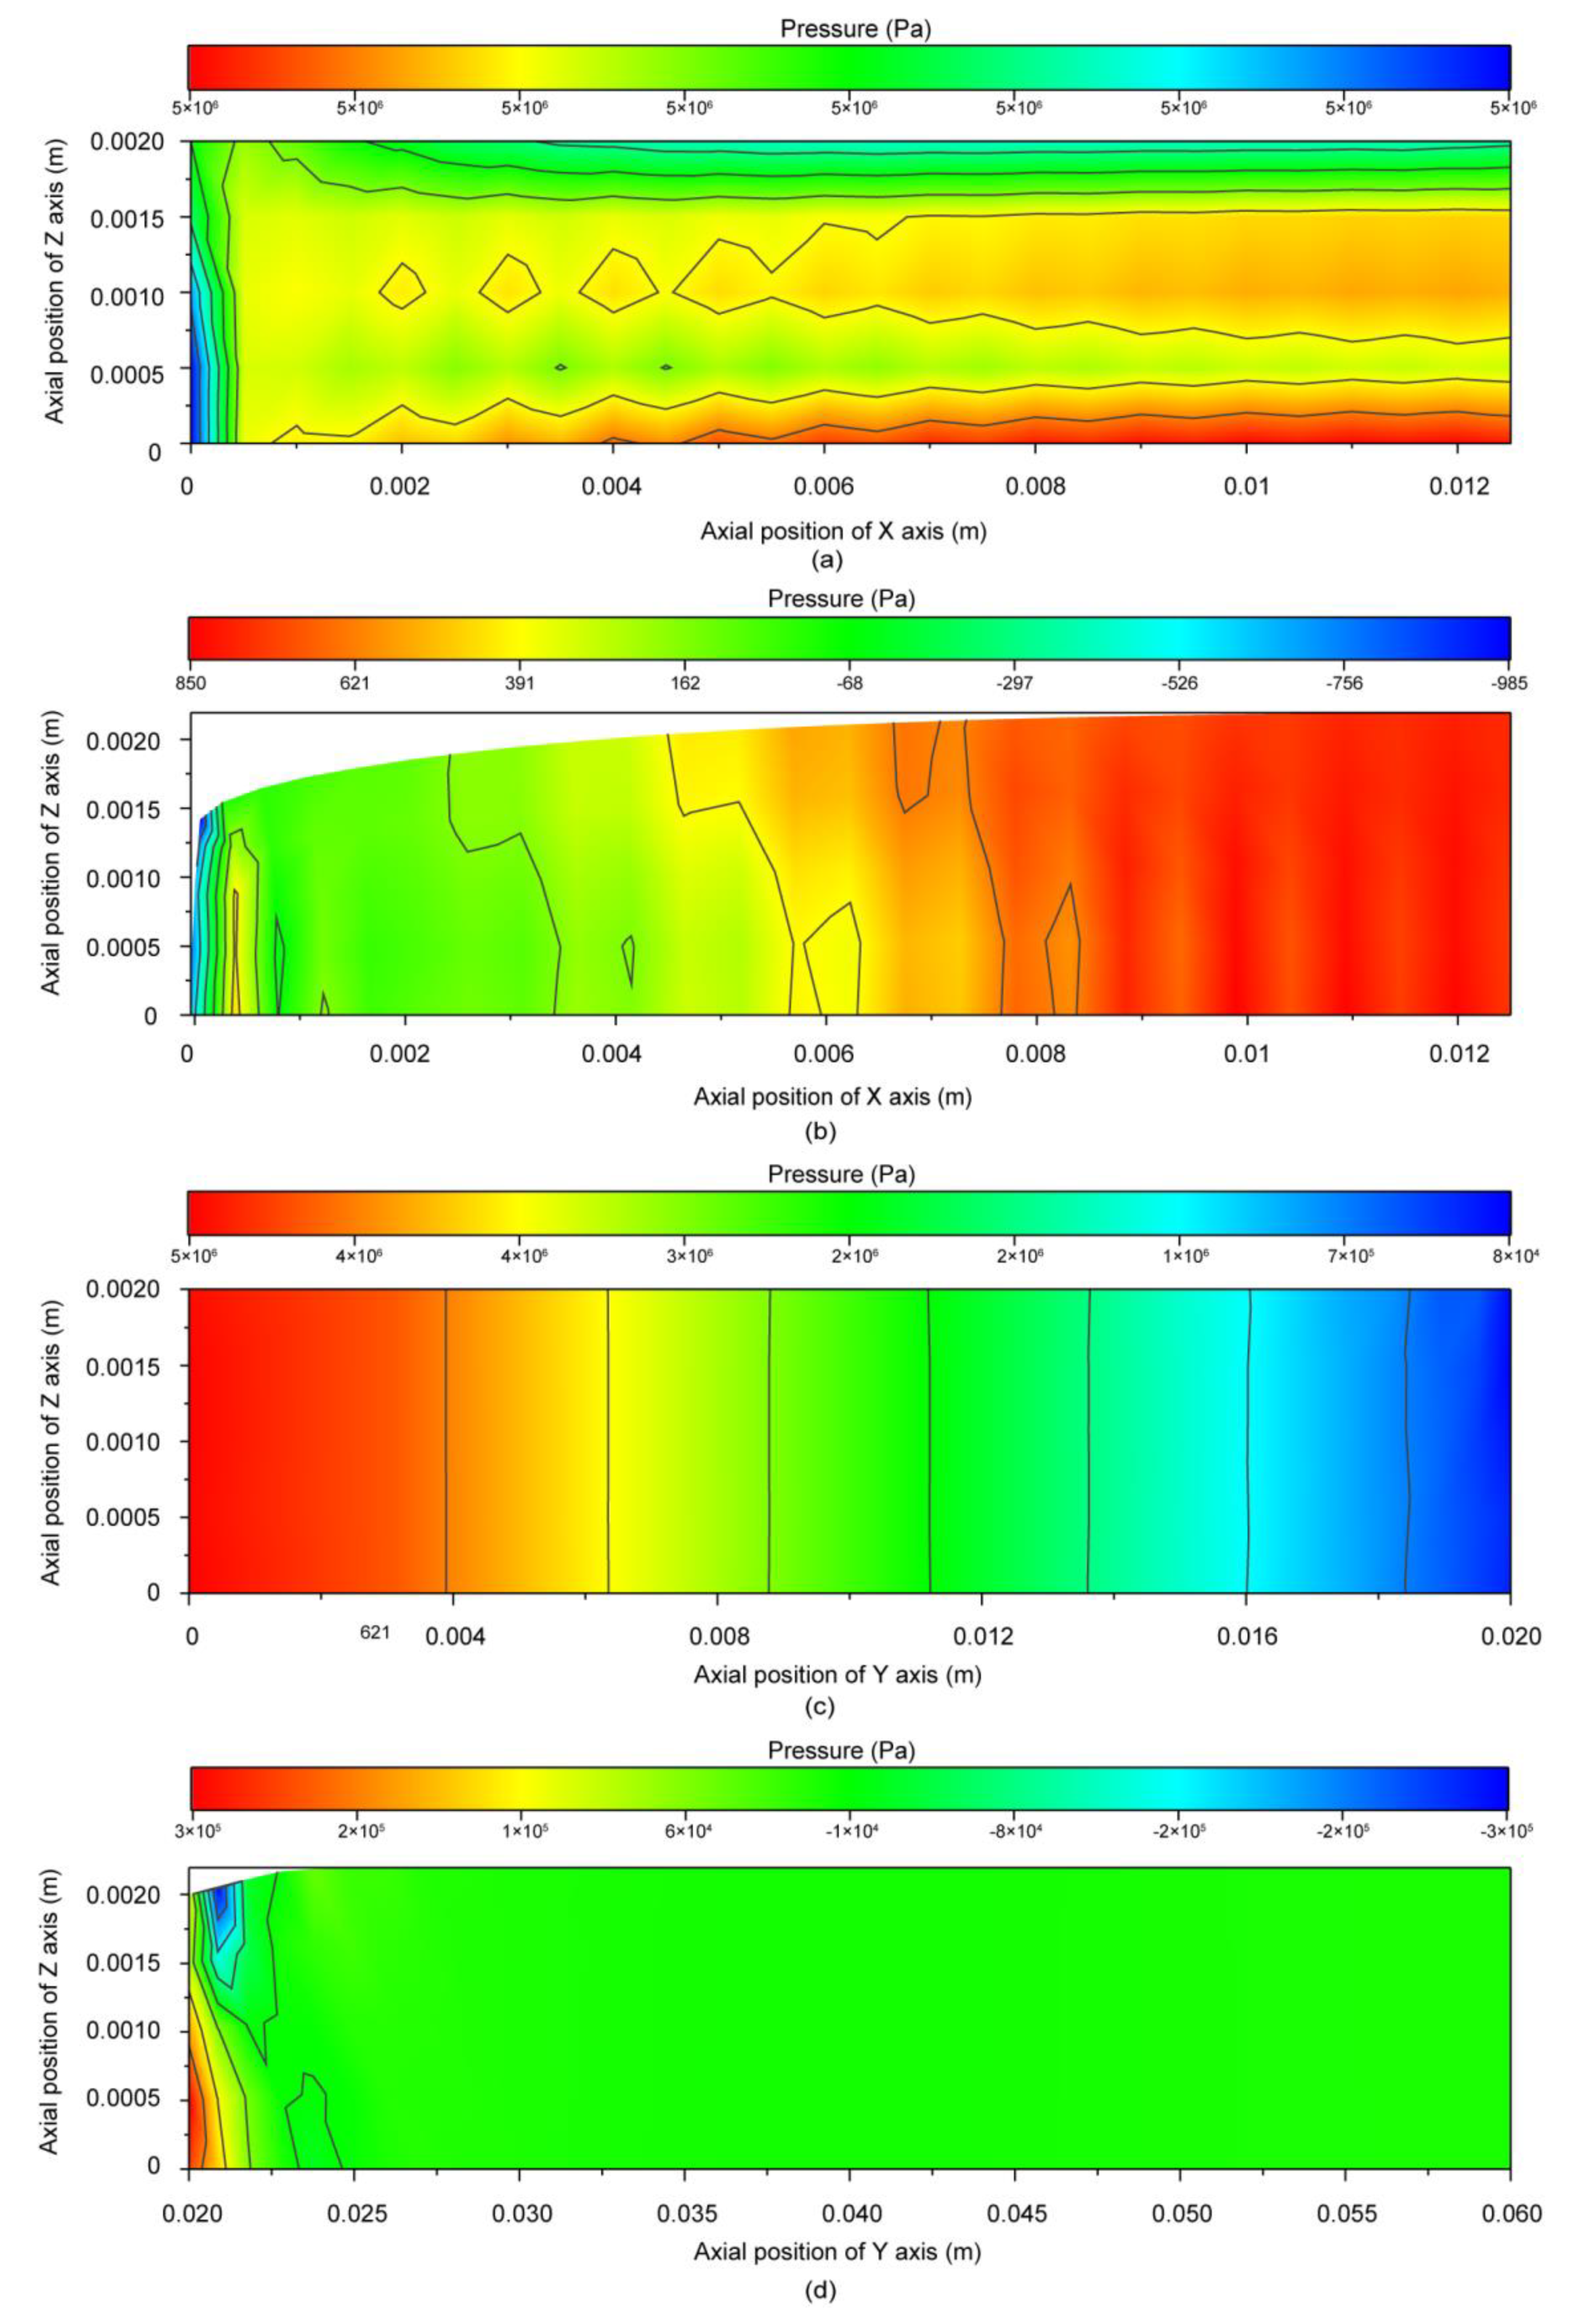
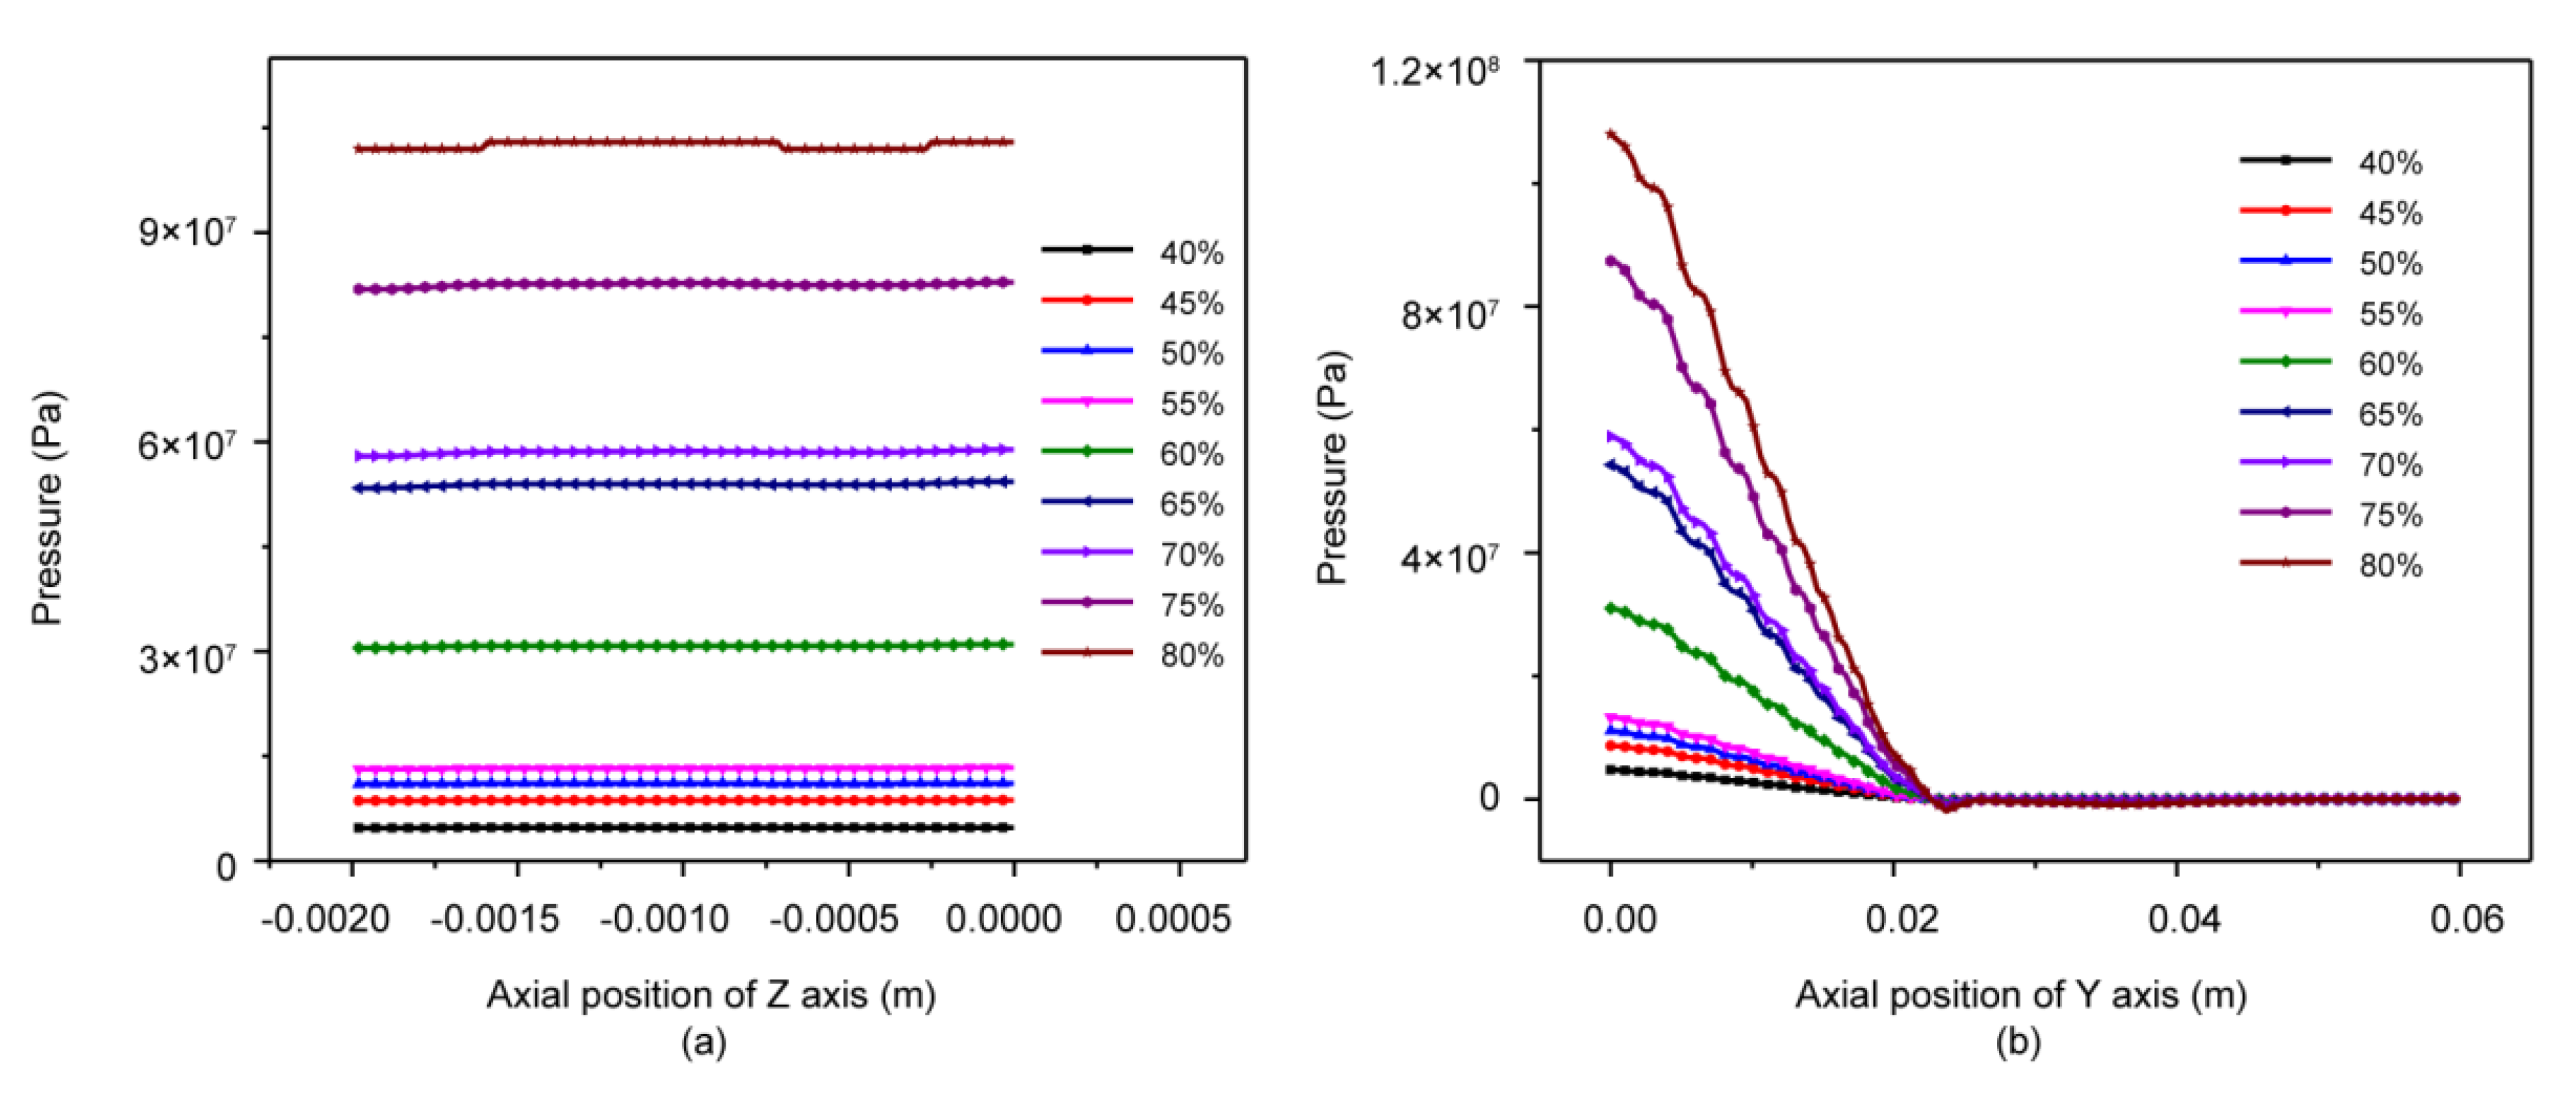
3.2. Pressure Distribution Field Analysis

The flow field distribution used the WPC with 40% wood fiber as an example. The pressure distribution in the flow field during extrusion and changes in the pressure on the central axis along the extrusion direction are illustrated in Figure 3. From the entrance to the exit of the slit die, the overall pressure field on the same horizontal section noticeably changed, but it basically remained the same downstream of the die exit (20–60 mm from the entrance). Upstream at the slit die (0–20 mm from the entrance), the pressure field at the center of melt flow gradually decreased, while the pressure field of WPCs showed no obvious change at the inlet (Figure 3a). At the plane of symmetry 1, the pressure gradually decreased along the y-axis, and the pressure field rapidly decreased at the entrance downstream of the die, while it quickly stabilized on the plane of symmetry 2 (Figure 3c,d). This phenomenon indicated that the slit die required a large pressure during the extrusion of WPCs. The pressure field downstream of die exit remained at a low level with no significant changes, but the pressure level at the die exit was higher than that downstream of the die (Figure 3b).

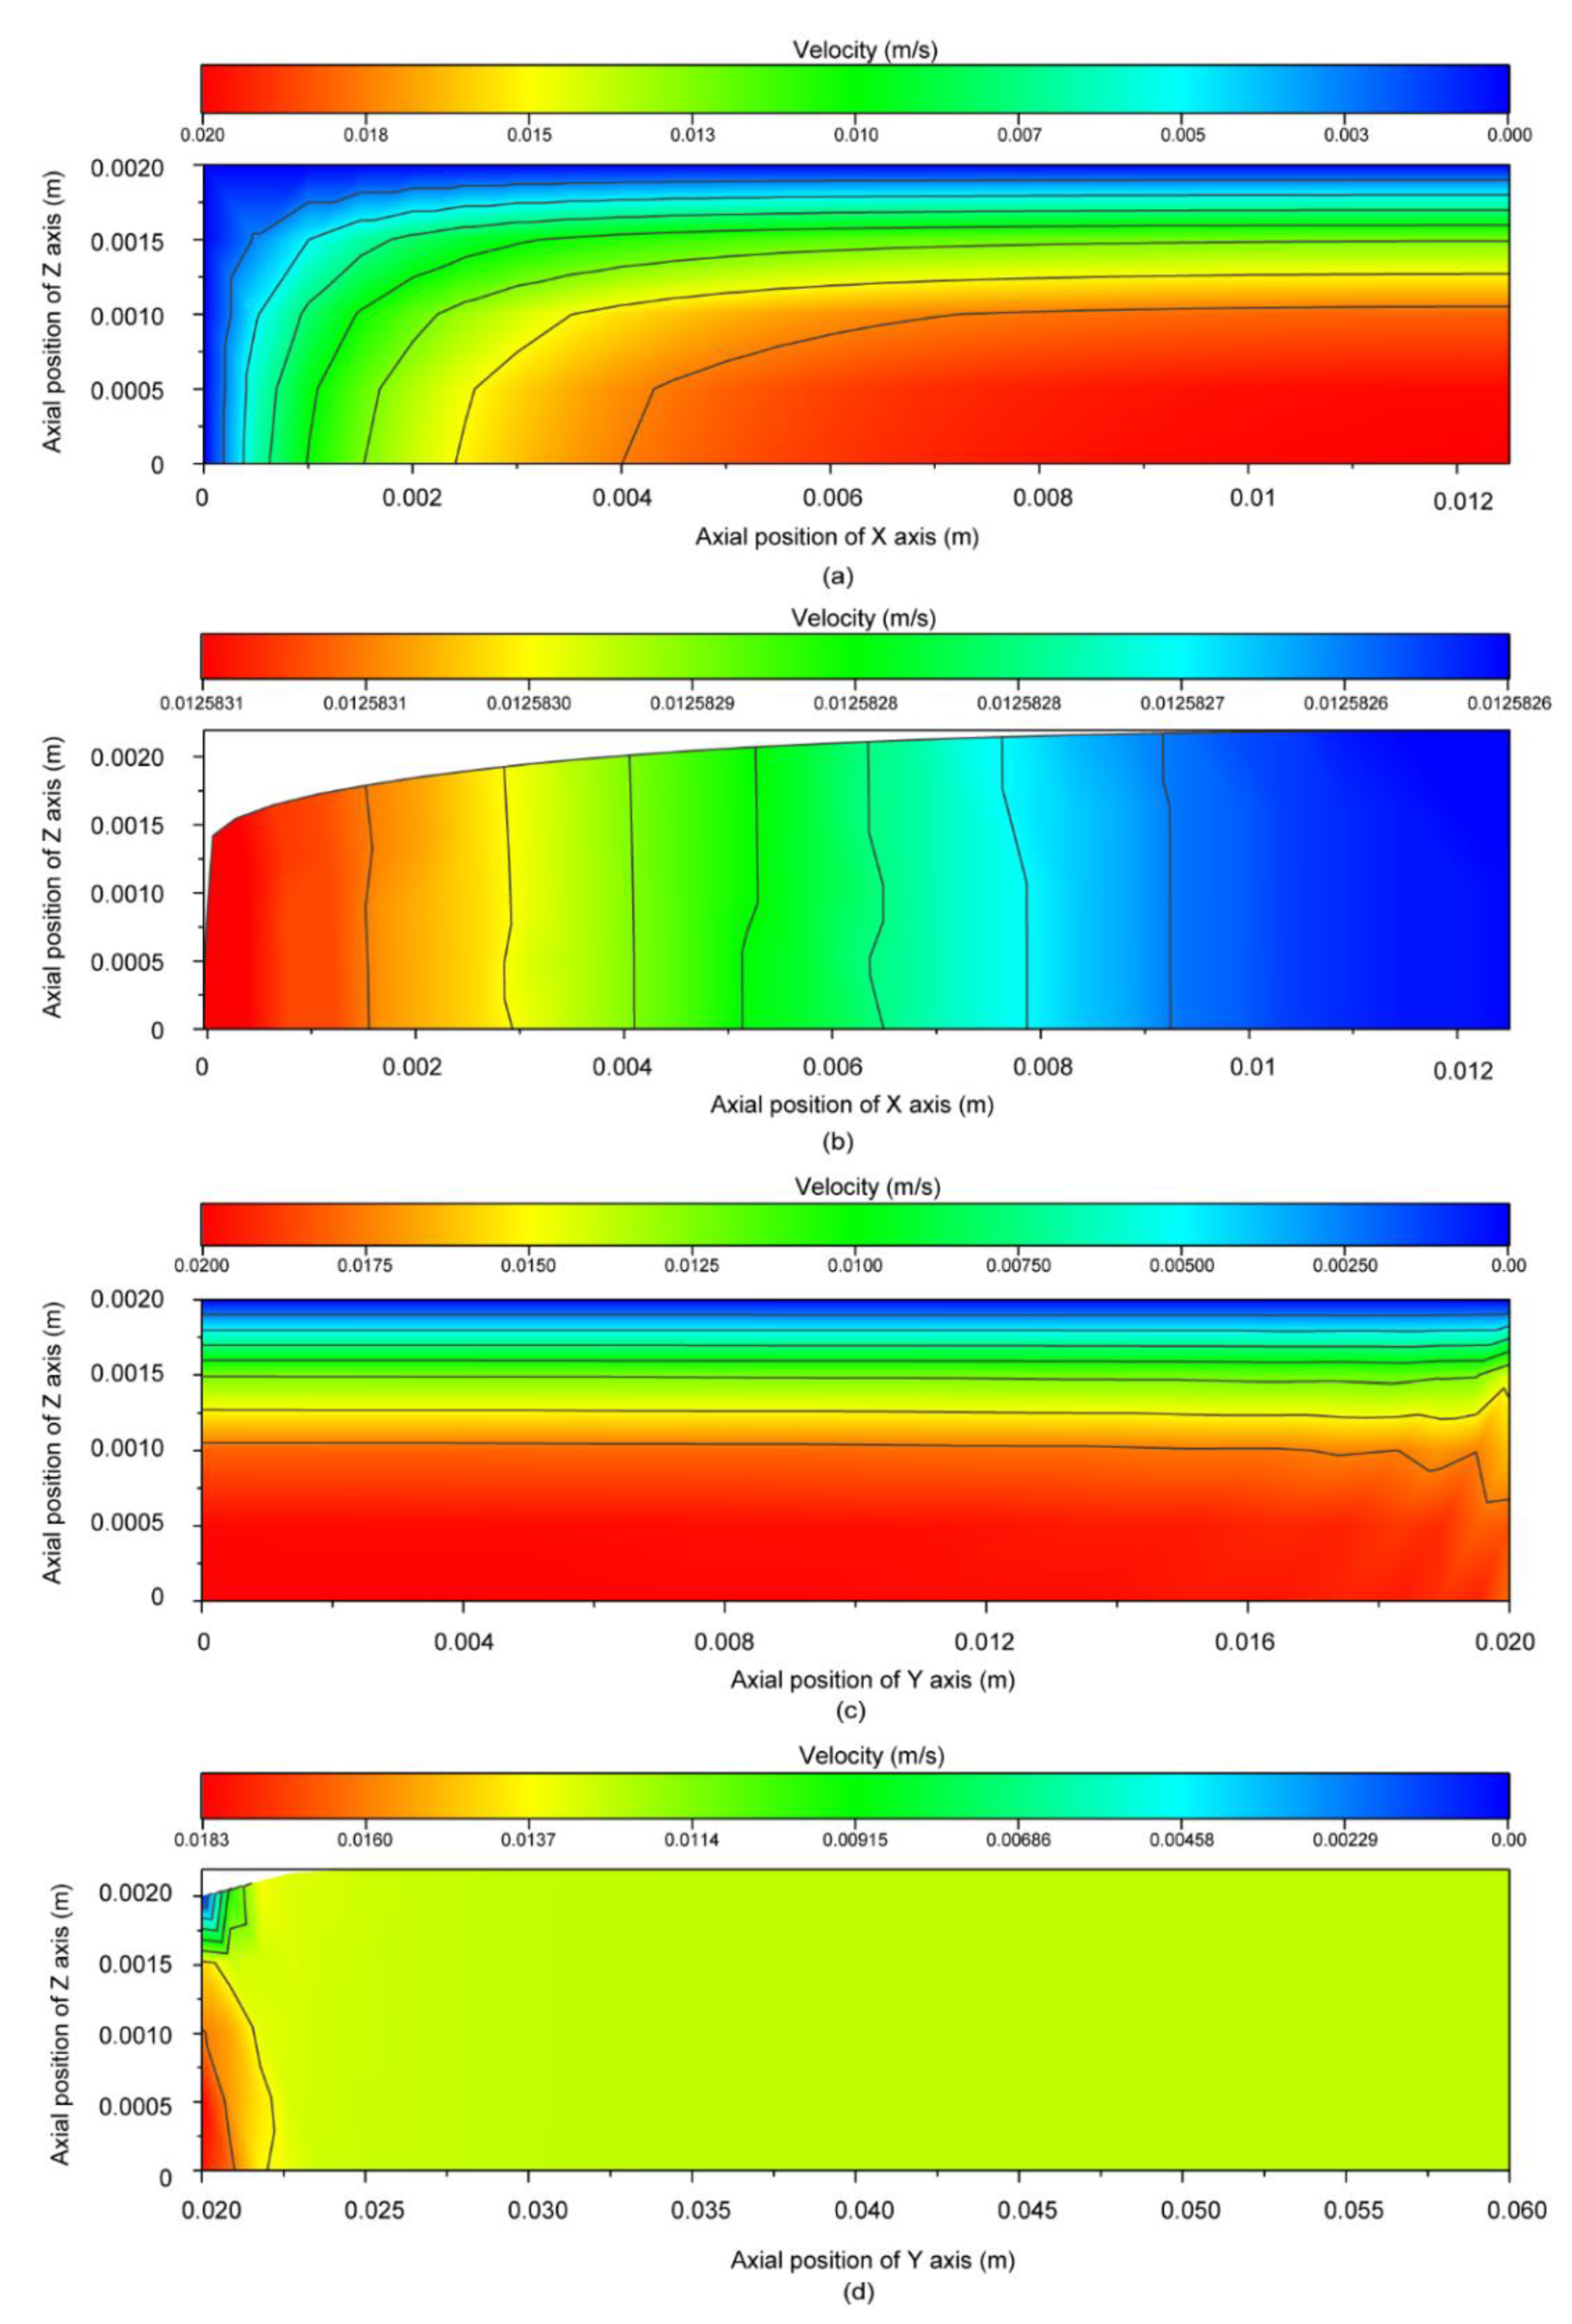
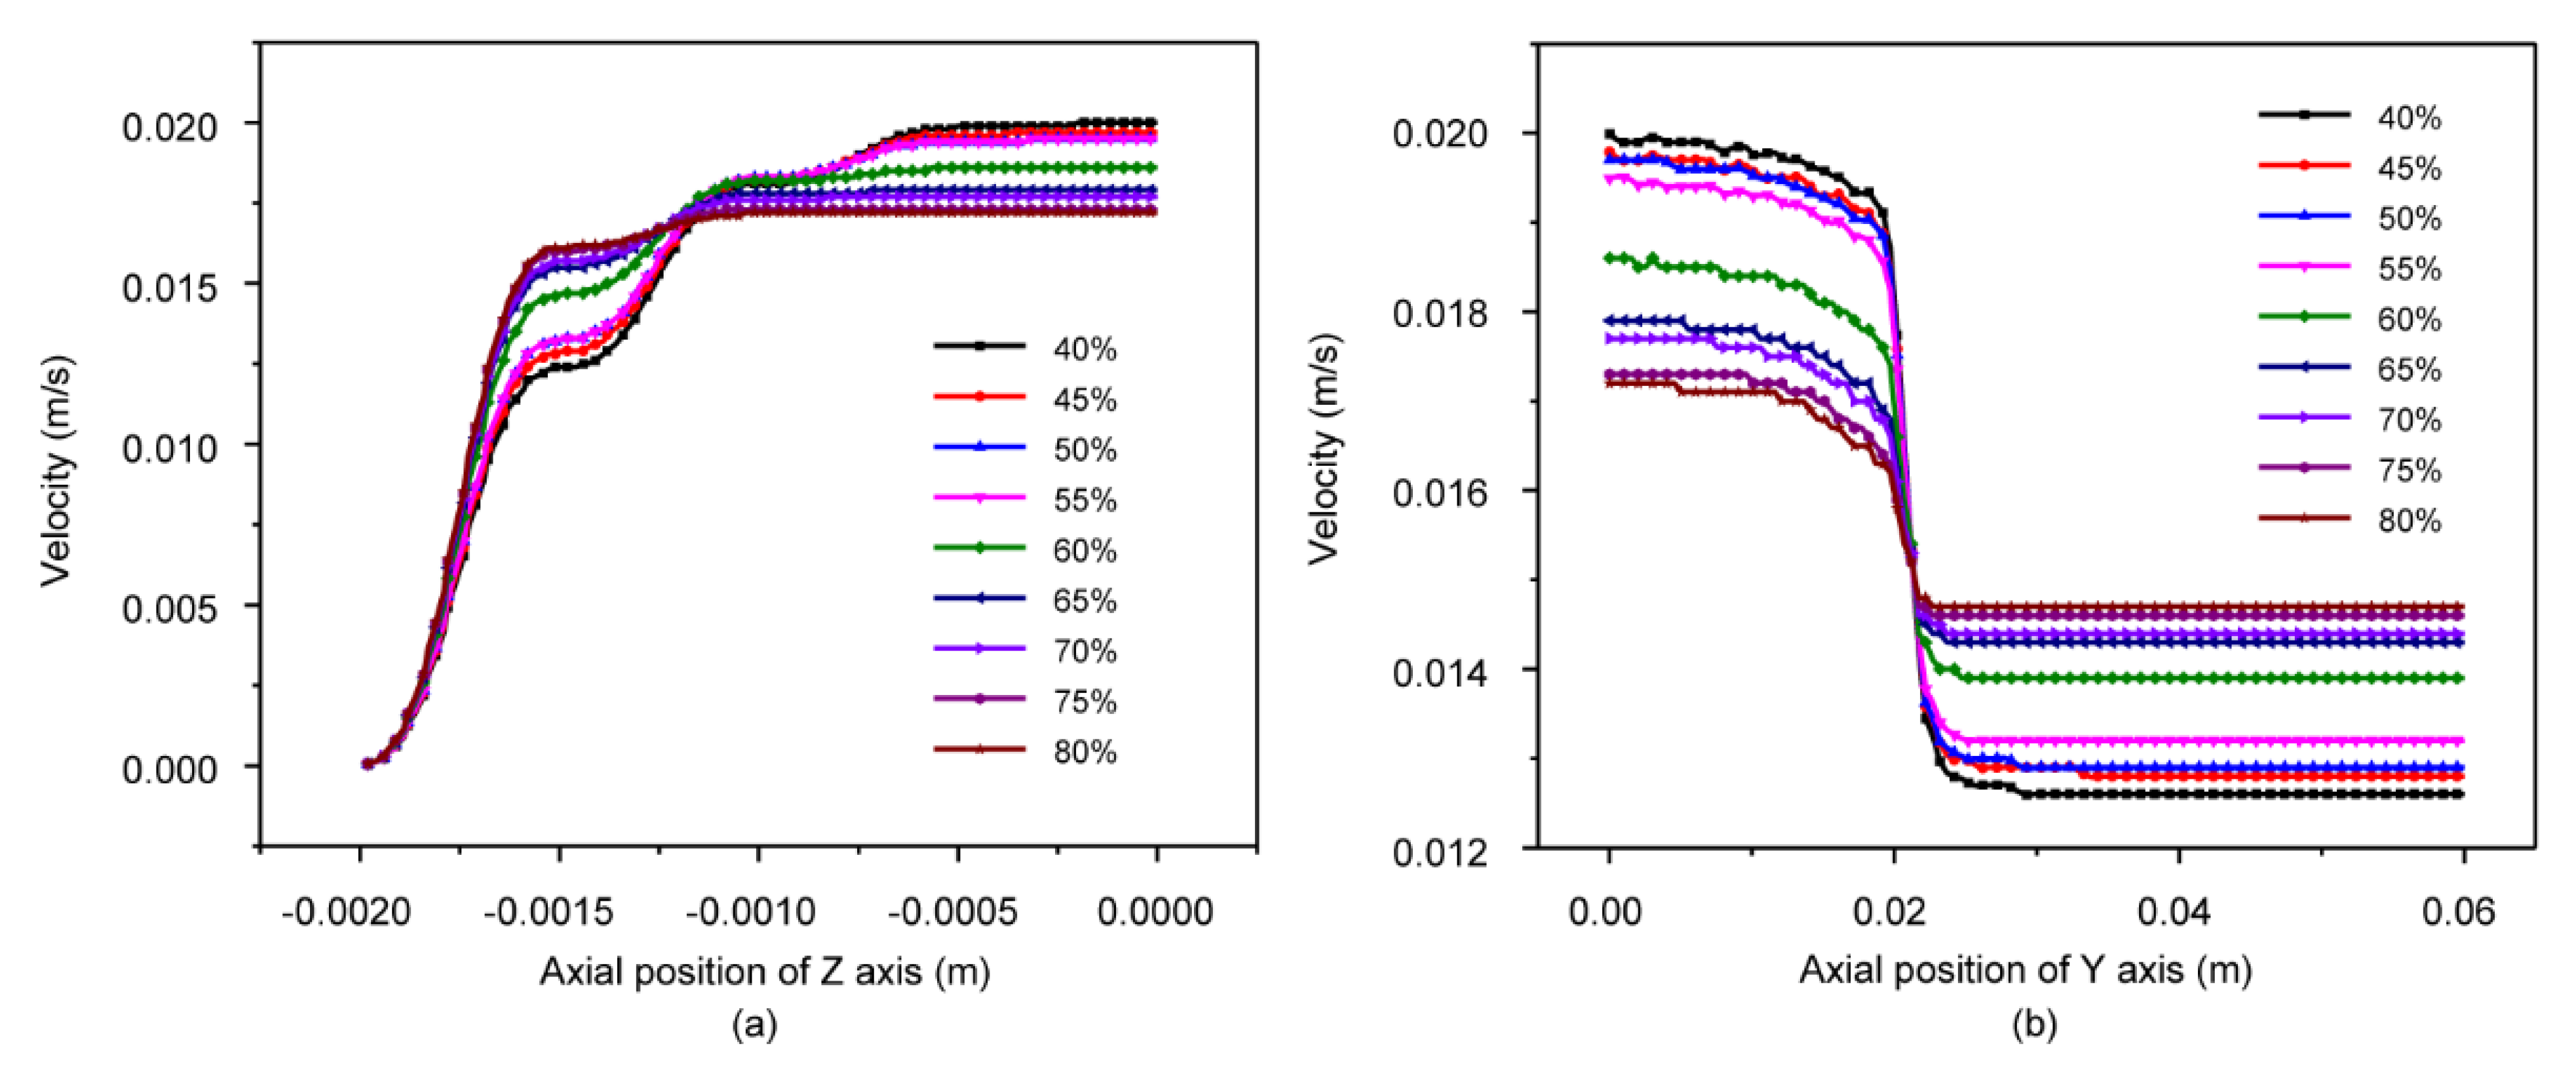
3.3. Velocity Distribution Field Analysis

As shown in Figure 4a, from the entrance to the exit of the slit die, there were no significant changes in the velocity field, but a sudden drop in velocity occurred at the die junction. Upstream of the slit die, the velocity field remained unchanged along the central axis in the extrusion direction, while the velocity field along the same horizontal section changed obviously (Figure 4b). At the plane of symmetry 1, the maximum velocity was found at the center of the melt flow, while nearer the wall, the velocity of the WPC melt was the smallest (Figure 4c). The velocity on the plane of symmetry 2 decreased first and then remained constant (Figure 4d). The simulation results show that the velocity field of the slit die at the outlet was uniform, which ensured stable extrusion.

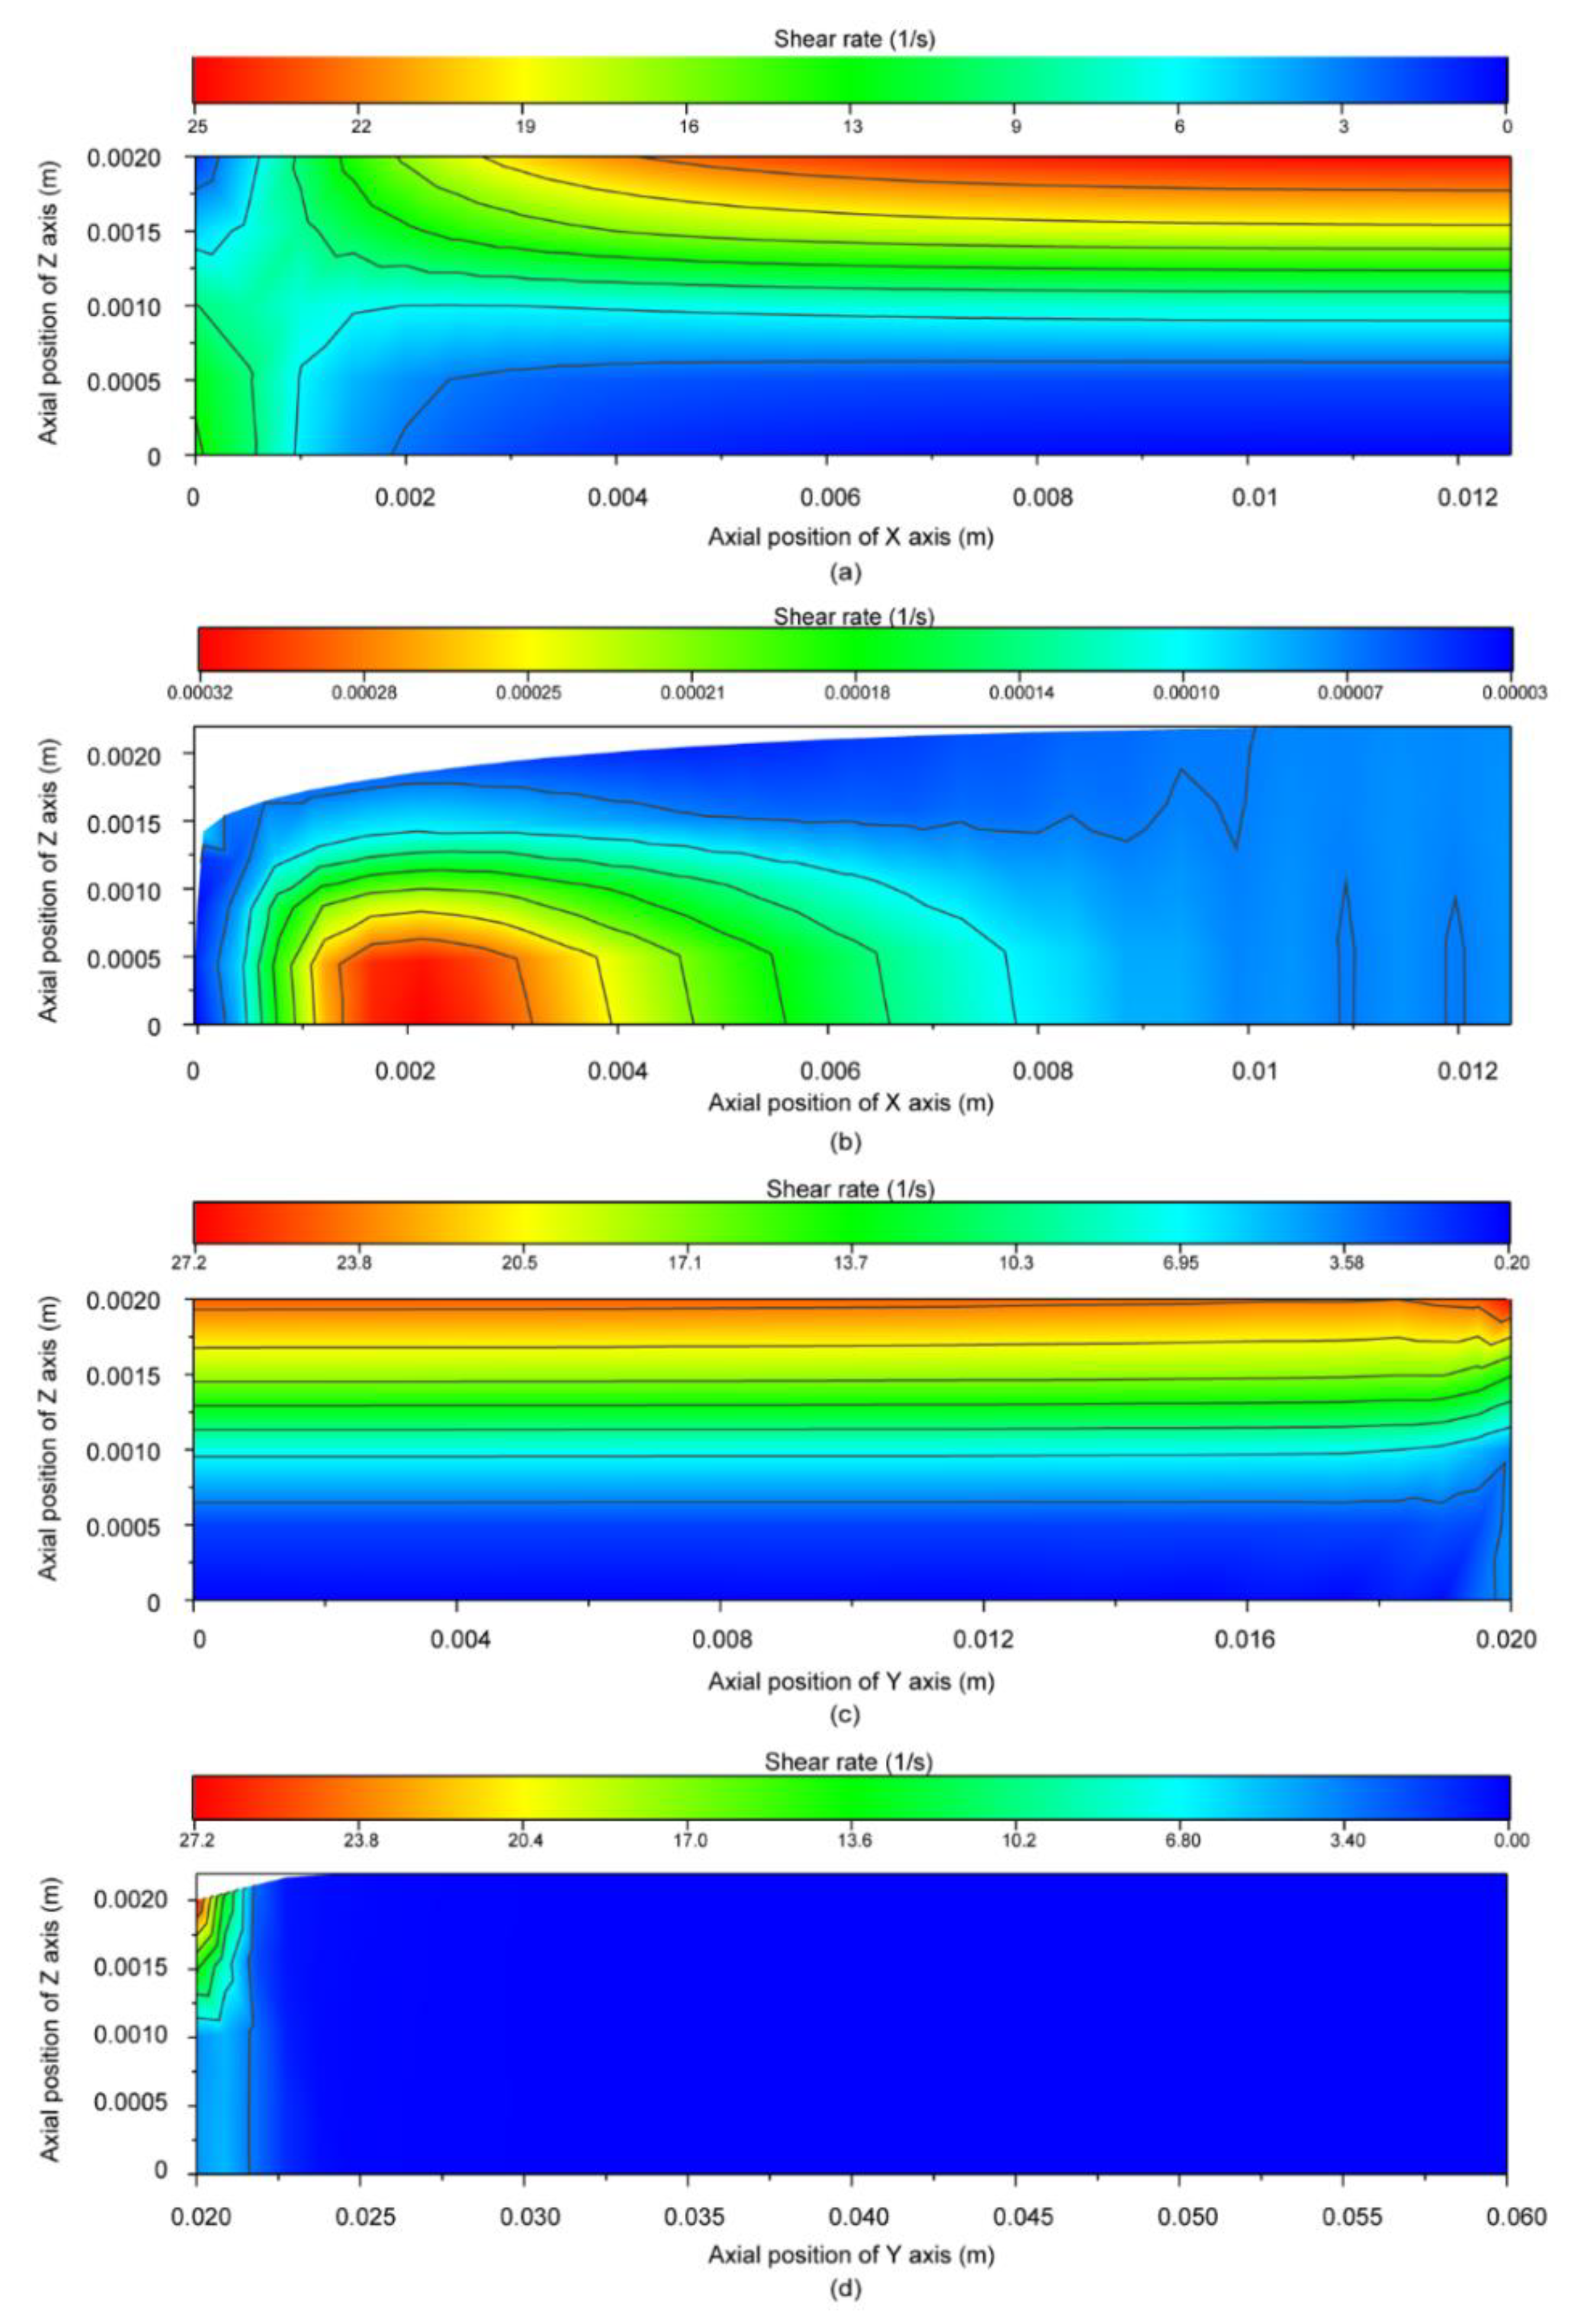
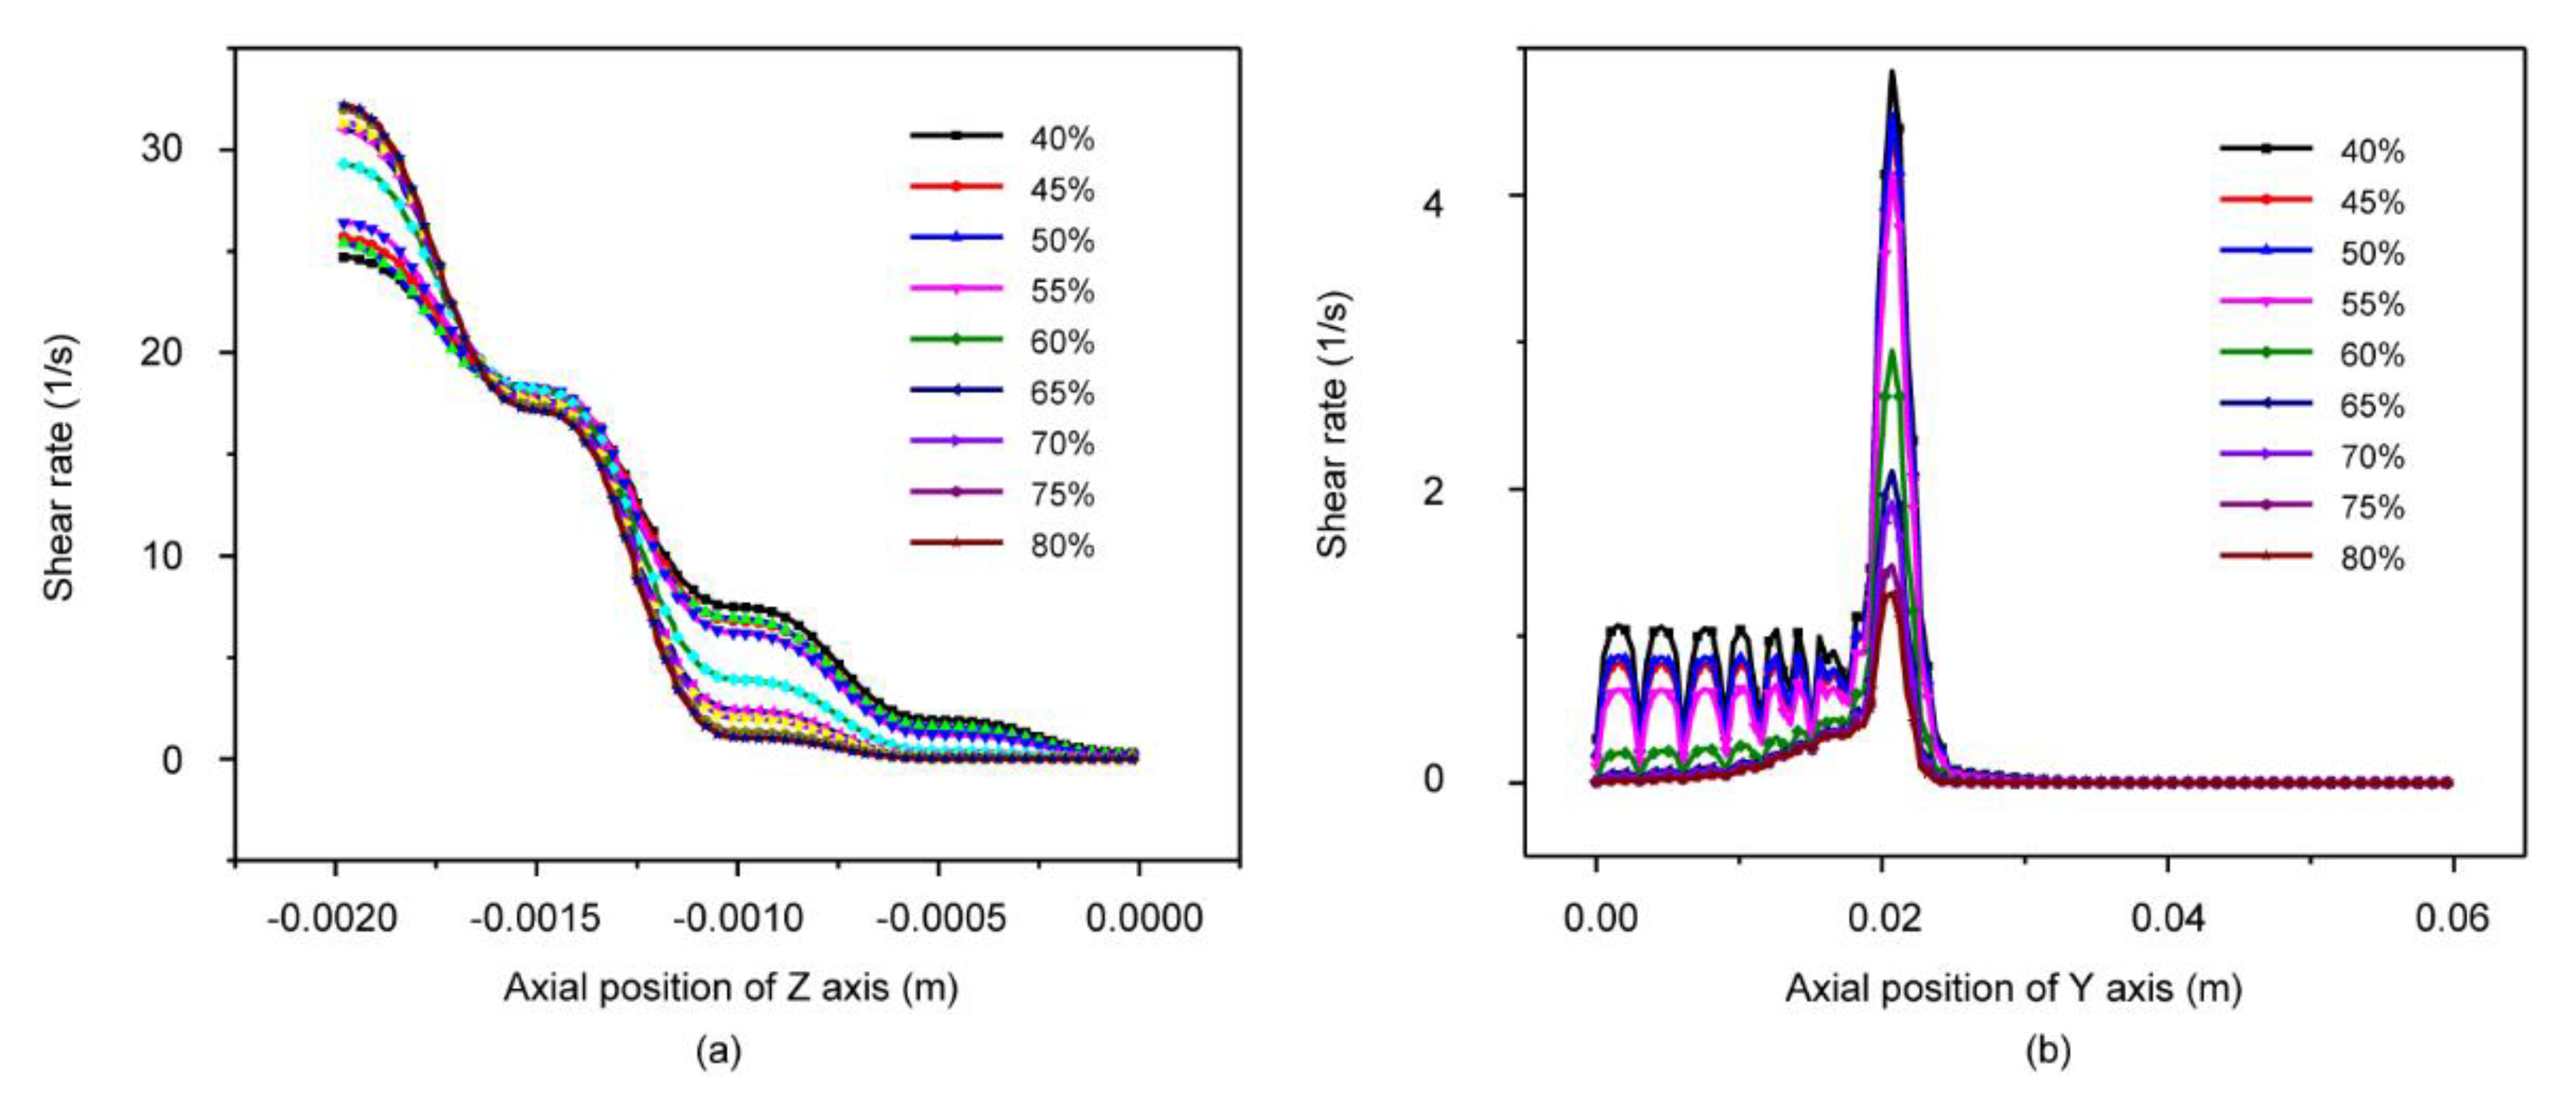
3.4. Shear Rate Distribution Field Analysis

Figure 5 shows the shear rate distribution in the flow field during extrusion. From the entrance to the exit of the slit die, changes in the shear rate along the same horizontal section were observed (Figure 5a,b). Upstream of the slit die, the shear rate field at the center of melt flow was found to be the minimum, while the shear rate of the WPCs melt was larger nearer the wall (Figure 5b). At the plane of symmetry 1, the shear rate was low, which was the minimum at the center of the melt flow, while the shear rate of the material was higher nearer the wall (Figure 5c). The shear rate field suddenly decreased near the die exit, while it remained stable on the symmetry plane 2 (Figure 5d). This phenomenon indicated that the WPCs were subjected to a larger shear force at the wall. Meanwhile, due to the high shear rates at the exit of the slit die, the viscosity of the WPCs decreased, indicating that the WPCs were easily extruded.

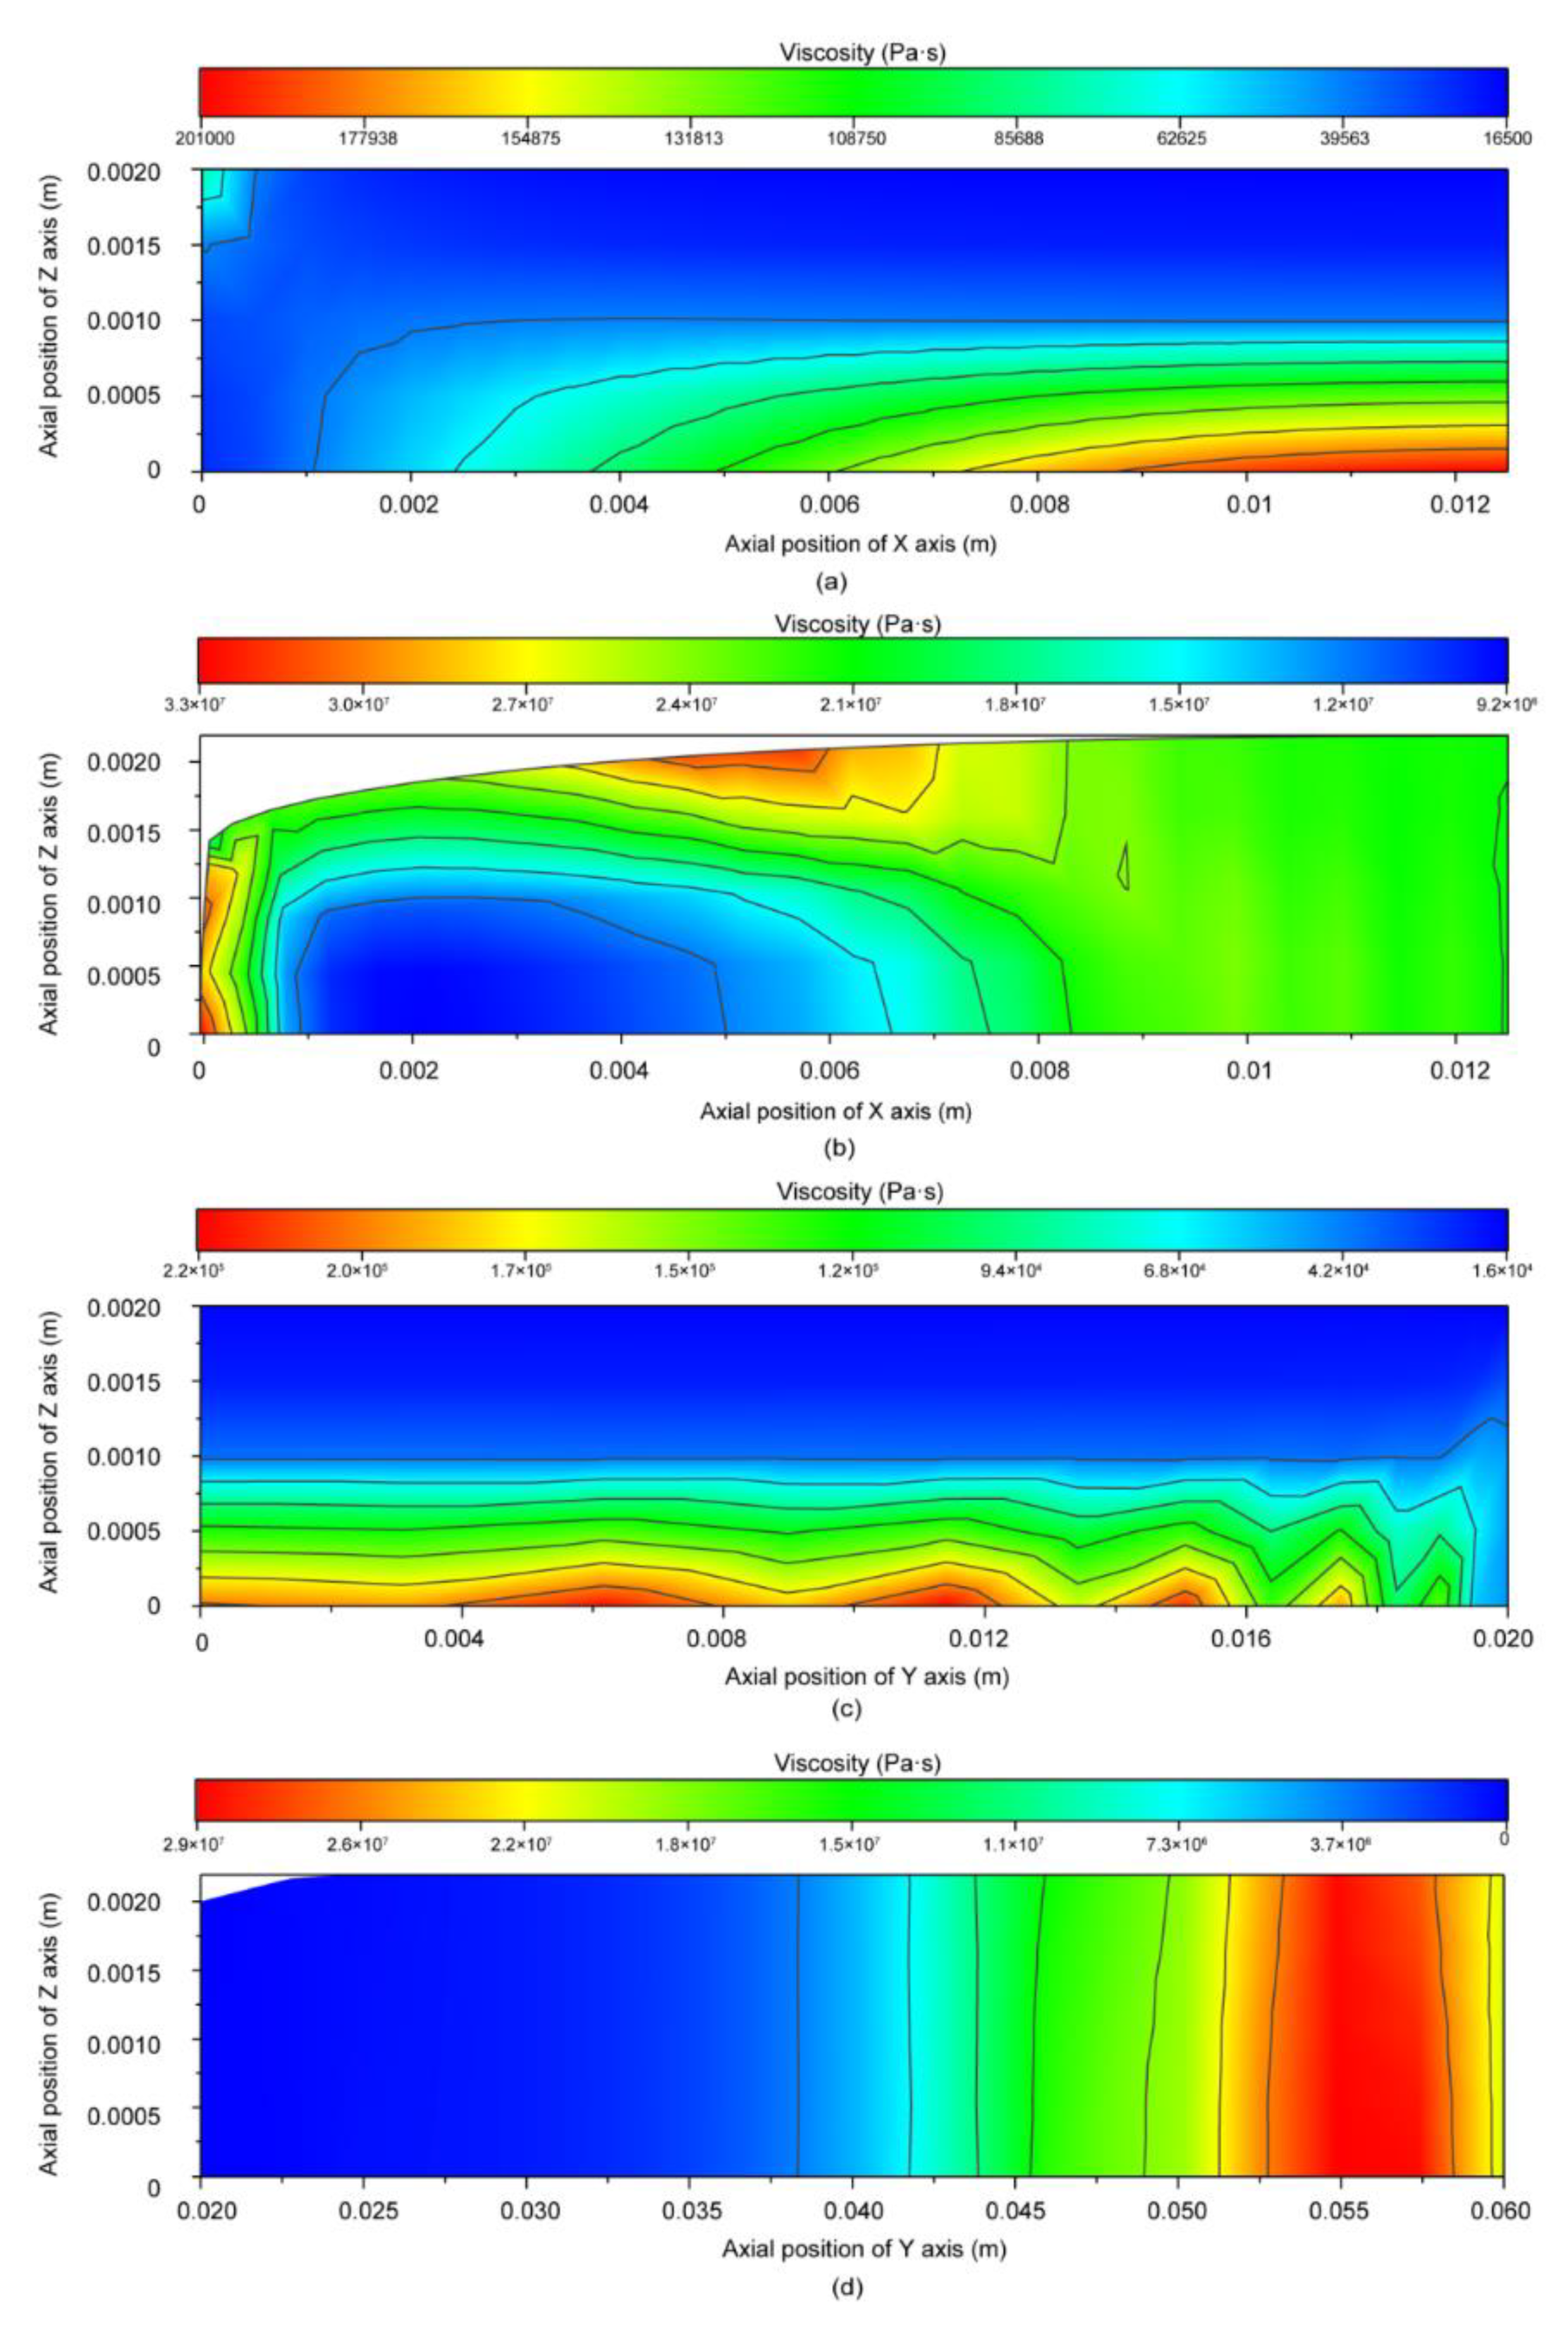
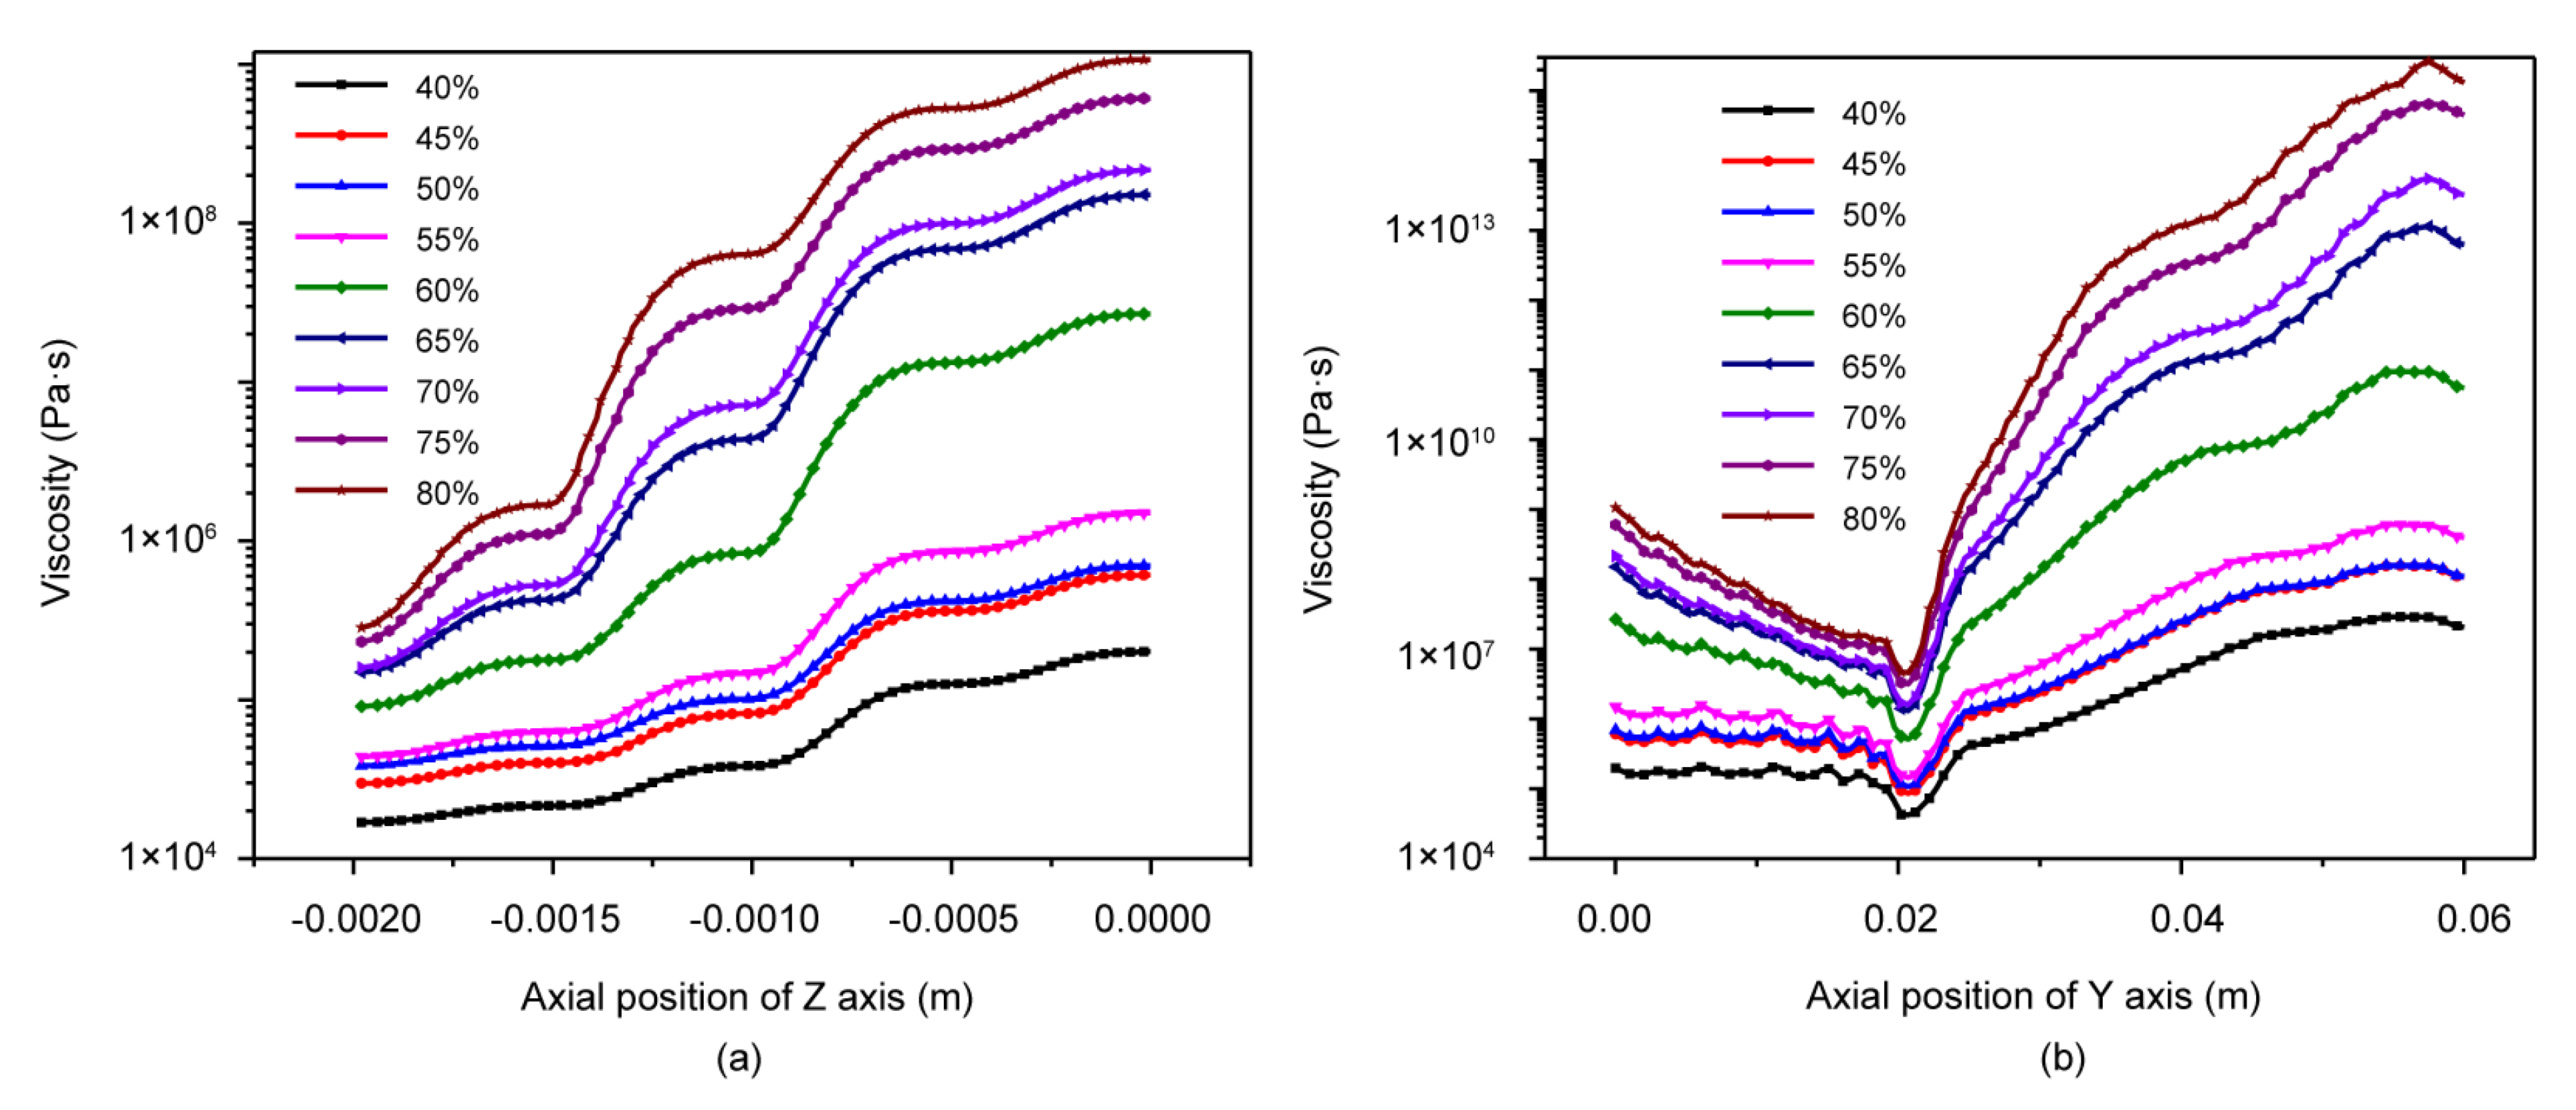
3.5. Viscosity Distribution Field Analysis

From the above sections, the viscosity of the materials belonging to pseudoplastic fluids changed with the shear rates and the viscosity of WPCs at different wood fiber contents, which affected the rheological parameters in the flow channel during extrusion.
Figure 6 shows the distribution of the viscosity field at the slit die. The WPCs exhibited shear-thinning properties, in which the higher the local shear rate was, the lower the viscosity. From the entrance to the exit of the slit die, the viscosity on the centerline first decreased and then increased along the extrusion direction (Figure 6a,b). Upstream of the slit die, the viscosity at the center of the melt flow was found to be the maximum, while the viscosity of the WPCs melt was the smallest nearer the wall (Figure 6c). On the plane of symmetry 2, the viscosity reached its maximum as the WPCs were extruded (Figure 6d). Meanwhile, due to low viscosity at the die exit, the viscosity of the WPCs decreased, indicating that the WPCs were more easily extruded.

4. Discussion

4.1. Effect of Different Components on Pressure Field Distribution

For the pressure field, all samples had the same law of change on the center axis in the extrusion direction. Figure 7 compares the centerline pressure distribution along the flow direction, y-axis, and at the cross-sections of flow from the die inlet. From Figure 7a, it can be seen that the pressure level of the WPC with 80% wood fiber was the highest and that of the WPC with 40% wood fiber was the lowest in the flow field. The pressure levels of the WPCs with 50% and 55% fiber were basically the same. As can be seen in Figure 7, the pressure increased upon increasing the wood fiber content in the WPCs. When the wood fiber content in the WPCs increased, the viscosity consistency index ( K ) increased, and the non-newton index ( n ) decreased (Table 2). Compared with the other materials, the viscosity consistency index ( K ) of the WPC with 80% wood fiber was larger than other WPC formulations, which indicated the highest pressure level in the flow field [33]. The K value of the WPC with 55% fiber was larger than that of the WPC with 50% wood fiber content, but the n value of the WPC with 55% fiber was smaller than that of the WPC with 50% wood fiber; thus, the pressure level of the WPC with 55% wood fiber remained basically consistent with that of the WPC with 50% wood fiber.

4.2. Effect of Different Components on Viscosity Field Distribution

For the viscosity field, all WPC samples showed the same trend along the centerline, in which the viscosity in the flow field increased upon increasing the wood fiber content (Figure 8). When the wood fiber content in the materials increased, the viscosity consistency index ( K ) increased, and the non-newton index ( n ) decreased. From the above study, both the increase in the K value and the decrease in the n value increased the viscosity of the WPCs [34,35].

4.3. Effect of Different Components on Velocity and Shear Rate Field Distribution

The viscosity and pressure distributions changed as the wood fiber content increased, and the velocity and shear rate distributions should also be investigated. Figure 9, shows that the velocity profiles are quite different. The volumetric flow rate of the inflow was set to the same value in the simulation, which produced the same velocity as long as the die geometry was fixed. In reality, the volumetric flow rate may be different depending on the WPC formulation due to the leakage flow in the slit die caused by high pressures; therefore, the velocity at the same centerline decreased slightly upon increasing the wood fiber content. As shown, the velocity remained constant until the flow was close to the die exit [28,36]. Figure 9b shows that the velocity rearrangement began upstream of the die exit because the velocity distribution and normal stress are two important factors that influence the swelling behavior. For the shear rate fields, the local shear rate distribution of the flow field was related to the shear force distribution [37]. From the wall to the flow center, the higher the wood fiber content, the higher the shear rate because the WPC with a higher wood fiber content was subjected to a larger shear force at the wall (Figure 10).

5. Conclusions

The rheological properties of wood–plastic composites with different components and temperatures were studied by 3D numerical simulations. The flow curves of WPCs with different wood fiber contents were fitted using the power-law model, and the wood fiber content was the key factor that affected the rheological properties of the WPCs. The shear-thinning ability of the WPCs increased when the non-Newton index ( n ) decreased. As the wood fiber content increased, the shear-thinning ability and pseudoplasticity of the materials. The pressure, velocity, shear rate, and viscosity distributions of the WPCs during extrusion could be predicted through numerical simulations. The viscosity and pressure distributions changed greatly as the wood fiber content increased. The pressure field and viscosity field in the flow field increased as the wood fiber content increased, and the extrusion of WPCs became more difficult as the viscosity increased. The higher the wood fiber content, the greater the shearing force of the WPCs and the greater the shear rate. The temperature greatly increased due to the increased shear force, which can cause the extruder to dangerously overheat. The velocity distribution in the flow channel was relevant to the volumetric flow rate and die geometry, but it was not significantly affected by the wood fiber content; however, the experimental velocity at the same centerline decreased slightly upon increasing the wood fiber content, which verified the accuracy of the simulation results. This work provides an easy method and valuable reference for the extrusion of different WPC formulations.

Author Contributions

Writing—original draft preparation, X.L.; writing—review and editing, L.S. and X.Y.; project administration, X.L. and L.S.; software, X.H.; validation, R.O. and C.G.; Conceptualization, T.L.; funding acquisition, L.S., X.Y. and Q.W. All authors have read and agreed to the published version of the manuscript.

Funding

This work was financially supported by the Research and Development Program in Key Areas of Guangdong Province (No. 2020B0202010008), the Natural Science Foundation of Guangdong Province (No.2021A1515011014), the National Key Research and Development Program of China (No. 2019YFD1101203), the National Natural Science Foundation of China (Nos. 31700494 and 31870547), the Guangzhou Municipal Science and Technology Project (No. 201905010005), and the Project of Key Disciplines of Forestry Engineering of Bureau of Education of Guangzhou Municipality.

Institutional Review Board Statement

Not applicable.

Informed Consent Statement

Not applicable.

Data Availability Statement

Not applicable.

Conflicts of Interest

The authors declare that we have no conflict of interest to report regarding the present study.

References

  1. Yatigala, N.S.; Bajwa, D.S.; Bajwa, S.G. Compatibilization improves physico-mechanical properties of biodegradable biobased polymer composites. Compos. Part A Appl. Sci. Manuf. 2018, 107, 315–325. [Google Scholar] [CrossRef]
  2. Uitterhaegen, E.; Parinet, J.; Labonne, L.; Merian, T.; Ballas, S.; Veronese, T.; Merah, O.; Talou, T.; Stevens, C.V.; Chabert, F.; et al. Performance, durability and recycling of thermoplastic biocomposites reinforced with coriander straw. Compos. Part A Appl. Sci. Manuf. 2018, 113, 254–263. [Google Scholar] [CrossRef] [Green Version]
  3. Kirchhoff, N.; Schröder, C.; Stute, D.; Moritzer, E.; Schmid, H. Wood-Plastic-Composites: Rheologische Charakterisierung und Füllverhalten im Spritzgießprozess. Chem. Ing. Tech. 2012, 84, 1584–1589. [Google Scholar] [CrossRef]
  4. Sarabi, M.T.; Behravesh, A.H.; Shahi, P.; Daryabari, Y. Effect of polymeric matrix melt flow index in reprocessing extruded wood-plastic composites. J. Thermoplast. Compos. 2014, 27, 881–894. [Google Scholar] [CrossRef]
  5. Bledzki, A.K.; Faruk, O. Wood fiber reinforced polypropylene composites: Compression and injection molding process. Polym. Plast. Technol. 2004, 43, 871–888. [Google Scholar] [CrossRef]
  6. Ou, R.; Wang, Q.; Wolcott, M.P.; Sui, S.; Xie, Y.; Song, Y. Effects of Chemical Modification of Wood Flour on the Rheological Properties of High-Density Polyethylene Blends. J. Appl. Polym. Sci. 2014, 131. [Google Scholar] [CrossRef]
  7. Mazzanti, V.; Mollica, F. In-line rheometry of polypropylene based Wood Polymer Composites. Polym. Test. 2015, 47, 30–35. [Google Scholar] [CrossRef]
  8. Cheung, H.; Ho, M.; Lau, K.; Cardona, F.; Hui, D. Natural fibre-reinforced composites for bioengineering and environmental engineering applications. Compos. Part B Eng. 2009, 40, 655–663. [Google Scholar] [CrossRef]
  9. Li, T.Q.; Wolcott, M.P. Rheology of HDPE-wood composites. I. Steady state shear and extensional flow. Compos. Part A Appl. Sci. Manuf. 2004, 35, 303–311. [Google Scholar] [CrossRef]
  10. Li, T.Q.; Wolcott, M.P. Rheology of wood plastics melt, part 2: Effects of lubricating systems in HDPE/maple composites. Polym. Eng. Sci. 2006, 46, 464–473. [Google Scholar] [CrossRef]
  11. Laufer, N.; Hansmann, H.; Koch, M. Rheological Characterisation of the Flow Behaviour of Wood Plastic Composites in Consideration of Different Volume Fractions of Wood. J. Phys. Conf. 2017, 790, 12017. [Google Scholar] [CrossRef] [Green Version]
  12. Mazzanti, V.; Mollica, F.; El Kissi, N. Rheological and mechanical characterization of polypropylene-based wood plastic composites. Polym. Compos. 2016, 37, 3460–3473. [Google Scholar] [CrossRef]
  13. Godard, F.; Vincent, M.; Agassant, J.F.; Vergnes, B. Rheological behavior and mechanical properties of sawdust/polyethylene composites. J. Appl. Polym. Sci. 2009, 112, 2559–2566. [Google Scholar] [CrossRef]
  14. Mazzanti, V.; Mollica, F. Rheological behavior of wood flour filled poly(lactic acid): Temperature and concentration dependence. Polym. Compos. 2019, 401, E169–E176. [Google Scholar] [CrossRef]
  15. Altug, M.; Kaya, S.; Guldas, A.; Zeyveli, M. Investigation of rheological and mechanical properties of wood flour reinforced polypropylene. Mater. Werkst. 2018, 49, 73–88. [Google Scholar] [CrossRef]
  16. Yilmaz, O.; Gunes, H.; Kirkkopru, K. Optimization of a profile extrusion die for flow balance. Fibers Polym. 2014, 15, 753–761. [Google Scholar] [CrossRef]
  17. Sun, D.; Zhu, X.; Gao, M. 3D Numerical Simulation of Reactive Extrusion Processes for Preparing PP/TiO2 Nanocomposites in a Corotating Twin Screw Extruder. Materials 2019, 12, 671. [Google Scholar] [CrossRef] [Green Version]
  18. Tang, D.; Marchesini, F.H.; D’Hooge, D.R.; Cardon, L. Isothermal flow of neat polypropylene through a slit die and its die swell: Bridging experiments and 3D numerical simulations. J. Non-Newton. Fluid 2019, 266, 33–45. [Google Scholar] [CrossRef]
  19. Sun, Y.D.; Chen, Q.R.; Sun, W.J. Numerical simulation of extrusion process and die structure optimization for a complex magnesium doorframe. Int. J. Adv. Manuf. Technol. 2015, 80, 495–506. [Google Scholar] [CrossRef]
  20. Liu, Q.; Zhang, N.; Wei, W.; Hu, X.; Tan, Y.; Yu, Y.; Deng, Y.; Bi, C.; Zhang, L.; Zhang, H. Assessing the dynamic extrusion-based 3D printing process for power-law fluid using numerical simulation. J. Food Eng. 2020, 275. [Google Scholar] [CrossRef]
  21. Wen, J.S.; Yang, M.K.; Fan, D.J. Numerical simulation of energy consumption in the melt conveying section of eccentric rotor extruders. Adv. Polym. Technol. 2018, 37, 3335–3347. [Google Scholar] [CrossRef]
  22. Díaz, J.J.D.C.; Nieto, P.J.G.; García, A.B.; Mu Oz, J.G.; Meré, J.O. Finite volume modeling of the non-isothermal flow of a non-Newtonian fluid in a rubber’s extrusion die. J. Non-Cryst. Solids 2008, 354, 5334–5336. [Google Scholar] [CrossRef]
  23. Chen, Z. Research on the Impact of 3D Printing on the International Supply Chain. Adv. Mater. Sci. Eng. 2016, 2016. [Google Scholar] [CrossRef] [Green Version]
  24. Yang, F.; Guo, C.; Zhang, M.; Bhandari, B.; Liu, Y. Improving 3D printing process of lemon juice gel based on fluid flow numerical simulation. LWT Food Sci. Technol. 2019, 102, 89–99. [Google Scholar] [CrossRef] [Green Version]
  25. Mazzanti, V.; Mollica, F. Pressure dependent wall slip of wood flour filled polymer melts. J. Non-Newton. Fluid 2017, 247, 178–187. [Google Scholar] [CrossRef]
  26. Mompean, G.; Thais, L.; Tomé, M.F.; Castelo, A. Numerical prediction of three-dimensional time-dependent viscoelastic extrudate swell using differential and algebraic models. Comput. Fluids 2011, 44, 68–78. [Google Scholar] [CrossRef]
  27. Han, C.D. What is the role of “pressure” in the use of capillary and slit flows to determine the shear-rate dependent viscosity of a viscoelastic fluid? Polym. Eng. Sci. 2008, 48, 1126–1140. [Google Scholar] [CrossRef]
  28. Zhang, J.; Rizvi, G.M.; Park, C.B.; Hasan, M.M. Study on cell nucleation behavior of HDPE–wood composites/supercritical CO2 solution based on rheological properties. J. Mater. Sci. 2011, 46, 3777–3784. [Google Scholar] [CrossRef]
  29. Garcia-Rejon, A.; Diraddo, R.W.; Ryan, M.E. Effect of die geometry and flow characteristics on viscoelastic annular swell. J. Non-Newton. Fluid 1995, 60, 107–128. [Google Scholar] [CrossRef]
  30. Tang, D.; Marchesini, F.H.; Cardon, L.; D’Hooge, D.R. The impact of upstream contraction flow on three-dimensional polymer extrudate swell from slit dies. J. Non-Newton. Fluid 2020, 282, 104337. [Google Scholar] [CrossRef]
  31. Gleissle, W.; Hochstein, B. Validity of the Cox–Merz rule for concentrated suspensions. J. Rheol. 2003, 47, 897–910. [Google Scholar] [CrossRef]
  32. Touloupidis, V.; Wurnitsch, C.; Albunia, A.; Galgali, G. Connecting Linear Polymers Molecular Structure to Viscoelastic Properties and Melt Flow Index. Macromol. Theory Simul. 2016, 25, 392–402. [Google Scholar] [CrossRef]
  33. Li, Z.; Wang, Z.; Wang, Z.; Wang, B.; Feng, C. Optimizing torque rheometry parameters for assessing the rheological characteristics and extrusion processability of wood plastic composites. J. Thermoplast. Compos. 2019, 32, 123–140. [Google Scholar]
  34. Wu, G.; Song, Y.; Zheng, Q.; Du, M.; Zhang, P. Dynamic rheological properties for HDPE/CB composite melts. J. Appl. Polym. Sci. 2003, 88, 2160–2167. [Google Scholar] [CrossRef]
  35. Habibi, M.; Najafi, S.K.; Ghasemi, I. Rheological and mechanical properties of composites made from wood flour and recycled LDPE/HDPE blend. Iran. Polym. J. 2017, 26, 949–956. [Google Scholar] [CrossRef]
  36. Habib, M.A.; Said, S.A.M.; Badr, H.M.; Hussaini, I.; Al Bagawi, J.J. Effect of geometry on flow field and oil/water separation in vertical deadlegs. Int. J. Numer. Methods Heart 2005, 15, 348–362. [Google Scholar] [CrossRef]
  37. Chen, Z.; Zhang, S.; Li, F.; Wu, F.; Yao, T. The chain scission extent of polystyrene in different shear flow fields. Polym. Eng. Sci. 2018, 58, 913–919. [Google Scholar] [CrossRef]
Figure 1. Schematic diagram of the 3D flow domain in and out of the slit die.
Forests 12 00417 g001
Figure 2. Rheological curves showing: (a) the effect of wood fiber content on the complex viscosity of the WPCs at 160 °C, 170 °C, and 180 °C; (b) effect of wood fiber on the shear viscosity of the WPCs at 160 °C, 170 °C, and 180 °C; (c) Polymat fitting curve and experimental data for 40 wt% WPC; (d) the correlation coefficient between the power-law model and experimental data.
Forests 12 00417 g002
Figure 3. The pressure field distribution of the WPC with 40% wood fiber as an example. Pressure distribution at: (a) the inlet; (b) outlet; (c) on the plane of symmetry 1; (d) on the plane of symmetry 2.
Forests 12 00417 g003
Figure 4. The velocity field distribution of the WPC with 40% wood fiber as an example. Distribution of velocity at: (a) the inlet; (b) the outlet; (c) on the plane of symmetry 1; (d) on the plane of symmetry 2.
Forests 12 00417 g004
Figure 5. The shear rate field distribution using the WPC with 40% wood fiber as an example. Distribution of shear rate at: (a) the inlet; (b) the outlet; (c) on the plane of symmetry 1; (d) on the plane of symmetry 2.
Forests 12 00417 g005
Figure 6. The viscosity field distribution using the WPC with 40% wood fiber as an example. Distribution of viscosity at: (b) the inlet; (b) the outlet; (c) on the plane of symmetry 1; (d) on the plane of symmetry 2.
Forests 12 00417 g006
Figure 7. Centerline pressure distribution along the (a) z-axis and (b) y-axis.
Forests 12 00417 g007
Figure 8. Viscosity distribution graph on the centerline along the (a) z-axis and (b) y-axis.
Forests 12 00417 g008
Figure 9. Velocity distribution on the centerline along the (a) z-axis and (b) y-axis.
Forests 12 00417 g009
Figure 10. Shear rate distribution on the centerline along the (a) z-axis and (b) y-axis.
Forests 12 00417 g010
Table 1. Sample formulation of wood–plastic composites (WPCs).
WF/wt%HDPE/wt%MAPE/wt%Lubricant/wt%
405532
455032
504532
554032
603532
653032
702532
752032
801532
Table 2. Power law parameters of different WPC of the content of wood fiber.
WF/wt% K / Pa · s n λ / s R2
4053,0870.4400.3120.977
4597,4830.4110.2750.981
50127,7320.4010.2930.981
55169,3960.3560.3080.987
60498,3200.2460.3270.996
65957,8220.1860.3200.988
701,076,0800.1710.3220.981
751,569,4100.1430.2950.981
801,918,5800.1310.2840.985
Publisher’s Note: MDPI stays neutral with regard to jurisdictional claims in published maps and institutional affiliations.

