Article

Variations in Organic Carbon Content and Dehydrogenases Activity in Post-Agriculture Forest Soils: A Case Study in South-Western Pomerania

by
Katarzyna Wiatrowska
1,*,
Jolanta Komisarek
1 and
Janusz Olejnik
2
1
Department of Soil Science and Land Reclamation, Poznań University of Life Sciences, Piątkowska 94, 60-649 Poznań, Poland
2
Department of Construction and Geoengineering, Poznań University of Life Sciences, Pątkowska 94, 60-649 Poznań, Poland
*
Author to whom correspondence should be addressed.
Submission received: 15 February 2021 / Revised: 13 March 2021 / Accepted: 7 April 2021 / Published: 9 April 2021

Abstract

:
Temperate forest soils of Europe are regarded as an important sink of carbon and thought to have potential to sequester CO2 from atmosphere. However, there are insufficient data not only on organic carbon (OC) content in forest soils and its temporal changes but also on microbiological activity and especially their relationship to carbon turnover. In this study seven research plots were located on afforested land in the north-western part of Poland in Tuczno Forest District (Western Pomerania) in order to examine seasonal variation in OC content and dehydrogenases activity (DHA) during 2012–2016. Based on the studies conducted, statistically significant seasonal variation of the OC content was observed. Higher amounts of OC in the A horizon were observed during spring and autumn seasons and lower in summer. However, no seasonal variation on OC content was observed in the organic horizon (O horizon). Although DHA is thought to exhibit strong seasonal variability, no seasonal variation on DHA was observed. However, a statistically significant difference was observed among studied years (2012–2016), a sharp drop of DHA was noted from spring 2014. Statistical analyses revealed that OC content in soils was a function of forest stand age and progressing acidification of soil. Moreover, OC content in O horizon was negatively correlated with soil moisture and DHA, suggesting that periods with higher microbial activity lead to lower accumulation of carbon in the O horizon. During 2012–2016 only for the O horizon was an increase in OC content was observed.

1. Introduction

Forest ecosystems play an important role in the global carbon cycle, accumulating the largest amounts of this element among all terrestrial ecosystems. It is estimated that 80% of the carbon resources contained in terrestrial ecosystem biomass are associated with forest areas. Additionally, 70% of the pedosphere’s organic carbon resources are accumulated in forest soils [1]. Thus, any consideration of carbon circulation in forest ecosystems must also include soil. According to Lal [2,3,4], the pedosphere is the third largest global carbon reservoir after oceanic and geological pools. The estimated carbon stocks in soil (to 1-m depth) are 2500 Pg, including 950 Pg of inorganic carbon compounds and 1550 Pg of organic carbon compounds. The carbon resources accumulated in soil exceed those in the atmosphere by a factor of 3.3 and those in the biomass of the biosphere by 4.5. However, the resources of this element in the pedosphere are not evenly distributed. The amount of organic carbon in soils depends on climatic conditions. Research has shown that as the air temperature increases by 10 °C, the soil’s organic carbon content decreases as a result of exacerbate rate of soil organic carbon (SOC) mineralization [3]. Mean annual air temperature affects SOC by shaping both biomass production (increasing C input) and affecting soil microorganism activity and in consequence the rate of decomposition processes (increasing output). At the same time, higher biomass production and organic carbon accumulation occur in areas with higher amounts of rainfall [5,6].
The content of the SOC is a result of dynamic equilibrium between the carbon input and output, which are affected by land use type, plant species, climate factors, soil properties, anthropogenic or natural disturbances [7,8]. The rate of transformation of organic carbon compounds, accumulated in forest soils, will vary depending on their biochemical resistance to mineralization processes, as well as physicochemical availability [9,10,11]. Commonly SOC resources are partitioned into three fractions differing in decomposability and protection mechanisms: active, intermediate and stable. Chemically active forms of organic carbon include water-soluble forms, light fractions (density < 1.6–2.0 g·cm−3), as well as a pool of compounds susceptible to microbial degradation, such as saccharides and proteins. The stable fraction consists of compounds resistant to mineralization processes, composed of condensed lignin-based aromatic rings, waxes, cutins or products of pyrogenic degradation of organic compounds. Unlike the active carbon pool, their decomposition time is measured in hundreds of years. The second factor determining resistance to degradation processes is the physical availability of these compounds to microorganisms [5,9,12]. Forms of carbon found inside soil aggregates are protected against both microbiological processes, soil enzymes, and partly against the inflow of molecular oxygen. Physical protection of the stable, residual fraction against mineralization processes involves the creation of bonds with the clay, silt fractions or with iron and aluminum oxides. These mineral-organic complexes are formed as a result of the formation of coordination bonds with ligands, bonds through cationic bridges or hydrogen bonds [11]. All these factors mean that determining SOC stocks is not an easy task, but extremely labor-intensive and time consuming. This task in forest ecosystems encounters additional difficulties related to the uneven supply of fresh debris to soils and the impact of past land use and historical disturbance legacies (fires, tree falling/deforestation) on the current state of carbon resources [13].
Increasing emissions of CO2 and other greenhouse gases into the atmosphere and, as a result, the progressive process of global warming has attracted the attention of many research institutions towards methods that reduce the rate of climate change [4,14]. One of the strategies adopted is the sequestration of atmospheric carbon dioxide, understood as the process of transformation and accumulation of gaseous CO2 in the form of stable compounds [4,10,15]. Forest ecosystems that accumulate carbon in the form of lignins and other polymers resistant to decay are an ideal environment—a “trap” for the atmospheric carbon pool. Wherein, carbon is accumulated not only in aboveground biomass but also in the surface layers of soil. The process of carbon sequestration in forest soils takes place in two ways: through the input and transformation of organic substances on the surface and the activity of the root system [1]. Litter decomposition is one of the main sources of SOC and thus the quality of the incoming organic substance (C:N ratio, content of lignin compounds, hemicelluloses, celluloses, proteins, etc.) will significantly affect the amount of sequestration of this element [7]. Among the chemical compounds present in the litter, lignin and phenolic compounds are characterized by a high resistance to microbial degradation, and thus slow down the process of its decomposition. The rate of the process of carbon sequestration in the pedosphere is determined by soil properties, primarily its texture, habitat and climate conditions, and ranges from 0–150 kg C·ha−1·year−1 in warm, dry regions to 100–1000 kg C·ha−1·year−1 in a humid and cool climate [2]. At the same time, research conducted in many institutions indicates that the accumulation of carbon in forest soils will depend on the age of the stand, history of land use, climate and species composition [16,17,18,19,20]. In a temperate climate, an increase in soil organic carbon stocks is observed on average 10 years after afforestation of the area.
Afforestation is considered to be an effective and cost-efficient mitigating response to climate change as these reforested sites sequestered CO2 from atmosphere and store it in living and dead organic matter [8]. Humans, by changing land usage and modifying the natural processes occurring in forests like insect outbreaks, have directly and indirectly altered the exchange of CO2 between forest and the atmosphere. The largest changes are expected in the zone of temperate and boreal forests as they are the second largest forest biome and the soil C density is greater than for soils of other forest biomes [13,21].
One of the major issues of global concern is carbon sequestration [22]. However, despite decades of research, there are discrepancies regarding the possibility of carbon accumulation in the forest soils. More research dealing with short- and long-term changes in soil carbon stock is needed. The aim of the study was to determine the content of organic carbon and its seasonal changes in the forest ecosystem growing on post-agricultural soils. Additionally, seasonal changes of dehydrogenases activity was measured to analyze possible mechanisms of carbon content fluctuation with time.

2. Materials and Methods

2.1. Description of the Research Area

The research area is located in the north-western part of Poland (Western Pomerania) in Tuczno Forest District (Regional Directorate of State Forests in Piła, Forestry Martew, 53°11′ N, 16°05′ E, 180 m a.s.l), which is under the management of the State Forests National Forest Holding. The analyzed area is situated in the buffer zone of Drawski National Park, near the center of Tuczno research facility of Poznan University of Life Sciences. The research plots were located in the Drawa Plain Mesoregion [23]. This area is covered with fluvio-glacial and glacial formations of the Vistula glaciation. The oldest sediments are fluvio-glacial sands and gravel with a thickness of 14 m, exposed over a large area at the edges of valleys [24]. The forest was planted in 1953 on meadowland, commonly used by local farmers for cattle grazing after 1945 and formerly as farmland when it was part of Germany [25]. Pine (Pinus sylvestris L.) dominates and accounts for almost 99% of stand species composition. The remaining 1% is an admixture of silver birch (Betula pendula Roth). The underbrush is composed mainly of beech (Fagus sylvatica L.) and hornbeam (Carpinus betulus L.).

2.2. Soil Sampling and Preparation

In order to determine localization of the research plots, preliminary studies were carried out on the spatial variability of the OC content in post-agricultural Brunic Arenosols [26]. Based on applied geostatistical analysis [27], 7 research plots with a 20 × 20 m side were designated to analyze changes in organic carbon content during the growing seasons in the 2012–2016. These research plots were designated with a number code from 1 to 7 (Figure 1). Plots Nos. 2, 3, 5–7 were covered by 60-year-old pine and plots No. 1 and No. 4 by 52 and 50-year-old pine forest, respectively. However, plots of the same age in the same forest stand are located in different hillslope positions [28]. Research plots Nos. 2 and 3 were located on a shoulder, Nos 5 and 6 in backslope and footslope, respectively, whereas plot No. 7 (as well as Nos. 1 and 4) is on a summit.
Each plot was divided into six subplots. In five of these, composite samples from mineral horizon were taken and in two from the O horizon (Figure S1). Samples for analysis of dehydrogenases activity were collected from two subplots. Soil samples were collected three times a year from each research plot during spring, summer and autumn. Composite samples were taken in triplicate from the surface minerals soil horizon (A) from the depth determined by the thickness of this horizon but not deeper than 20 cm and from the O horizon (distinguished on the basis of morphological and organoleptic characteristics). The naturally high spatial interchangeability of organic carbon content in forest soils makes it difficult to estimate small changes of this parameter. This problem is caused by, among others, high level of animal activity. Therefore data presented in this article are average values of carbon content, both in A (average of five subplots) and O (average of two subplots) horizons. During soil sampling, soil temperature was measured at a depth of 7 cm b.g.l. Temperature measurements in the field were done with the use of the PT-411 platinum thermometer by Elmetron. Moreover, samples were taken for the analysis of the enzymatic activity of soils, which were tightly packed in polypropylene containers and transported to the laboratory at 4 °C. The enzymatic activity analyses were performed the day after sampling.

2.3. Laboratory Methods and Analyses

Soil samples for physico-chemical and chemical analyses were dried at room temperature and then passed through a 2 mm sieve. Organic carbon (OC) in the soil samples was determined by the dry combustion method (Multi N/C3100 Analytikjena). As the soil did not contain carbonates, the carbon content obtained was treated as organic carbon [29,30]. For each sampling time, average values for OC content are presented in this work are by averaging data from five subplots for the A horizon and two for the O horizon. The soil reaction (pH) was measured potentiometrically in a water suspension at the soil: solution ratio 1:1 for mineral samples and 1:10 for organic samples [31]. Exchangeable aluminum was determined by the Sokołow method [32]. The dehydrogenases activity was assessed as described by Tabatabai [33] with 2,3,5-triphenyltetrazolium chloride. Enzymatic analysis was done in triplicate and presented as average values.
An internal laboratory reference material and reagent blank were used in order to control the accuracy of soil analyses. The values obtained fall in the required range of reference content. The instrument detection limit for OC in the samples was 0.03 mg·kg−3.

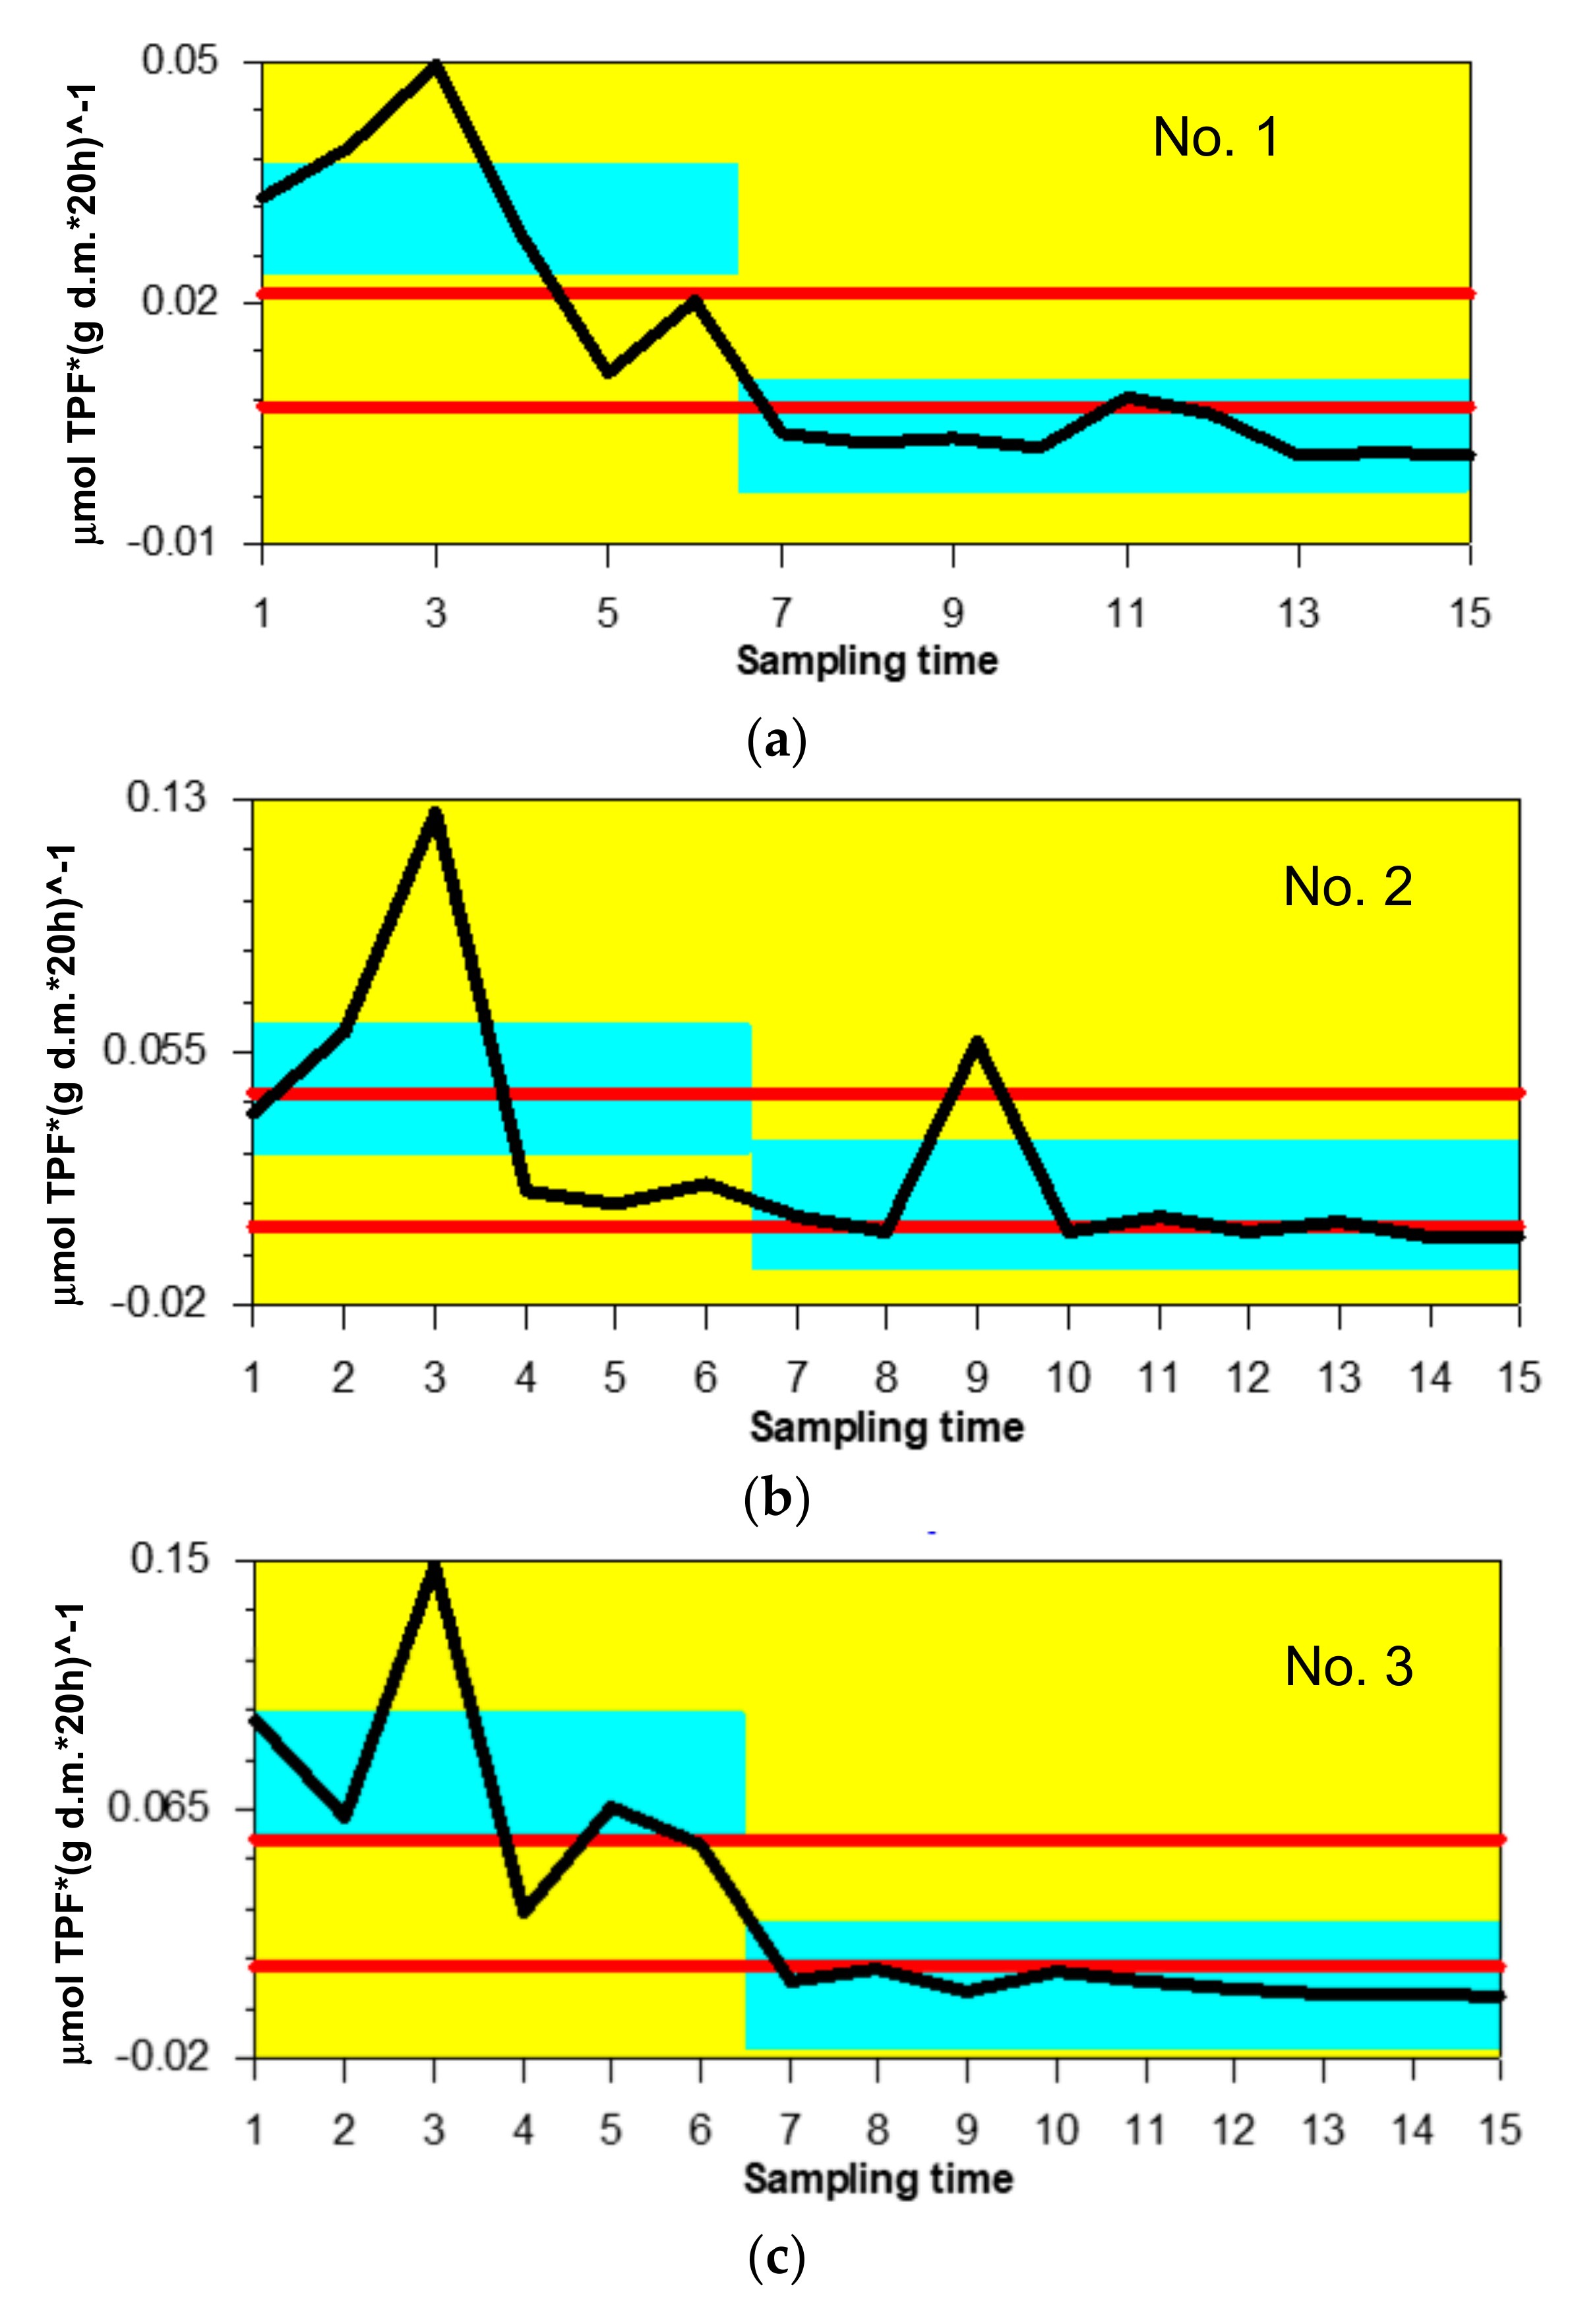
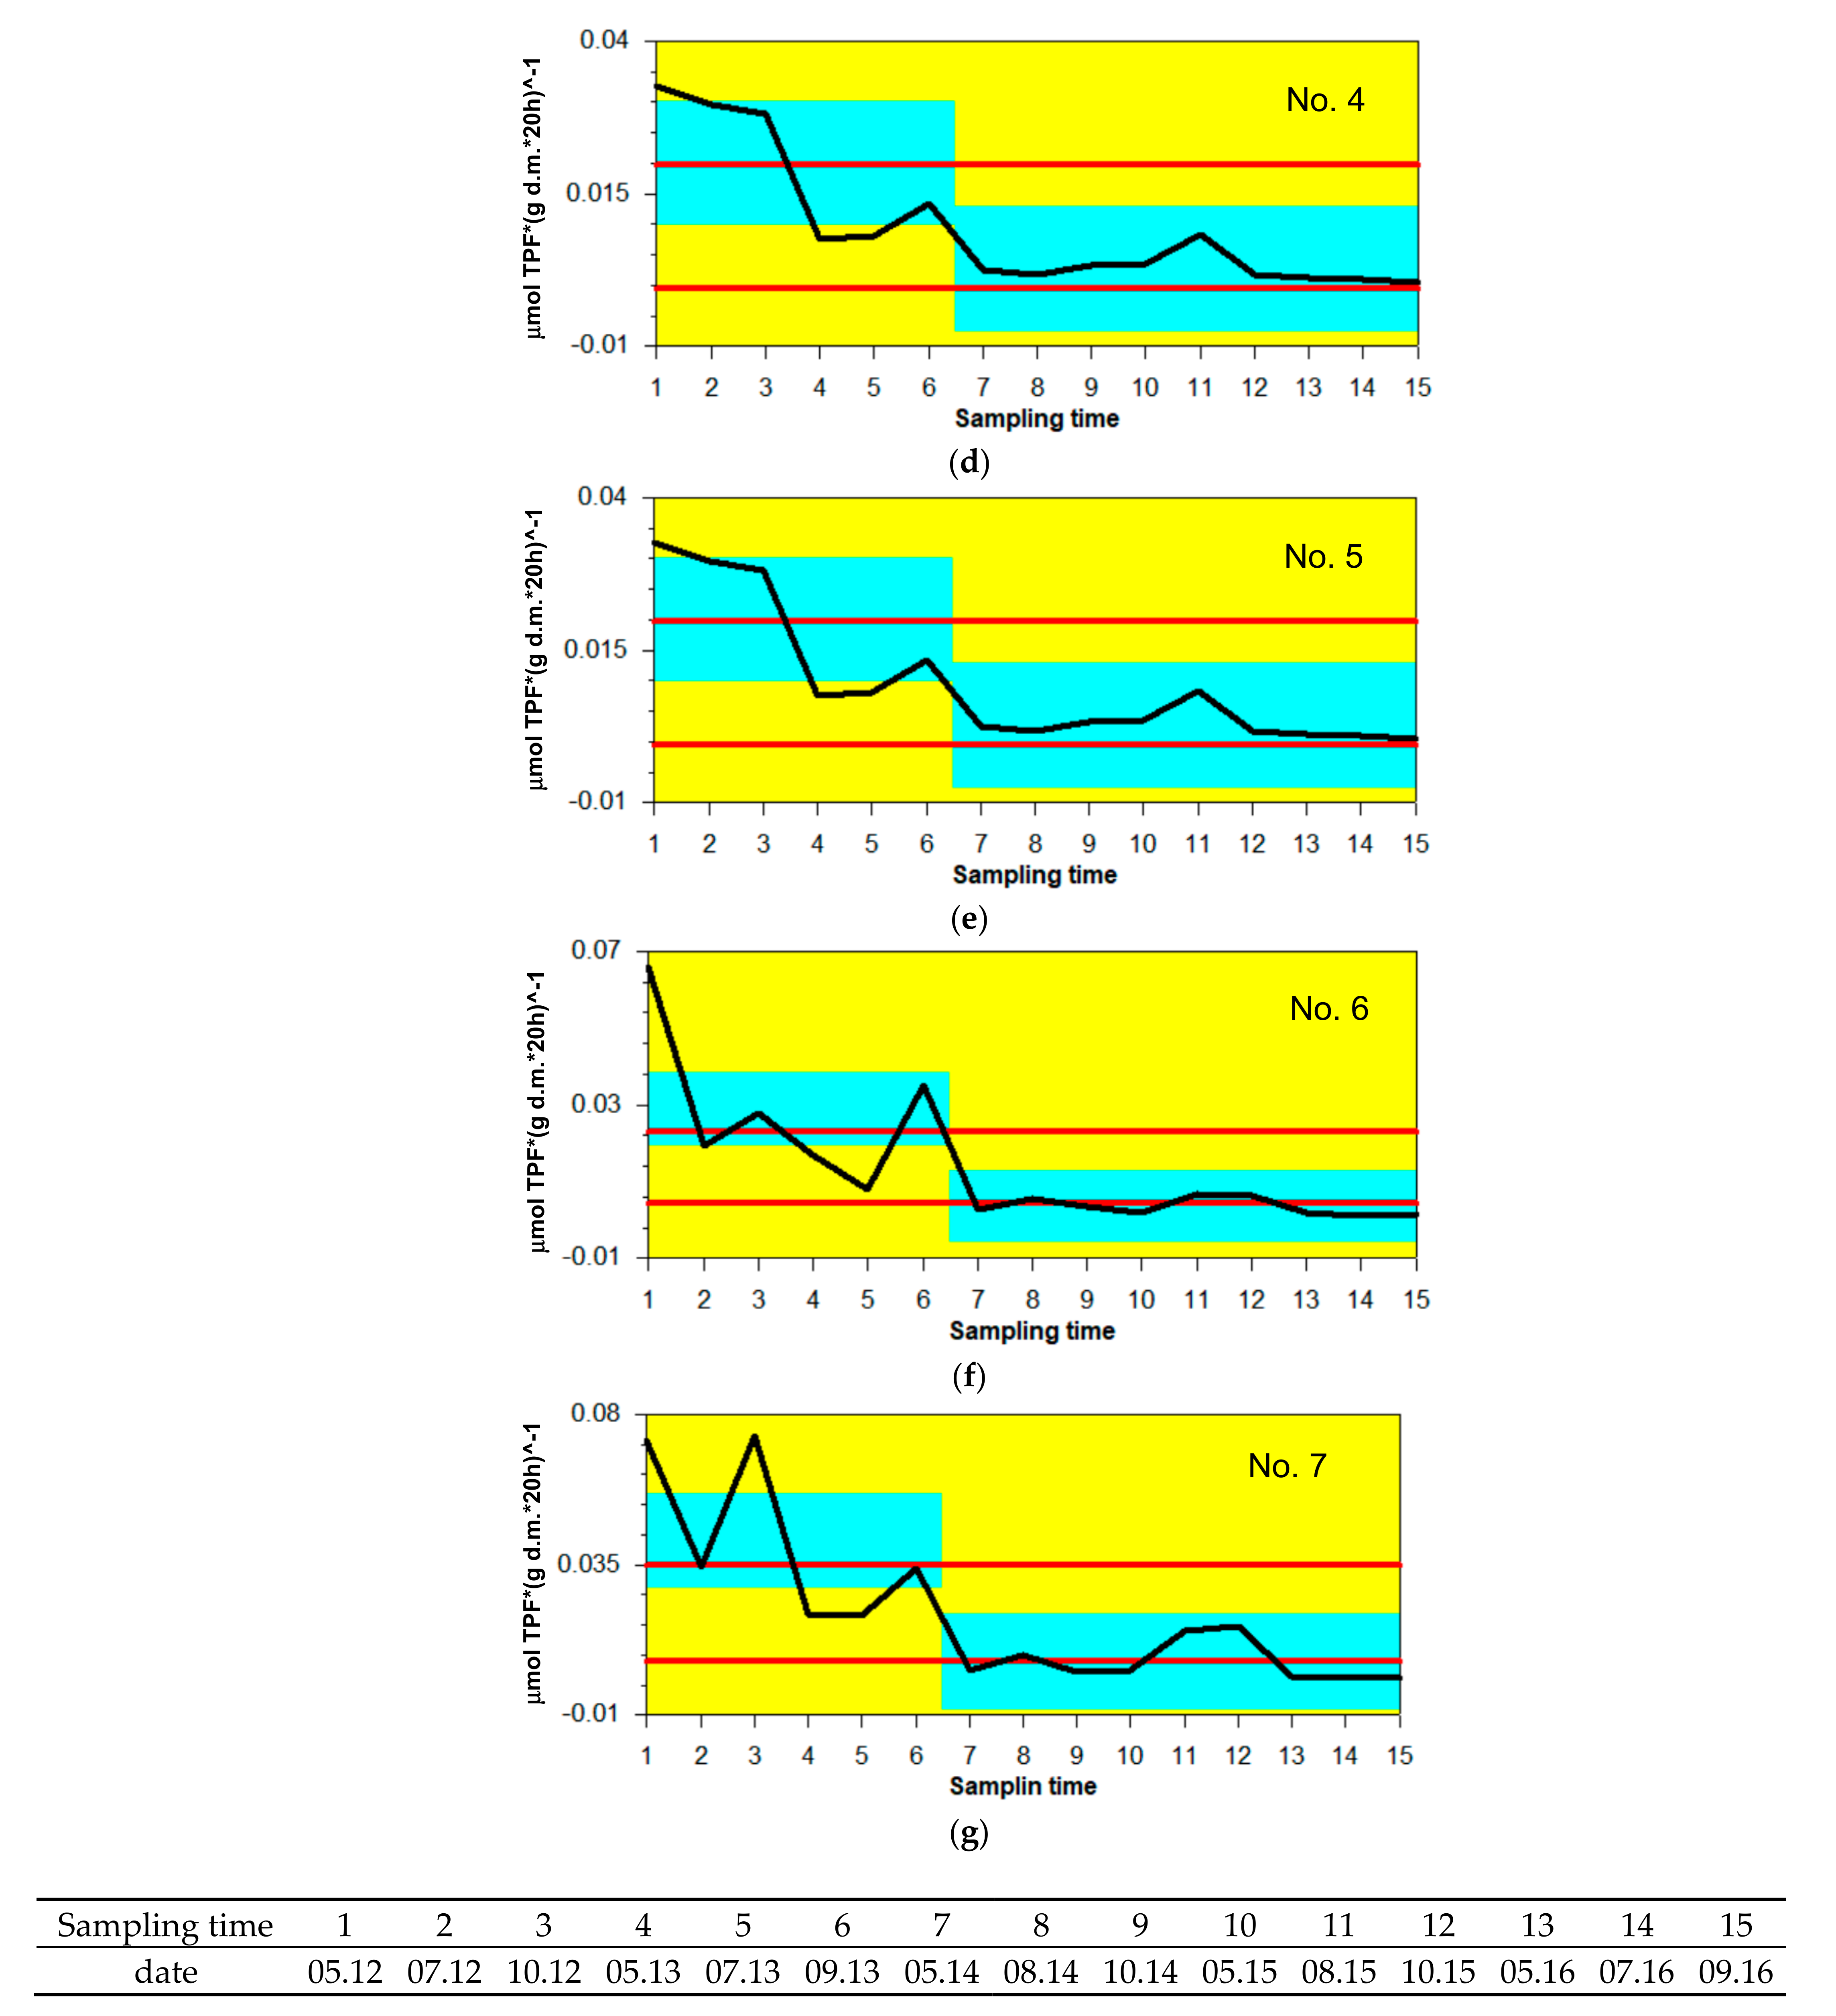
2.4. Statistical Analysis

Basic statistical measures of position and dispersion were used in the development of data. For each research plot and season, the OC content distributions were tested for normality using the Kolmogorov-Smirnov test. Taking into consideration that distribution of OC content in particular seasons and years was not normal, the dates were normalized (log2 transformation) and one-way ANOVA was done. This test was used to compare the OC content between the analyzed years and seasons. Additionally the principal component analysis (PCA) was used to identify the potential groups of factors influencing OC content in forest stands. Statistical analyses were performed using the Statistica 13.3 program (TIBCO Software Inc., Palo Alto, CA, USA). The change-point analysis was conducted with Change-Point Analyzer v. 2.3. (Taylor Enterprises Inc., Libertyville, IL, USA).

3. Results

3.1. Organic Carbon Content in Topsoil Horizons

Soil cover of the studied area was mainly represented by Brunic Eutric Arenosol (Ochric) that developed from fluvio-glacial outwash materials (sand and gravel of 1 level outwash plain). Only research plot 6 was represented by Brunic Eutric Arenosol (Cumullic, Ochric), which was related to the location of this surface in a local depression. In the case of the research plot located in the higher part of the relief (No. 7), soil was classified as Lamellic Luvisol (Arenic, Ochric) [26]. The analyzed soils are characterized by a well-developed A horizon, which abruptly and smoothly separates from the below endopedones, that is a typical characteristic of post-agricultural soils. Due to the nature of incoming debris and the nature of the parent materials, these soils, both in the O and A horizons, were characterized by very strongly acid to strongly acid pH (pH of O horizon 3.38–4.40 and A horizon 3.59–4.49). The organic carbon content in the analyzed profiles in the O horizon ranged from 197.8–446.4 g·kg−1, while the thickness did not exceed 4 cm, except for the research plot No. 6, where the thickness of this horizon was 6 cm. In the case of A horizon OC range from 6.87 to 52.28 g·kg−1. The thickness of A horizon did not exceed 20 cm, except research plot No. 6, where this horizon was noted to the 62 cm depth.
For 2012–2016, the average content of organic carbon in the organic horizon (O) in the analyzed research plots was in the range of 221.3–412.6 g·kg−1. In the mineral accumulation horizon (A), the average organic carbon content in the studied period ranged from 9.40 (plot No. 1) to 15.68 g·kg−1 (plot No. 3) (Table 1). Despite the close location and similar age of the stand, there were statistically significant differences in the chemical properties of soils between the analysis plots. Comparing the OC content among the plots analyzed, it can be concluded that the OC amount in the O horizon of plot No. 1 was significantly different from others (Figure 2). Moreover, it was noted that plots No. 4 and No. 5 contained significantly lower amounts of OC than research plot No. 7. In terms of organic carbon content in the A horizon, plot No. 3, covered with 60-year-old pine, differed significantly from other plots, except plot No. 2. Probably it was related to the localization of the plots in a different microrelief and thus to a different water and matter cycle. Both plots No.1 and No. 2, covered by 60-year-old pine, were located in a shoulder section of the hill. Additionally, plots No. 1 and No. 5, located in a 52-year-old stand and a 60-year-old stand, respectively, were significantly different from research plots No. 2 (Figure 2). No significant difference was found among plots No. 4, No. 6 and No. 7. For both horizon O and A OC content was significantly lower in research plot No. 1 (52-year-old stand) in comparison to other plots. There was no effect of soil type on the observed differences in organic carbon content in the A horizon.
The Spearman’s correlation analysis (p < 0.05) showed that the content of organic carbon in both A and O horizons were positively correlated with stand age (Table S1). In the organic horizon of the 50-year-old stand (plot No. 4) the average OC content was 312.2 g·kg–1, while in the O horizon of the 60-year-old plots No. 2 and No. 3, these values were higher: 386.1 and 357.0 g·kg–1, respectively. In the case of mineral epipedon OC content in the youngest stand (plot No. 4) was 11.06 g·kg–1 and in the older stands (No. 2 and 3) amounted to 12.71 and 15.79 g·kg–1, respectively. The carbon content was also negatively correlated with soil pH and positively with exchangeable aluminum ions (Figure 3). The lowest values of soil pH were observed in the older forest stands (plots No. 2 and No. 3). With the age of stand, the influence of previous agriculture land use on soil pH disappears. It is related to both the nature of the incoming fresh debris and the predominance of precipitation over transpiration. Organic carbon content in the O horizon was additionally, negatively correlated with soil moisture and dehydrogenases activity (DHA). The influence of soil moisture on the carbon content in the O horizon was probably related to the influence on the activity of soil microorganisms which require the presence of available water for their proper functioning. As the soil water content decreased, the microbial activity, measured by dehydrogenase activity, also decreased.
Principal component analysis (PCA) was performed to identify the potential groups of factors influencing soil organic carbon stock. The first four principal components with eigenvalues >1 were extracted through PCA and explained 68.479% of the total variance (Table S2). Approximately 25% of the total variance was explained by factor 1 (F1), showing moderately positive loadings of pH of O horizon and pH of A horizon, F1 mainly presented the soil reaction contribution in C cycle in soil. Factor 2 (F2), accounting for 18.420% of the total data variance, had moderately positive loadings of soil moisture and dehydrogenases activity (DHA). Therefore, F2 might be ascribed to microbial processes of C cycle. Factor 3 (F3, 13.081% of the total variance) had positive loadings of forest stand age and organic carbon content in the A horizon. The F3 could represent the influence of human disturbance (past land use and time that passed since afforestation). Factor 4 (F4) accounted for 11.972% of the total variance and had strong positive loadings on soil temperature. Taking this into consideration, F4 might be identified as a climate factor influencing the carbon cycle.

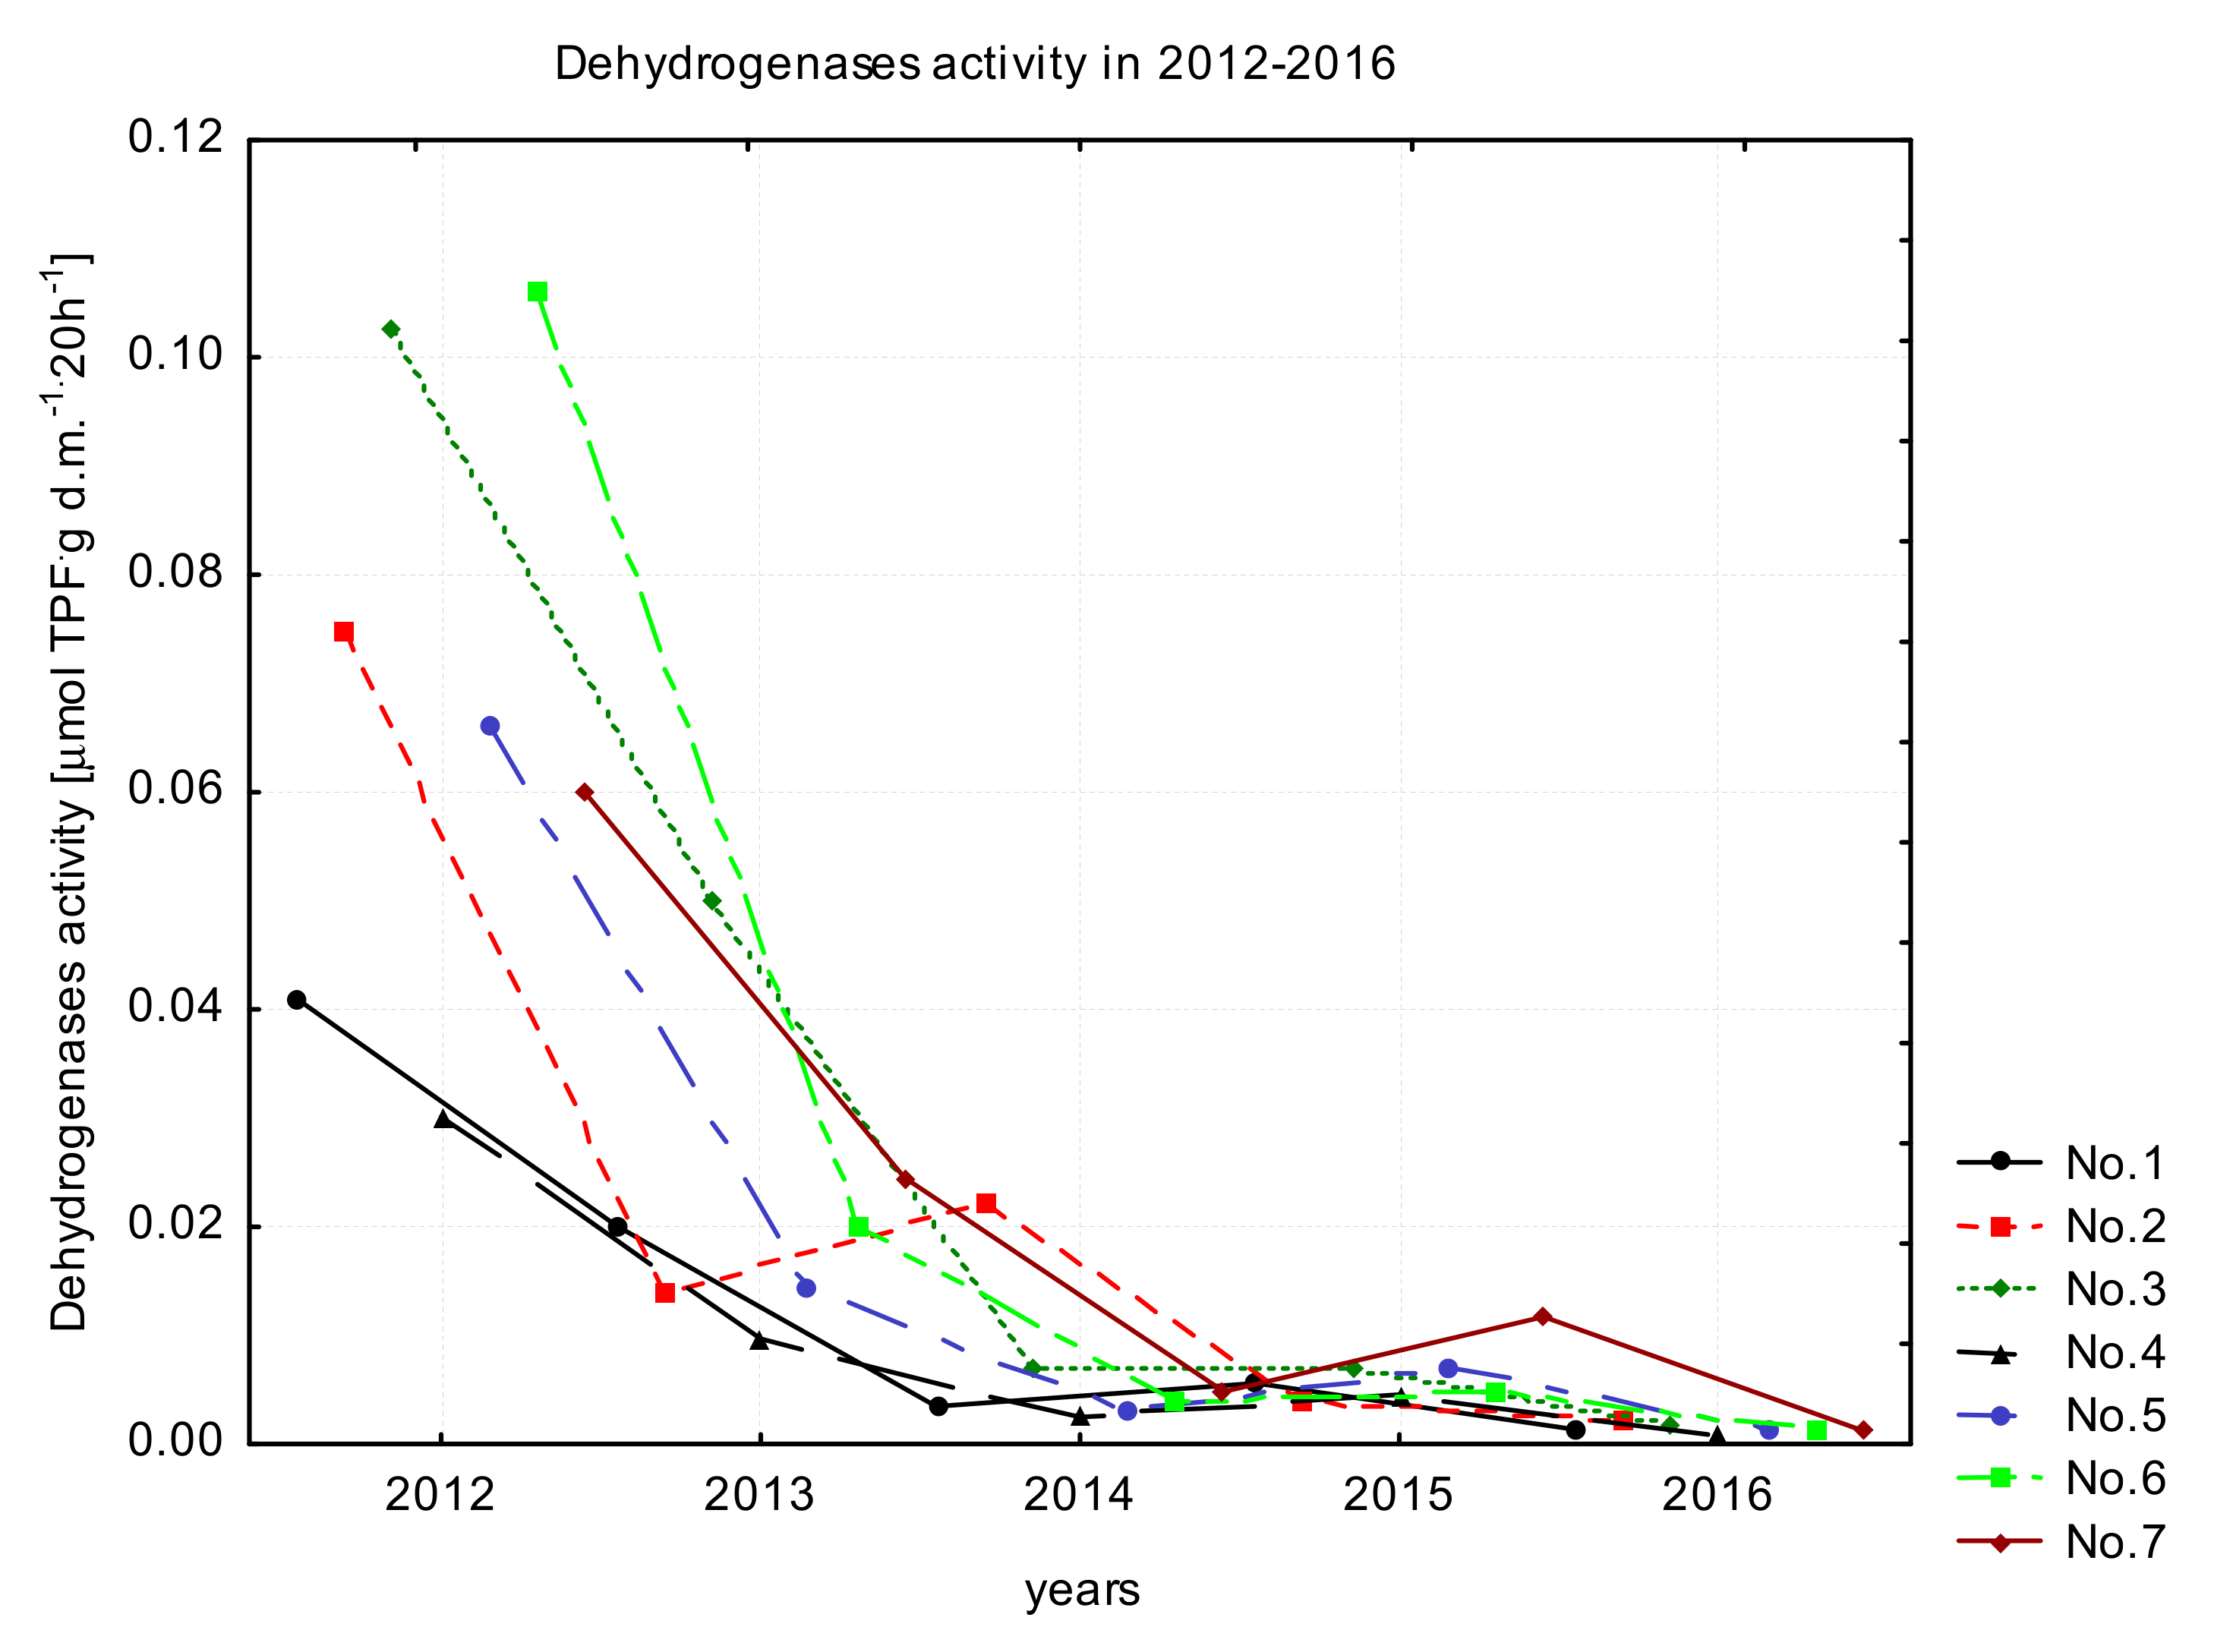
3.2. Variability in OC Content and DHA

The analysis of the organic carbon content in the A horizon in 2012–2016 indicates the existence of a certain pattern of seasonal variations in this parameter. In the spring and autumn period, the organic carbon content was higher than the average values recorded in the summer seasons (Figure 4b). In the case of organic carbon content in the O horizon, such regularity was not observed (Figure 4a). In the research plots No. 4 and No.6, an increase in the content of organic carbon in the soil was observed from spring to autumn. A downward trend was observed on plot No. 5 from spring to autumn. In the case of research plots No. 1, No. 3 and No. 7, the same trend of variations was observed as in the A horizon. Research plot No. 2 was characterized by a different course of seasonal variations in organic carbon content; the highest values were recorded in the summer period. Despite the statistically significant seasonality of the organic carbon content in the A horizon, no significant differences were found for the O horizon in any of the research plots.
Analyzing the content of organic carbon for particular plots in individual years, no statistically significant differences were observed between them, both in the O and A horizons. However, in both O and A horizons, some variations in the content of organic carbon were observed in certain years of the study. These fluctuations were more visible in the mineral, A horizon. For the O horizon in research plots No. 1, No. 3, No. 4 and No. 7 higher mean values of OC content in 2016 (268.4–477.5 g·kg−1) than in 2012 (181.1–342.9 g·kg−1) were recorded (Figure 5a). In the rest of research plots (No. 2, No. 5, No. 6) the highest average OC content was noted in 2014. The Tukey test conducted for all data (n = 196) obtained for the O horizon showed that the content of OC in 2012 and 2013 was statistically different from years 2014, 2015 and 2016. In the A horizon, in contradiction to the O horizon, there was no increase in the OC content in the subsequent research years. Average values of the OC content were either lower in 2016 or similar to those in 2012 (Figure 5b). In the mineral horizon of all of the research plots a decrease in OC content was observed in 2013 (8.7–14.55 g·kg−1) and maximum was noted in 2014 (9.81–18.15 g·kg−1). The analysis of all data of OC content in A horizon (one-way ANOVA, without considering plots division, n = 525) showed that a statistically significant difference was observed between 2013 and 2014 and additionally between 2014 and 2016.
Although previous statistical analyses showed the dependence of dehydrogenase activity on the age of the stand, soil moisture and carbon content at the O horizon, the research plots analyzed did not differ from each other in terms of the activity of this enzyme (Figure 6). Only research plot No. 4 (the youngest one) exhibited significantly lower dehydrogenases activity than plots No. 2, 3 and 7, and plot No. 1 (52-year-old stand) in comparison to plot No. 3. On the youngest forest stands (No. 4 and No.1), lower values of this enzyme activity were recorded than on 60-year-old stands, on average 0.01, 0.014 and 0.025 μmol TPF·g d.m.−1·20 h−1, respectively.
Analyzing temporary changes in DHA, no seasonal pattern was found. The obtained results (Figure 7) depict a small increase in dehydrogenases activity in autumn in comparison to other seasons, however this pattern was observed in research plots Nos. 2–3 and Nos. 5–7. The mean values for spring, summer and autumn from the entire research period range 0.013–0.029, 0.008–0.030 and 0.016–0.056 μmol TPF·g d.m.−1·20 h−1, respectively.
Despite the lack of seasonal differences in DHA, visible variability was observed among analyzed years. The highest value of DHA, independently of a research plot, was noted in 2012 (range 0.030–0.106 and mean 0.069 μmol TPF·g d·m−1·20 h−1) (Figure 8). Next year DHA significantly decreased and ranged from 0.010 to 0.050 μmol TPF·g d·m−1·20 h−1 (mean 0.022). This reduction was observed till the end of the study, 2016 (range 0.001–0.002 and mean 0.001 μmol TPF·g d·m−1·20 h−1).
Furthermore, change-point analysis was used to depict possible abrupt changes in OC content in the studied horizons and dehydrogenases activity. Change-point analysis is one of the statistical approaches that have been widely adopted by researchers to detect change points in a data stream [34]. Change-point is a point that shows where a shift in the data pattern occurs. It is also defined as a point at which the parameters (mean, variance, and trend, etc.) of an underlying distribution or the parameters of a model used to describe time series abruptly changes [35]. Conducted analyses for OC content showed that in the case of the O horizon abrupt changes in data stream occurred in research plots No. 1 and Nos. 4–7 (Figure 9). For plots No. 1, No. 4 and No. 5 such a change appeared only once after 7th, 6th and 7th sampling time, respectively. For plots No. 5 and No. 6 two change points were found, both after 5th and 10th sampling time. However, in the A horizon such a change-point was found only for research plot No. 7, where twice during measurement a period shift in the data pattern was observed. The change was noticed after 7th and 11th sampling time (beginning of 2014 and end of 2015). More consistence results were obtained for dehydrogenases activity—in all research plots a sharp change occurred after 6th sampling time (2014 spring) (Figure 10).

4. Discussion

4.1. Factors Controling OC Content

Organic carbon is a key component that has a significant impact on the functioning of terrestrial ecosystems. Its content in soil is the result of the interaction between the dynamic processes of photosynthesis, degradation and soil respiration. While climatic conditions largely account for the global patterns of changes in soil organic carbon content, other factors, interacting with the climate, shape local spatial and temporal variability in the distribution of this element. The statistical analyses conducted indicated that OC content in forest soil was partly a function of the age of the stand. Higher values were noted for older forest stands. Similar results were obtained by Zak et al. [36], Vesterdal et al. [37], Ritter [38], Laganiere et al. [39], Kang et al. [40] and Dłużewski et al. [41], who also observed an increase of organic carbon in soil with the age of stands. However, the age of the forest stand was not the only one factor influencing the organic carbon stock in the soil. Another factor was the soil pH, which presented a negative correlation with OC content. The analogous relationship between these parameters was reported by Komisarek and Wiatrowska [27]. Six et al. [42] Busse et al. [43] and Kang et al. [40] suggested that low pH level favor fungal growth, which (i) incorporates more C into biomass than bacteria, (ii) has more recalcitrant cell walls than bacteria and (iii) promotes C stabilization and protects by enhancing soil aggregation. Moreover, soil moisture and dehydrogenases activity was found to be shaping OC stocks. The influence of soil moisture on the carbon content in the O horizon was probably related to the influence on the activity of soil microorganisms which require the presence of available water for their proper functioning. As the soil water content decreases, the microbial activity, measured by dehydrogenase activity, also decreases. Dehydrogenases are one of the most important groups of oxidoreductase enzymes class [44], commonly used as an indicator of overall soil microbial activity [44,45,46], because they occur intracellularly in all living microbial cells [47,48,49]. It was reported by Geisseler et al. [50] and Wolińska and Stępniewska [51] that when the water potential increases the microbial activity and intracellular enzyme activity slows down. As a result, the processes of microbiological decomposition of organic debris are slowed down and the stock of organic matter in the soil is increased.

4.2. Variations in OC Content and DHA

Our study indicates an existent of a seasonal pattern of OC content change. During spring and autumn months, higher amounts of OC were noted in comparison to summer months. The pattern of variations obtained is probably associated with lower soil temperature values and higher soil moisture in spring and autumn, which limits the intensity of abiotic mineralization. In the spring, the soil temperature still slows down the activity of microbes, thus the active forms of soil organic matter have not yet been broken down by heterotrophs. Bolat [52] and Babur and Dindaroglu [53] observed a similar seasonality of organic carbon content in the mineral epipedons of forest soils. These studies also took into account the differences in the species composition of forests. The seasonal character of soil organic carbon content was recorded only for coniferous stands: Caucasian fir, Cedar of Lebanon and Black pine. Moreover, Dłużewski et al. [41] observed the seasonality of the OC content in pine stands, but obtained significantly higher carbon values in the autumn period.
Even though, in general, there were no statistically significant differences in OC content between the study years, some differences were observed between certain years. In the case of O horizon significant difference were observed between two first years of studies and years 2014, 2015 and 2016. While, in the A horizon such difference was found only between 2013 and 2014 as well as between 2014 and 2016. Additionally, Gubler et al. [54] analyzing OC changes in the topsoil of Swiss cropland over 25 years reported no statistically significant changes between study years. They observed inconsistent changes among site studied ranging from −12 to +11% over 10 years. Whereas our results showed variations in the A horizon from −22 to +11.2% within five years. Other authors Leinweber et al. [55] and Wuest [56] reported variations of 15% within one year and 14–16% within 39 months, respectively. The decrease in OC content in mineral horizon noted for 2013 and later increase in the next years was probably caused by a combination of microorganism activity and meteorological conditions. Taking into consideration that dehydrogenases play a significant role in the biological oxidation of soil organic matter by transferring hydrogen from organic substrates to inorganic acceptors [51,57] activity of this enzyme group may significantly change the content of active pool of organic matter. The activity of soil microorganisms, assessed on the basis of dehydrogenase activity, was the highest in 2012 (Figure 6). This could be due to the higher amount of rainfall recorded this year (657 mm- very wet year) (Figure S2). Wolińska & Bennicelli [58] and Wolińska & Stępniewska [51,59] reported that DHA is strongly affected by soil moisture. They associated this relationship with the fact that the metabolism and the survival of soil microorganisms are also strongly impacted by the water availability. Consequently, low water availability can inhibit microbial activity and reduce enzymes activity. Periods with high soil moisture may support microbial communities and thus increases the rate of organic matter turnover. Additionally, the distribution of precipitation in 2013 changed, over 75% of annual rainfall was recorded before the end of June. During summer and autumn seasons combination of higher air temperature (average 16.22 °C) and small amounts of precipitation (127 mm) favor mineralization processes. Considering the fact that the content of organic carbon in the mineral horizon is the result of the dynamic equilibrium between the input of organic substance and the processes of its mineralization taking place over several years, the dry year effect was visible in the results of the next research years. According to Lűtzow et al. [12], active fractions of organic carbon undergo changes within 1–2 years. Therefore, no identical trends in changes in the organic carbon content in the horizons of O and A were observed for the research plots in the subsequent study years.
Despite the fact that many authors reported a seasonal variation in soil enzyme activity [49,60], the obtained results do not coincide with their observations. These authors linked the observed seasonal changes of enzyme activity with the combined effects of temperature, moisture, substrate availability and other environmental factors. As dehydrogenases are only active in living cells, these enzymes display strong fluctuations in their activities during the year. The lowest value of DHA were noted in winter and the highest in autumn [49]. However other authors found the highest DHA in the spring period [60]. In this study only a small increase in DHA was observed during autumn months. The difference in these results might be connected to different weather patterns and availability of easily decomposable organic substance. In the case of this study lack of significant seasonality of DHA might be caused both by not taking into account the winter period and a different plant community (a different type of fresh organic matter inflow with diverse susceptibility to microbial attack). Additionally, this might be related to the slow process of microorganism’s population modification after the land use change from agricultural to forestry. According to the research of Kang et al. [40], Dłużewski [61], after the afforestation of farm land, the population of bacteria and actinomycetes slowly decreases with a simultaneous increases in the share of fungi. The different nature of incoming organic matter and changes in nutrient availability in young forest stand result in lower microbiological and thus enzymatic activity [62]. In order to recognize sharp changes in the parameters studied, change-point analysis was applied. An abrupt decrease in DHA was observed in spring 2014, which continued to the end of research period. A decrease in the activity of this enzyme’s group could be a result of lower amounts of precipitation observed in 2014 and 2015 and also a change in the distribution of rainfall. Moreover, the higher temperatures noted in these years increase evapotranspiration leading to lower soil moisture affecting microbial communities through starvation (Figure S3). In the case of OC content a marked increase in the O horizon was observed in 2013. This change coincides with a period of lower precipitation (538 mm, 525 mm and 509 mm in 2013, 2014 and 2015, respectively) compared to previous years and the multi-year average (553 mm) [25]. Lower sums of precipitation together with a decrease in environmental humidity contributed to a decrease in microbial activity, measured by DHA. This was probably one of the reasons for the increase in OC content in the O horizon. At the same time, studies by Urbaniak et al. [63], showed that during research years, the meteorological conditions had a greater impact on the photosynthesis process (gross ecosystem photosynthesis (GPP)) than on the respiration of the ecosystem. The GPP decrease from 58.21 in 2013 to 53.65 and 48.87 (MgCO2·ha−1) in 2014 and 2015, respectively. At the same time, ecosystem respiration in 2013 amounted to 15.82 and in the following years 13.79 and 10.51 (MgCO2·ha−1), thus suggesting that an increased inflow of plant residues to the litter horizon contributed to the higher content of OC.

5. Conclusions

The results of a five-year study on the seasonal variability of organic carbon content in topsoil horizons showed that during the spring and autumn period, the organic carbon content was higher than the average values recorded in the summer. However, there was no such regularity regarding the content of organic carbon in the O horizon. Moreover, no statistically significant differences were observed between the content of organic carbon in individual years but only for certain years. During the research period, an increase in OC content was observed only in the O horizon whereas in the A horizon it either remained at the same level or was slightly lower. The result of PCA analysis showed that OC content in the study area was a function of the interaction of four groups of factors: soil reaction, rate of microbial processes, human disturbance and meteorological. The correlation analysis indicated that OC content in soils were a function of forest stand age and progressive acidification of soil. Furthermore, OC content in the litter horizon was negatively correlated with soil moisture and dehydrogenases activity, suggesting that periods with higher microbial activity lead to lower accumulation of carbon in the O horizon.
Dehydrogenases activity was related to the presence of OC in the O horizon and soil moisture and the age of forest stand. Despite the fact that dehydrogenase shows a strong seasonality, such a phenomenon has not been recorded in this pine forest. However, a difference in DHA was observed in the years studied. An abrupt drop of DHA was noted in spring 2014 and an increase in OC content in the O horizon was recorded.
In order to confirm these seasonal variations in OC content and dehydrogenases activity, further studies with time-series data are needed. A much longer period of study is required, especially to recognize the potential of carbon sequestration by terrestrial ecosystems in the temperate forest zone.

Supplementary Materials

The following are available online at https://0-www-mdpi-com.brum.beds.ac.uk/article/10.3390/f12040459/s1, Figure S1: Scheme of the research plot soil sampling, Figure S2: Sum of precipitation and average annual temperature of the study period in Tuczno research field, Figure S3: Soil moisture (average) fluctuations on particular research plots during study years, Table S1: Person correlation analysis between organic carbon content in A and O horizons and physicochemical and biochemical soil properties, Table S2: The principal component analysis of soil properties.

Author Contributions

Conceptualization, K.W., J.K. and J.O.; methodology, J.K.; software, K.W.; validation, K.W. and J.K.; formal analysis, K.W.; investigation, K.W., J.K.; resources, K.W.; data curation, K.W.; writing—original draft preparation, K.W.; writing—review and editing, J.K.; visualization, K.W.; supervision, J.K.; project administration, J.O.; funding acquisition, J.O. All authors have read and agreed to the published version of the manuscript.

Funding

This research was supported by funding from States Forest National Forest Holding in Poland (project LAS, No OR-2717/27/11).
The publication was financed within the framework of Ministry of Science and Higher Education programme as „Regional Initiative Excellence” in years 2019–2022, Project No. 005/RID/2018/19.

Institutional Review Board Statement

Not applicable.

Informed Consent Statement

Not applicable.

Data Availability Statement

Not applicable.

Conflicts of Interest

The authors declare no conflict of interest. The funders had no role in the design of the study; in the collection, analyses, or interpretation of data; in the writing of the manuscript, or in the decision to publish the results.

References

  1. Alemu, B. The Role of Forest and Soil Carbon Sequestrations on Climate Change Mitigation. J. Agric. Environ. Manag. 2014, 3, 492–505. [Google Scholar]
  2. Lal, R. Soil carbon sequestration Impacts on global climate change and food security. Science 2004, 304, 1623. [Google Scholar] [CrossRef] [PubMed] [Green Version]
  3. Lal, R. Soil carbon sequestration to mitigate climate change. Geoderma 2004, 123, 1–22. [Google Scholar] [CrossRef]
  4. Lal, R. Carbon sequestration. Philos. Trans. R. Soc. B Biol. Sci. 2008, 363, 815–830. [Google Scholar] [CrossRef] [PubMed]
  5. Paul, K.I.; Polglase, P.J.; Nyakuengama, J.G.; Khanna, P.K. Change in soil carbon following afforestation. For. Ecol. Manag. 2002, 168, 241–257. [Google Scholar] [CrossRef]
  6. Deng, L.; Zhu, G.Y.; Tang, Z.S.; Shangguan, Z.P. Global patterns of the effects of land-use changes on soil carbon stocks. Glob. Ecol. Conserv. 2016, 5, 127–138. [Google Scholar] [CrossRef] [Green Version]
  7. Schmidt, M.W.I.; Torn, M.S.; Abiven, S.; Dittmar, T.; Guggenberger, G.; Janssens, I.A.; Kleber, M.; Kögel-Knabner, I.; Lehmann, J.; Manning, D.A.; et al. Persistence of soil organic matter as an ecosystem property. Nature 2011, 478, 49–56. [Google Scholar] [CrossRef] [Green Version]
  8. Shi, S.; Zhang, W.; Zhang, P.; Yu, Y.; Fan, D. A synthesis of change in deep soil organic carbon stores with afforestation of agricultural soils. For. Ecol. Manag. 2013, 296, 53–63. [Google Scholar] [CrossRef]
  9. Christensen, B.T. Decomposability of organic matter in particle size fractions from field soils with straw incorporation. Soil Biol. Biochem. 1987, 4, 429–435. [Google Scholar] [CrossRef]
  10. Ontl, T.A.; Schulte, L.A. Soil Carbon Storage. Nat. Educ. Knowl. 2012, 3, 35. [Google Scholar]
  11. Sun, X.; Tang, Z.; Ryan, M.G.; You, Y.; Sun, O.J. Changes in soil organic carbon contents and fractionations of forests along a climatic gradient in China. For. Ecosyst. 2019, 6, 1. [Google Scholar] [CrossRef] [Green Version]
  12. Lützow, M.; Kögel-Knabner, I.; Ekschmitt, K.; Matzner, E.; Guggenberger, G.; Marschner, B.; Flessa, H. Stabilization of organic matter in temperate soils: Mechanisms and their relevance under different soil conditions—A review. Eur. J. Soil Sci. 2006, 57, 426–445. [Google Scholar] [CrossRef]
  13. Gower, S.T. Patterns and mechanisms of the forest carbon cycle. Annu. Rev. Environ. Resour. 2003, 28, 169–204. [Google Scholar] [CrossRef]
  14. IPCC. Summary for policy makers. In Climate Change; Solomon, S., Qin, D., Manning, M., Chen, Z., Marquis, M., Averyt, K.B., Tignor, M., Miller, H.L., Eds.; Cambridge University Press: Cambridge, UK, 2007; pp. 1–18. [Google Scholar]
  15. McKinley, D.; Ryan, M.; Birdsey, R.; Giardina, C.; Harmon, M.; Heath, L.; Houghton, R.; Jackson, R.; Morrison, J.; Murray, B. A synthesis of current knowledge on forests and carbon storage in the United States. Ecol. Appl. 2011, 21, 1902–1924. [Google Scholar] [CrossRef] [Green Version]
  16. Smal, H.; Ligeza, S.; Olszewska, M. The effect of afforestation of sandy post-arable soils on the quality of organic matter and chemical composition of soils solution. Soil Sci. Annu. 2004, 55, 139–148. [Google Scholar]
  17. Dovydenko, N. Contents of carbon in soil of selected pine and spruce stands occurring on post-agricultural lands. For. Res. Inst. 2004, 2, 49–66. [Google Scholar]
  18. Degórski, M. Influence of forest use on soil organic carbon reserves. Monit. Nat. Environ. 2005, 6, 75–83. [Google Scholar]
  19. Smal, H.; Olszewska, M. The effect of afforestation with Scots pine (Pinus silvestris L.) of sandy post-arable soils on their selected properties. II. Reaction, carbon, nitrogen and phosphorous. Plant Soil 2008, 305, 171–187. [Google Scholar] [CrossRef]
  20. Li, T.; Ren, B.; Wang, D.; Liu, G. Spatial variation in the storages and age-related dynamics of forest carbon sequestration in different climate zones—evidence from black locust plantations on the Loess Plateau of China. PLoS ONE 2015, 10, e0121862. [Google Scholar] [CrossRef] [Green Version]
  21. Wiesmeier, M.; Prietzel, J.; Barthold, F.; Spörlein, P.; Geuß, U.; Hangen, E.; Reischl, A.; Schilling, B.; von Lützow, M.; Kögel-Knabner, I. Storage and drivers of organic carbon in forest soils of southeast Germany (Bavaria)—Implications for carbon sequestration. For. Ecol. Manag. 2013, 295, 162–172. [Google Scholar] [CrossRef]
  22. Powers, R.F.; Busse, M.D.; McFarlane, K.J.; Zhang, J.; Young, D.H. Long-term effects of silviculture on soil carbon storage: Does vegetation control make a difference? Forestry 2013, 86, 47–58. [Google Scholar] [CrossRef] [Green Version]
  23. Kondracki, J. Regional Geography of Poland; PWN: Warszawa, Poland, 2002. [Google Scholar]
  24. Krogulec, E.; Wierchowiec, J.; Bujakowska, K.; Bojakowska, I.; Kwecko, P.; Pasieczna, A.; Tomassi-Morawiec, H. Explanations to the Geo-Environmental Map of Poland 1: 50,000; Warsaw PGI-NRI: Warszawa, Poland, 2009. [Google Scholar]
  25. Ziemblińska, K.; Urbaniak, M.; Chojnicki, B.H.; Black, T.A.; Niu, S.; Olejnik, J. Net ecosystem productivity and its environmental controls in a mature Scots pine stand in north-western Poland. Agric. For. Meteorol. 2016, 228–229, 60–72. [Google Scholar] [CrossRef]
  26. World reference base for soil resources 2014. In International Soil Classification System for Naming Soils and Creating Legends for Soil Maps Update; FAO: Rome, Italy, 2015.
  27. Komisarek, J.; Wiatrowska, K. Changes in organic carbon content in post-agricultural forest soils in Tuczno reaserch area. In The Role of the Forest in Absorbing Carbon Dioxide from the Atmosphere; Olejnik, J., Małek, S., Eds.; University Publisher, Poznan University of Life Sciences: Poznan, Poland, 2020; pp. 271–291. [Google Scholar]
  28. Schoeneberger, P.J.; Wysocki, D.A.; Benham, E.C. Soil Survey Staff. In Field Book for Describing and Sampling Soils, Version 3.0; Natural Resources Conservation Service, National Soil Survey Center: Lincoln, NE, USA, 2012. [Google Scholar]
  29. Schumacher, B.A. Methods for the Determination of Total Organic Carbon (TOC) in Soils and Sediments; United States Environmental Protection Agency, Environmental Sciences Division National, Exposure Research Laboratory: Washington, DC, USA, 2002.
  30. Santi, C.; Certini, G.; D’Acqui, L.P. Direct Determination of Organic Carbon by Dry Combustion in Soils with Carbonates. Commun. Soil Sci. Plan. 2006, 37, 155–162. [Google Scholar] [CrossRef]
  31. Rebecca, B. (Ed.) Soil Survey Laboratory Methods Manual. In Soil Survey Investigations Report No. 42 version 4.0 November 2004; NRCS Natural Resources Conservations Service: Washington, DC, USA, 2004. [Google Scholar]
  32. Ostrowska, A.; Gawliński, S.; Szczubiałka, Z. Methods of Analysis and Assessment of the Soil and Plants; State Institute of Environmental Protection: Warszawa, Poland, 1991. [Google Scholar]
  33. Tabatai, M.A.; Bremner, J.M. Soil enzymes. In Methods of Soil Analysis Part 2, 2nd ed.; American Society of Agronomy Inc.: Madison, WI, USA, 1969; pp. 903–968. [Google Scholar]
  34. Siti, N.A.M.A.; Mohamad, F.M.M.; Azuraliza, A.B.; Abdul, R.H.; Sharifah, M.; Syed, A. Change point analysis: A statistical approach to detect potential abrupt change. J. Teknol. 2017, 79, 147–159. [Google Scholar]
  35. Beaulieu, C.; Chen, J.; Sarmiento, J.L. Change Point Analysis as a Tool to Detect Abrupt Climate Variations. Philos. Trans. R. Soc. A Math. Phys. Eng. Sci. 2012, 370, 1228–1249. [Google Scholar] [CrossRef] [PubMed] [Green Version]
  36. Zak, D.R.; Grigal, D.F.; Gleeson, S.; Tilman, D. Carbon and nitrogen cycling during old-field succession: Constraints on plant and microbial biomass. Biogeochemistry 1990, 11, 111–129. [Google Scholar] [CrossRef]
  37. Vesterdal, L.; Ritter, E.; Gundersen, P. Change in soil organic carbon following afforestation of former arable land. For. Ecol. Manage. 2002, 169, 137–147. [Google Scholar] [CrossRef]
  38. Ritter, E. Carbon, nitrogen and phosphorus in volcanic soils following afforestation with native birch (Betula pubescens) and introduced larch (Larix sibirica) in Iceland. Plant Soil 2007, 295, 239–251. [Google Scholar] [CrossRef]
  39. Laganiere, J.; Angers, D.A.; Pare, D. Carbon accumulation in agricultural soils after afforestation: A meta-analysis. Glob. Chang. Biol. 2010, 16, 439–453. [Google Scholar] [CrossRef]
  40. Kang, H.; Gao, H.; Yu, W.; Yi, Y.; Wang, Y.; Ning, M. Changes in soil microbial community structure and function after afforestation depend on species and age: Case study in a subtropical alluvial island. Sci. Total Environ. 2018, 625, 1423–1432. [Google Scholar] [CrossRef]
  41. Dłużewski, P.; Wiatrowska, K.; Kozłowski, M. Seasonal changes in organic carbon content in post-arable forest soils. Soil Sci. Annu. 2019, 70, 3–12. [Google Scholar] [CrossRef] [Green Version]
  42. Six, J.; Frey, S.D.; Thiet, R.K.; Batten, K.M. Bacterial and fungal contribution to carbon sequestration in agrosystems. Soil Sci. Soc. Am. J. 2006, 70, 555–569. [Google Scholar] [CrossRef]
  43. Busse, M.D.; Sanchez, F.G.; Ratcliff, A.W.; Butnor, J.R.; Carter, E.A.; Powers, R.F. Soil carbon sequestration and changes in fungal and bacterial biomass following incorporation of forest residue. Soil Biol. Biochem. 2019, 41, 220–227. [Google Scholar] [CrossRef] [Green Version]
  44. Gu, Y.; Wag, P.; Kong, C. Urease, Invertase, Dehydrogenase and Polyphenoloxidase Activities in Paddy Soils Influenced By Allelophatic Rice variety. Europ. J. Soil Biol. 2009, 45, 436–441. [Google Scholar] [CrossRef]
  45. Quilchano, C.; Marañon, T. Dehydrogenase activity in mediterranean forest soils. Biol. Fertil. Soils 2002, 35, 102–107. [Google Scholar] [CrossRef]
  46. Salazar, S.; Sanchez, L.; Alvarez, J.; Valverde, A.; Galindo, P.; Igual, J.; Peix, A.; Santa-Regina, I. Correlation Among Soil Enzyme Activities Under Different Forest System Management Practices. Ecol. Eng. 2011, 37, 1123–1131. [Google Scholar] [CrossRef]
  47. Moeskops, B.; Buchan, D.; Sleutel, S.; Herawaty, L.; Husen, E.; Saraswati, R.; Setyorini, D.; De Neve, S. Soil Microbial Communities and Activities Under Intensive Organic and Conventional Vegetable Farming in West Java, Indonesia. Appl. Soil Ecol. 2010, 45, 112–120. [Google Scholar] [CrossRef]
  48. Zhao, B.; Chen, J.; Zhang, J.; Qin, S. Soil Microbial Biomass and Activity Response to Repeated Drying-Rewetting Cycles Along a Soil Fertility Gradient Modified by Long-Term Fertilization Management Practices. Geoderma 2010, 160, 218–224. [Google Scholar] [CrossRef]
  49. Yuan, B.; Yue, D. Soil Microbial and Enzymatic Activities Across a Chronosequence of Chinese Pine Plantation Development on the Loess Plateau of China. Pedosphere 2012, 22, 1–12. [Google Scholar] [CrossRef]
  50. Geisseler, D.; Horwath, W.; Scow, K. Soil Moisture and Plant Residue Addition Interact in Their Effect on Extracellular Enzyme Activity. Pedobiologia 2011, 54, 71–78. [Google Scholar] [CrossRef]
  51. Wolińska, A.; Stępniewska, Z. Dehydrogenase activity in the soil environment. Dehydrogenases 2012, 10, 183–210. [Google Scholar] [CrossRef] [Green Version]
  52. Bolat, I. Seasonal Changes in Microbial Biomass Carbon (CMIC), Nitrogen (NMIC), Phosphorus (PMIC), and Microbial Respiration of Forest Floor and Top Soil under Beech, Fir and Mixed Fir-Beech Forest Stands. Ph.D. Thesis, Graduate School of Natural and Applied Sciences, Department of Forestry Engineering, Bartın University, Bartın, Turkey, 2011. [Google Scholar]
  53. Babur, E.; Dindaroglu, T. Seasonal changes of soil organic carbon and microbial biomass carbon in different forest ecosystems. Environ. Factors Affect. Hum. Health 2020, 115–123. [Google Scholar] [CrossRef] [Green Version]
  54. Gubler, A.; Wächter, D.; Schwab, P.; Müller, M.; Keller, A. Twenty-five years of observations of soil organic carbon in Swiss cropland showing stability overall but with some divergent trends. Environ. Monit. Asess. 2019, 191, 277. [Google Scholar] [CrossRef] [PubMed] [Green Version]
  55. Leinweber, P.; Schulten, H.R.; Körschens, M. Seasonal variations of soil organic matter in a long-term agricultural experiment. Plant Soil 1994, 160, 225–235. [Google Scholar] [CrossRef]
  56. Wuest, S. Seasonal variation in soil organic carbon. Soil Sci. Soc. Am. J. 2014, 78, 1442. [Google Scholar] [CrossRef]
  57. Zhang, N.; He, X.; Gao, Y.; Li, Y.; Wang, H.; Ma, D.; Zhang, R.; Yang, S. Pedogenic Carbonate and Soil Dehydrogenase Activity in Response to Soil Organic Matter in Artemisia ordosica Community. Pedosphere 2010, 20, 229–235. [Google Scholar] [CrossRef]
  58. Wolińska, A.; Bennicelli, R. Dehydrogenase Activity Response to Soil Reoxidation Process Described as Varied Condition of Water Potential, Air Porosity and Oxygen Availability. Pol. J. Environ. Stud. 2010, 19, 651–657. [Google Scholar]
  59. Wolińska, A.; Stępniewska, Z. Microorganisms Abundance and Dehydrogenase Activity as a Consequence of Soil Reoxidation Process. In Soil Tillage & Microbial Activities; Miransari, M., Ed.; Research Singpost: Kerala, India, 2011; pp. 111–143. [Google Scholar]
  60. Piotrowska, A.; Długosz, J. Spatio–temporal variability of microbialbiomass content and activities related to some physicochemicalproperties of Luvisols. Geoderma 2012, 173–174, 199–208. [Google Scholar] [CrossRef]
  61. Dłużewski, P. Determination of the Variation in the Content of Organic Carbon and Enzymatic Activity in Brunic Arenosols in Different Forest Stand Age of Pinus sp. Ph.D. Thesis, Poznan University of Life Science, Poznań, Poland, 2019. [Google Scholar]
  62. Zhang, M.; Dong, L.G.; Fei, S.X.; Zhang, J.W.; Jiang, X.M.; Wang, Y.; Yu, X. Responses of Soil Organic Carbon Mineralization and Microbial Communities to Leaf Litter Addition under Different Soil Layers. Forests 2021, 12, 170. [Google Scholar] [CrossRef]
  63. Urbaniak, M.; Ziemblińska, K.; Dukat, P.; Olejnik, J. Carbon dioxide exchange streams in pine stands around measuring sites: Tuczno, Mezyk, tlen1 and Tlen2. In The Role of the Forest in Absorbing Carbon Dioxide from the Atmosphere; Olejnik, J., Małek, S., Eds.; University Publisher, Poznan University of Life Sciences: Poznań, Poland, 2020; pp. 187–269. [Google Scholar]
Figure 1. Space arrangement of research plots in Tuczno research area.
Forests 12 00459 g001
Figure 2. The distribution of the data of OC content in the topsoil horizons (a) O horizon; (b) A horizon.
Forests 12 00459 g002
Figure 3. Correlation network analysis between analyzed soil characteristic (n = 196). The correlation network was built using Pearson correlation coefficients and visualized in Cytoscape 3.8.2. The thickness of the edges is proportional to absolute value of Pearson correlation coefficients (red—positive correlations; blue—negative correlations; *: p < 0.05; **: p < 0.01).
Forests 12 00459 g003
Figure 4. The average seasonal content of OC in the (a) O horizon and (b) A horizon.
Forests 12 00459 g004aForests 12 00459 g004b
Figure 5. Annual average organic carbon content in (a) O and (b) A horizons.
Forests 12 00459 g005
Figure 6. The distribution of data of dehydrogenases activity in A horizon.
Forests 12 00459 g006
Figure 7. The average seasonal dehydrogenases activity.
Forests 12 00459 g007
Figure 8. Annual average dehydrogenases activity in A horizons.
Forests 12 00459 g008
Figure 9. Change—point analysis for OC content in the O horizon on research plots: (a) No. 1, (b) No. 4, (c) No. 5, (d) No. 6, (e) No. 7.
Forests 12 00459 g009aForests 12 00459 g009b
Figure 10. Change—point analysis for dehydrogenases activity on research plots: (a) No. 1, (b) No. 2, (c) No. 3, (d) No. 4, (e) No. 5, (f) No. 6, (g) No. 7.
Forests 12 00459 g010aForests 12 00459 g010b
Table 1. Organic carbon content in the O and A horizons in g·kg−1.
Research PlotDescriptive Statistics
Plot Number/Age of the StandAltitude
[m a.s.l.]
O Horizon (n = 28) *A Horizon (n = 75) *
AverageMinimumMaximumStandard DeviationAverageMinimumMaximumStandard
Deviation
No. 1
52 year-old
106221.3120.0392.175.869.405.1617.022.71
No. 2
60 year-old
106386.1157.0538.0109.912.716.8531.454.82
No. 3
60 year-old
105357.0124.2557.0119.515.796.2537.916.37
No. 4
50 year-old
106312.2120.0492.8109.211.166.4123.933.29
No. 5
60 year-old
106307.6156.0485.297.969.615.2817.762.89
No. 6
60 year-old
103312.2120484.499.4310.735.4420.513.79
No. 7
60 year-old
108412.6248.2520.785.4911.066.9118.493.09
* numbers of composite samples (three subsamples) collected from each plot during 2012–2016.
Publisher’s Note: MDPI stays neutral with regard to jurisdictional claims in published maps and institutional affiliations.

