
Ants as Bioindicators of Riparian Ecological Health in Catalonian Rivers
by
 , , , and
Vera Zina
1 ,
,
Marc Ordeix
2 ,
,
José Carlos Franco
1 ,
,
Maria Teresa Ferreira
1 and
Maria Rosário Fernandes
1,* 1
Centro de Estudos Florestais, Instituto Superior de Agronomia, Universidade de Lisboa, Tapada da Ajuda, 1349-017 Lisbon, Portugal
2
Centre d’Estudis dels Rius Mediterranis, Universitat de Vic-Universitat Central de Catalunya, Museu del Ter, Passeig del Ter, 2 08560 Manlleu, Spain
*
Author to whom correspondence should be addressed.
Forests 2021, 12(5), 625; https://0-doi-org.brum.beds.ac.uk/10.3390/f12050625
Submission received: 20 March 2021
/
Revised: 7 May 2021
/
Accepted: 11 May 2021
/
Published: 14 May 2021
(This article belongs to the Special Issue Riparian Forest Dynamics: Ecological Relations and Species Interactions)
Abstract
:In this study, we assess the potential of ants as bioindicators of riparian ecological health in two river types (upland and lowland type) located in the Catalonian region. We proposed to understand to what extent do metrics based on ant responses provide useful information that cannot be presented by traditional biophysical assessments while attempting an approach to creating an ant-based multimetric index (ant-based MMI) of the riparian ecological health. A total of 22 ant species were identified, and 42 metrics related to ant foraging activity, species richness, and functional traits were evaluated as potential core metrics of the index. Riparian features and proximal land use land cover (LULC) were used to distinguish disturbed from less disturbed sites. We found that ant communities strongly responded to human disturbance. When compared with an exclusively physical-based index for the assessment of the riparian health, the ant-based MMI was more sensitive to human disturbance, by also reacting to the effects of the surrounding LULC pressure. This study provides a preliminary approach for an ant-based assessment tool to evaluate the health of riparian corridors although additional research is required to include other river types and a wider stressor gradient before a wider application.
Keywords:
ant metrics; biodiversity; Formicidae; functional index; Iberian Peninsula; integrity; riverscapes1. Introduction
Riparian zones are complex multidimensional systems, responsible for many ecological functions considered crucial to the preservation of river well-being [1,2]. Different ecosystem services are also provided by riparian systems, at different spatial scales [3]. These highly dynamic ecosystems are driven by environmental factors and human disturbance that shape their structural and compositional attributes [4,5]. In particular, land use land cover (LULC) pressure, such as urban and agricultural intensification within the vicinity, has been pointed out as the main cause of riparian ecological degradation in the Mediterranean region [6,7,8,9]. Therefore, the monitoring and management of riparian areas are increasingly important [3]. A key component of any riparian monitoring and management program, whether for habitat preservation or restoration, is the assessment of their ecological health and/or integrity. Ecological integrity implies the capacity to support and maintain a balanced, integrated and adaptive biological system whereas ecological health also includes the notion of what society values in the ecosystem [10,11,12].
There is an urgent need to develop methodologies for evaluating riparian ecological health from a multiple and integrated perspective. Most of the methods are based on physical aspects (e.g., channel and riverbank alterations), vegetation composition (e.g., exotic vs. native species) or structural indicators (e.g., vegetation cover, width, connectivity) [13,14,15,16], lacking a biological-based assessment [17].
Ants meet all the requirements for a good bioindicator [18,19,20]. They are ubiquitous and highly diverse insects, dominating in numbers and biomass many ecosystems, including riparian habitats [18,19,21,22], and relatively easy to collect and to identify [19]. With colonial and stationary nesting habitats, ants can be resampled over time, without destroying their colonies [19]. They are active most of the year, with less seasonal occurrence than other insects [23]. Ants are sensitive to environmental alterations (e.g., in face of disturbance, they might reflect diversity loss, shifts in species composition and changes in interspecific and intraspecific interactions) [19,24,25,26], and contribute to ecosystem functioning, by being involved in many services, such as soil decomposition, nutrient cycling, seed dispersal, and establishing multitrophic interactions [27,28,29]. In addition, the diversity of ants is correlated with the diversity of other organisms (e.g., butterflies, beetles), making them potentially useful as biodiversity surrogates [30,31,32]. In this regard, ants have a long history of environmental monitoring [33]. They have been extensively used in terrestrial ecosystems as indicators of ecological change in land-use management [33,34], soil function [35], soil quality [36], ecosystem processes [37], agroecosystem conditions [38], restoration success [33,39,40] and habitat disturbance [41]. Furthermore, ants were recently pointed out as a good indicator of the conservation status of riparian forests of the Guadalquivir river, Spain [26]. They are influenced by a more complex suite of environmental variables, for instance than plants, and for a highly dynamic and vulnerable ecosystem, as the riparian corridors, ant metrics may be favorably sensitive to acute impacts of short-term events [12,42].
Multimetric indices (MMIs) have become a common tool for assessing ecosystem health worldwide [43,44,45]. They were developed for interpreting biological data and providing integrative assessments of biological assemblages [46]. For aquatic environments, the first MMI, called the Index of Biological Integrity, was developed in the United States using fish communities [47]. It uses biological metrics, such as the number of sensitive taxa present or relative proportion of functional groups, to formulate an overall score for a site, concerning reference conditions [12]. Developing an effective biological indicator for evaluating the impacts of human activities on riparian corridors has been the focus of scientists and managers. Fish and macroinvertebrates are most commonly used for freshwater ecosystems, while plants and birds are usually used for wetland and riparian bioassessments [46,48]. However, birds are seasonal in their occurrence, creating spatial and temporal variability; and riparian vegetation is stationary, demanding long recovery times for some species, following disturbance [46]. There have been some efforts to use arthropods as bioindicators of the riparian condition, including dragonflies [49], butterflies [50], hoverflies [51] and dung beetles [52]. In general, arthropods are highly specialized and therefore sensitive, have short generation times, rapid responses to disturbance and their ecology is usually well understood [46]. Nevertheless, the mentioned insect groups lack important traits that are found in ants.
As far as we know, no ant index has been developed to assess the ecological health of riparian corridors. Here we suggest the use of an ant-based MMI with that purpose. The presence of vulnerable species, with low population density and specific habitat requirements, are usually bioindicators of low disturbance. On the other hand, opportunist species typically respond positively to disturbance [53]. Ant species are often classified into functional groups (FG), transcending taxonomic boundaries, therefore reducing the apparent complexity of ecological systems and allowing comparisons between communities [54,55]. Despite their global-scale responses to environmental stress and disturbance, classifications should be established for specific regions, and caution must be taken in extrapolating the results to a global scale [54,56]. Behavioral (e.g., generalists, opportunists, specialist predators) and ecological criteria (e.g., cold-climate specialists, hot-climate specialists, cryptic and invasive species) were proposed by Roig and Espadaler [55] to define ant’s FG for the Iberian Peninsula. cryptic species and specialist predators have highly specialized requirements that make them especially sensitive to disturbance, while opportunists and generalists are broadly adapted species with wide habitat tolerances [57].
In the present study, carried out in Catalonian riparian corridors, we aimed at assessing the use of ants as a MMI in riparian systems. The objective is to provide a biological assessment using an ant-based MMI sensitive to anthropogenic disturbances in riparian systems, for monitoring, conservation and restoration purposes. At the same time, clarifying the extent to which metrics based on ant responses provide useful information that cannot be provided by traditional physical and structural indicators.
2. Materials and Methods
The methodological approach consisted of four steps. First, we identified the river typology of the sampling sites. Second, we assessed the pressure gradient for each river type. Third, we developed the ant-based MMI. Finally, we compared the results obtained by the new ant-based index with those of a traditional physical and structural index.
2.1. Study Area and Sampling Design
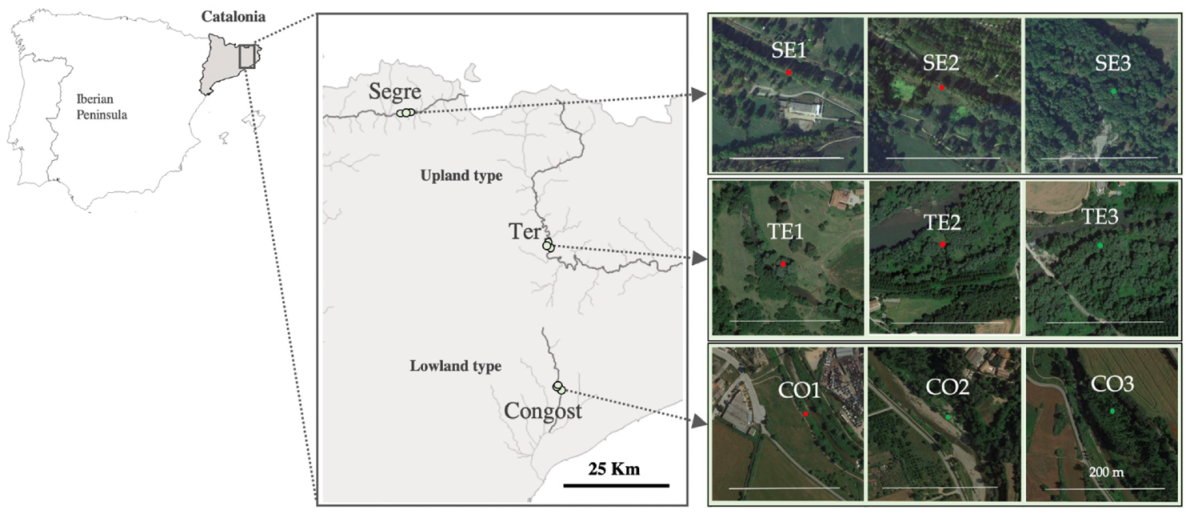
The study was carried out in three riparian corridors (Segre, Ter and Congost) located in Catalonia (NE Iberian Peninsula) (Figure 1). Segre, within the Ebre basin, is a Pyrenean river with a very extensive alluvial plain surrounded by pastures and forests. Segre was sampled on the Cerdanya region, in Prullans municipality, characterized by an Eastern Pyrenean Mediterranean climate [58]. The mean annual rainfall ranges between 600 mm and 1200 mm, while the mean annual temperature varies between 6 °C and 20 °C. The altitude ranges from 500 to 3000 m a.s.l. Mediterranean and Submediterranean vegetation is found along the Segre river and the slopes until 1600 m, with different oak (Quercus ilex L., Q. faginea Lam., Q. pubescens Willd.) and pine (Pinus sylvestris L.) forests. Above 1600 m, Subalpine vegetation occurs, mainly Abies alba Mill. and P. uncinata (Raymond ex A.DC.) forests. Finally, above 2300 m, only Alpine vegetation is found, treeless and mainly composed of boreal-like meadows [59]. About a third of the area, predominantly located in the mountains, is protected by the Natura 2000 network, with only small patches and river stretches protected on the plain. The forested habitats are vast and largely unfragmented, while most of the population and infrastructures are concentrated on the plain [60]. It is a very important representation of a typical Pyrenean alder forest with Circaea lutetiana (L.) Georgi in an excellent state of conservation. Despite some level of fragmentation, it still, maintain spatial continuity [59]. Ter is a Pyrenean river, strongly hydrologically regulated, surrounded by crop fields with intensive livestock farms, forests, urban areas and some industries. Ter was sampled in the Osona region, in Torelló and les Masies de Voltregà municipalities, characterized by a humid continental Mediterranean climate [58]. The mean annual precipitation range between 700 and 800 mm. The mean annual temperature varies between 4 °C and 21 °C. The altitude ranges from 500 m to 1246 m a.s.l. in Osona region and up to 2910 m in Ripollès region. Submediterranean vegetation is found along the Ter river and the slopes until 1600 m, with different oak (Q. ilex, Q. pubescens) and pine (P. sylvestris) forests [59]. The forested habitats are largely unfragmented and specially located on the slopes, while the population and infrastructures are concentrated on the plain. Riparian forests include alder woodlands in regression, with a predominance of willow trees (Salix alba L.). Congost, within the Besòs basin, is a Mediterranean river, surrounded by fields, forests, urban areas and industries. Congost was sampled on the Vallès Oriental region, in La Garriga municipality, characterized by a Central Pre-coastal Mediterranean climate [58]. The mean annual precipitation is 600 mm while the mean annual temperature varies between 3 °C and 20 °C. The altitude ranges from 250 m to 1712 m a.s.l.. Mediterranean vegetation is found along the Congost river, with different oak (Q. ilex, Q. pubescens) and pine (P. halepensis Mill.) forests. The riparian vegetation is dominated by common reed (Phragmites australis (Cav.) Trin. ex Steud.) mixed with more degraded areas based on nitrophilous and exotic species, either of giant reed (Arundo donax L.), either from urban plantations (plane trees, poplars or garden conifers) [59].
Nine sampling sites were selected to capture a gradient of riparian quality in each of the three riparian corridors, according to previous studies conducted in the region (Life Alnus project (LIFE16 NAT/ES/000768), available at: https://lifealnus.eu/en/(accessed on 27 April 2021)) (Figure 1).
2.2. Ant Sampling
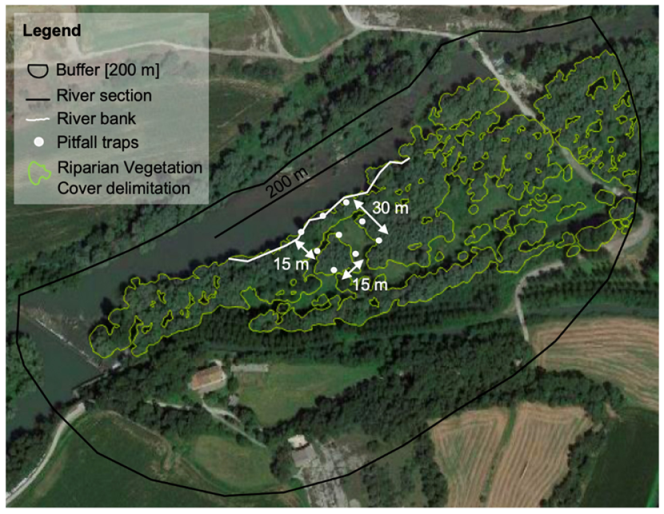
Ants were surveyed, using pitfall traps. This sampling method has been used in many studies of ant communities worldwide (e.g., [61,62,63]). It is a simple, cost-effective method for collecting epigeic ants, providing good results in assessing foraging activity, species richness and composition patterns, and allowing for continuous day and night sampling [20,64,65,66]. The sampling design consisted of 81 pitfalls traps, i.e., nine pitfall traps in each of the nine riparian sites, distributed equally in three transects of 30 m length each, located parallel to the river, 15 m apart from each other (Figure 2). Pitfall traps consisted of 100 mL plastic containers placed flush with the ground, and partially filled with a solution of 30% propylene glycol and a few drops of detergent, to retain and preserve the intercepted ants. Traps were left in the field for approximately 48 h. The sampling period lasted from 17th until 28th of September 2018. The collected specimens were preserved in 96% ethanol, and identified to species level, using regional taxonomic keys [67,68,69]. Specimens of Myrmica spp. and Temnothorax spp. were kindly identified by Xavier Espadaler.
2.3. Identification of River Typology
To analyze the distinctiveness of the rivers we performed K-means clustering in SPSS, using a set of six environmental variables considered relevant to characterize the main environmental background and the position on the river system (Table 1). The K-means cluster is a method commonly used for automatically partitioning data sets into k groups [70]. We selected the F value (like in the analysis of variance) to maximize the significance of differences between the groups [70]. Strahler number and upstream drainage basin were calculated using the Catchment Characterization Model (CCM2) database layer [71]. The Strahler number refers to the stream order of the river networks, i.e., the stream size based on a hierarchy of tributaries [72,73]. Altitude, average annual temperature and rainfall (from the years 2007–2016) were obtained from the Meteorological Service of Catalonia [58]. Valley confinement can be broadly classified as confined or unconfined and describes the degree to which bounding topographic features limit the lateral extent of the valley floor along a river [74]. This variable was derived in ArcGIS version 10.7.1, raster toolbox, by computing the difference between the elevation layer [Digital elevation models (DEM) with 25 m resolution; available at: http://land.copernicus.eu (accessed on 19 December 2019) and a low pass filter applied on the DEM, around the grid cell using a moving window of 7 × 7. The average of the difference was computed for each site, using the pixels included in a 200 m buffer area. The more negative the values, the greater the level of confinement.
Two river types were identified: (1) the upland, comprising mountainous river stretches characterized by higher altitude and larger upstream drainage area; and (2) the lowland, including river segments located in open-floodplain valleys characterized by higher mean annual air temperature (Table 1, Table S1).
2.4. Assessment of the Pressure Gradient in Each River Type
Two sets of variables (riparian and proximal LULC) were selected to describe the pressure gradient and to identify the less disturbed sites for each river type (Figure 3, Table S2). Riparian and proximal land use are recognized as relevant drivers of local ecological quality changes [45]. Riparian and proximal LULC data, termed hereafter as stressor variables, were assessed using an image-based approach, supported by a Geographic Information System (GIS). The stressor variables were analyzed on the same riverbank where the ant sampling was carried out, as the variables measured are intended to characterize the local degree of disturbance [8,9]. As such, a 200 m half-size buffer was delimited according to Figure 2, and the stressor variables were extracted inside the buffer. All the variables were computed as relative measures (percentages) to allow the comparison of the pressure level among sites. The riparian variables (riparian vegetation cover and average width of riparian cover) were obtained by first manually delimiting the riparian zone in each site, using the high spatial resolution layer from Google Earth imagery. We considered the riparian zone as the area from the edge of the riverbank to the externally visible line of the canopy where an abrupt change in vegetation height, type and abundance occurs [8,75] or whenever these changes were less visible to the adjoining human land use [42]. The riparian zone was digitalized on the bank where the ants were sampled, along a 200 m long river section, using the geographic coordinates of ant surveys as central points (Figure 2). For each site, polygons of homogenous riparian woody patches, including trees and tall shrubs, were manually delineated. Riparian vegetation cover was assessed in the percentage of area occupied in each site, concerning the half-size buffer area. As for the average width of the riparian cover, we measured the lateral width of the riparian woody patches in three-line perpendicular measures, along with the whole riparian vegetation cover extension. The proximal LULC data were obtained also by image classification of the high spatial resolution layer from Google Earth imagery, in the floodplain area surrounding each site, by adopting the Copernicus Potential Riparian Zone (PRZ) layer from the European Copernicus Land Monitoring Service (available at https://land.copernicus.eu/local/riparian-zones (accessed on 26 November 2019)). This layer represents the water-influenced area in a river floodplain system [76]. LULC patches were mapped and classified into three classes: Urban (impervious areas); Cropland and intensive grassland (intensive pastures, heterogeneous agricultural areas, irrigated crops); and Shrublands and natural woodlands (sparsely vegetated areas, sclerophyllous vegetation, natural or semi-natural transition woodlands-scrublands or planted woodlands non-managed, mixed forests with deciduous oaks). Proximal LULC data were evaluated in the percentage of area occupied, by each land-use class, in each site, concerning the half-size buffer area (Figure 2). A K-means clustering analysis [70] was then performed using the five stressors (Figure 3, Tables S3 and S4), allowing the identification of disturbed and less disturbed sites, and the determination of the main stressors for each river type.
Two disturbance groups were separated in each river type, based on the stressor variables: (1) Disturbed; and (2) Less disturbed, the latter characterized by higher riparian vegetation cover and larger width of riparian cover (Figure 3, Tables S3 and S4). Both disturbed sites, in the upland and lowland river types, exhibited a higher proportion of urban areas and intensive croplands and lower areas of natural shrub-woodlands, when compared with the less disturbed sites (Figure 3).
2.5. Development of the Ant-Based Multimetric Index
For the development of the ant-based MMI, we adapted the ‘Ecological Quality Ratio’ (EQR) proposed in the Water Framework Directive (WFD) [77] and used by Umetsu et al. [45]. Metrics should represent the composition, structure, and function of a biological assemblage [43,47]. As such, in the following step, we identified the functional and compositional metrics derived from ant assemblage. Ant species are described by distinct life-history traits (e.g., behavioral dominance, main food resources, daily activity rhythm) and consequently display distinct responses (e.g., abundance, species richness) to natural and anthropogenic disturbances [78]. Based on the literature [55,69,79,80,81,82,83,84,85,86,87,88,89], we defined functional traits (Table S5), and calculated the proportion of each functional trait, observed species richness (number of species per pitfall) and ant foraging activity (number of workers per pitfall), resulting in 42 potential metrics (Table S6). To avoid redundant metrics, we used Pearson’s correlation test among highly correlated metrics (r > 0.80, p < 0.001), and we kept the one with more uniform frequency distributions [90]. Only those metrics that best meet the criteria to respond clearly to anthropogenic disturbance were used to build the ant-based MMI, i.e., metrics were considered core metrics to include the index if both significant differences between disturbance groups, using Mann–Whitney U Test, were observed and collinearity issues were solved.
After this selection, we established the thresholds of ecological quality. We first transformed the core metrics into scores as follows: 1 Poor; 3 Fair; and 5 Good quality. The “good-fair” and “poor-fair” boundaries were defined by the average of less disturbed and disturbed core metric values per pitfall, respectively. The ant-based MMI was obtained from subtracting the total number of core metrics (n) included in the index by the sum of their scores (si), as seen in (1):
Ant-based MMI = n−Σ si; i = 1, ..., n
Then, we followed the classification approach of the WFD [77] by dividing the gradient obtained into five classes and transformed the index absolute values in Ecological Quality Ratios (EQR), as seen in (2):
where n is the number of metrics and md is the median value of the ant-based MMI less disturbed. The EQR is expressed as a numerical value between 0 and 1, corresponding to poor and good ecological status, respectively. We used five ecological quality classes: 1 Excellent; 2 Good; 3 Moderate; 4 Poor; and 5 Bad. The reference value of the excellent/Good boundary was determined as the median value of the EQR less disturbed. The boundary-value of the remaining classes of ecological quality was obtained by dividing equally the interval limited by the excellent/Good boundary and the lower extreme of the gradient.
EQR = [Ant-based MMI * (−1)−n]/md
2.6. Comparing the Ant-Based Index with a Traditional Physical and Structural-Based Index
We compared the EQR of the Ant-based MMI with a traditional physical and structural-based index widely used to assess the riparian forest quality the ‘Qualitat del Bosc de Ribera’ (QBR) index [14,91,92,93,94]. The QBR is based on four components of the riparian habitat: total riparian vegetation cover, cover structure, cover quality and channel alterations. It also takes into account differences in the geomorphology of the river from its headwaters to the lower reaches. The index score varies between 0 and 100 points and is composed of five quality classes. The QBR surveys were conducted in the field for each sampling site following the protocol of Munné et al. [14], simultaneously with the ant sampling.
3. Results
3.1. Ant Community
In total, 2268 individuals comprising 22 ant species, 13 genera, and four subfamilies were identified in the study area (Table S7). About one third of the ant species registered were Formicinae and more than half belong to Myrmicinae. The most frequently recorded species were Myrmica rubra (L.), Lasius niger (L.) and Aphaenogaster senilis Mayr (Table S7). All species are native. Twelve species were found in the upland river type, ten in disturbed sites and four in the less disturbed sites, while 14 species were found in the lowland type, five in the disturbed sites and 12 in the less disturbed sites (Table S7).
3.2. Functional and Compositional Metrics Response to Disturbance Gradient
From the 42 potential metrics (Table S6), and after collinearity analysis, six metrics showed significant differences between disturbed and less disturbed in the upland river type, while three metrics allowed the separation between disturbed and less disturbed in the lowland river type (Table 2).
The upland less disturbed sites had a significantly higher observed species richness (average number of species per pitfall), closed-habitat species, Larger ants, Cryptics, while disturbed sites had more opportunist species and higher Tetramorium caespitum (L.) foraging activity (Table 2). Lowland disturbed sites showed significantly higher ant foraging activity, seed harvesters and higher A. senilis foraging activity (Table 2).
3.3. Multimetric Ant Index for the Assessment of Ecological Health of Riparian Systems in the Upland and Lowland River Types of Catalonia
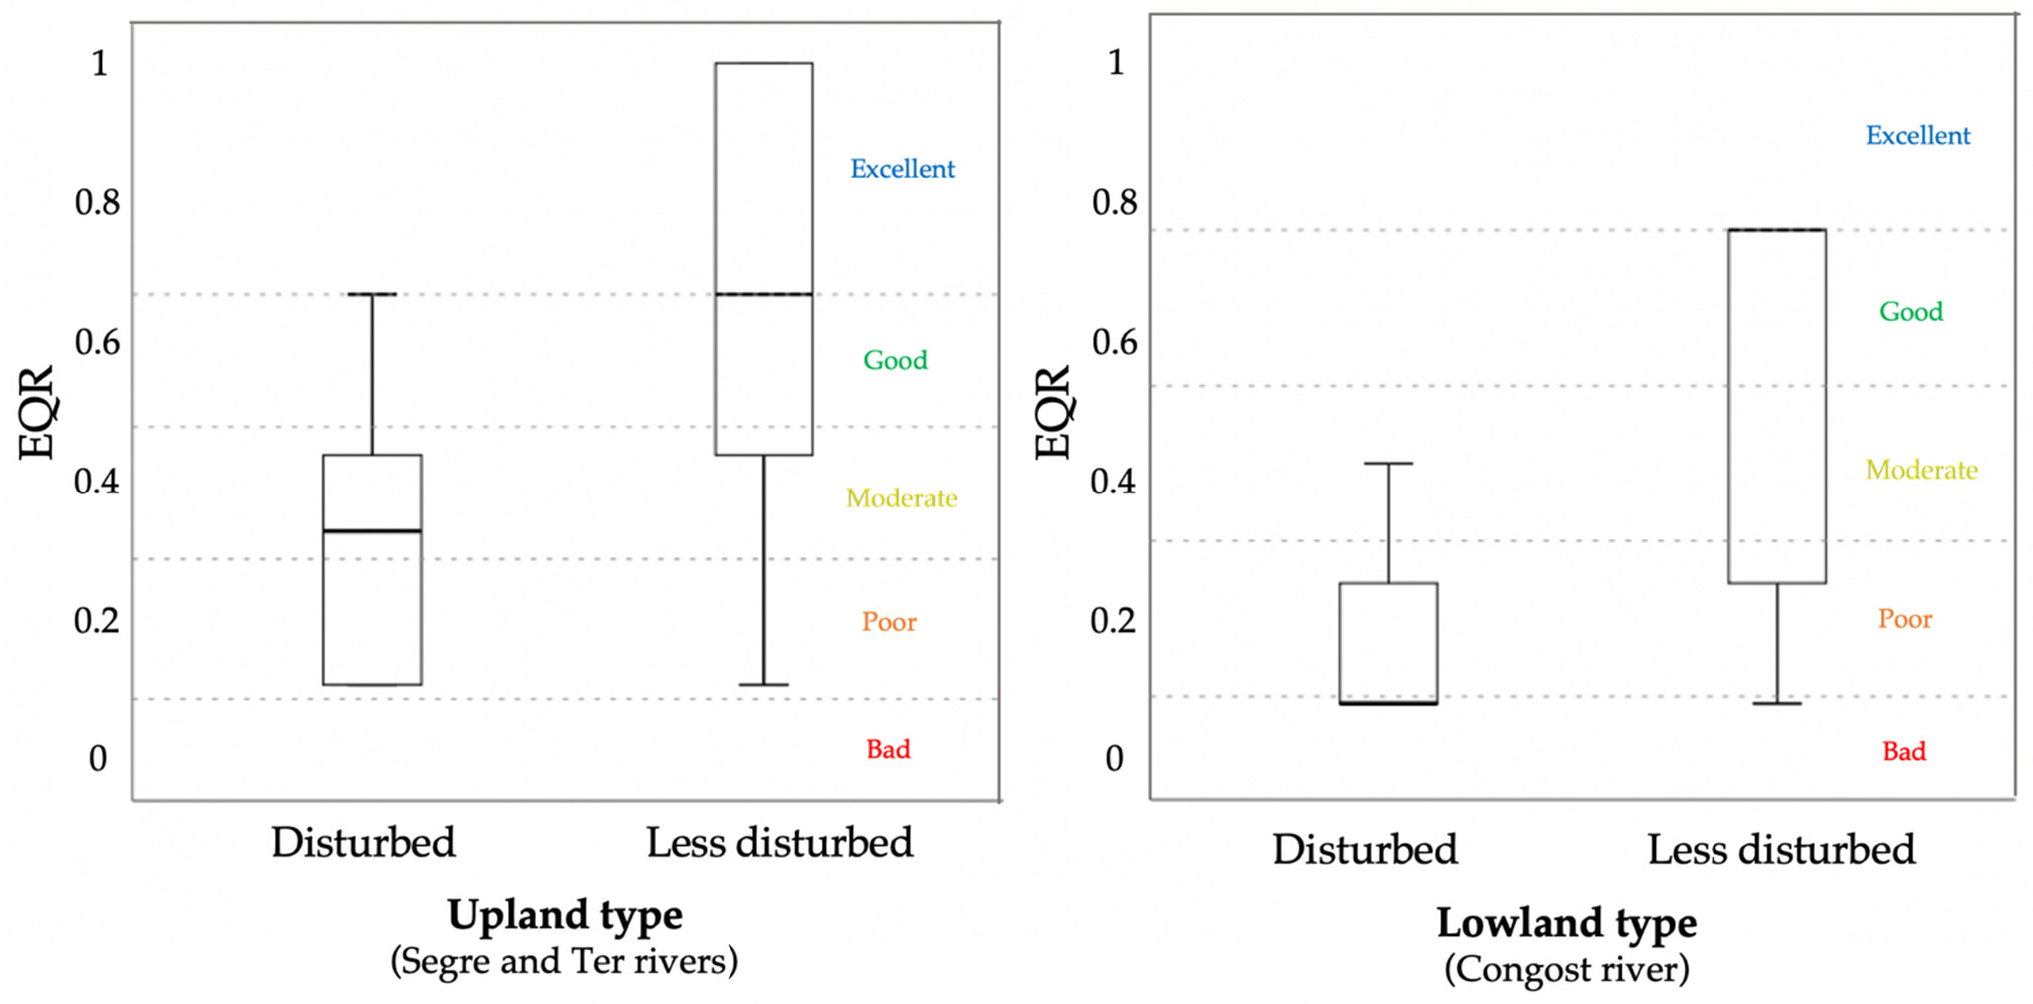
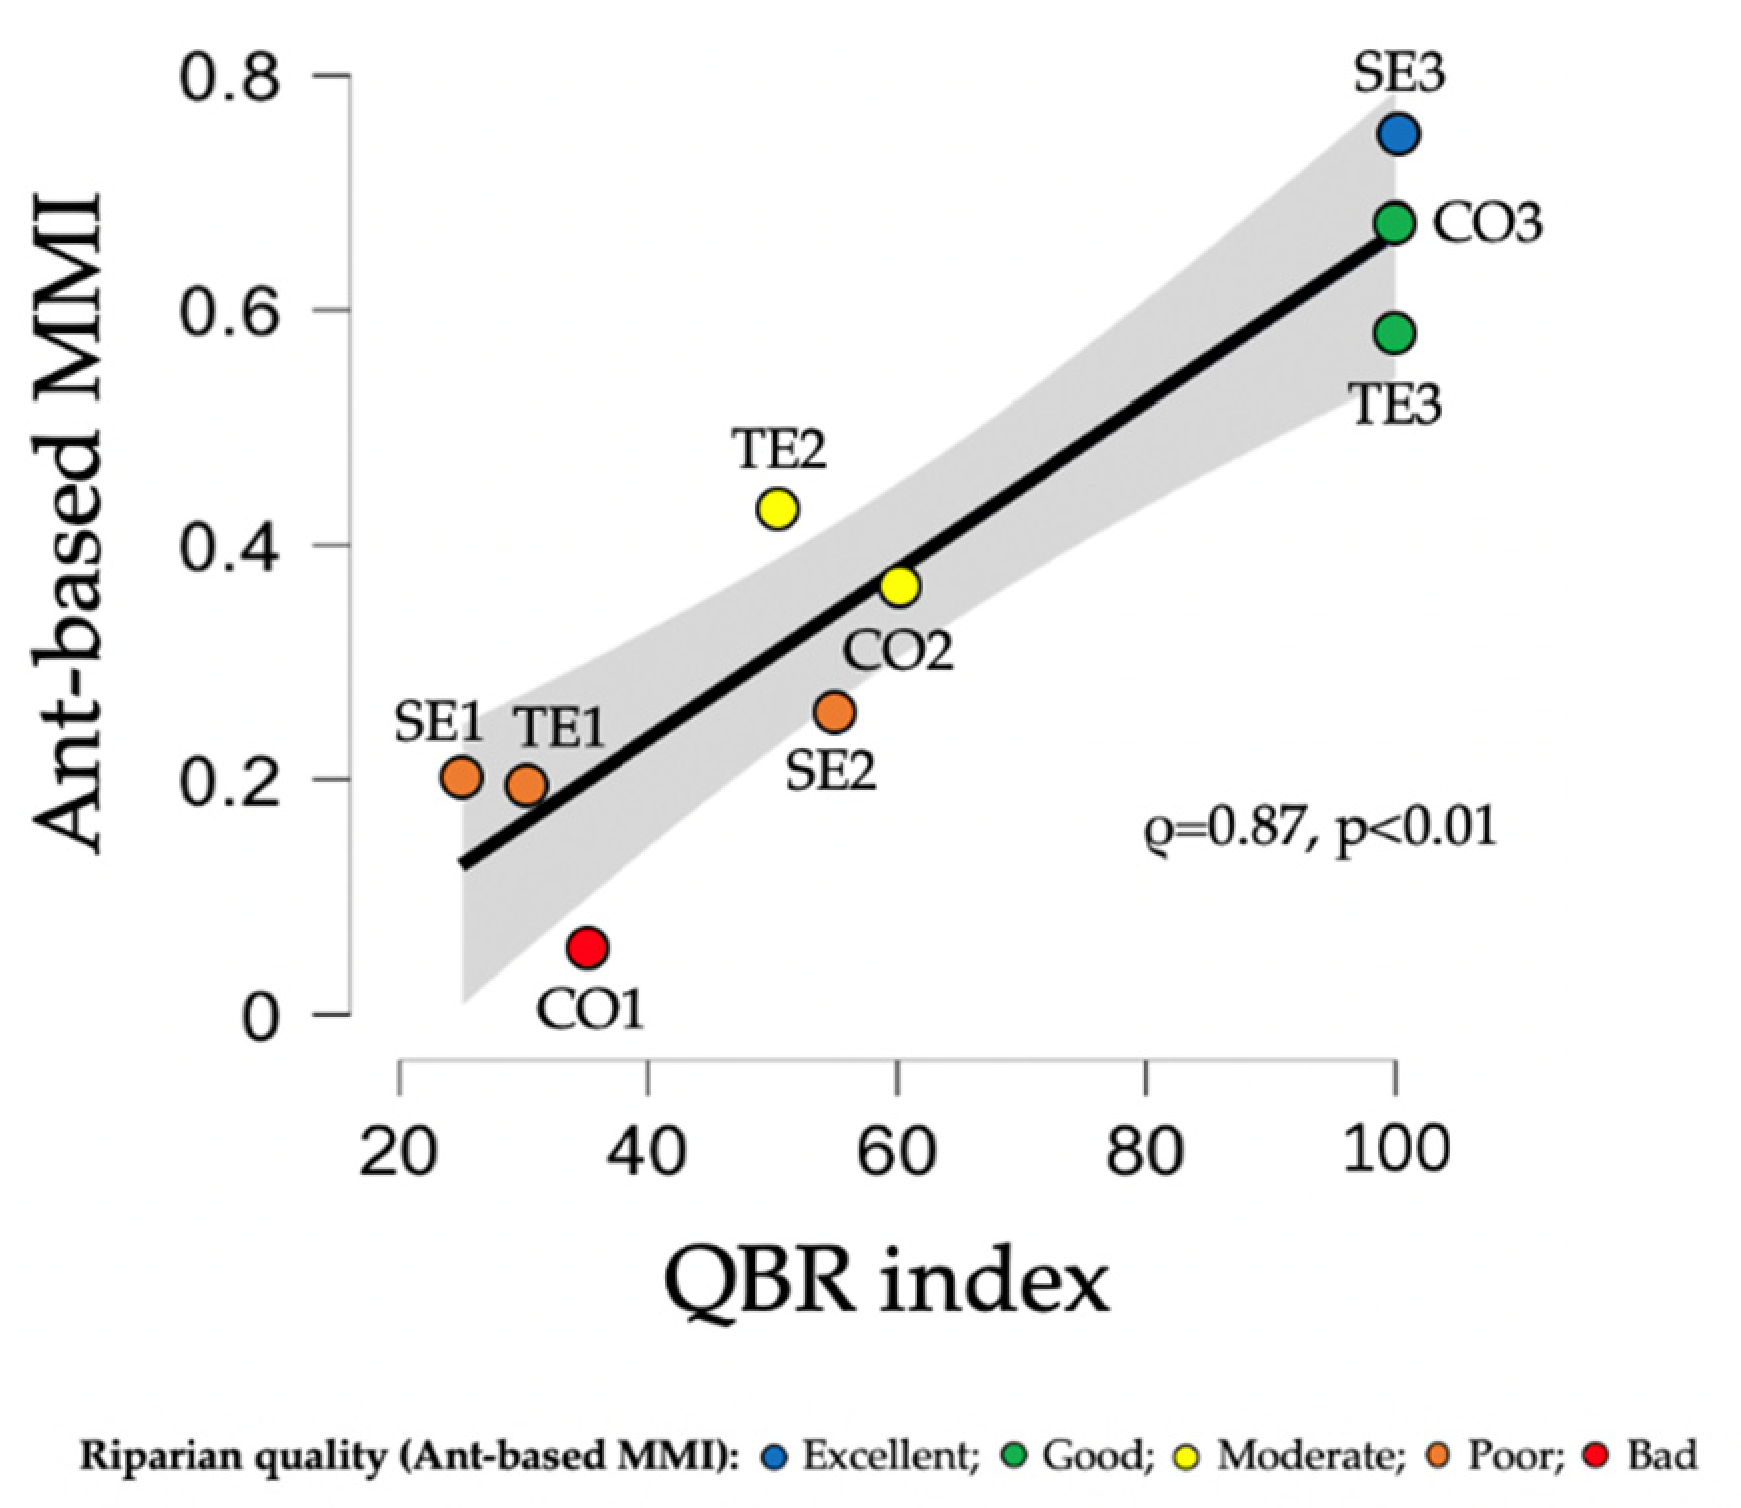
We derived a scoring system for the ant-based MMI, based on the upland and lowland river type core metrics and compute the index for the overall dataset. According to the results obtained, the index showed a good discriminatory efficiency of EQR between disturbed and less disturbed, for both the upland and lowland river types (Table 3, Figure 4). For the upland river type, we used five core metrics, namely observed species richness, closed-habitat species, Larger ants, Cryptics, Opportunists and T. caespitum foraging activity. For the lowland type, we used ant foraging activity, seed harvesters and A. senilis foraging activity. We found a strong and significant correlation between the QBR index and the ant-based MMI (Spearman’s correlation = 0.87, p < 0.01) (Figure 5). Nevertheless, the ant-based MMI matched the same ecological class of the QBR’s in 33% of the sites. It showed lower and higher quality classification in 44% and 22% of the sites, respectively (Table 4).
4. Discussion
Ants are key organisms to be used in monitoring and assessment studies of terrestrial ecosystems [19,34,95,96]. However, their potential in riparian ecosystems remains largely unexplored and only one study is known on the Iberian Peninsula [26]. With this work, we have shown that ants can be equally powerful in floodplain areas and interface ecosystems, such as the riparian corridors. This corroborates the study conducted in riparian forests of the Guadalquivir river, Spain [26]. Ant communities responded strongly to human disturbance, either individually or in functional traits. More interestingly, our study represents the first approach to provide an ant-based assessment tool to evaluate and monitor the ecological health of riparian corridors. The creation of a tool based on biological indicators is of utmost importance as we lack guidelines and legislation on how to monitor and evaluate these ecosystems. Below, we focused our discussion on the practical application of using ants for the assessment of riparian corridors, and on the learnings from this preliminary approach in Catalonia.
4.1. Ant Community, Metrics and Response to Disturbance Gradient
Species composition is a useful indicator of habitat integrity [57,96]. Clear shifts in species composition usually happen when disturbance-tolerant species replace disturbance-sensitive species, often with little or no loss of total species richness [25]. In this study, we assessed not only ant species composition but also functional traits responses to human disturbance. We showed that several ant metrics can be useful indicators of human disturbance in the Catalonian riparian corridors, as shown by the significant differences between disturbance groups.
Our study revealed interesting differences in the metric compositional response to a disturbance between river types. In particular, we identified two disturbance-tolerant species, represented by T. caespitum in the upland type, and by A. senilis in the lowland type. These are species typically found in anthropized environments, open-exposed areas, meadows and wastelands [69]. Tetramorium caespitum showed a similar trend in a previous study; however, authors highlighted the generalist nature of this species and minimized its role as a disturbance indicator [26]. On the other hand, two species revealed to be sensitive to disturbance, namely M. rubra and Temnothorax nylanderi (Förster). These are forest-adapted species, usually found in humid-closed environments depending on specific niches and microhabitats such as cavities in live branches or dead wood for nesting sites [69]. Other Myrmica and Temnothorax species have been also noticed as indicators of good integrity [26].
Our results showed an association of disturbed sites with more opportunists and less cryptic species in the upland type and more seed harvesters in the lowland type. It seems that habitat openness is a key driver of variation in ant communities [35]; species that prefer open habitats, such as hot-climate specialists (including seed harvesters) and Opportunists are often favored by disturbance whereas species usually favored by closed habitats such as cryptic species, cold-climate specialists and many specialist predators tend to occur in undisturbed sites. Additionally, arid-adapted species tend to be more resilient to disturbance in drier areas [25,97]. Seed harvesters usually select unvegetated patches for their nests [18]. They collect seeds of annual, perennial grasses and herbaceous plants which typically occur in Mediterranean disturbed areas. Therefore, riparian corridors of bad/poor conditions with an increased cover of bare soil may offer better resources for seed harvesters than the ones in good conditions. Messor barbarus (L.), a well-known seed harvester was negatively associated with tree cover and only found in non-flooding areas of riparian forests in the Guadalquivir river [21]. On the other hand, riparian corridors of good/excellent conditions with a vegetated forest and abundance of microhabitats will favor arboreal, cryptic and closed-habitat species [78]. The presence of the arboreal Dolichoderus quadripunctatus (L.) in a disturbed site of lowland type in our work is suggestive of at least a tree-shaded microhabitat in that particular site [98]. Larger ants were found in a higher proportion in the less disturbed sites of the upland type. There is evidence that ant assemblages have larger individuals in cold environments [99] and small-sized species are mostly associated with dry areas with low tree cover, such as Pheidole pallidula (Nyl.) [78]. Taxa with contrasting openness preferences often have contrasting geographical distributions, with closed-habitat specialists restricted to regions of higher rainfall and Open-habitat specialists extending to more arid regions [25].
High species richness is frequently associated with high ecological quality [100]. This was true for the upland type. Even though disturbed sites of the upland type presented more species than less disturbed sites, the observed species richness, i.e., the average number of species per pitfall, was higher in the less disturbed sites. However, in some situations, richness may not be a useful indicator of habitat integrity [26,101]. High numbers of ant species can be observed in anthropic, degraded habitats frequently colonized by opportunist and exotic species. This fact could probably explain why observed species richness was not a good metric to use in the index development in the lowland type.
All species in our study were native, even in disturbed areas despite the association between human disturbance and exotic species [101].
4.2. Ant-Based MMI for Riparian Systems
From the analysis of the core ant metrics, we derived an ant-based MMI for the upland and lowland river types of Catalonia. Good discriminatory efficiency of EQR between disturbed and less disturbed sites was achieved for both river types. Overall, according to ant communities, these results suggest a better condition of the riparian corridors in the upland type, compared to the lowland type. The differences of LULC in what concern the urban area surrounding the sampling sites between the two river types may support these findings since the lowland type has a significantly larger area of urban activities. The faunistic composition of each area is closely related to human disturbance which in turn acts indirectly through changes in the structure and complexity of vegetation, food resources, competitive interactions, the flood regime and habitat openness [21,25,26,102].
Results on the comparison with the QBR field surveys showed a significantly strong correlation between QBR and the ant-based MMI (ρ = 87; p < 0.01). These indices agreed on the same ecological class in 33% of the sampling sites. Jiménez-Carmona et al. [26] also found a significant correlation between the conservation state of riverbank forests, measured through the QBR index, and ant diversity. Nevertheless, the ant-based MMI showed a more conservative quality classification in 44% of the sites. According to the QBR index, a riparian habitat with a score higher than 95% is classified as in natural condition, regardless of whether it is embedded in an urban, agricultural or forest matrix. It is widely known the relevance of the surrounding LULC effects in the ecological quality of riparian areas [8,9]. Ant communities may reflect the surrounding landscape influence and can give a more functional and reliable assessment approach of the ecological status of the site, instead of being overestimated by the strictly physical approach. For instance, two less disturbed sites in the upland (SE3, TE3) and one in the lowland (CO3) were classified in excellent conditions, based on the QBR index, but regarding the ant communities, only the one surrounded by a higher canopy cover and with less urban impact (CO3) showed to be in excellent conditions.
4.3. Drawbacks and Strengths of the Method
Bioindicators have worldwide applicability reliant on the availability and accuracy of biological data. However, caution must be taken when transposing the results to other regions. In particular, we highlight the need to establish the referential for ant communities (e.g., FG) according to different river typologies. In this study, we analyzed two river types (lowland and upland) in the Catalonia region. The ant-based MMI should be applied in similar systems since biogeographic and climatic differences are likely to promote distinct ant species and life traits responses.
Although we found a strong ant communities’ response to human disturbance, more studies are needed to include a wider human-stressor gradient. In this study, we considered proximal land use and riparian structural data (vegetation cover and width) to classify the level of disturbance of a site. The inclusion of other variables, such as the management practices in the riparian corridors [26,103], the introduction of invasive species [104], and the application of agrochemicals in surrounding agricultural areas [38,105,106] will probably enlarge the gradient of human disturbance and reduce the gap between the “moderate” and “good/excellent” sites observed in the study.
The riparian structural data used in this study have been proven to be a good proxy of the human disturbance in riparian ecosystems [8], with the advantage of being easily evaluated, with high spatial accuracy using simple remote sensing methods. Nevertheless, aspects related to the floristic composition should also be included to improve the disturbance classification accuracy. Ants also appear to respond to floristic aspects, especially those related to the dominance of exotic plants [107,108].
Another aspect concerns the temporal coverage of the study that addressed one discrete time of the year. A wider temporal and geographic sampling effort are likely to identify stronger relations between functional and compositional aspects of ant’s communities and the disturbance level, in each river type. Additionally, comparing species richness among ecological communities, at different sites, has long been recognized as an important task, such as sample-based rarefaction curves [109,110]. Nevertheless, it was not our aim to obtain an exhaustive inventory of the sites, but rather to use a measure of ant diversity with a set of other measures in developing the multimetric index.
Future work should include small-scale habitat characteristics, such as metrics related to the configuration and connectivity of the riparian vegetation. There is soundproof that the riparian shape configuration and the level of fragmentation among riparian patches are also important predictors of ant species diversity [111] and riverine landscape pattern can strongly influence ants’ trophic dynamics [112].
The results indicate that human disturbance has led to an increased urban LULC, reduced vegetation cover and a smaller width of riparian cover in riparian corridors of Catalonia, leading to significant differences in ant species composition. These stressors likely make disturbance-tolerant species inhabiting disturbed habitats and disturbance-sensitive species vulnerable to extinction. Thus, in addition to the documented loss of microhabitats in human-disturbed Mediterranean habitats [113], we demonstrated the direct effect of the disturbance that may promote vulnerability of local populations. That emphasizes the importance of riparian corridors protection and provides a further argument for their comprehensive restoration.
5. Conclusions
The ant-based MMI showed to be more sensitive to human disturbance than traditional physical and structural-based methods, such as the QBR index. However, we do not recommend ant metrics to substitute the traditional metrics, as no single indicator can be expected to measure everything about the ecological health of an area. We believe that an integrated approach, considering both physical/structural and functional aspects can give a more reliable and inclusive evaluation of the riparian ecological health.
Supplementary Materials
The following are available online at https://0-www-mdpi-com.brum.beds.ac.uk/article/10.3390/f12050625/s1, Table S1. Output of K-means clustering analysis of the Upland and Lowland river types based on the environmental variables performed in SPSS., Table S2. Data on the Stressor variables for each sampling site surveyed in the study according to different disturbance groups, rivers and river types., Table S3. Output of K-means clustering analysis of the Disturbed and Less disturbed sites of Upland type based on the pressure variables (stressors) performed in SPSS., Table S4. Output of K-means clustering analysis of the Disturbed and Less disturbed sites of Lowland type based on the pressure variables (stressors) performed in SPSS., Table S5. Functional traits used in the study., Table S6. Ant potential metrics tested in the present work., Table S7. Ant species recorded at the Catalonian river basins, with additional information on the overall frequency of occurrence (percentage of pitfalls at a site where a species was detected). The number of sites surveyed are shown.
Author Contributions
Conceptualization, V.Z., J.C.F., M.O., M.T.F. and M.R.F.; methodology, V.Z. and M.O.; formal analysis, V.Z. and M.R.F.; writing—original draft preparation, V.Z.; writing—review and editing, V.Z., J.C.F., M.O., M.T.F. and M.R.F.; supervision, M.R.F., M.O. and J.C.F. All authors have read and agreed to the published version of the manuscript.
Funding
This research was funded by Life Alnus-Restoration, conservation and governance of the alder alluvial forests in the Mediterranean region, LIFE 16NAT/ES/000768 and CEF, a research unit funded by Fundação para a Ciência e a Tecnologia (FCT), Portugal, grant number UIDB/00239/2020. VZ was funded by FCT with a scholarship within the FLUVIO-River Restoration and Management, PD/BD/142882/2018.
Acknowledgments
The authors would like to express their acknowledgments to Marta Jutglar, Maria González, Núria Sellarès, Èlia Bretxa and Laia Jiménez for their assistance in the field sampling; to Francesc Llach for the help in the CERM laboratory; and to Xavier Espadaler for their availability, identification and expert insight on Myrmica spp. and Themnothorax spp. Thanks are also due to three anonymous reviewers for their comments and suggestions to an earlier version of the manuscript, which contributed to improve the text.
Conflicts of Interest
The authors declare no conflict of interest. The funders had no role in the design of the study; in the collection, analyses, or interpretation of data; in the writing of the manuscript, or in the decision to publish the results.
References
- Ward, J.V. The four-dimensional nature of lotic ecosystems. J. N. Am. Benthol. Soc. 1989, 8, 2–8. [Google Scholar] [CrossRef]
- Naiman, R.J.; Décamps, H. The Ecology of Interfaces: Riparian Zones. Annu. Rev. Ecol. Syst. 1997, 28, 621–658. [Google Scholar] [CrossRef] [Green Version]
- Riis, T.; Kelly-Quinn, M.; Aguiar, F.C.; Manolaki, P.; Bruno, D.; Bejarano, M.D.; Clerici, N.; Fernandes, M.R.; Franco, J.C.; Pettit, N.; et al. Global Overview of Ecosystem Services Provided by Riparian Vegetation. BioScience 2020, 70, 501–514. [Google Scholar] [CrossRef]
- Petts, G.E.; Amoros, C. Fluvial Hydrosystems; Chapman and Hall: London, UK, 1996; p. 322. [Google Scholar]
- Naiman, R.J.; Décamps, H.; Pollock, M. The role of riparian corridors in maintaining regional biodiversity. Ecol. Appl. 1993, 3, 209–212. [Google Scholar] [CrossRef]
- Corbacho, C.; Sánchez, J.M.; Costillo, E. Patterns of structural complexity and human disturbance of riparian vegetation in agricultural landscapes of Mediterranean area. Agric. Ecosyst. Environ. 2003, 95, 495–507. [Google Scholar] [CrossRef]
- Von Schiller, D.; Martí, E.; Riera, J.L.; Ribot, M.; Marks, J.C.; Sabater, F. Influence of land use on stream ecosystem function in a Mediterranean catchment. Freshw. Biol. 2008, 53, 2600–2612. [Google Scholar] [CrossRef]
- Fernandes, M.R.; Aguiar, F.C.; Ferreira, M.T. Assessing riparian vegetation structure and the influence of land use using landscape metrics and geostatistical tools. Landsc. Urban. Plan. 2011, 99, 166–177. [Google Scholar] [CrossRef] [Green Version]
- Aguiar, F.C.; Martins, M.J.; Silva, P.C.; Fernandes, M.R. Riverscapes downstream of hydropower dams: Effects of altered flows and historical land-use change. Landsc. Urban. Plan. 2016, 153, 83–98. [Google Scholar] [CrossRef]
- Karr, J.R.; Dudley, D.R. Ecological perspective on water quality goals. Environ. Manag. 1981, 5, 55–68. [Google Scholar] [CrossRef]
- Meyer, J.L. Stream health: Incorporating the human dimension to advance stream ecology. J. N. Am. Benthol. Soc. 1997, 16, 2. [Google Scholar] [CrossRef] [Green Version]
- Innis, S.A.; Naiman, R.J.; Elliott, S.R. Indicators and assessment methods for measuring the ecological integrity of semi-aquatic terrestrial environments. Hydrobiologia 2000, 422, 111–131. [Google Scholar] [CrossRef]
- Raven, P.J.; Fox, P.; Everard, M.; Holmes, N.T.H.; Dawson, F.H. River Habitat Survey: A new system for classifying rivers according to their habitat quality. In Freshwater Quality: Defining the Indefinable? Boon, P.J., Howell, D.L., Eds.; The Stationery Office: Edinburgh, UK, 1997; pp. 215–234. [Google Scholar]
- Munné, A.; Prat, N.; Solà, C.; Bonada, N.; Rieradevall, M. A simple field method for assessing the ecological quality of riparian habitat in rivers and streams: QBR index. Aquat. Conserv. Mar. Freshw. Ecosyst. 2003, 13, 147–163. [Google Scholar] [CrossRef]
- Del Tánago, M.G.; Jalón, D.G. Attributes for assessing the environmental quality of riparian zones. Limnetica 2006, 25, 389–402. [Google Scholar]
- Ollero, A.; Ballarín, D.; Díaz, E.; Mora, D.; Sánchez Fabre, M.; Acín, V.; Echev-Erría, M.T.; Granado, D.; Ibisate, A.L.; Sánchez Gil, L.; et al. Un índice hidrogeomorfológico (IHG) para la evaluación del estado ecológico de sistemas fluviales. Geographicalia 2007, 52, 113–141. [Google Scholar]
- Dziock, F.; Henle, K.; Foeckler, F.; Follner, K.; Scholz, M. Biological indicator systems in floodplains—A Review. Int. Rev. Hydrobiol. 2006, 91, 271–291. [Google Scholar] [CrossRef]
- Hölldobler, B.; Wilson, E.O. The Ants; Harvard University Press: Cambridge, UK, 1990; p. 732. [Google Scholar]
- Alonso, L.E.; Agosti, D. Biodiversity studies, monitoring and ants: An overview. In Standard Methods for Measuring and Monitoring Biodiversity; Agosti, D., Majer, J.D., Alonso, L.E., Schultz, T.R., Eds.; Smithsonian Institution Press: Washington, DC, USA; London, UK, 2000; p. 280. [Google Scholar]
- Underwood, E.C.; Fisher, B.L. The role of ants in conservation monitoring: If. when. and how. Biol. Conserv. 2006, 132, 166–182. [Google Scholar] [CrossRef]
- Ordóñez-Urbano, C.; Reyes-López, J.; Carpintero-Ortega, S. Estudio faunístico de los formícidos (Hymenoptera: Formicidae) asociados a los bosques de ribera en la provincia de Córdoba (España). Primeras aportaciones. Boletín Soc. Entomológica Aragonesa 2007, 40, 367–375. [Google Scholar]
- Glaser, F. Ants (Hymenoptera, Formicidae) in alpine floodplains—Ecological notes and conservation aspects. In Riverine Landscapes—Restoration—Flood Protection—Conservation. Proceedings of the Internationales LIFE-Symposium, Reutte-Breitenwang, Austria, 26–29 September 2005; Füreder, L., Sint, D., Vorauer, A., Eds.; Natur in Tirol. Naturkundliche Beiträge der Abteilung Umweltschutz: Reutte-Breitenwang, Austria, 2007; Volume 13, pp. 147–163. [Google Scholar]
- Dunn, R.R. Managing the tropical landscape: A comparison of the effects of logging and forest conversion to agriculture on ants, birds, and Lepidoptera. For. Ecol. Manag. 2004, 191, 215–224. [Google Scholar] [CrossRef]
- Crist, T.O. Biodiversity, species interactions, and functional roles of ants (Hymenoptera, Formicidae) in fragmented landscapes: A review. Myrmecol. News 2009, 12, 3–13. [Google Scholar]
- Andersen, A.N. Responses of ant communities to disturbance: Five principles for understanding the disturbance dynamics of a globally dominant faunal group. J. Anim. Ecol. 2019, 88, 1–13. [Google Scholar] [CrossRef]
- Jiménez-Carmona, F.; Heredia-Arévalo, A.M.; Reyes-López, J.L. Ants (Hymenoptera: Formicidae) as an indicator group of human environmental impact in the riparian forests of the Guadalquivir river (Andalusia, Spain). Ecol. Indic. 2020, 118, 106–762. [Google Scholar] [CrossRef]
- Folgarait, P.J. Ant biodiversity and its relationship to ecosystem functioning: A review. Biodivers. Conserv. 1998, 7, 1221–1244. [Google Scholar] [CrossRef]
- Paetzold, A.; Sabo, J.; Sadler, J.P.; Findlay, S.E.G.; Tockner, K. Aquatic–Terrestrial Subsidies along River Corridors. In Hydroecology and Ecohydrology: Past, Present and Future; Wood, P.J., Hannah, D.M., Sadler, J.P., Eds.; Wiley & Son, Lda.: Hoboken, NJ, USA, 2008; pp. 57–73. [Google Scholar]
- Del Toro, I.; Ribbons, R.R.; Pelini, S.L. The little things that run the world revisited: A reviwe of ant-mediated ecosystem services and disservices (Hymenoptera: Formicidae. Myrmecol. News 2012, 17, 133–146. [Google Scholar]
- Lawton, J.H.; Bifnell, D.E.; Bolton, B.; Blowmers, G.F.; Eggleton, P.; Hammond, P.M.; Hodda, M.; Holt, R.D.; Larsen, T.B.; Mawdsley, N.A.; et al. Biodiversity inventories, indicator taxa and effects of habitat modification in tropical forest. Nature 1998, 391, 72–76. [Google Scholar] [CrossRef]
- Leal, I.R.; Bieber, A.G.D.; Tabarelli, M.; Andersen, A.N. Biodiversity surrogacy: Indicator taxa as predictors of total species richness in Brazilian Atlantic forest and Caatinga. Biodivers. Conserv. 2010, 19, 3347–3360. [Google Scholar] [CrossRef]
- Jiménez-Carmona, F.; Carpinter, S.; Reyes-López, J.L. Ants (Hymenoptera: Formicidae) as surrogates for epigeic arthropods in Northen Andalusian ‘dehesas’ (Spain). Sociobiology 2020, 67, 201–212. [Google Scholar] [CrossRef]
- Majer, J.D. Ants as bioindicators of minesite rehabilitation land use and land conservation. Environ. Manag. 1983, 7, 375–383. [Google Scholar] [CrossRef]
- Andersen, A.N.; Hoffmann, B.; Müller, W.J.; Griffiths, A. Using ants as bioindicators in land management: Simplifying assessment of ant community responses. J. Appl. Ecol. 2002, 39, 8–17. [Google Scholar] [CrossRef]
- De Bruyn, L.A.L. Ants as bioindicators of soil function in rural environments. Agric. Ecosyst. Environ. 1999, 74, 1–3. [Google Scholar]
- Segat, J.C.; Vasconcellos, R.L.V.; Silva, D.P.; Baretta, D.; Cardoso, E.J.B.N. Ants as indicators of soil quality in an on-going recovery of riparian forests. For. Ecol. Manag. 2017, 404, 338–343. [Google Scholar] [CrossRef]
- Tiede, Y.; Schlautmann, J.; Donoso, D.A.; Wallis, C.I.B.; Bendix, J.; Brandl, R.; Farwig, N. Ants as indicators of environmental change and ecosystem processes. Ecol. Indic. 2017, 83, 527–537. [Google Scholar] [CrossRef]
- Peck, S.L.; Mcquaid, B.; Campbell, C.L. Using ant species (Hymenoptera: Formicidae) as a biological indicator of agroecosystem condition. Environ. Entomol. 1998, 27, 1102–1110. [Google Scholar] [CrossRef] [Green Version]
- Andersen, A.N.; Sparling, G.P. Ants as indicators of restoration success: Relationship with soil microbial biomass in the Australian seasonal tropics. Restor. Ecol. 1997, 5, 109–114. [Google Scholar] [CrossRef]
- Lawes, M.J.; Moore, A.M.; Andersen, A.N.; Preece, N.D.; Franklin, D.C. Ants as ecological indicators of rainforest restoration: Community convergence and the development of an Ant Forest Indicator Index in the Australian wet tropics. Ecol. Evol. 2017, 7, 8442–8455. [Google Scholar] [CrossRef] [Green Version]
- King, J.R.; Andersen, A.N.; Cutter, A.D. Ants as bioindicators of habitat disturbance: Validation of the functional group model for Australia’s humid tropics. Biodivers. Conserv. 1998, 7, 1627–1638. [Google Scholar] [CrossRef]
- Ives, C.D.; Hose, G.C.; Nipperess, D.A.; Taylor, M.P. Environmental and landscape factors influencing ant and plant diversity in a suburban riparian corridors. Landsc. Urban. Plan. 2011, 103, 372–382. [Google Scholar] [CrossRef]
- Hering, D.; Feld, C.K.; Moog, O.; Ofenbock, T. Cookbook for the development of a multimetric index for biological condition of aquatic ecosystems: Experiences from the European AQEM and STAR projects and related initiatives. In The Ecological Status of European Rivers: Evaluation and Intercalibration of Assessment Methods; Furse, M.T., Hering, D., Brabec, K., Buffagni, A., Sandin, L., Verdonschot, P.F.M., Eds.; Hydrobiologia; Springer: Dordrecht, The Netherlands, 2006; Volume 566, pp. 311–324. [Google Scholar]
- Van Oosterhout, M.P.; van der Velde, G. An advanced index of biotic integrity for use in tropical shallow lowland streams in Costa Rica: Fish assemblages as indicators of stream ecosystem health. Ecol. Indic. 2015, 48, 687–698. [Google Scholar] [CrossRef]
- Umetsu, C.A.; Aguiar, F.C.; Ferreira, M.T.; Cancian, L.F.; Camargo, A.F.M. Addressing bioassessment of tropical rivers using macrophytes: The case of Itanhaém Basin, São Paulo, Brazil. Aquat. Bot. 2018, 150, 53–63. [Google Scholar] [CrossRef]
- Ruaro, R.; Gubiani, E.A.; Hughes, R.M.; Mormul, R.P. Global trends and challenges in multimetric indices of biological condition. Ecol. Indic. 2020, 110, 105862. [Google Scholar] [CrossRef]
- Karr, J.R. Assessment of biotic integrity using fish communities. Fisheries 1981, 6, 21–27. [Google Scholar] [CrossRef]
- Bryce, S.A.; Hughes, R.M.; Kaufmann, P.R. Development of a bird integrity index: Using bird assemblages as indicators of riparian condition. Environ. Manag. 2002, 30, 294–310. [Google Scholar] [CrossRef] [PubMed]
- Golfieri, B.; Hardersen, S.; Maiolini, B.; Surian, N. Odonates as indicators of the ecological integrity of the river corridor: Development and application of the Odonate River Index (ORI) in northern Italy. Ecol. Indic. 2016, 61, 234–247. [Google Scholar] [CrossRef]
- Nelson, S.M.; Andersen, D.C. An assessment of riparian environmental quality by using butterflies and disturbance susceptibility scores. Southwest. Nat. 1994, 39, 137–142. [Google Scholar] [CrossRef]
- Murphy, K.J.; Castella, E.; Clément, B.; Hills, J.M.; Obrdlik, P.; Pulford, I.D.; Schneider, E.; Speight, M.C.D. Biotic indicators of riverine wetland ecosystem functioning. In Global Wetlands: Old World and New; Mitsch, W.J., Ed.; Elsevier: Amsterdam, The Netherlands, 1994; pp. 659–682. [Google Scholar]
- Gollan, J.R.; Reid, C.A.M.; Barnes, P.B.; Wilkie, L. The ratio of exotic-to-native dung beetles can indicate habitat quality in riparian restoration. Insect Conserv. Divers. 2011, 4, 123–131. [Google Scholar] [CrossRef]
- Andersen, A.N. A Classification of Australian Ant Communities, Based on Functional Groups Which Parallel Plant Life-Forms in Relation to Stress and Disturbance. J. Biogeogr. 1995, 22, 15–29. [Google Scholar] [CrossRef]
- Andersen, A.N. Using Ants as bioindicators: Multiscale Issues in Ant Community Ecology. Conserv. Ecol. 1997, 1, 8. [Google Scholar] [CrossRef] [Green Version]
- Roig, X.; Espadaler, X. Propuesta de grupos funcionales de hormigas para la Península Ibérica y Baleares, y su uso como bioindicadores. Iberomyrmex 2010, 2, 28–29. [Google Scholar]
- Philpott, S.M.; Perfecto, I.; Armbrecht, I.; Parr, C.L. Ant diversity and function in disturbed and changing habitats. In Ant Ecology; Lach, L., Parr, C.L., Abbott, K., Eds.; Oxford University Press: Oxford, UK, 2010; pp. 137–157. [Google Scholar]
- Hoffmann, B.D.; Andersen, A.N. Responses of ants to disturbance in Australia, with particular reference to functional groups. Austral. Ecol. 2003, 28, 444–464. [Google Scholar] [CrossRef]
- Meteocat. Meteorological Service of Catalonia. Available online: www.meteo.cat (accessed on 12 April 2019).
- Folch, R. La vegetació dels Països Catalans, 2nd ed.; Corrected and Extended; Ketres: Barcelona, Spain, 1986; p. 541. [Google Scholar]
- IDESCAT—Institut d’Estadística de Catalunya. Available online: https://www.idescat.cat/?lang=es (accessed on 12 April 2019).
- Retana, J.; Cerdá, X. Patterns of diversity and composition of Mediterranean ground ant communities tracking spatial and temporal variability in the thermal environment. Oecologia 2000, 123, 436–444. [Google Scholar] [CrossRef] [Green Version]
- Gómez, C.; Casellas, D.; Oliveras, J.; Bas, J.M. Structure of ground-foraging ant assemblages in relation to land-use change in the northwestern Mediterranean region. Biodivers. Conserv. 2003, 12, 2135–2146. [Google Scholar] [CrossRef]
- Angulo, E.; Boulay, R.; Ruano, R.; Tinaut, A.; Cerdá, X. Anthropogenic impacts in protected areas: Assessing the efficiency of conservation efforts using Mediterranean ant communities. PeerJ 2016, 4, e2773. [Google Scholar] [CrossRef] [Green Version]
- Majer, J.D. The use of pitfall traps for sampling ants—A critique. Mem. Mus. Vic. 1997, 56, 323–329. [Google Scholar] [CrossRef]
- Parr, C.L.; Chown, S.L. Inventory and Bioindicator Sampling: Testing Pitfall and Winkler Methods with Ants in a South African Savanna. J. Insect Conserv. 2001, 5, 27–36. [Google Scholar] [CrossRef]
- Tista, M.; Fiedler, K. How to evaluate and reduce sampling effort for ants. J. Insect Conserv. 2011, 15, 547–559. [Google Scholar] [CrossRef]
- Collingwood, C.; Prince, A. A guide to ants of continental Portugal (Hymenoptera: Formicidae). Bol. Da Soc. Port. De Entomol. 1998, 5, 1–49. [Google Scholar]
- Gómez, K.; Espadaler, X. Hormigas Ibéricas. 2007. Available online: http://www.hormigas.org (accessed on 19 September 2018).
- Galkowski, C.L.C.; Wegnez, R.B.P. Guía De Campo De Las Hormigas De Europa Occidental; Edición Española; Omega: Barcelona, Spain, 2017; p. 415. [Google Scholar]
- MacQueen, J.B. Some Methods for classification and Analysis of Multivariate Observations. In Proceedings of the 5th Berkeley Symposium on Mathematical Statistics and Probability, Berkeley, CA, USA, 21 June–18 July 1965; University of California Press: Berkeley, CA, USA, 1967; Volume 1, pp. 281–297. [Google Scholar]
- Rivers and Catchments of Europe—Catchment Characterisation Model (CCM). European Commission, Joint Research Centre (JRC) [Dataset]; OOPEC: Luxembourg, Luxembourg, 1 June 2007; Available online: http://data.europa.eu/89h/fe1878e8-7541-4c66-8453-afdae7469221 (accessed on 1 December 2019).
- Horton, R.E. Erosional development of streams and their drainage basins hydro-physical approach to quantitative morphology. Geol. Soc. Am. Bull. 1945, 56, 275–370. [Google Scholar] [CrossRef] [Green Version]
- Strahler, A.N. Hypsometric (area-altitude) analysis of erosional topology. Geol. Soc. Am. Bull. 1972, 63, 1117–1142. [Google Scholar] [CrossRef]
- Nagel, D.E.; Buffington, J.M.; Parkes, S.L.; Wenger, S.; Goode, J.R. A landscape Scale Valley Confinement Algorithm: Delineating Unconfined Valley Bottoms for Geomorphic, Aquatic, and Riparian Applications; Gen. Tech., Rep. RMRSGTR-321; U.S. Department of Agriculture, Forest Service, Rocky Mountain Research Station: Fort Collins, CO, USA, 2014; 42p.
- Johansen, K.; Phinn, S. Mapping structural parameters and species composition of riparian vegetation using IKONOS and Landsat ETM+ Data in Australian Tropical Savannahs. Photogramm. Eng. Remote Sens. 2006, 72, 71–80. [Google Scholar] [CrossRef]
- Clerici, N.; Weissteiner, C.J.; Paracchini, M.L.; Boschetti, L.; Baraldi, A.; Strobl, P. Pan-European distribution modelling of stream riparian zones based on multi-source Earth Observation data. Ecol. Indic. 2013, 24, 211–223. [Google Scholar] [CrossRef]
- European Commission. Directive 2000/60/EC of the European Parliament and of the council of 23rd October 2000 establishing a framework for community action in the field of water policy. In Official Journal of the European Communities; L327/1; European Commission: Brussels, Belgium, 2000. [Google Scholar]
- Arnan, X.; Cerdá, X.; Retana, J. Distinctive life traits and distribution along environmental gradients of dominant and subordinate Mediterranean ant species. Oecologia 2012, 170, 489–500. [Google Scholar] [CrossRef] [Green Version]
- Parr, C.L.; Dunn, R.R.; Sanders, N.J.; Weiser, M.D.; Photakis, M.; Bishop, T.R.; Fitzpatrick, M.C.; Arnan, X.; Baccaro, F.; Brandão, C.R.; et al. GlobalAnts: A new database on the geography of ant traits (Hymenoptera: Formicidae). Insect Conserv. Divers. 2007, 10, 5–20. [Google Scholar] [CrossRef] [Green Version]
- Torossian, C. Recherches sur la biologie et l’éthologie de Dolichoderus quadripunctatus (Hym. Form. Dolichoderidae). I. Étude des populations dans leur milieu naturel. Insectes Sociaux 1967, 14, 102–122. [Google Scholar]
- Gibb, H.; Sanders, N.J.; Dunn, R.R.; Arnan, X.; Baccaro, F.; Bishop, T.R.; Chick, L.; Donoso, D.; Fayle, T.M.; Glasier, J.; et al. The Global Ants Database. 2015. Available online: http://globalants.org/ (accessed on 2 June 2020).
- Retana, J.; Cerdá, X.; Alsina, A.; Bosch, J. Field observations of the ant Camponotus sylvaticus: Diet and activity patterns. Acta Oecologica 1988, 9, 101–109. [Google Scholar]
- Gómez, C.; Abril, S. Selective logging in public pine forests of the central Iberia Peninsula: Effects of the recovery process on ant assemblages. For. Ecol. Manag. 2011, 262, 1061–1066. [Google Scholar] [CrossRef]
- Arnan, X.; Cerdá, X.; Retana, J. Ant functional responses along environmental gradients. J. Anim. Ecol. 2014, 83, 1398–1408. [Google Scholar] [CrossRef] [PubMed] [Green Version]
- Czechowski, W. Around-nest “cemeteries” of Myrmica schencki Em. (Hymenoptera: Formicidae) their origin and a possible significance. Pol. J. Ecol. 2008, 56, 359–363. [Google Scholar]
- Cros, S.; Cerdá, X.; Retana, J. Spatial and temporal variations in the activity patterns of Mediterranean ant communities. Ecoscience 1997, 4, 269–278. [Google Scholar] [CrossRef] [Green Version]
- Cerda, X.; Retana, J.; Cros, S. Critical thermal limits in Mediterranean ant species: Trade-off between mortality risk and foraging performance. Funct. Ecol. 1998, 12, 45–55. [Google Scholar] [CrossRef] [Green Version]
- Pekas, A.; Tena, A.; Aguilar, A.; Garcia-Marí, F. Spatio-temporal patterns and interactions with honeydew-producing Hemiptera of ants in a Mediterranean citrus orchard. Agric. For. Entomol. 2011, 13, 89–97. [Google Scholar] [CrossRef]
- Ruiz, E.; Hoz-Martínez, M.; Martínez, M.D.; Hernández, J.M. Morphological study of the stridulatory organ in two species of Crematogaster genus: Crematogaster scutellaris (Olivier 1792) and Crematogaster auberti (Emery 1869) (Hymenoptera: Formicidae). Ann. De La Société Entomol. De Fr. 2006, 42, 99–105. [Google Scholar] [CrossRef]
- Van Sickle, J. Correlated metrics yield multimetric indices with inferior performance. Trans. Am. Fish. Soc. 2010, 139, 1802–1817. [Google Scholar] [CrossRef]
- Suárez, M.L.; Vidal-Abarca, M.R.; del Sánchez-Montoya, M.; Alba-Tercedor, J.P.; álvarez, M.; Avilés, J.; Bonada, N.; Casas, J.; Jáimez-Cuéllar, P.; Munneé, A.; et al. Las riberas de los ríos mediterráneos y su calidad: El uso del índice QBR. Limnetica 2002, 21, 135–148. [Google Scholar]
- Colwell, S.R.; Hix, D.M. Adaptation of the QBR index for use in riparian forests of central Ohio. In Proceedings,16th Central Hardwood Forest Conference; Jacobs, D.F., Michler, C.H., Eds.; West Lafayette, In Gen. Tech. Rep. NRS-P-24; US Department of Agriculture, Forest Service, Northern Research Station: Newtown Square, PA, USA, 2008. [Google Scholar]
- Kazoglou, Y.; Fotiadis, G.; Koutseri, I.; Vrahnakis, M. Assessment of Structural Components of Riparian Forest Vegetation of the Prespa Basin with the Means of the QBR Index; Balwois: Ohrid, Republic of Macedonia, 2010. [Google Scholar]
- Siromba, M.G.; Mesa, L.M. A method for assessing the ecological quality of riparian forests in subtropical Andean streams: QBR index. Ecol. Indic. 2012, 20, 324–331. [Google Scholar] [CrossRef]
- Andersen, A.N.; Fisher, A.; Hoffmann, B.D.; Read, J.L.; Richards, R. Use of terrestrial invertebrates for biodiversity monitoring in Australian rangelands, with particular reference to ants. Austral. Ecol. 2004, 29, 87–92. [Google Scholar] [CrossRef]
- Andersen, A.N.; Majer, J.D. Ants show the way down under: Invertebrates as bioindicators in land management. Frontier in Ecol. Environ. 2004, 2, 291–298. [Google Scholar] [CrossRef]
- Arnan, X.; Rodrigo, A.; Retana, J. Post-fire recovery of Mediterranean ground ant communities follows vegetation and dryness gradients. J. Biogeogr. 2006, 33, 1246–1258. [Google Scholar] [CrossRef]
- Rodrigo, A.; Retana, J. Post-fire recovery of ant communities in Submediterranean Pinus nigra forests. Ecography 2006, 29, 231–239. [Google Scholar] [CrossRef]
- Bishop, T.R.; Robertson, M.; Gibb, H.; van Rensburg, B.J.; Braschler, B.; Chown, S.L.; Foord, S.H.; Munyai, T.C.; Okey, I.; Tshivhandekano, P.G.; et al. Ant assemblages have darker and larger members in cold environments. Glob. Ecol. Biogeogr. 2006, 25, 1489–1499. [Google Scholar] [CrossRef]
- Margalef, R. Ecología; Omega: Barcelona, Spain, 1980; p. 951. [Google Scholar]
- Wetterer, J.K.; Espadaler, X.; Wetterer, A.L.; Cabral, S.G.M. Native and exotic ants of the Azores (Hymenoptera: Formicidae). Sociobiology 2004, 44, 265–297. [Google Scholar]
- Hoffmann, B.D. Using ants for rangeland monitoring: Global patterns in the responses of ant communities to grazing. Ecol. Indic. 2010, 10, 105–111. [Google Scholar] [CrossRef]
- Hevia, V.; Ortega, J.; Azcárate, F.M.; López, C.A.; González, J.A. Exploring the effect of soil management intensity on taxonomic and functional diversity of ants in Mediterranean olive groves. Agric. For. Entomol. 2019, 21, 109–118. [Google Scholar] [CrossRef]
- Sanders, N.J.; Gotelli, N.J.; Heller, N.E.; Gordon, D.M. Community disassembly by an invasive species. PNAS 2003, 100, 2474–2477. [Google Scholar] [CrossRef] [PubMed] [Green Version]
- Perfecto, I. Indirect and direct effects in a tropical agroecosystem: The maize-pest-ant system in Nicaragua. Ecology 1990, 71, 2125–2134. [Google Scholar] [CrossRef] [Green Version]
- Pereira, J.L.; Silva, A.A.; Picanco, M.C.; Barros, E.C.; Jakelaitis, A. Effects of herbicide and insecticide interaction on soil entomofauna under maize crop. J. Environ. Sci. Health Part B Pestic. Food Contam. Agric. Wastes 2005, 40, 45–54. [Google Scholar] [CrossRef]
- Ives, C.D.; Hose, G.C.; Nipperess, D.A.; Taylor, M.P. The influence of riparian corridor width on ant and plant assemblages in northern Sydney, Australia. Urban. Ecosyst. 2011, 14, 1–16. [Google Scholar] [CrossRef]
- Ives, C.D.; Taylor, M.P.; Nipperess, D.A.; Hose, G.C. Effect of catchment urbanization on ant diversity in remnant riparian corridors. Landsc. Urban. Plan. 2013, 110, 155–163. [Google Scholar] [CrossRef]
- Ellison, A.M.; Record, S.; Arguello, A.; Gotelli, N.J. Rapid inventory of the ant assemblage in a temperate hardwood forest: Species composition and assessment of sampling methods. Environ. Entomol. 2007, 36, 766–775. [Google Scholar] [CrossRef]
- Gotelli, N.J.; Ellison, A.M.; Dunn, R.R.; Sander, N.J. Counting ants (Hymenoptera: Formicidae): Biodiversity sampling and statistical analysis for myrmecologists. Myrmecol. News 2011, 15, 13–19. [Google Scholar]
- Garcia-Martínez, M.A.; Valenzuela-González, J.E.; Escobar-Sarria, F.; López-Barrera, F.; Castaño-Meneses, G. The surrounding landscape influences the diversity of leaf-litter ants in riparian cloud forest remnants. PLoS ONE 2017, 12, e0172464. [Google Scholar] [CrossRef]
- Tagwireyi, P.; Sullivan, S.M.P. Riverine landscape patches influence trophic dynamics or riparian ants. River Res. Appl. 2016, 32, 1721–1729. [Google Scholar] [CrossRef]
- Barredo, J.I.; Caudullo, G.; Dosio, A. Mediterranean habitat loss under future climate conditions: Assessing impatcs in the Natura 2000 protected area network. Appl. Geogr. 2016, 75, 83–92. [Google Scholar] [CrossRef]
Figure 1.
Geographical location and aerial photo of the nine sampling sites at the Catalonian river corridors. Red and green points indicate disturbed and less disturbed sites, respectively.
Figure 1.
Geographical location and aerial photo of the nine sampling sites at the Catalonian river corridors. Red and green points indicate disturbed and less disturbed sites, respectively.

Figure 2.
Aerial photo of a sampling site, showing details of the pitfall traps arrangement, riparian vegetation cover delimitation and the riverbank line that worked as a support to create the 200 m half-size buffer radius used to calculate relative measurements of LULC anthropogenic pressures.
Figure 2.
Aerial photo of a sampling site, showing details of the pitfall traps arrangement, riparian vegetation cover delimitation and the riverbank line that worked as a support to create the 200 m half-size buffer radius used to calculate relative measurements of LULC anthropogenic pressures.

Figure 3.
Box plots of: (a) Riparian vegetation cover; (b) Average width of riparian cover; (c) Urban LULC; (d) Cropland and intensive grassland LULC; (e) Shrublands and natural woodlands LULC, at disturbed and less disturbed sites in the upland and lowland river types. Boxes show interquartile ranges (25th and 75th percentiles), middle lines are medians, and whiskers are non-outlier ranges beyond the boxes.

Figure 4.
Boundary values for the five classes of ecological quality of the Ant-based MMI expressed in Ecological Quality Ratios (EQR) for the Lowland and Upland river types. Boxes show interquartile ranges (25th and 75th percentiles), middle lines are medians, and whiskers are non-outlier ranges beyond the boxes.

Figure 5.
Scatter plot and correspondent regression line (in black) with 95% confidence interval (shaded area) representing the relationship between the Ant-based MMI and the QBR index. Spearman’s ρ correlation test revealed a significant positive correlation between the two indices.
Figure 5.
Scatter plot and correspondent regression line (in black) with 95% confidence interval (shaded area) representing the relationship between the Ant-based MMI and the QBR index. Spearman’s ρ correlation test revealed a significant positive correlation between the two indices.


Table 1.
Average and standard deviation (SD) for environmental variables of the two river types surveyed, i.e., upland and lowland (number of sites are shown).
Table 1.
Average and standard deviation (SD) for environmental variables of the two river types surveyed, i.e., upland and lowland (number of sites are shown).
| Variables | Upland Type (N = 6) | Lowland Type (N = 3) |
|---|---|---|
| Average ± SD | Average ± SD | |
| Strahler number | 5 | 4 |
| Altitude (m) | 733 ± 284.10 | 206 ± 1.73 |
| Average annual air temperature (°C) | 10.35 ± 1.92 | 14.90 |
| Average annual rainfall (mm) | 579 ± 92.02 | 607 |
| Upstream drainage basin (km2) | 931.33 ± 142.62 | 166 |
| Valley confinement (mean 7 × 7) | −805.81 ± 313.46 | −727.12 ± 124.20 |
Table 2.
Statistical comparison of the ant metrics that showed significant differences between disturbance groups in the upland and lowland river types.
Table 2.
Statistical comparison of the ant metrics that showed significant differences between disturbance groups in the upland and lowland river types.
| Mann–Whitney U Test | |||
|---|---|---|---|
| Group | Significance p < 0.05 | Mean Rank | |
| Ant Metrics | Disturbed | Less Disturbed | |
| Upland River Type | |||
| Observed species richness | 0.028 | 24.42 | 33.67 |
| Closed-habitat species | <0.001 | 21.71 | 39.08 |
| Larger ants | 0.033 | 24.99 | 32.53 |
| Cryptics | 0.001 | 25.00 | 32.50 |
| Opportunists | 0.032 | 29.50 | 23.50 |
| Tetramorium caespitum foraging activity | 0.032 | 29.50 | 23.50 |
| Lowland River Type | |||
| Ant foraging activity | 0.011 | 19.39 | 11.31 |
| Seed harvesters | 0.023 | 18.89 | 11.56 |
| Aphaenogaster senilis foraging activity | <0.001 | 22.39 | 9.81 |
Table 3.
Designation and calculation of the Ant-based MMI, units and scoring criteria used to rescale the metric values. Ant-based MMI range (minimum and maximum sum of scores) and median of reference (md) sites. Ecological Quality Class boundaries using Ecological Quality Ratio values (EQR = [Ant-based MMI * (-1)-n]/md).
| Ant-Based MMI [Ant-Based MMI = n-Σ si; I = 1, ..., n] | Scores (si) | |||
|---|---|---|---|---|
| Core Metrics (n) | 1 (Poor) | 3 (Fair) | 5 (Good) | |
| [Boundaries Based on the Average of Disturbed and Less Disturbed] | ||||
| Upland Type | Observed species richness | ≤1.25 | 1.25–1.67 | ≥1.67 |
| Closed-habitat species | ≤1.89 | 1.89–5.56 | ≥5.56 | |
| Larger ants | ≤3.03 | 3.03–4.29 | ≥4.29 | |
| Cryptics | ≤0 | 0–1.26 | ≥1.26 | |
| Opportunists | ≥1.14 | 0–1.14 | ≤0 | |
| Tetramorium caespitum foraging activity | ≥0.04 | 0–0.04 | ≤0 | |
| Lowland Type | ||||
| Ant foraging activity | ≥9.67 | 6.06–9.67 | ≤6.06 | |
| Seed harvesters | ≥5.56 | 2.53–5.56 | ≤2.53 | |
| Aphaenogaster senilis foraging activity | ≥0.37 | 0.04–0.37 | ≤0.04 | |
| Upland Type | Lowland Type | |||
| Ant-Based MMI Range (absolute values) | 0–24 | 0–12 | ||
| Median of Reference (Less disturbed) Sites (md) | 18 | 12 | ||
| Thresholds of Ecological Classes (EQR) | ||||
| Excellent | EQR ≥ 0.67 | EQR ≥ 0.75 | ||
| Good | 0.48 ≥ EQR < 0.67 | 0.53 ≥ EQR < 0.75 | ||
| Moderate | 0.29 ≥ EQR < 0.48 | 0.31 ≥ EQR < 0.53 | ||
| Poor | 0.10 ≥ EQR < 0.29 | 0.09 ≥ EQR < 0.31 | ||
| Bad | EQR < 0.10 | EQR < 0.09 | ||
Table 4.
Summary table of agreement between Ant-based MMI and the QBR index for the assessment of riparian quality.
Table 4.
Summary table of agreement between Ant-based MMI and the QBR index for the assessment of riparian quality.
| River Type | Disturbance Group | River | Site | QBR | Ant-based MMI | ||
|---|---|---|---|---|---|---|---|
| Value | Quality Classes | Value | Quality Classes | ||||
| Upland | Disturbed | Ter | TE1 | 30 | Poor | 0.19 | Poor |
| TE2 | 50 | Poor | 0.43 | Moderate | |||
| Segre | SE1 | 25 | Bad | 0.20 | Poor | ||
| SE2 | 55 | Moderate | 0.26 | Poor | |||
| Less disturbed | Ter | TE3 | 100 | Excellent | 0.58 | Good | |
| Segre | SE3 | 100 | Excellent | 0.75 | Excellent | ||
| Lowland | Disturbed | Congost | CO1 | 35 | Poor | 0.06 | Bad |
| Less disturbed | CO2 | 60 | Moderate | 0.36 | Moderate | ||
| CO3 | 100 | Excellent | 0.68 | Good | |||
Publisher’s Note: MDPI stays neutral with regard to jurisdictional claims in published maps and institutional affiliations. |
© 2021 by the authors. Licensee MDPI, Basel, Switzerland. This article is an open access article distributed under the terms and conditions of the Creative Commons Attribution (CC BY) license (https://creativecommons.org/licenses/by/4.0/).
Share and Cite
MDPI and ACS Style
Zina, V.; Ordeix, M.; Franco, J.C.; Ferreira, M.T.; Fernandes, M.R. Ants as Bioindicators of Riparian Ecological Health in Catalonian Rivers. Forests 2021, 12, 625. https://0-doi-org.brum.beds.ac.uk/10.3390/f12050625
AMA Style
Zina V, Ordeix M, Franco JC, Ferreira MT, Fernandes MR. Ants as Bioindicators of Riparian Ecological Health in Catalonian Rivers. Forests. 2021; 12(5):625. https://0-doi-org.brum.beds.ac.uk/10.3390/f12050625
Chicago/Turabian StyleZina, Vera, Marc Ordeix, José Carlos Franco, Maria Teresa Ferreira, and Maria Rosário Fernandes. 2021. "Ants as Bioindicators of Riparian Ecological Health in Catalonian Rivers" Forests 12, no. 5: 625. https://0-doi-org.brum.beds.ac.uk/10.3390/f12050625
Note that from the first issue of 2016, this journal uses article numbers instead of page numbers. See further details here.