
A Comprehensive Evaluation Model for Wood Companies Websites Based on the AHP/R-TOPSIS Method


1
Department of Wood Science and Technology, Biotechnical Faculty, University of Ljubljana, Jamnikarjeva 101, 1000 Ljubljana, Slovenia
2
Department of Forestry and Renewable Forest Resources, Biotechnical Faculty, University of Ljubljana, Jamnikarjeva 101, 1000 Ljubljana, Slovenia
*
Author to whom correspondence should be addressed.
Forests 2021, 12(6), 706; https://0-doi-org.brum.beds.ac.uk/10.3390/f12060706
Submission received: 23 April 2021
/
Revised: 23 May 2021
/
Accepted: 27 May 2021
/
Published: 29 May 2021
(This article belongs to the Special Issue Modeling the Performance of Wood and Wood Products)
Abstract
:Recently, partly as a result of the COVID-19 pandemic, companies are increasingly shifting their activities to the Internet environment, thus accelerating the growth of online shopping. The aim of this study was to develop a comprehensive model for the evaluation of websites of wood companies, as a review of the literature shows that such a model does not yet exist. In developing the model, we used an innovative approach and combined the analytic hierarchy process with R-TOPSIS (technique for order of preference by similarity to ideal solution), which is a novelty in this field. For the final website assessment, the Website Quality Index (WQI) was developed. The main difference to other indexes is that our model has a comprehensive content background (36 criteria and sub-criteria) and a strong mathematical basis, so that it can be used to independently evaluate a single website or to evaluate a larger group of websites from the same industry. We have tested the model on 60 websites of Slovenian wood industry companies with at least ten employees. The results show the low to moderate average quality of the websites, with an average WQI of all evaluated websites of 0.450, indicating only an acceptable website. It has proven to be easy to use, and the results show the reliability of the website rating. Additionally, the designed model is an important tool for industry website developers and the basis for future studies in this field. However, it can also be applied to other areas related to wood and wood products, where the performance of objects should be evaluated with respect to multiple criteria.
1. Introduction
The digital transformation of the business environment and its issues is currently flourishing, mainly due to the COVID-19 pandemic [1]. Companies are changing their business models, introducing new digital technologies and (extensively) computerizing the business. The concept of Industry 4.0, which is crucial for its (rapid) development in recent years, especially in manufacturing companies, has contributed a great deal to this. It focuses more on the technological aspect, but also on other areas of the economy [2].
One of the main factors in this development is undoubtedly the Internet, which since its beginning in the 1990s has strongly promoted the integration, collection, and exchange of data and the performance of remote operations. Due to its open technological design and other important organizational features, a variety of services have emerged in this context, among which websites are among the oldest [3]. In the past, many organizations seem to have had a website because it was “the right thing to do”, or perhaps the competition had a website, or perhaps someone in the organization had read about the phenomenal growth of the Internet [4]. Today, we know that by using websites, an organization can easily reach customers to provide them not only with general information about their products or services, but also with the ability to conduct interactive business transactions [5].
1.1. Websites
Websites provide opportunities for the development of many other business services, such as e-shops, e-banking, e-health, cloud computing, etc., while adapting and supporting many other technological and/or information services that are at the core of the Fourth Industrial Revolution. Of course, the World Wide Web has undergone enormous changes over all these years (e.g., html development, the emergence of dynamic websites, content management system (CMS), security) and the transition to Web 3.0 is emerging, where the boundary between digital and physical objects is being blurred [6].
Modern websites must offer a high level of security, be adapted to different customers, and be optimized for different search engines, as this determines their visibility in search results and consequently the visits of the potential customers for whom the websites are intended. On the other hand, the website has quality through the promotion of services or products and online purchases to maximize the profits of the organization. Rababah and Masoud [7] note that the quality of a website is a characteristic that is difficult to define and operationally capture, but everyone can feel it when it is missing. Companies are beginning to realize that the key factors for success or failure are not just a web presence or a low price, but the provision of a high-quality website [8]. Rocha [9] defined the quality of the website according to three main dimensions: content quality, service quality, and technical quality.
1.2. Websites Evaluation
To create a high-quality and effective website, several parameters (qualitative and quantitative aspects of physical and functional characteristics) must be taken into account simultaneously. While organizations invest time and money to develop and maintain the quality of their website, website quality evaluation has become an important activity. As with all information systems, the evaluation of websites is an important development and operational factor that can improve user satisfaction and optimize the resources invested [9]. This is particularly important for smaller organizations, where little attention has often been paid to the effectiveness of the website in adding value to the business [4]. With the aim of increasing traffic to reach the widest possible range of potential customers who can then buy a particular company’s product/service, thereby increasing its sales and profits, companies are keen to make their websites as attractive as possible. However, this concept becomes more and more complex as it develops. It includes many aspects, e.g., design, (advanced) functionalities, usability, etc. There are a number of recommendations and standards (e.g., [10]) on how to (technically) build a modern website, but their implementation is often tailored to the purpose of the specific website and other constraints (technical, user-related, etc.). It is therefore very important for companies to have the attractiveness of their websites evaluated by the target users or by the companies themselves to determine whether their website meets the current expectations of the target users. For this purpose, they can use many online tools or services, e.g., [11,12,13], which provide them with an evaluation and a brief analysis of the website. The advantage of such tools is that they are very good at measuring objective parameters (e.g., the loading speed of the page), whereas when measuring qualitative parameters, they are limited to pre-programmed samples and are therefore less able to adapt to the actual target groups of an individual website. The results are otherwise well presented and are (usually) expressed in the form of an index, which users often do not know how to interpret in detail due to their ignorance of the evaluation background.
1.3. Website Classifications
In the literature, there are different classifications for website categories with different aspects. For example, Tarafdar and Zhang [14] identified the following categories in their study based on the primary function or service: portals and search engines, retail, entertainment, news and information, and financial services. Lee and Koubek [15] classified websites into categories based on the purpose of use: entertainment websites, information websites, communication websites, and commercial websites. However, previous research in the literature did not focus on the specifics of industry-type websites, so the website rating models developed therein are not directly applicable to industry companies. Industrial websites are a type of commercial website that enables companies to earn money directly (by providing an e-shop) and/or indirectly (by providing information about products/company). In the scope of this paper, we focus on the Business to Consumer (B2C) commercial industry websites and their specificities. Websites are one of the key components of web marketing, even for smaller industrial companies. Since the latter are common in the structure of the industry’s companies, the ease of use and simplicity of the model for evaluating the website of industrial companies is one of the main objectives in its development.
1.4. Models for Websites Evaluation
There are also numerous models for evaluating (quality) websites in the literature. Some of them focus on developing mathematical models [16,17,18,19], while others are concerned with content [7,20,21]. These models are either suitable for a very wide range of information systems [22] or are industry-specific [9,19,23,24,25]. This severely limits their usefulness and applicability. Finally, the model should also serve to rank the websites according to their quality, allowing comparison between them, for purposes such as evaluating the evolution of the sector/sub-sector in terms of digital marketing of which the website is an important part. Different approaches are used for this purpose. Some emphasize the practicality of the self-assessment model. For them, the model is usually limited to a small number of parameters and a weak mathematical basis. One of them is the WAI (Web Assessment Index) model, developed by Miranda and Bañegil [26]. This model has been used several times [23,27,28], indicating the need to calculate a so-called index of website quality and attractiveness. Vaucher, Moulart, Sahraoui, and Habra [29] have also developed their own model for evaluating the quality of websites, focusing on the navigability of websites. However, there are also some approaches that rely on the use of different scientific methods and have a strong mathematical basis.
Since many factors influence the quality of commercial industrial websites, multi-criteria decision making (MCDM) methods are suitable for this task. As mentioned earlier, many website evaluations in the literature use MCDM models. A number of different models have been developed for e-commerce website evaluation. Yu et al. [19] ranked the criteria by analytic hierarchy process (AHP) and the websites using fuzzy TOPSIS (technique for order of preference by similarity to ideal solution). Li and Sun [30] used fuzzy AHP and TOPSIS-Grey. Aydin and Kahraman [31] ranked criteria using fuzzy AHP and the websites using fuzzy VIKOR (ViseKriterijumska Optimizacija I Kompromisno Resenje), and Liang et al. [32] combined single-valued trapezoidal neutrosophic (STVN) DEMATEL (decision making trial and evaluation laboratory) with the STVN-normalized prioritized weighted Bonferroni mean operator. Alptekin et al. [33] applied fuzzy TOPSIS to evaluate bookstores’ websites. Hotel websites were evaluated by Akincilar and Dagdeviren [34], criteria using AHP and alternatives using PROMETHEE (Preference Ranking Organisation Method for Enrichment Evaluations), and by Ostovare and Shahraki [35] using Shannon entropy and PROMETHEE. University websites were evaluated by Pamučar et al. [36] using rough AHP and interval rough MABAC (multiattributive border approximation area comparison), while Özkan et al. [37] evaluated academic departments websites using hesitant fuzzy AHP and TOPSIS. Perçin [38] combined DEMATEL and generalized Choquet integral to evaluate the quality of hospital websites. Banking websites were evaluated using AHP and COPRAS-G (complex proportional assessment) [39] and using TODIM (a Portuguese acronym for interactive multi-criteria decision making) and Pythagorean fuzzy VIKOR [40].
1.5. The Goal
Since there is no suitable model for evaluating the performance of websites of companies in the wood industry, the aim of this study was to develop such a model. The literature review showed that the requirements of other industries for the quality of websites and the criteria for their evaluation are similar. Therefore, we did not want to limit the usefulness and applicability of the model to the wood industry only. The main objective of this study was to provide a comprehensive model for evaluating any industrial website. In developing the model, we focused on (1) determining the most important criteria, (2) its comprehensiveness and simplicity, (3) its suitability for evaluating a single website and/or a group of websites, and (4) developing a website quality index.
The performance measurement model is developed by an innovative combination of existing MCDM methods. AHP [41] is one of the most widely used MCDM methods, because it is able to deal with complex problems and is easy to understand. To involve a group of experts in criteria evaluation and promote homogeneity in their judgments, we developed a new hybrid group AHP framework. Another useful MCDM tool is the TOPSIS [42]. A variant of TOPSIS, called R-TOPSIS [43], was chosen for the evaluation of alternatives and the development of the website quality index.
We applied the developed model to the evaluation of websites of companies in the wood industry in Slovenia. Website performance is very important in the wood industry. Good wood products are not sufficient for their sales success. In the time of the COVID-19 pandemic, most sales took place over the Internet, which further increased the importance of excellent websites. Another objective of the evaluation was to identify differences between the websites in terms of the size of the companies and the sub-sectors in which they operate.
This paper is organized as follows. In the first section, the literature review is presented. The methods and their innovations are presented in Section 2. The new model is presented in Section 3. Section 4 contains the application of the proposed model for the evaluation of websites of companies in the wood industry in Slovenia. Section 5 contains the results and the discussion of the evaluation of the criteria tree and the evaluation of the websites. Section 6 contains the conclusions.
2. Materials
The literature review shows that most models use several types of fuzzy methods. In our study, we used the classical AHP for criteria ranking. The main reason is that Saaty [44], the founder of AHP, warns against using fuzzy numbers in AHP. Chan et al. [45] showed some cases where the fuzzy AHP is preferable to the classical AHP, but overall the sophisticated fuzzy AHP is not advantageous over the simpler classical AHP. The process of pairwise comparisons and calculation of weights is more transparent in the classical AHP and easier to understand for experts who are not familiar with the method. Therefore, experts can more easily focus on homogeneity with other experts, which is emphasized in the proposed group AHP method. In the TOPSIS method, we have defined different levels of possible performance for all criteria and sub-criteria at the lowest level of the hierarchy. The Likert-type scale is suitable for describing the levels and is easy to understand. For the evaluation of alternatives, R-TOPSIS was chosen, which avoids the problem of rank reversal and allows the definition of a Website Quality Index (WQI).
2.1. AHP
AHP [41] is a multi-criteria decision-making approach that allows a number of criteria and/or alternatives to be ranked and their relative importance to be evaluated. A hierarchically structured model can include measurable and non-measurable, quantitative and qualitative elements, judgments, and subjective opinions. The core of the method is pairwise comparisons of objects at the same hierarchical level. The judgments are selected from a fundamental Saaty’s ratio scale of 1 to 9 and collected in a pairwise comparison matrix A as follows:
The consistency of judgments is measured by the consistency ratio CR, the ratio of the consistency index (CI), based on , the maximum eigenvalue of A, and the random index (RI) [46]:
The pairwise comparison matrices should be acceptably consistent with to ensure the quality of the weight vector; otherwise, the judgments should be revised.
To derive group weights, we propose a new hybrid method (SP-WGMDEA) based on the symmetric projection method (SPM) [47] and weighted geometric mean DEA method (WGMDEA). SPM assigns priority weights to decision makers. A group of experts contribute their knowledge and experience to the final decision. The experts in the decision-making process are always carefully selected for their expertise. However, we cannot be completely sure about their actual level of knowledge and experience. The SPM can be helpful by promoting uniformity among experts and supporting the homogeneity of their opinions by giving higher priority to experts with similar judgments. First, the similarity between all pairs of experts is measured by the symmetric projection:
where is Hadamard product between matrices A and B and . The results for p experts are collected in a projection matrix S:
The priority weights of experts are defined as
with and .
The WGMDEA method [48] is a method for deriving group weights from individual pairwise comparison matrices based on data envelopment analysis (DEA) and linear programming. It aggregates the individual judgments by the weighted geometric mean (WGM) and has been used in several applications [49,50,51]. To derive the group weights , n linear programs have to be solved:
2.2. R-TOPSIS
TOPSIS [42] is a multi-criteria decision method for selecting the optimal alternative from a number of alternatives. The best alternative would have the shortest distance from the positive ideal solution, which maximizes the benefit criteria and minimizes the cost criteria, and the longest distance from the negative ideal solution, which minimizes the benefit criteria and maximizes the cost criteria. The TOPSIS method allows the evaluation of more alternatives in less time than AHP. In AHP, the number of pairwise comparisons increases rapidly with the number of alternatives. To evaluate a larger number of alternatives (60 in our study), we chose the TOPSIS method.
One of the drawbacks of the TOPSIS method is the problem of rank reversal, where adding or deleting an alternative can cause a change in the ranking of the alternatives. To avoid the rank reversal problem, we chose the R-TOPSIS technique [43]. While the TOPSIS framework is usually suitable for evaluating a group of alternatives, R-TOPSIS allows the evaluation of a single object in addition to a group. The final result of R-TOPSIS is a closeness coefficient that can be interpreted as an index for measuring the quality of websites. We named it the Website Quality Index.
Another important issue in TOPSIS is the selection of an appropriate normalization method. The most commonly used normalization methods are vector normalization, linear scale transformation (max–min), linear scale transformation (max), and linear scale transformation (sum) [52]. The criteria in our model are evaluated by a Likert-type scale, which can be interpreted as an interval valued scale. Therefore, we chose the linear scale transformation (max–min), which is a value function with an interval scale.
The R-TOPSIS method consists of the following steps [43]:
Step 1: Define a set of alternatives .
Step 2: Define a set of criteria . Define the evaluation scale for all criteria. Let and be the minimal and maximal evaluation scores for criterion j, respectively.
Step 3: Create a decision matrix to rank the alternatives according to the criteria . Its structure can be expressed as follows:
In group decision making, the individual performance ratings of p decision makers are aggregated into group performance ratings by arithmetic mean [53].
Step 4: Calculate the normalized decision matrix with linear max–min normalization of performance ratings
Step 5: Define the criteria weights , with and .
Step 6: Calculate the weighted normalized decision matrix by multiplying the columns of the normalized decision matrix by the criteria weights :
Step 7: Determine the positive ideal solution PIS and the negative ideal solution NIS as
Step 8: Calculate the Euclidean distances of all alternatives from the ideal solutions:
Step 9: Calculate the closeness coefficient of each alternative to the ideal solution, Website Quality Index :
Step 10: Rank the alternatives in descending order.
2.3. Average Normalized Scores
To further examine how the alternatives met the criteria requirements, the performance of the group of alternatives in terms of categories, criteria, and sub-criteria was analyzed using the average normalized scores (ANS). The average of normalized scores of all alternatives for all criteria and sub-criteria at the lowest hierarchy level were calculated using the arithmetic mean:
ANS of alternatives with respect to criteria and categories at higher levels of hierarchy were calculated by multiplying the ANS at lower levels by sub-criteria, criteria, or category weights.
3. Industry Websites Evaluation Model
The proposed website evaluation model consists of three phases. In Phase 1, a hierarchical tree of criteria and sub-criteria is created. In Phase 2, the criteria and sub-criteria are evaluated using the AHP. The group of selected experts makes individual evaluations. The acceptable consistency of their pairwise comparison matrices is checked, and the SP-WGMDEA method is applied to determine the group weights of the criteria and sub-criteria. In Phase 3, the scale for evaluating the alternatives is determined in relation to the lowest criteria branch of the hierarchy tree.
In Phase 1, we defined 36 relevant criteria and sub-criteria from the literature, which were incorporated into the hierarchical structure with three levels: categories, criteria, and sub-criteria (Figure 1). At the first level, the criteria were grouped into five main categories according to their similarity: system quality, information quality (content), service quality, design, and use. At the second level, there are 17 criteria, nine of which are further divided into 28 sub-criteria. Table 1, Table 2, Table 3, Table 4 and Table 5 show the criteria and sub-criteria with their description and the literature in which they have already been mentioned.
In Phase 2, the categories, criteria, and sub-criteria of the proposed model were compared using the AHP method. In the Excel template [58] a questionnaire was designed in the form of pairwise comparisons. Ten experts from manufacturing, marketing, and information technology (IT) were carefully selected to evaluate all levels of the model. The consistency of their assessments was automatically calculated in the template, which helped the experts to adjust their judgments where necessary. The experts’ judgments were aggregated using the SP-WGMDEA method, and the group weights were determined.
In Phase 3, a Likert-type scale was created to evaluate alternatives regarding criteria and sub-criteria at the lowest level of the hierarchy. Criteria and sub-criteria have a different scale range that is best suited to them. In particular, with regard to the technical criteria, the expected values are given by the current state of the art in the field of technology. The evaluation scales are shown in Table 6.
4. Application of the Proposed Model for the Evaluation of Websites of Wood Industry Companies in Slovenia
The developed model was applied to evaluate and rank the websites of the selected wood industry companies in Slovenia using the R-TOPSIS model according to Steps 1 to 10. When evaluating the alternatives in terms of the category information quality, the specifics of the wood industry websites were also taken into account. Information about wood and its processing was evaluated in the criteria “products/services/catalog page”, “picture/photo gallery”, and especially “industry-specific content”, where content specifically related to the needs of the wood industry is shown, including scientific and professional reports and expert tips for customers and a wide audience. In Slovenia, there are almost 2500 wood industry companies and more than 89% of them employ 10 or fewer people (micro companies). Since micro companies represent the majority in terms of numbers, we still decided not to analyze them, as most of them do not have a website, as they mostly operate locally and do not need their own website to promote themselves. We analyzed all wood industry companies with more than fifty employees and selected companies with ten to fifty employees with the highest possible credit appraisal grade (rating A on a scale from A to E) in 2017, operating in C31 (manufacture of furniture) and C16 (wood processing other than furniture) [59].
First, the selected group of companies was divided into two subgroups according to size, companies with 10–50 employees and companies with more than 50 employees, and secondly, within these two subgroups, two additional groups were formed according to the type of wood industry subsectors: C31 (manufacture of furniture) and C16 (wood processing other than furniture). In subsector C31, we evaluated six websites of companies with more than 50 employees and 21 websites of companies with 10–50 employees. In subsector C16, we assessed 16 websites of companies with more than 50 employees and 17 websites of companies with 10–50 employees (this group otherwise includes 26 companies, but nine of them had no website). In total, we evaluated the websites of 60 wood companies. The companies in the sample employ 44% of all employees working in the wood industry sector in Slovenia and represent 43% of total income and 56% of total profit in the wood industry in Slovenia as a whole. In addition, the sample also represents 23% of all wood companies in Slovenia with more than 10 employees. The companies in the sample represent, as mentioned above, highly successful companies with a high export orientation. Their average age is more than 10 years, the oldest being 65 and 75 years old. They mainly produce interior furniture (slightly more than one third), sawn wood and wood products (21%), builders’ joinery (13%), chairs and school furniture (13%), and houses (12%). These shares accurately represent the actual picture of the production capacities of the Slovenian wood industry, so we can conclude that we have a representative sample of companies.
The alternatives were evaluated using the criteria and sub-criteria at the lowest level of the decision tree as in Step 1 of the R-TOPSIS method. For the criterion efficiency and performance, the evaluation was based on the loading time for the first view and was assessed using the WebPageTest online platform [60]. For the availability and system flexibility criterion, response time was also measured using the Java-based site monitoring platform [61], which ran on our computer for seven consecutive days and checked website availability every 5 min. For the criterion hyperlink structure (presence of broken links on the page), all pages of the website were analyzed by Broken Link Checker [62]. Other criteria (criteria of readability and attractiveness and several sub-criteria of website design: graphics and layout, colors, and home page on one screen and usability: orientation and clarity, learnability, and intuitiveness) were more subjective, so these website criteria were rated by three experts (authors of the study). Their ratings were aggregated using the arithmetic mean method. In Step 4, the ratings were normalized, and in Step 6, they were multiplied by the criterion weights derived according to the AHP method (Figure 1). The positive ideal solution and the negative ideal solution were defined in Step 7. Steps 8–10 led to the Website Quality Index (WQI), which indicates the closeness to the ideal solution for each alternative and the ranking of the alternatives.
The WQIs were further analyzed using IBM SPSS Statistics V25. The arithmetic mean was used to calculate the average WQIs of four groups of companies in terms of size and sub-sectors. A Kolmogorov–Smirnov test was performed to check the normality of the data. The t-test of independent samples was used to test the differences in WQI between different enterprise sizes and sub-sectors.
5. Results and Discussion
5.1. Weights of Categories, Criteria, and Sub-Criteria
Figure 1 shows the hierarchical tree of criteria and sub-criteria with their local and global weights obtained by the AHP method.
The most important category is information quality (29.2%), followed by use (23.4%) and system quality (21.8%). Less important categories are design and service quality, with 13.0% and 12.6%, respectively.
In the information quality category, the most important criterion is up-to-dateness and accuracy (34.1%), followed by the products/services catalog page (32.6%). In third place is the picture/photo gallery (13.1%), and in fourth place is the company (12.0%), with contact details as the most important sub-criterion (56.3%). The least important criterion in the information quality category is industry-specific content (8.2%), which despite its last place, but considering the high importance of the information quality category, still contributes 2.4% to the total weight.
The use category consists of three criteria: ease of use (56.1%) as the most important criterion, followed by navigation (28.8%) and help availability (15.1%). The most important sub-criteria are orientation and clarity (55.5%) within the ease of use criterion, information on home page (44.3%) within the navigation criterion, and FAQ (75%) within the help availability criterion.
In the system quality category, two criteria are more important, namely efficiency and performance (40.0%) and availability and reliability (30.7%). Less important are accessibility and system flexibility (18.6%) and interactivity and multimedia capability (10.6%) with call to action—CTA (51.9%) as the most important sub-criterion.
In the design category, the first two criteria have similar weights: readability (38.9%) and webpage design (36.6%), while attractiveness (24.5%) is slightly less important. The most important sub-criteria of the webpage design criterion are style uniformity (35.0%) and graphics and layout (30.1%).
Functionality (72.3%), with the most important sub-criterion e-shop (68.6%), is decidedly more important in the category service quality than personalization (27.7%), with multilanguage (54.3%) as the most important sub-criterion.
When comparing the global weights of the criteria, the highest weight is achieved by ease of use (13.1%) from the category use, followed by up-to-dateness and accuracy with 10.0% and the products/services catalog page (9.5%), both of which belong to the most important category information quality. In fourth place is functionality with 9.1%, which belongs to the less important category service quality. Other important criteria with a global weight of more than 5% are efficiency and performance (8.7%), availability and reliability (6.7%), navigation (6.7%), and readability (5.1%).
The weighting of the nine criteria is further divided into the weighting of the sub-criteria. When comparing the global sub-criteria weights, the sub-criteria orientation and clarity (7.3%) and e-shop (6.2%) stand out, while the global weights of the majority of the sub-criteria (21 out of 28) are less than 2%, as can be expected with such a number of sub-criteria.
The alternatives are evaluated in terms of the criteria and sub-criteria at the lowest level of the hierarchy. Their global weights are presented in Table 7. The results of the model show that the criteria up-to-dateness and accuracy (10,0%), products/services catalog page (9.5%), and efficiency and performance (8.7%) are the most important at the lowest level of the hierarchy. In fourth place is the first sub-criterion orientation and clarity (7.3%). Of the 36 criteria and sub-criteria at the last level of the hierarchy, less than 20% account for more than half (53.3%) of the final weight. Two thirds of the 36 criteria and sub-criteria on the last level of the hierarchy have total weight of less than 3% and together account for less than one third (29.4%) of the final weight.
The results show that companies should pay attention to the quality of information when creating their websites. The information should be accurate and updated regularly. Their catalog page for products or services should be prepared carefully. Customers like websites that are easy to use and navigate, with key information on the home page. The section FAQ is welcomed. Loading and response times should be short, and the website should be prepared for mobile phones and tablets. In times of enforced social distance and lockdown (e.g., COVID-19 pandemic), an e-shop is preferable.
The objective of the proposed model is to evaluate the quality of a single website or a group of websites. With this intention, we identified five quality classes of websites (outstanding, good, average, acceptable, bad) based on the expected values of the criteria and sub-criteria of the model (Table 8).
An outstanding website should satisfy even the most demanding website visitor and may have only minor flaws. It should achieve the best possible score for the 10 most important criteria and subcriteria evaluated and an above-average score for the others (at least 3 if the scale range of criteria is 1–4 or 1–5 and at least 2 if the scale range of criteria is 1–2 or 1–3), resulting in a WQI of at least 0.842.
A good quality website should have at least the second highest score for the top 10 highest scoring criteria and subcriteria (at least 4 if the scale range of criteria is 1–5, at least 3 if the scale range of criteria is 1–4, and at least 2 if the scale range of criteria is 1–2 or 1–3) and an above average score for the others (at least 3 if the scale range of criteria is 1–4 or 1–5 and at least 2 if the scale range of criteria is 1–2 or 1–3), resulting in a WQI of at least 0.593. A good quality website should satisfy an average website visitor, but may also have some shortcomings that can influence purchase decisions. An in-depth what-if analysis to optimize the website is recommended, but not required.
An average website should have an above-average score for the top 10 criteria and sub-criteria assessed (at least 3 if the scale range of criteria is 1–4 or 1–5, and at least 2 if the scale range of criteria is 1–2 or 1–3) and at least 2 for the others, giving a WQI of at least 0.465. An average website represents a lower-quality website with many shortcomings. We recommend an in-depth what-if analysis to identify and address the main shortcomings of the website.
An acceptable website score for top 10 criteria and sub-criteria should be at least 2 if the scale range is 1–5, and at least 2 if the scale range is 1–2, 1–3, or 1–4, and at least a score of 2 for the others, resulting in a WQI of at least 0.350.
WQI values below 0.350 indicate poor quality, as this value means that at least one of the most important criteria is rated poorly or many important criteria receive only an acceptable score.
5.2. Wood Industry Websites Evaluation
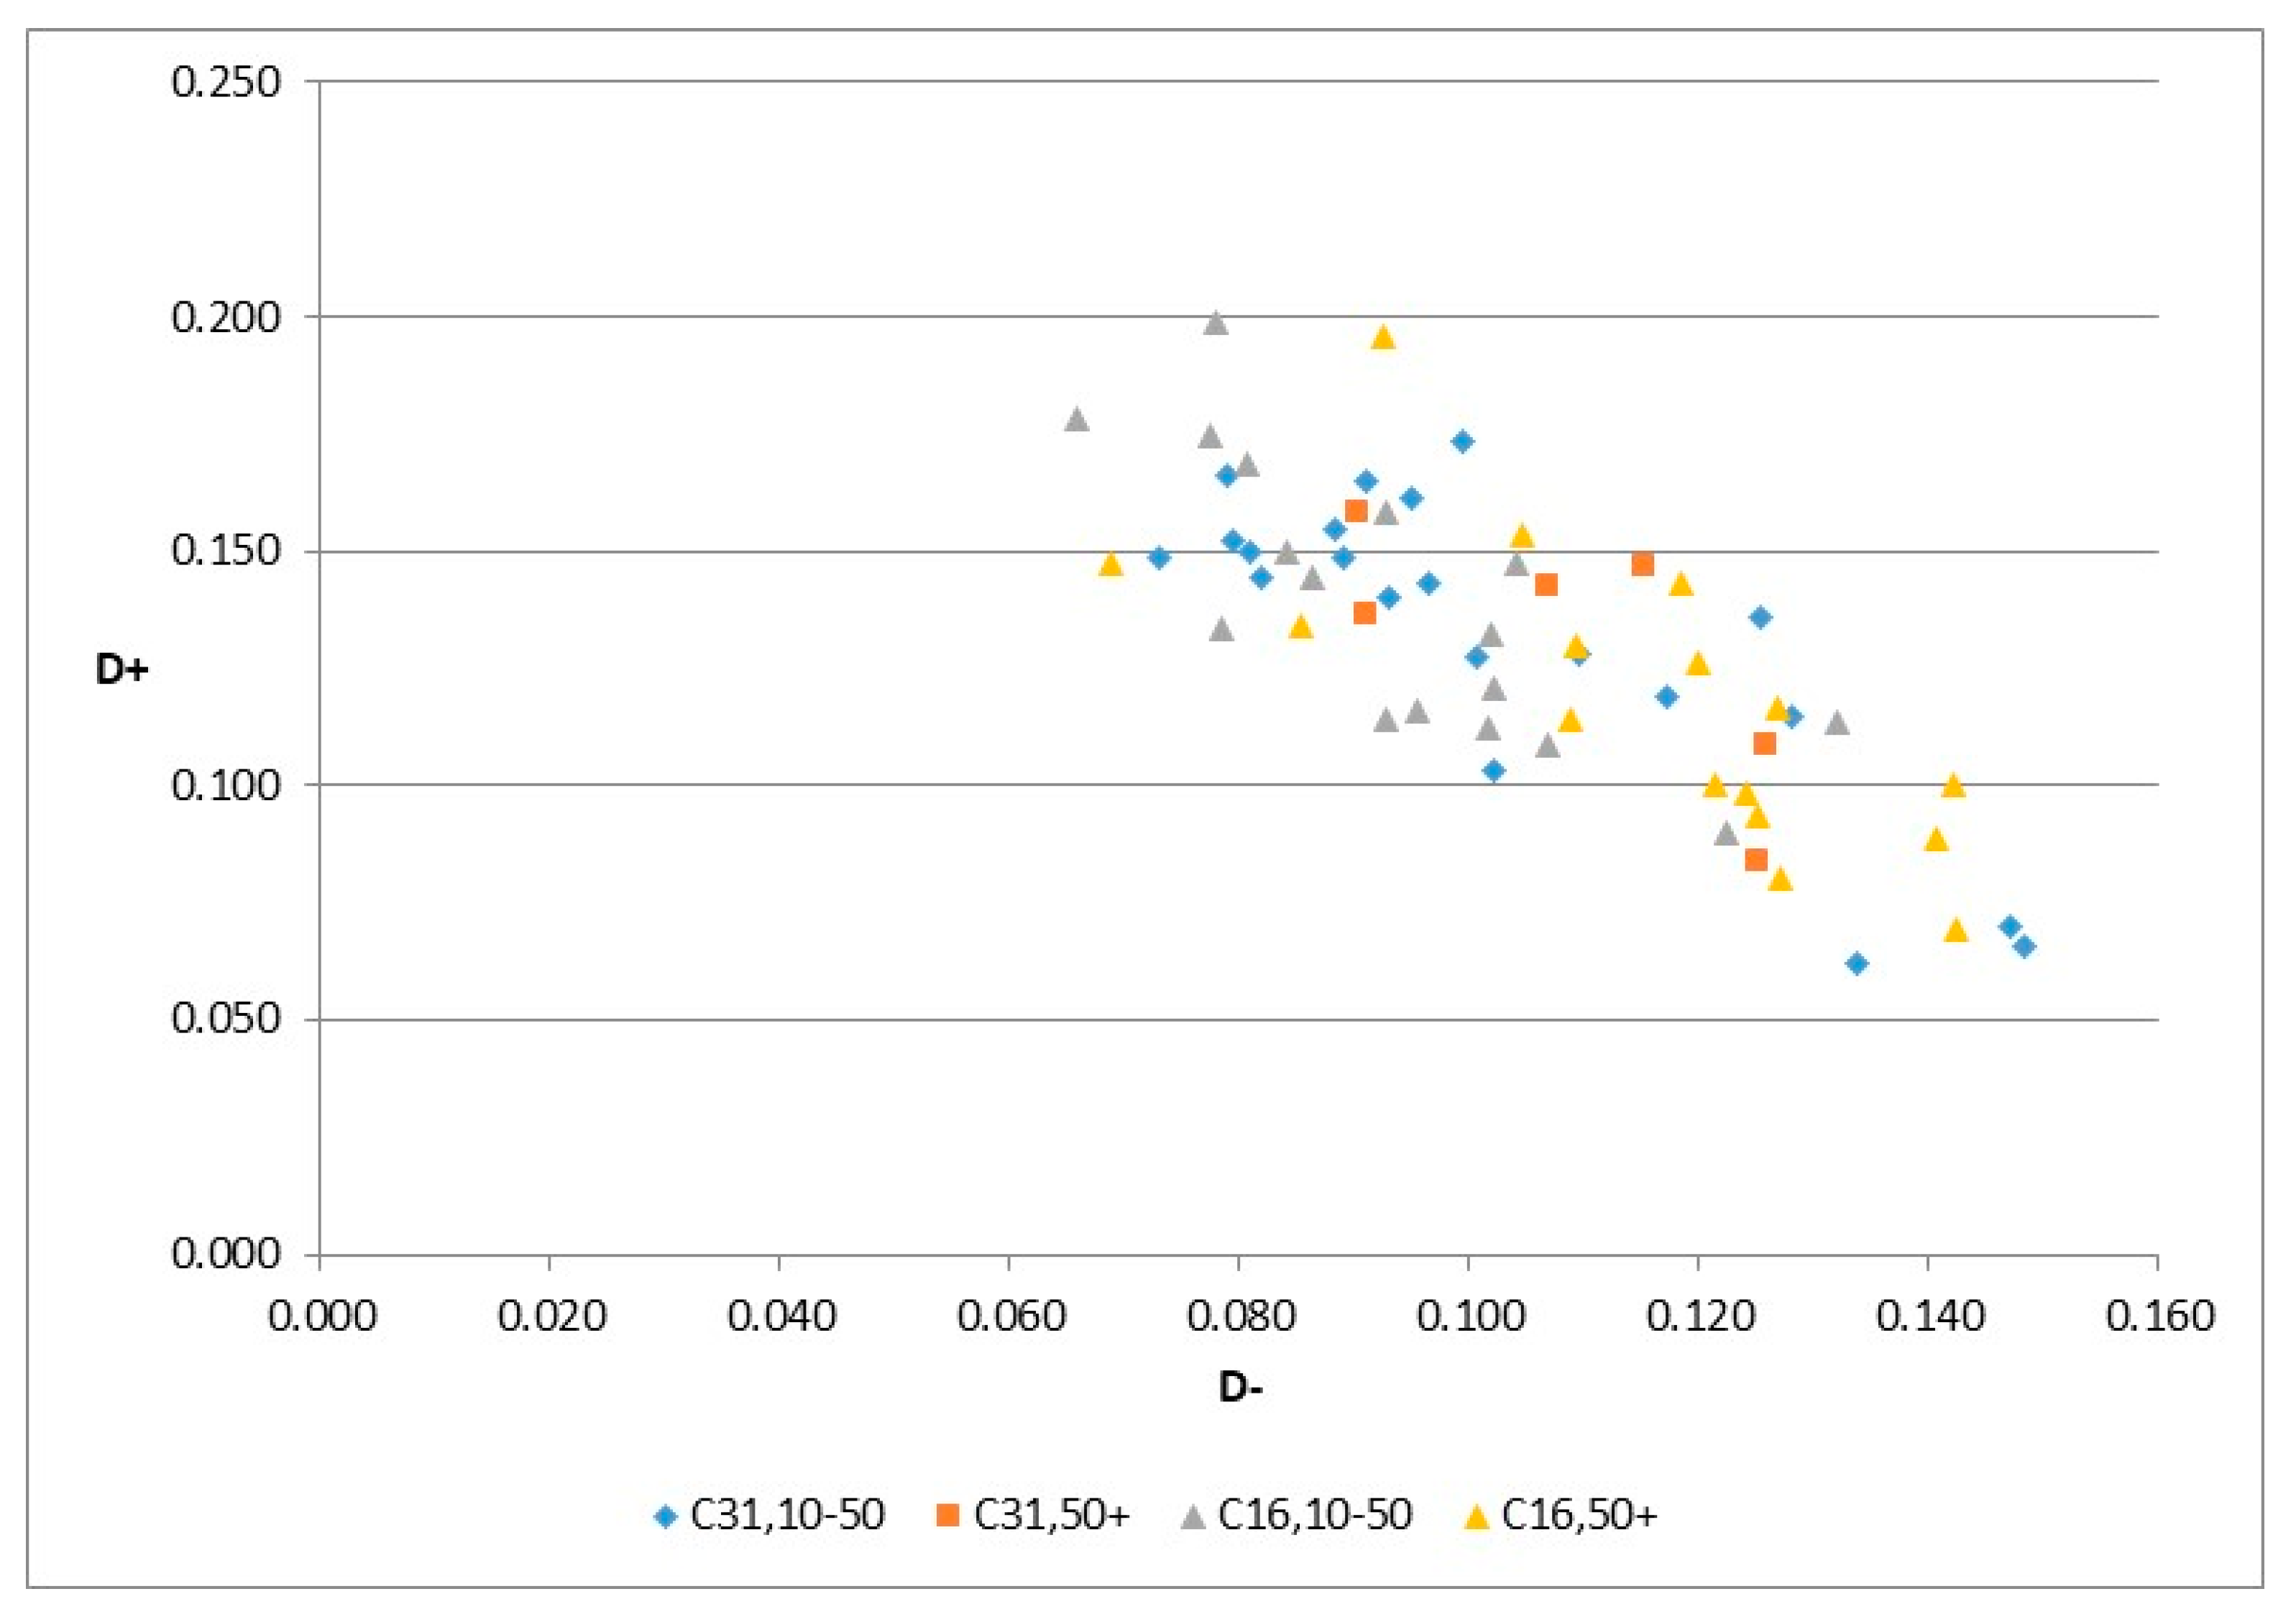
The results of the website evaluation of 60 wood industry companies are shown in Figure 2 and Figure 3. Figure 2 shows the distances of the companies’ website evaluations from the negative ideal solution (Equation (11)) and the positive ideal solution (Equation (10)). The company has a better rating if it has a smaller distance from the positive ideal solution (lies at the bottom of the graph) and a larger distance from the negative ideal solution (lies on the right side of the graph). The alternatives are presented in four groups: companies with 10–50 employees from sub-sector C31, companies with more than 50 employees from sub-sector C31, companies with 10–50 employees from sub-sector C16, and companies with more than 50 employees from sub-sector C16.
The results (Figure 2) show that the best websites have larger companies operating in sub-sector C16 and smaller companies operating in sub-sector C31.
Figure 3 shows the WQI of the four groups of wood industry companies. There are significant differences in WQI values between companies and also between groups of companies. The best evaluated website has a WQI of 0.692.
Comparing the results of the four groups (Figure 3) of companies, companies with more than 50 employees from subsector C16 received the highest average WQI value (0.500), followed by companies with more than 50 employees from subsector C31 (0.461). Companies with 10 to 50 employees received a lower average value of CC: the average value for the subsector C31 was 0.442 and for C16, 0.409. Statistical analysis showed that there are significant differences in the quality of websites depending on the size of companies (independent samples t-test, equal variances not assumed, df = 45.72, t = −0.28, p = 0.027). The websites of bigger companies are better: the average WQI was 0.490 for companies with more than 50 employees and 0.427 for companies with 10–50 employees. There is no difference in the website quality between subsectors. Subsector C16 has an average of 0.453, while C31′s average is 0.447.
Regarding the quality classes of websites (Table 8), only one third of the evaluated websites of wood industry companies were classified as good (seven companies) or as average (16 companies), while almost half of them (28 companies) were classified as acceptable, with significant shortcomings. 15% of websites (nine companies) were rated as bad websites, with many deficiencies. The average WQI of all evaluated websites was 0.450, which falls into the class of acceptable websites. These results show that the websites of wood industry companies are, on average, of rather low quality and need many improvements.
The final average normalized score ANS of the alternatives was 0.551, which is just over half, with 1 being the maximum possible score. The companies achieved similar ANS in use (0.623), design (0.605), system quality (0.594), and information quality (0.584). The alternatives achieved a very low ANS in service quality (0.209), which means that improvement in this area can help to improve the quality of their websites.
Within the use category, the highest ANS was achieved in ease of use (0.709) as the most important criterion in this category. The alternatives have high ANS in relation to all three sub-criteria (between 0.65 and 0.81). Alternatives received good ANS in terms of information on the home page (0.624), which was reduced by the poor performance in the search options sub-criterion (0.133). Companies received lower scores for the criterion help availability (0.297) with a low ANS in FAQs (0.383) and even lower in online help (0.033).
The alternatives were rated as very good according to the criteria in the design category; the highest ANS was achieved in style uniformity (0.933), with only one exception: homepage size (0.150).
In the categories system quality and information quality, the alternatives scored relatively well on all criteria and sub-criteria.
The alternatives achieved low ANS with respect to all criteria and sub-criteria in the Service quality category. The only exception was the multilanguage sub-criterion (0.561), but even this rating may not be reliable, as multilingualism can be provided by Google Translator, which is not very good for the Slovenian language. The Client Profile Identification (IP) cannot be evaluated correctly from Slovenia, so it was not evaluated, and its ANS is 0.
In summary, to improve the quality of their website, the evaluated companies should mainly improve the search functions, the size of the home page, and the stability and availability of the website. They should also improve the online help, the section FAQ, and all aspects of service quality.
Compared to the bigger companies with more than 50 employees, the companies with 10 to 50 employees received better scores in the system quality category, especially for the following criteria: accessibility and system flexibility, as well as availability and reliability. The reason lies in simpler and less complex websites with less functionality in smaller companies, and therefore the responsiveness of the sites is better. In the future, an improvement of these criteria in larger companies is expected, as most Slovenian wood companies consider the migration of information services to the cloud as an important strategic step in the digitalization of the business [63].
There is also a big difference in the e-shop criteria, where again the ratings are better for smaller companies. The reason for this difference is to be found in the focus of smaller companies on the end customer, while larger companies are mostly involved in retail chains or mainly operate B2B, and the e-shop does not play a major role.
Compared to companies with 10 to 50 employees, bigger companies with more than 50 employees received higher scores for the following criteria: industry research reports, expert tips, FAQs, news, and social media. The result is to be expected, as large companies are systematic about promoting and raising awareness of the company and the industry as a whole, as this ensures their long-term success both domestically and in the international market. To this end, most of these companies have an organized PR activity. For smaller companies, these things are not so strategic, and also the distribution and sales channels are different, so there is no need for website improvements in these areas. The same applies to the multilanguage criterion, which is especially important for large companies operating in international markets and is also much better implemented on websites. The values of the other criteria do not differ significantly depending on the size of the company.
6. Discussion and Conclusions
The main contribution of this research is a comprehensive model for evaluating the performance of industry websites with a particular focus on the wood industry. From a methodological perspective, the main contribution of this paper is a novel hybrid group AHP method that promotes homogeneity among the group of decision-makers. Since conflicting opinions may affect the consistency and reliability of group evaluation, a certain degree of homogeneity among experts is desirable. The decision support model combining AHP SP-WGMDEA with R-TOPSIS is a novelty in the field of website evaluation. However, it can also be applied to other fields related to wood and wood products where the performance of objects should be evaluated with respect to multiple criteria. The model consists of three levels: categories, criteria, and sub-criteria. In total, there are 50 different cornerstones in the model, with 36 criteria and sub-criteria to be evaluated. Some of them can be objectively assessed and measured by using some web services (e.g., efficiency, response time, etc.), but the others require a personal evaluation, where a group of evaluators is recommended. To define the model, the AHP framework was used to prioritize the criteria and sub-criteria according to their importance to the website quality. Based on the results, the quality of information and its accuracy are the most important aspects of the websites. Because industry websites focus on selling products or services, creating a catalog site requires a lot of attention. A good website should be easy to use and navigate. The most important information should be gathered on the home page. Online help, including the FAQ section, should be well organized. The website should be adapted for phone and tablet users, and loading and response times should be short. In the era of rapid development of the digital society based on the fourth industrial revolution and the forced social distancing due to the COVID-19 pandemic, companies are encouraged to open an e-shop. The interpretation of the results should take into account the different importance of the criteria and sub-criteria for the quality of the website.
With regard to the usability of the model, its suitability for evaluating both a single website and/or a group of websites, and its simplicity, the model was further developed by introducing the Website Quality Index (WQI). It shows for each alternative the closeness to the ideal solution, the ranking of the alternatives, and the classification of the website in one of the quality classes: outstanding, good, average, acceptable, or bad (Table 8). Thus, we have achieved the ultimate goal of the research, to develop an index to measure the quality of websites (based on the analogy of the WAI (Web Assessment Index) set by Miranda and Bañegil (2004)). The main difference from the other indices is that our model has a comprehensive content background (36 criteria and sub-criteria) and strong mathematical foundations.
The model can therefore be used for the evaluation of commercial websites of companies in all industries. While R-TOPSIS is well suited for evaluating a larger group of websites from the same industry, it is also suitable when a single company wants to evaluate its website. Although our model is suitable for evaluating websites from different industries, we must emphasize that the comparison between websites is only meaningful when comparing websites from the same industry. Only when comparing websites from the same industry can we compare the ratings of information quality categories that are industry-specific.
The model was used to assess the quality of 60 websites of wood industry companies with the highest credit appraisal grade, with ten or more employees, operating in C31 (manufacturing of furniture) and C16 (wood processing other than furniture). The results show that the average quality of the websites is low to moderate. The average WQI of all evaluated websites was 0.450, indicating only an acceptable website. The final ANS was only 0.551, where 1 is the maximum possible score. As expected, website quality of larger companies is higher, which was also confirmed statistically. However, the low scores of WQI and ANS require numerous improvements in all evaluated websites. Website navigation, availability of help, and quality of service are the criteria with the lowest scores and the greatest potential for improvement. Due to the shortcomings of websites identified in this research, companies of all sizes will also receive government support for website renovation through the digital marketing voucher mechanism announced in 2021 and valid until 2023 [64].
Based on the model implementation to evaluate the website quality of companies in the wood industry, some conclusions can be drawn. The model is easy to use, but at the same time comprehensive, with a clear mathematical background combining AHP with R-TOPSIS, which is a novelty in the field of website evaluation. The final result of applying the model is the WQI, which can be used for independent evaluation of a single website and/or for evaluation of a larger group of websites from the same industry or even from many industries. The model using WQI provides an important tool for website developers in developing and/or improving website quality, especially through what-if analysis and benchmarking. Website quality has recently become extremely important as companies shift their activities to the internet environment due to the rapid development of the digital society, the implementation of the latest concepts of Industry 4.0 in their daily and strategic activities, and the forced social distancing and isolation due to the COVID-19 pandemic.
In future research, the developed model can be used to evaluate websites of companies in all industries and benchmark the results. In this way, the performance of any industry in the Internet environment can be assessed, and its focus on online activities can be evaluated.
Author Contributions
Conceptualization, J.K., P.G., L.O., and M.J.; investigation, J.K.; methodology, J.K., P.G., and M.J.; validation, P.G.; formal analysis, P.G.; resources, J.K., P.G., and M.J.; data curation, P.G. and M.J.; writing—original draft preparation, J.K.; writing—review and editing, J.K., P.G., L.O., and M.J.; visualization, M.J. All authors have read and agreed to the published version of the manuscript.
Funding
This work was supported by the Slovenian Research Agency (research core funding No. P4–0015 and P4–0059).
Institutional Review Board Statement
Not applicable.
Informed Consent Statement
Not applicable.
Data Availability Statement
The entire set of raw data presented in this study is available on request from the corresponding author.
Conflicts of Interest
The authors declare no conflict of interest.
References
- Kane, G.C.; Phillips, A.N.; Copulsky, J.; Nanda, R. A Case of Acute Disruption: Digital Transformation through the Lens of COVID-19 | Deloitte Insights. Available online: https://www2.deloitte.com/us/en/insights/topics/digital-transformation/digital-transformation-COVID-19.html (accessed on 25 September 2020).
- Schroeck, M.; Kwan, A.; Kawamura, J.; Stefanita, C.; Sharma, D. Digital Industrial Transformation: Reinventing to Win in Industry 4.0. Available online: https://www2.deloitte.com/us/en/insights/focus/industry-4-0/digital-industrial-transformation-industrial-internet-of-things.html (accessed on 25 September 2020).
- Leiner, B.M.; Cerf, V.G.; Clark, D.D.; Kahn, R.E.; Kleinrock, L.; Lynch, D.C.; Postel, J.; Roberts, L.G.; Wolff, S. A Brief History of the Internet. SIGCOMM Comput. Commun. Rev. 2009, 39, 22–31. [Google Scholar] [CrossRef]
- Fisher, C.M.; Arnold, K. Is Your Business Website Effective? J. Promot. Manag. 2003, 9, 45–55. [Google Scholar] [CrossRef]
- Cebi, S. Determining Importance Degrees of Website Design Parameters Based on Interactions and Types of Websites. Decis. Support Syst. 2013, 54, 1030–1043. [Google Scholar] [CrossRef]
- Cook, A.V.; Bechtel, M.; Anderson, S.; Novak, D.R.; Nodi, N.; Parekh, J. The Spatial Web and Web 3.0: What Business Leaders Should Know about the next Era of Computing. Available online: https://www2.deloitte.com/us/en/insights/topics/digital-transformation/web-3-0-technologies-in-business.html (accessed on 25 September 2020).
- Rababah, O.M.A.; Masoud, F.A. Key Factors for Developing a Successful E-Commerce Website. Commun. IBIMA 2010, 2010, 9. [Google Scholar] [CrossRef]
- Chagharvand, A.; Babu, D.K.N. Elements That Impact Customer Satisfaction of A Website’s Quality. Aust. J. Basic Appl. Sci. 2012, 13, 299–301. [Google Scholar]
- Rocha, Á. Framework for a Global Quality Evaluation of a Website. Online Inf. Rev. 2012, 36, 374–382. [Google Scholar] [CrossRef]
- W3C Standards—W3C. Available online: https://www.w3.org/standards/ (accessed on 4 June 2020).
- BDC Free Website Evaluation. Available online: https://www.bdc.ca/en/articles-tools/entrepreneur-toolkit/business-assessments/pages/free-website-evaluation.aspx (accessed on 8 June 2020).
- Nibbler Nibbler—Test Any Website. Available online: https://nibbler.silktide.com/ (accessed on 2 July 2020).
- Dynatrace Synthetic Monitoring & Testing Tools. Available online: https://www.dynatrace.com/platform/synthetic-monitoring/ (accessed on 8 June 2020).
- Tarafdar, M.; Zhang, J. Analysis of Critical Website Characteristics: A Cross-Category Study of Successful Websites. J. Comput. Inf. Syst. 2006, 46, 14–24. [Google Scholar] [CrossRef]
- Lee, S.; Koubek, R.J. The Effects of Usability and Web Design Attributes on User Preference for E-Commerce Web Sites. Comput. Ind. 2010, 61, 329–341. [Google Scholar] [CrossRef]
- Hu, C.; Zhao, Y.; Guo, M. AHP and CA Based Evaluation of Website Information Service Quality: An Empirical Study on High-Tech Industry Information Center Web Portals. J. Serv. Sci. Manag. 2009, 2, 720–726. [Google Scholar] [CrossRef] [Green Version]
- Lee, Y.; Kozar, K.A. Investigating the Effect of Website Quality on E-Business Success: An Analytic Hierarchy Process (AHP) Approach. Decis. Support Syst. 2006, 42, 1383–1401. [Google Scholar] [CrossRef]
- Lin, H.-F. An Application of Fuzzy AHP for Evaluating Course Website Quality. Comput. Educ. 2010, 54, 877–888. [Google Scholar] [CrossRef]
- Yu, X.; Guo, S.; Guo, J.; Huang, X. Rank B2C E-Commerce Websites in e-Alliance Based on AHP and Fuzzy TOPSIS. Expert Syst. Appl. 2011, 38, 3550–3557. [Google Scholar] [CrossRef]
- Petter, S.; DeLone, W.; McLean, E.R. Information Systems Success: The Quest for the Independent Variables. J. Manag. Inf. Syst. 2013, 29, 7–62. [Google Scholar] [CrossRef]
- Tsai, W.-H.; Chou, W.-C.; Lai, C.-W. An Effective Evaluation Model and Improvement Analysis for National Park Websites: A Case Study of Taiwan. Tour. Manag. 2010, 31, 936–952. [Google Scholar] [CrossRef]
- Delone, W.H.; McLean, E.R. The DeLone and McLean Model of Information Systems Success: A Ten-Year Update. J. Manag. Inf. Syst. 2003, 19, 9–30. [Google Scholar] [CrossRef]
- Hernández, B.; Jiménez, J.; Martín, M.J. Key Website Factors in E-Business Strategy. Int. J. Inf. Manag. 2009, 29, 362–371. [Google Scholar] [CrossRef]
- Lathiras, P.; Zopidou, A.; Mylonakis, J.; Tahinakis, P.; Protogeros, N.; Valachis, I. An Evaluation of Websites Quality Factors in Agro Travel and Ecotourism. Tour. Hosp. Manag. 2010, 16, 11–30. [Google Scholar]
- Wu, C.-M.; Hsieh, C.-L.; Chang, K.-L. A Model for Assessing the Service Quality of University Library Websites. Math. Probl. Eng. 2013, 2013, e363486. [Google Scholar] [CrossRef] [Green Version]
- Miranda González, F.J.; Bañegil Palacios, T.M. Quantitative Evaluation of Commercial Web Sites:: An Empirical Study of Spanish Firms. Int. J. Inf. Manag. 2004, 24, 313–328. [Google Scholar] [CrossRef]
- Miranda, F.J.; Cortés, R.; Barriuso, C. Quantitative Evaluation of E-Banking Web Sites: An Empirical Study of Spanish Banks. Electron. J. Inf. Syst. Eval. 2006, 9, 73–81. [Google Scholar]
- Ranković, M.; Vasković, V. Quantitative Website Analysis: Case Study of the Serbian Banks. Industrija 2011, 39, 29–49. [Google Scholar]
- Vaucher, S.; Moulart, A.; Sahraoui, H.; Habra, N. Automated Evaluation of Website Navigability: An Empirical Validation of Multilevel Quality Models. J. Softw. Evol. Process 2013, 25, 815–839. [Google Scholar] [CrossRef]
- Li, R.; Sun, T. Assessing Factors for Designing a Successful B2C E-Commerce Website Using Fuzzy AHP and TOPSIS-Grey Methodology. Symmetry 2020, 12, 363. [Google Scholar] [CrossRef] [Green Version]
- Aydin, S.; Kahraman, C. Evaluation of E-Commerce Website Quality Using Fuzzy Multi-Criteria Decision Making Approach. IAENG Int. J. Comp. Sci. 2012, 39, 64–70. [Google Scholar]
- Liang, R.; Wang, J.; Zhang, H. Evaluation of E-Commerce Websites: An Integrated Approach under a Single-Valued Trapezoidal Neutrosophic Environment. Knowl. Based Syst. 2017, 135, 44–59. [Google Scholar] [CrossRef]
- Alptekin, N.; Hall, E.E.; Sevim, N. Evaluation of Websites Quality Using Fuzzy TOPSIS Method. Int. J. Acad. Res. Bus. Soc. Sci. 2015, 5, 221–242. [Google Scholar] [CrossRef]
- Akincilar, A.; Dagdeviren, M. A Hybrid Multi-Criteria Decision Making Model to Evaluate Hotel Websites. Int. J. Hosp. Manag. 2014, 36, 263–271. [Google Scholar] [CrossRef]
- Ostovare, M.; Shahraki, M.R. Evaluation of Hotel Websites Using the Multicriteria Analysis of PROMETHEE and GAIA: Evidence from the Five-Star Hotels of Mashhad. Tour. Manag. Perspect. 2019, 30, 107–116. [Google Scholar] [CrossRef]
- Pamučar, D.; Stević, Ž.; Zavadskas, E.K. Integration of Interval Rough AHP and Interval Rough MABAC Methods for Evaluating University Web Pages. Appl. Soft Comput. 2018, 67, 141–163. [Google Scholar] [CrossRef]
- Özkan, B.; Özceylan, E.; Kabak, M.; Dağdeviren, M. Evaluating the Websites of Academic Departments through SEO Criteria: A Hesitant Fuzzy Linguistic MCDM Approach. Artif. Intell. Rev. 2020, 53, 875–905. [Google Scholar] [CrossRef]
- Perçin, S. A Combined Fuzzy Multicriteria Decision-Making Approach for Evaluating Hospital Website Quality. J. Multi Crit. Decis. Anal. 2019, 26, 129–144. [Google Scholar] [CrossRef]
- Ecer, F. A Hybrid Banking Websites Quality Evaluation Model Using AHP and COPRAS-G: A Turkey Case. Technol. Econ. Dev. Econ. 2014, 20, 758–782. [Google Scholar] [CrossRef]
- Liang, D.; Zhang, Y.; Xu, Z.; Jamaldeen, A. Pythagorean Fuzzy VIKOR Approaches Based on TODIM for Evaluating Internet Banking Website Quality of Ghanaian Banking Industry. Appl. Soft Comput. 2019, 78, 583–594. [Google Scholar] [CrossRef]
- Saaty, T.L. The Analytic Hierarchy Process; McGraw-Hill: New York, NY, USA, 1980. [Google Scholar]
- Hwang, C.-L.; Yoon, K. Methods for Multiple Attribute Decision Making. In Multiple Attribute Decision Making: Methods and Applications A State-of-the-Art Survey; Springer: Berlin/Heidelberg, Germany, 1981; pp. 58–191. ISBN 978-3-642-48318-9. [Google Scholar]
- De Aires, R.F.F.; Ferreira, L. A New Approach to Avoid Rank Reversal Cases in the TOPSIS Method. Comput. Ind. Eng. 2019, 132, 84–97. [Google Scholar] [CrossRef]
- Saaty, T.L. There Is No Mathematical Validity for Using Fuzzy Number Crunching in the Analytic Hierarchy Process. J. Syst. Sci. Syst. Eng. 2006, 15, 457–464. [Google Scholar] [CrossRef]
- Chan, H.K.; Sun, X.; Chung, S.-H. When Should Fuzzy Analytic Hierarchy Process Be Used Instead of Analytic Hierarchy Process? Decis. Support Syst. 2019, 125, 113114. [Google Scholar] [CrossRef]
- Saaty, T.L. Fundamentals of Decision Making and Priority Theory with the Analytic Hierarchy Process; RWS Publications: Pittsburgh, PA, USA, 2006. [Google Scholar]
- Grošelj, P. Symmetric Projection Group Approach for Promoting Homogeneity in the Analytic Hierarchy Process. Comput. Oper. Res. 2021, 133, 17. [Google Scholar] [CrossRef]
- Grošelj, P.; Pezdevšek Malovrh, Š.; Zadnik Stirn, L. Methods Based on Data Envelopment Analysis for Deriving Group Priorities in Analytic Hierarchy Process. Cent. Eur. J. Oper. Res. 2011, 19, 267–284. [Google Scholar] [CrossRef]
- Kuzman, M.K.; Grošelj, P.; Ayrilmis, N.; Zbašnik-Senegačnik, M. Comparison of Passive House Construction Types Using Analytic Hierarchy Process. Energy Build. 2013, 64, 258–263. [Google Scholar] [CrossRef]
- Oblak, L.; Glavonjić, B. A Model for the Evaluation of Radio Advertisements for the Sale of Timber Products. Drvna Ind. Znan. Čas. Pitanja Drvne Tehnol. 2015, 65, 303–308. [Google Scholar] [CrossRef]
- Oblak, L.; Barcic, A.P.; Klaric, K.; Kuzman, M.K.; Groselj, P. Evaluation of Factors in Buying Decision Process of Furniture Consumers by Applying AHP Method. Drvna Ind. 2017, 68, 37–43. [Google Scholar] [CrossRef]
- Ouenniche, J.; Pérez-Gladish, B.; Bouslah, K. An Out-of-Sample Framework for TOPSIS-Based Classifiers with Application in Bankruptcy Prediction. Technol. Forecast. Soc. Chang. 2018, 131, 111–116. [Google Scholar] [CrossRef] [Green Version]
- Parkan, C.; Wu, M.-L. Process Selection with Multiple Objective and Subjective Attributes. Prod. Plan. Control 1998, 9, 189–200. [Google Scholar] [CrossRef]
- Kuan, H.-H.; Bock, G.-W.; Vathanophas, V. Comparing the Effects of Website Quality on Customer Initial Purchase and Continued Purchase at E-Commerce Websites. Behav. Inf. Technol. 2008, 27, 3–16. [Google Scholar] [CrossRef]
- Topaloglu, H.; Gumussoy, C.A.; Bayraktaroglu, A.E.; Calisir, F. The Relative Importance of Usability and Functionality Factors for E-Health Web Sites. Hum. Factors Ergon. Manuf. Serv. Ind. 2013, 23, 336–345. [Google Scholar] [CrossRef]
- Lin, Y.J. Evaluation Factors Influencing Corporate Website Effectiveness. J. Glob. Bus. Manag. 2013, 9, 42–51. [Google Scholar]
- Gharibi, H.; Mahvi, A.H.; Nabizadeh, R.; Arabalibeik, H.; Yunesian, M.; Sowlat, M.H. A Novel Approach in Water Quality Assessment Based on Fuzzy Logic. J. Environ. Manag. 2012, 112, 87–95. [Google Scholar] [CrossRef] [PubMed]
- Goepel, K.D. Implementing the Analytic Hierarchy Process as a Standard Method for Multi-Criteria Decision Making in Corporate Enterprises—A New AHP Excel Template with Multiple Inputs. In Proceedings of the 12th International Symposium on the Analytic Hierarchy Process, Kuala Lumpur, Malaysia, 23–26 June 2013; p. 10. [Google Scholar] [CrossRef] [Green Version]
- Bisnode Bonitete.Si—Bonitetne Informacije Podjetij. Available online: https://bonitete.bisnode.si (accessed on 8 April 2019).
- WebPageTest WebPageTest—Website Performance and Optimization Test. Available online: https://webpagetest.org/ (accessed on 8 May 2019).
- Pinkas, J. Site Monitoring. Available online: https://sourceforge.net/projects/sitemonitoring/ (accessed on 9 May 2020).
- Broken Link Check. Available online: https://www.brokenlinkcheck.com/ (accessed on 8 April 2019).
- Kropivšek, J.; Grošelj, P. Digital Development of Slovenian Wood Industry. Drvna Ind. Znan. Čas. Pitanja Drvne Tehnol. 2020, 71, 139–148. [Google Scholar] [CrossRef]
- Vavčer Za Digitalni Marketing—Dih. Available online: https://dihslovenia.si/vavcerji/vavcer-za-digitalni-marketing (accessed on 19 May 2021).
Figure 1.
Hierarchical tree of the websites evaluation model with categories, criteria, and sub-criteria weights determined using the AHP method (legend: global weights are blue, local weights are red, average normalized scores are green).
Figure 1.
Hierarchical tree of the websites evaluation model with categories, criteria, and sub-criteria weights determined using the AHP method (legend: global weights are blue, local weights are red, average normalized scores are green).

Figure 2.
Distances of website evaluations of companies in the wood industry from the negative ideal solution and from the positive ideal solution. Legend: C31,10–50 (companies with 10–50 employees from sub-sector C31); C31,50+ (companies with more than 50 employees from sub-sector C31); C16,10–50 (companies with 10–50 employees from sub-sector C16), C16,50+ (companies with more than 50 employees from sub-sector C16).

Figure 3.
WQI of wood industry companies, distributed in four groups. Legend: C31,10–50 (companies with 10–50 employees from sub-sector C31); C31,50+ (companies with more than 50 employees from sub-sector C31); C16,10–50 (companies with 10–50 employees from sub-sector C16), C16,50+ (companies with more than 50 employees from sub-sector C16).


Table 1.
Criteria and sub-criteria with explanation of the first category, system quality.
| Criterion | Explanation | Sub-Criterion | Explanation | Reference |
|---|---|---|---|---|
| Efficiency and performance | The timeliness with which the website responds to the user: load time, response time | [5,7,9,16,17,18,20,21,22,24,54,55] | ||
| Accessibility and system flexibility | The access to materials and the extent of website accessibility to users through different browsers and clients (PC, tablet, phone) | [5,7,18,20,21,22,24] | ||
| Availability and reliability | The extent to which the website remains available and working; stability of a system. | [5,7,9,17,18,20,22] | ||
| Interactivity and multimedia capability | Multimedia capability and interactivity options on the website. | Social media | Link to various social media services with evaluation of activity | [7] |
| Additional (internet) applications | Integration of various communication services (Skype), interactive maps, video players, etc. | [7,18] | ||
| Call to action—CTA | Ability to take action: interactive pages that encourage user participation from the outset | [7,20,22,24,54] |
Table 2.
Criteria and sub-criteria with explanation of the second category, information quality.
| Criterion | Explanation | Sub-Criterion | Explanation | Reference |
|---|---|---|---|---|
| Products/ services catalog page | Information about the offer (catalogs, interactive catalogs, price lists) | [7,16,20,56] | ||
| Picture/photo gallery | Development of picture/photo gallery | [18,24,54] | ||
| Industry specific content | Content related to specific industry needs | Industry research reports | Scientific and professional reports, articles and reviews | [16,20] |
| Expert tips | Expert tips for customers and wide audience | [22,24] | ||
| Company | Important and quality information about company and contacts | About company | Range of basic information about company (references, vision, history) | |
| Terms and conditions | Detailed description of terms and conditions | |||
| Contact details | Range of contact details (address, e-mail addresses, telephone numbers, working hours) | [5] | ||
| Credential validation | Providing credential information (certifications, associations, credit rating, etc.) | [9,17] | ||
| Up-to-dateness and accuracy | Refers to up-to-date and correct information | [5,7,16,18,20,21] | ||
Table 3.
Criteria and sub-criteria with explanation of the third category, service quality.
| Criterion | Explanation | Sub-Criterion | Explanation | Reference |
|---|---|---|---|---|
| Functionality | Functionality and additional services availability | E-shop | E-shop development | [7,54,56] |
| Guest book | Guest book presence | [7] | ||
| News | News options presence | |||
| Personalization | Individualized interface and customized service | Multi language | Availability of different language options | |
| Automatic Client Profile Identification | Client profile identification based on browsers cookies, identifying IP of client, etc. | [57] | ||
| Manual Client Profile Identification | Client profile identification based on user registration log in | [9,17,21,22,55] |
Table 4.
Criteria and sub-criteria with explanation of the fourth category, design.
| Criterion | Explanation | Sub-Criterion | Explanation | Reference |
|---|---|---|---|---|
| Webpage design | Consistency of layout | Style uniformity | Style uniformity of all subpages | [5,24,54] |
| Graphics and layout | Visual organization and use of graphic elements | [5,18,24] | ||
| Colors | Combination and harmony of colors | [24] | ||
| Home page size | Home page on one screen, without having to make the effort of scrolling up and down | [18,24,56] | ||
| Readability | Contrast and font size | [7,24] | ||
| Attractiveness | Attractiveness according to the contemporary trends | [7,21,24] |
Table 5.
Criteria and sub-criteria with explanation of the fifth category, use.
| Criterion | Explanation | Sub-Criterion | Explanation | Reference |
|---|---|---|---|---|
| Ease of use | Adaptability of users to the structure of the website | Orientation and clarity | Simplicity of orientation | [7] |
| Learnability | Time to adapt to the site structure | [5,7,18,55] | ||
| Intuitiveness | Intuitive site structure and titles | [20] | ||
| Navigation | Simplicity of navigation around the site | Information on home page | Important information and news on home page | [56] |
| Search Options | Search options field on the site | [9,16,54,55] | ||
| Depth of site | Number of subpages | [9] | ||
| Hyperlink structure | Effective hyperlink structure | [7,9,16,21] | ||
| Help availability | Help options for users | Online help | Instant assistance service through internet | [5,7] |
| FAQs | Intuitiveness of frequently asked questions structure |
Table 6.
Evaluation scales for criteria and sub-criteria on the lowest level of hierarchy.
| Criterion or Sub-Criterion | 1 | 2 | 3 | 4 | 5 |
|---|---|---|---|---|---|
| Efficiency and performance | Very slow page loading (more than 10 s) | Slow page loading (7–10 s) | Moderate page loading (4–7 s) | Fast page loading (2–4 s) | Very fast page loading (up to 2 s) |
| Accessibility and system flexibility | Fixed page width | Dynamic width—depends on the width of the open window | |||
| Availability and reliability | Availability less than 100% | The page is always accessible 100% | |||
| Social media | It does not exist | One social network (SN), but not active | Two inactive SN or one active SN | Three not active SN or two active SN | Four or more active SN |
| Additional (internet) applications | Does not have | Requires additional application installation | Needs standard applications | ||
| Call to action—CTA | It does not exist | It exists but it is “hidden” | It exists | ||
| Products/services catalog page | It does not exist | Basic descriptions and type images of products | More detailed technical specifications and description of functionality | Detailed product catalog—as a pdf catalog for download or online browsing | An interactive catalog with advanced features of the composition of elements in the final product |
| Picture/photo gallery | It does not exist | Basic photo gallery unstructured—each image clicking separately | Basic photo gallery structured—each image clicking separately | Gallery is structured, viewing multiple images by scrolling | |
| Industry research reports | It does not exist | One of: scientific and professional reports, articles, and reviews | At least two of: scientific and professional reports, articles, and reviews | ||
| Expert tips | It does not exist | It exists | |||
| About company | It does not exist | Full company name, address, VAT, registration number | 2 + one of: references/history, goals/vision, leadership | 2 + two of: references/history, goals/vision, leadership | 2 + all: references/history, goals/vision, leadership |
| Terms and conditions | There are no terms and conditions | There are terms and conditions | |||
| Contact details | There are no contact details | Address | Address and map or working time | Address, map, and working time | |
| Credential validation | There is no credential validation | There are credentials and validation | |||
| Up-to-dateness and accuracy | Out-of-date website | Basic company information and ID card are up-to-date and/or © not older than 2 years | (2) + information less than 6 months | (3) + older publications in the archive | |
| E-shop | It does not exist | Basic E-shop (order request) | Complete e-shop (with online payment and delivery) | Advance E-shop (3) + design a product by yourself | |
| Guest book | It does not exist | It exists | |||
| News | It does not exist | It exists | |||
| Multi language | Everything is in one language | Different languages mixed (e.g., buttons) or machine translation | Two languages | Three or more languages | |
| Automatic Client Profile Identification | It does not exist | It exists | |||
| Manual Client Profile Identification | It does not exist | It exists | |||
| Style Uniformity | Non-uniform sites design | Uniform design of all pages and subpages | |||
| Graphics and layout | Old design—lots of unnecessary embellishments | Old/new design—simple use of graphic elements, with some disturbing factors | New design—excellent use of all elements; everything has its function and there is nothing too much | ||
| Colors | Inappropriate color combination, intrusive accents, poor color effect on well-being—have a repellent effect | Colors express passivity, no accents, the colors used are not compatible with each other | The viewer feels better on the page, color combinations are not completely consistent and consistent with the purpose of the page, there is no sense of wholeness | The combination of colors used is appropriate, consistent with the content, but there is still a feeling that something is missing or something is too much | Excellent color harmony, well-being on the page, non-intrusive and useful highlights of important things, perfect coordination with the purpose of the page |
| Home page on one screen | It is not on one screen | It is on one screen | |||
| Readability | Very poor readability due to insufficient contrast between background and text, font size and type inadequate | Poor readability; poor contrast (usually dark background and lighter text); font selection is inappropriate | Medium readability, contrast better but tiring for the eyes, font selection could be better | Very good contrast, the fonts are still slightly too small or inappropriate font selected; difficult longer reading and quick review of content | Excellent contrast and appropriate font size in all elements of the website—also suitable for the visually impaired and color blind |
| Attractiveness | Non-active site | Poorer attractiveness | Good attractiveness | Excellent attractiveness | |
| Orientation and clarity | Complex and unclear structure | Clear structure or user knows where on site he/she is at any time | Clear structure and very easy orientation | ||
| Learnability | Slow adaptation to the site structure | Quick adaptation to the site structure | |||
| Intuitiveness | No intuitiveness | An average intuitiveness of the site | An excellent intuitiveness of the site | ||
| Important information on home page | One of: address, key products, latest news | Two of: address, key products, latest news | All: address, key products, latest news | ||
| Search Options | Does not exist or exists and does not work properly | Basic search of company websites | Advanced search | ||
| Depth of site | Up to 10 subpages in the basic language | 10 and more pages in the basic language | |||
| Hyperlinks structure | One or more connections do not work | All connections work | |||
| Online help | Online help is available | Online help is not available | |||
| FAQs | FAQs—do not exist | FAQs—exist but are too complicated | FAQs—exist and are simple | ||
Table 7.
Global criteria and sub-criteria weights at the lowest hierarchy level.
| Criterion or Sub-Criterion | Local Weights | Rank | Criterion or Sub-Criterion | Local Weights | Rank |
|---|---|---|---|---|---|
| Up-to-dateness and accuracy | 10.0% | 1 | Expert tips | 1.7% | 19 |
| Products/services catalog page | 9.5% | 2 | Style uniformity | 1.7% | 20 |
| Efficiency and performance | 8.7% | 3 | Graphics and layout | 1.4% | 21 |
| Orientation and clarity | 7.3% | 4 | Hyperlinks structure | 1.4% | 22 |
| Availability and reliability | 6.7% | 5 | Colors | 1.2% | 23 |
| E-shop | 6.2% | 6 | Call to action—CAP | 1.2% | 24 |
| Readability | 5.1% | 7 | Guest book | 0.9% | 25 |
| Accessibility and system flexibility | 4.1% | 8 | Automatic Client Profile Identification | 0.9% | 26 |
| Picture/photo gallery | 3.8% | 9 | Online help | 0.9% | 27 |
| Attractiveness | 3.2% | 10 | Industry research reports | 0.7% | 28 |
| Learnability | 3.0% | 11 | Manual Client Profile Identification | 0.7% | 29 |
| Information on home page | 3.0% | 12 | Additional (internet) applications | 0.7% | 30 |
| Intuitiveness | 2.8% | 13 | Depth of site | 0.7% | 31 |
| FAQs | 2.7% | 14 | About company | 0.6% | 32 |
| Contact details | 2.0% | 15 | Credential validation | 0.5% | 33 |
| News | 1.9% | 16 | Home page on one screen | 0.4% | 34 |
| Multi language | 1.9% | 17 | Terms and conditions | 0.4% | 35 |
| Search Options | 1.7% | 18 | Social media | 0.4% | 36 |
Table 8.
WQI ranges for different quality classes of websites.
| Classes | WQI |
|---|---|
| Outstanding | 0.842–1.000 |
| Good | 0.593–0.841 |
| Average | 0.465–0.592 |
| Acceptable | 0.350–0.464 |
| Bad | 0.000–0.349 |
Publisher’s Note: MDPI stays neutral with regard to jurisdictional claims in published maps and institutional affiliations. |
© 2021 by the authors. Licensee MDPI, Basel, Switzerland. This article is an open access article distributed under the terms and conditions of the Creative Commons Attribution (CC BY) license (https://creativecommons.org/licenses/by/4.0/).
Share and Cite
MDPI and ACS Style
Kropivšek, J.; Grošelj, P.; Oblak, L.; Jošt, M. A Comprehensive Evaluation Model for Wood Companies Websites Based on the AHP/R-TOPSIS Method. Forests 2021, 12, 706. https://0-doi-org.brum.beds.ac.uk/10.3390/f12060706
AMA Style
Kropivšek J, Grošelj P, Oblak L, Jošt M. A Comprehensive Evaluation Model for Wood Companies Websites Based on the AHP/R-TOPSIS Method. Forests. 2021; 12(6):706. https://0-doi-org.brum.beds.ac.uk/10.3390/f12060706
Chicago/Turabian StyleKropivšek, Jože, Petra Grošelj, Leon Oblak, and Matej Jošt. 2021. "A Comprehensive Evaluation Model for Wood Companies Websites Based on the AHP/R-TOPSIS Method" Forests 12, no. 6: 706. https://0-doi-org.brum.beds.ac.uk/10.3390/f12060706
Note that from the first issue of 2016, this journal uses article numbers instead of page numbers. See further details here.