
Analysis of Particulate Matter Concentration Intercepted by Trees of a Latin-American Megacity


1
Grupo de Investigación en Ingeniería Ambiental (GIIAUD), Facultad del Medio Ambiente y Recursos Naturales, Universidad Distrital Francisco José de Caldas, Bogotá E-111711, Colombia
2
Grupo de Enxeñaría da Auga e do Medio Ambiente (GEAMA), Campus de Elviña, Universidade da Coruña (UdC), s/n, 15071 A Coruña, Spain
3
Facultad del Medio Ambiente y Recursos Naturales, Universidad Distrital Francisco José de Caldas, Bogotá E-111711, Colombia
*
Author to whom correspondence should be addressed.
Forests 2021, 12(6), 723; https://0-doi-org.brum.beds.ac.uk/10.3390/f12060723
Submission received: 24 April 2021
/
Revised: 22 May 2021
/
Accepted: 28 May 2021
/
Published: 1 June 2021
(This article belongs to the Special Issue Urban Forests: Sinks or Sources of Air Pollution and Climate Change—a Special Issue in Collaboration with the Air Pollution Threats to Plant Ecosystems Conference)
Abstract
:Urban areas with trees provide several ecosystem services to citizens. There is a growing interest in ecosystem services for the removal of air pollutants such as particulate matter. The objective of this paper is to show a study on the variation of intercepted particulate matter concentration (IPMC) by tree leaves in the megacity of Bogotá (Colombia). The relationship between IPMC and PM2.5 concentrations observed in air quality stations in two urban zones with different air pollutions was studied. Influences of climate and leaf morphology variables on IPMC were also analyzed. The species under study were Ligustrum-lucidum, Eucalyptus-ficifolia, Tecoma-stans, Callistemon-citrinus, Lafoensia-acuminata, and Quercus-humboldtii. The results showed that leaf IPMC decreased as the PM2.5 concentration increased. Species that best described this trend were Ligustrum-lucidum and Lafoensia-acuminata. These two species also showed the largest IPMC in their leaves. Indeed, species that showed the largest leaf area were those with the highest IPMC. On average, it was observed that for each 5.0 µg/m3 increase in PM2.5 concentration the IPMCs of the species Ligustrum-lucidum and Lafoensia-acuminata decreased by 33.6% and 23.1%, respectively. When wind speed increased, there was also an increase in PM2.5 concentrations and a reduction in the leaf IPMCs.
1. Introduction
Urban areas with trees provide various ecosystem services to citizens [1]. In this regard, there is a growing interest in ecosystem services for the removal of air pollutants such as particulate matter (PM), nitrogen dioxide (NO2) and ozone (O3), and carbon dioxide sequestration (CO2) [2,3]. The PM is the main component of anthropogenic air pollution, comprising a mixture of heavy metals, minerals, black coal, polycyclic aromatic hydrocarbons, and other toxic substances [4]. When PM has been released into the atmosphere, possibly one of the most effective ways to eliminate it from the environment is through vegetation [5,6]. There are studies that demonstrate the ability of deciduous trees and shrubs to accumulate PM over their leaves during or at the end of the growing season [7]. Unfortunately, these plants lose their leaves for a certain period in the year, suggesting that in cities where high PM concentrations are emitted, evergreen species might be the most suitable option [8].
Due to their ability to accumulate contaminants on leaves and bark, plants have been used to monitor environmental quality in urban areas [9]. The high leaf surface area and the transpiration process of the plants allow the adsorption and absorption of PM and gaseous contaminants [10]. It is also suggested that urban vegetation may play a significant role in improving air quality [3,11]. For example, researchers reported that the presence of trees in Wuhan (China) caused a decrease in PM10 concentrations between 7–15% [12]. Similarly, there are studies that displayed a 30% reduction in PM (<100 m) in Shanghai (China) [13]. Other researchers also reported that tree cover in London (United Kingdom) probably removed between 0.70–1.40% of annual PM10 [14]. This study also concluded that an increase between 20–30% of urban tree coverage would possibly increase the PM10 interception by 1.10–2.60%.
The vegetation effects on urban air quality may be less evident than originally envisaged due to the complex relationships between vegetation structure and climate conditions, which affect the dispersion and deposition of pollutants [15]. Thus, it is necessary to investigate under what circumstances and at what scale the vegetation can capture the greatest amount of PM to improve urban air quality, and under what circumstances the vegetation does not have or even has a negative effect on air quality [8,16]. The specific tree characteristics such as plant structure, plant height, leaf surface, leaf area index, and leaf microstructure are important [17,18]. Similarly, climate parameters such as rainfall, wind speed, turbulence, and air humidity are significant factors to consider, which interact with the accumulation capacity of PM on the leaves [19]. During periods of dry climate, particles can be intercepted and resuspended by leaves depending on wind speed; and during rainy periods, the particles can be washed and transferred to the ground [20,21]. This suggests that a load of solids intercepted and resuspended by vegetation would possibly be a function of the PM concentration, particle size and shape, climate conditions, and leaf morphology.
The objective of this paper is to show a study on the variation of intercepted particulate matter concentration (IPMC) by trees of the megacity of Bogotá (Colombia). In this regard, the possible relationship between IPMC of the leaves and particulate matter concentrations (TSP, PM10, and PM2.5) observed in air quality monitoring stations is studied. The best existing tree species in relation to their IPMC are also identified. Lastly, the influences of climate and leaf morphology variables on IPMC are studied. This study will be important to deepen knowledge about the influence of trees on improving air quality in urban areas.
2. Materials and Methods
2.1. Study Sites
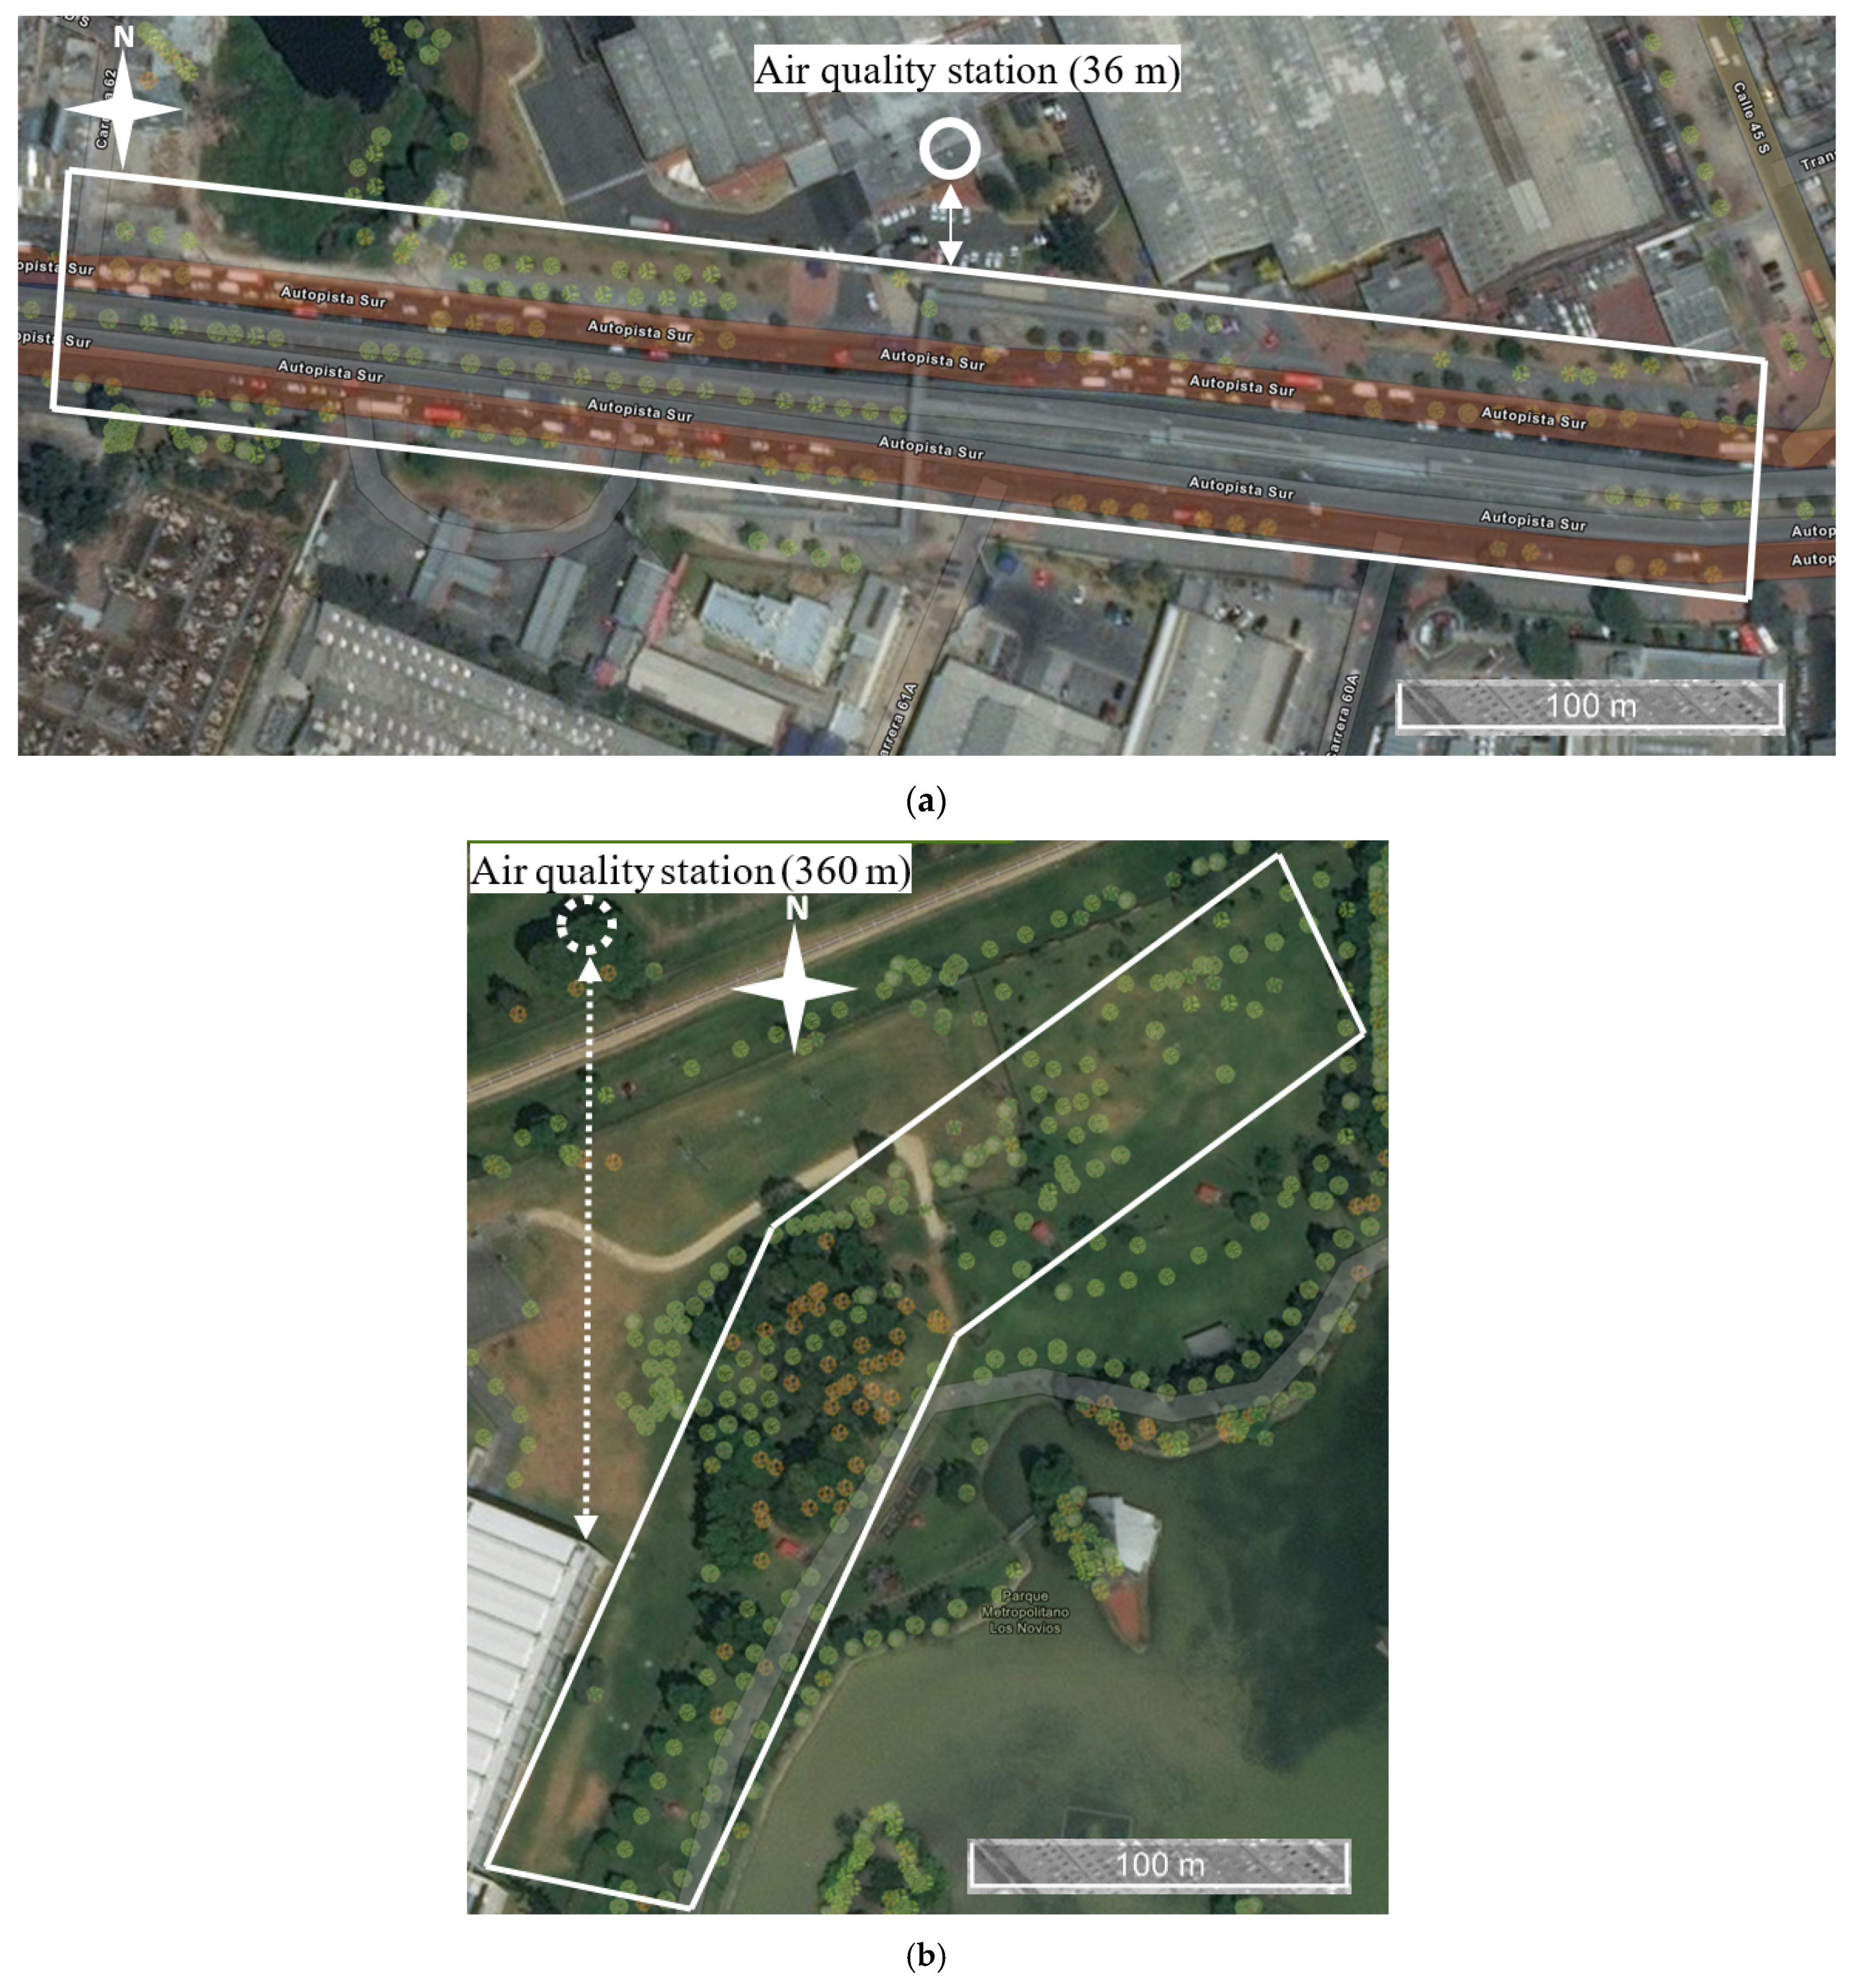
The two study sites were selected in Bogotá city (Colombia) from their historical PM10 concentrations and for their proximity to air quality monitoring stations. The first study site (Zone 1: 4°35′42″ N; 74°08′52″ W) corresponded to a section of the South Highway (Figure 1), which historically associated the highest daily concentrations of PM10 in Bogotá city (annual average = 81 µg/m3). This was based on the information reported by the air quality monitoring network of Bogotá city (RMCAB) [22]. The second study site (Zone 2: 4°39′19″ N; 74°04′57″ W) corresponded to a sector of Simón Bolívar Park, which has historically been characterized by associating the lowest daily concentrations of PM10 in the city center (annual average = 38 µg/m3). This second study site was selected as a possible standard of the background PM10 concentrations in the city. Each study site had equipment to measure PM10 and PM2.5, and only Zone 1 had equipment to measure total suspended particles (TSP < 100 µm). The air quality stations were located at a distance between 36–360 m from the sampled trees. The study areas had a tropical mountain climate (cold climate), characterized by an average daily temperature between 13.3–14.3 °C and wide hourly temperature variations (between 7.2–19 °C). The average altitude of the study sites was 2580 m.a.s.l. The monitoring stations of RMCAB also had equipment to measure temperature, rainfall, and wind speed.
The sampling area in Zone 1 was 500 m long and 70 m wide (35,000 m2). At a 400 m radius, land use in this area was industrial and commercial, and the predominant surface coverages were impervious (87.7%) and vegetated (9.66%). The sampling area in Zone 2 was 350 m long and 35 m wide (12,250 m2). At a 400 m radius, the land use predominant in this area was of buildings (i.e., recreational, sports, and cultural), and the predominant coverages were vegetated (74.4%) and impervious (20.7%) (Figure 1). The road of Zone 1 had the following characteristics: Concrete pavement, average traffic density = 60,800 vehicles/day, average speed = 35 km/h, and five lanes in each direction. The traffic composition was as follows: Cars = 47.7%, buses = 41.6%, and heavy vehicles = 10.7% [23]. During the study period, no tree maintenance work (pruning and washing) was carried out in the two sampling zones.
2.2. Sample Collection
From the tree inventory of the study areas obtained from the Botanical Garden of Bogotá (http://sigau.jbb.gov.co/SigauJBB/VisorPublico/VisorPublico, accessed on 6 February 2020), digital mapping was developed by field verification of the presence of species and trees to be sampled. Thus, species with a population greater than 10% were then selected [25]. This is in relation to the total number of individuals inventoried in each study area. Individuals who died or with a high degree of defoliation, those who had a total height of less than 2.0 m and those with a starting height of the crown greater than 2.0 m were excluded [6,8]. Namely, in this study, the sampling height was 2.0 m. Hence, a sample size of 6 species and 143 trees was obtained for the two study areas (Zone 1 = 108 trees and 4 species; Zone 2: 35 trees and 2 species). The species sampled in Zone 1 were as follows: Ligustrum lucidum (N = 45 trees), Eucalyptus ficifolia (N = 12 trees), Tecoma stans (N = 22 trees), and Callistemon citrinus (N = 29 trees). The species sampled in Zone 2 were as follows: Lafoensia acuminata (N = 16 trees) and Quercus humboldtii (N = 19 trees).
Sample collection in each study area was done twice a week (Wednesday and Sunday), between 9:00–11:00 a.m. The selection of trees was done using a random systematic sampling model [26]. This sampling model was appropriate for studies where the population was spatially arranged in an organized manner. The following variables were considered in this random sampling model: Systematic jump (k = N/n), total population by species (N), number of individuals to be sampled by species (n = 2), and a random number among the first ‘k’ in a list of all population elements (h). Thus, this systematic sampling of ‘n’ elements allowed the selection of the sample consisting of the following elements: h, h + k, h + 2·k,…, h + (n − 1)·k. This led to the selection of 12 trees per day (Zone 1 = 8; Zone 2 = 4) during the six months of the sampling period (576 trees in total). For each tree selected, 16 healthy leaves of different sizes were collected from the most exposed branches, four in each cardinal direction and at a 2.0 m height [6,27]. The samples were deposited independently in a previously labeled Ziploc bag (date, zone, species, and individual number). Subsequently, the bags were then stored in a refrigerator at 4 °C for transport to the laboratory [8]. A total of 9216 leaves were collected for analysis during the sampling period. On two occasions, during the study period, leaves were collected at different heights (1.5, 2.0, 2.5, and 3.0 m) for the four tree species detected in Zone 1 (Ligustrum lucidum, Eucalyptus ficifolia, Tecoma stans, and Callistemon citrinus). In each sampling, 16 healthy leaves of different sizes were collected by species, in the most exposed branches and with direction to the roadway.
Finally, the PM sampling system (TSP, PM10, and PM2.5) was composed of continuous monitoring equipment by means of beta-ray attenuation. The sampling protocol followed the guidelines established by the U.S. Environmental Protection Agency: EPA/625/R-96/010a-IO-1.2 [28]. This information was obtained from RMCAB, which is operated by the Environmental Secretariat of Bogotá city (http://201.245.192.252:81/home/map, accessed on 6 February 2020). The information of temperature, rainfall, and wind speed also was obtained from RMCAB.
2.3. Laboratory Analysis
The IPMC determination of the leaves of each tree was carried out using an adaptation of the gravimetric method [6,8,29]. The 16 leaves collected by each tree were washed (three times) with deionized water using a 750 cm3 manual pump. A brush of soft and thin bristles was also used to release the PM attached to the leaves. The Ziploc bags for transporting samples were also washed with deionized water. The washing water was deposited in a 110 mL bottle. This bottle was previously washed with deionized water, dried (105 °C for 20 min), weighed, and labeled. The PM in dilution was placed in a forced-air stove at 105 °C for 72 h. After this time, the bottle was removed from the stove and placed at rest in a desiccator until room temperature was reached. The bottle weight with dry PM was determined using a four-digit analytical balance. The difference in weight between the bottle with and without PM allowed determining the amount of solid material intercepted for each tree (µg).
After removing PM from the leaves, they dried at room temperature for two hours. The leaves were scanned (HP Deskjet 3510) at a 1200 ppp resolution using a 1.0 mm grid as a reference. The area of each leaf (cm2) was determined using a binary scale (black and white) and with the ImageJ V.1.45 software [30]. The total leaf area sampled from each tree was calculated as the sum of 16 leaves collected. This allowed calculating the amount of PM intercepted per leaf surface area in each tree (IPMC in µg/cm2). Four individuals per species were also selected for each sampling to determine the following leaf morphological characteristics [31]: Maximum leaf length, maximum leaf width, and leaf area. The type of leaf surface was determined using a stereoscope. The leaf shape was determined by calculating the relationship between the leaf length and the leaf length from the base to the widest part of the leaf. The classification of the leaf shape was carried out according to the criteria proposed by Quiroz and Soria [32].
2.4. Information Analysis
The non-normality of data series (PM2.5, PM10, TSP, IPMC, climate, and leaf morphological) was verified by a Shapiro-Wilk test (p-value < 0.05). A Spearman’s correlation analysis was also performed between IPMC (µg/cm2) and PM2.5 concentrations measured by the RMCAB stations (µg/m3). Regression models for these two variables were also developed (linear, exponential, potential, and logarithmic). In addition, the influence of temperature (°C), rainfall (mm), and wind speed (m/s) on IPMC (µg/cm2) were analyzed using Spearman’s correlation coefficient (rs). Correlation analyses were also performed with respect to the leaf morphological variables. In this study, the scale used to interpret Spearman’s correlation coefficient results was as follows: Very weak = 0.10, weak = 0.25, medium = 0.50, considerable = 0.75, very strong = 0.90, and perfect = 1.0 [33]. Possible differences in IPMC and leaf morphological characteristics between tree species were assessed by a Friedman’s test. The variation in IPMC with respect to sampling height in the tree species considered was also studied and regression models were developed (linear, exponential, potential, and logarithmic). All previous analyses were performed under three time scales: daily, weekly, and monthly. The information for these last two timescales was generated by moving averages. Statistical analyses were carried out with 95% confidence and using the SPSS V.18.0 software.
3. Results and Discussion
3.1. PM Interception
On average, during the study period, results showed a daily concentration of PM2.5 and PM10 of 25.4 and 73.8, and 13.2 and 21.3 µg/m3 in zones 1 and 2, respectively. There was also a very strong direct correlation between PM2.5 and PM10 concentrations in Zone 1 (rs = 0.923, p-value < 0.001, n = 49). The correlation between PM2.5 and TSP concentrations was direct, between medium and considerable (rs = 0.723, p-value < 0.001, n = 49). Thus, the results suggested that PM2.5 and PM10 were the representative size fractions in terms of air quality to study the IPMC by urban trees. From a literature review in the Scopus and Google Academic databases (keywords: PM2.5, PM10, and trees; and between 2009–2019), it was displayed that the citation frequency of PM2.5 as a representative air quality fraction exceeded between 1.40 and 1.27 times the citation frequency of PM10, respectively. In this study, PM2.5 was selected as the main size fraction in terms of air quality to study the IPMCs by urban trees. The daily trend in Zone 2 between PM2.5 and PM10 concentrations was similar (rs = 0.929, p-value < 0.001, n = 49).
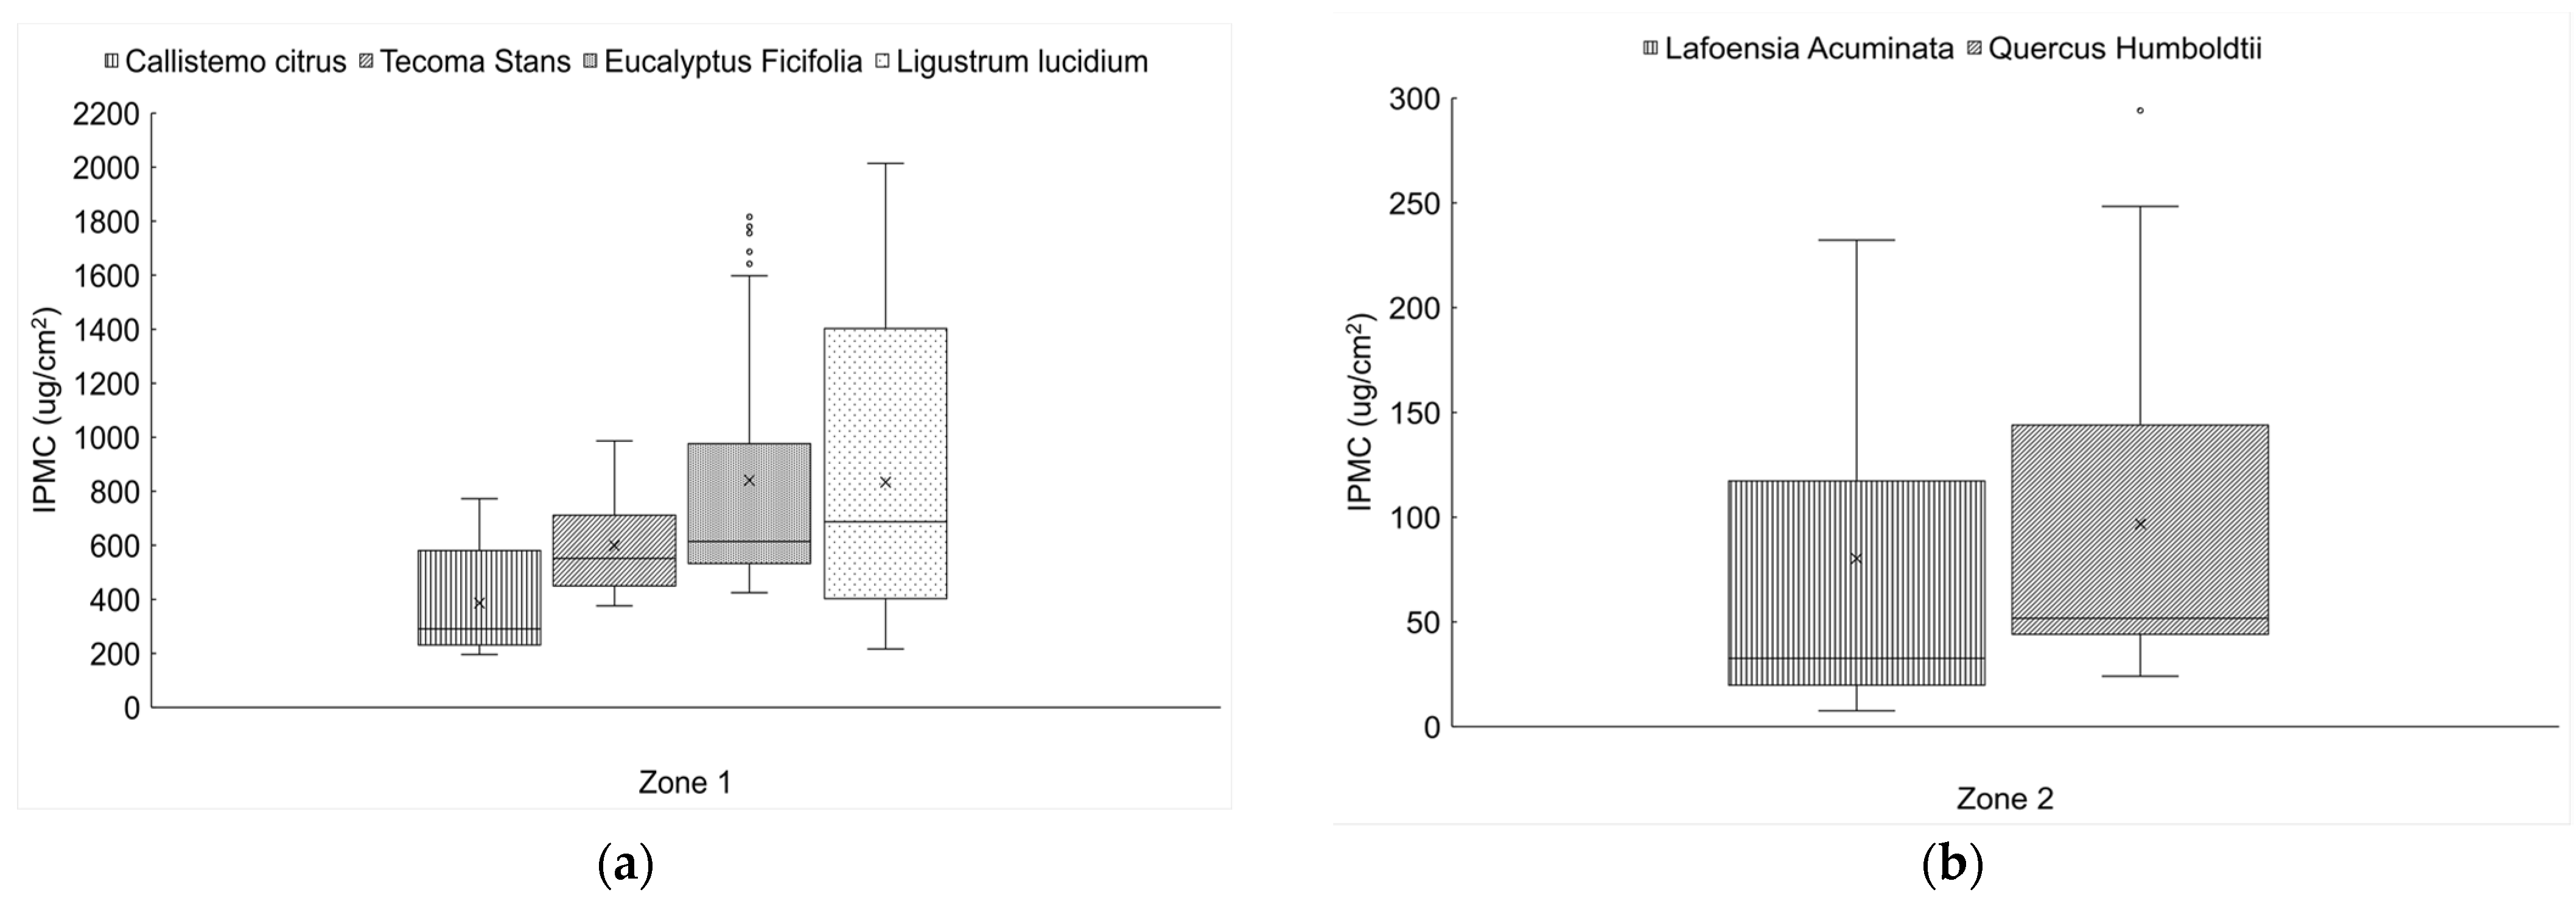
On a daily basis, the results showed on average the following order in the quantity of leaf PM in Zone 1: Ligustrum lucidum (823 ± 210 µg/cm2) > Eucalyptus ficifolia (791 ± 242 µg/cm2) > Tecoma stans (625 ± 127 µg/cm2) > Callistemon citrinus (396 ± 73.4 µg/cm2). A Friedman’s test showed significant differences in the quantity of leaf PM between the species of Zone 1 (p-value < 0.001, n = 42). In Zone 2, the order in the quantity of leaf PM was as follows: Quercus humboldtii (91.3 ± 31.4 µg/cm2) > Lafoensia acuminata (75.7 ± 35.1 µg/cm2). A Friedman’s test also showed significant differences in the quantity of leaf PM between the species of Zone 2 (p-value = 0.008, n = 42). The quantity of leaf PM in Zone 1 was 6.56 times higher compared to Zone 2 (Figure 2). The PM2.5 concentrations showed a similar trend. PM2.5 concentration in Zone 1 was 1.92 times higher than the concentration observed in Zone 2. Indeed, the results suggested that areas with higher PM2.5 concentrations also showed the highest quantity of leaf PM. The above findings did not consider the variation in time of the PM quantity accumulated on the leaves. Namely, these findings simply corresponded to a comparative analysis between the pollution level and the quantity of leaf PM observed in the two study zones. On this matter, researchers indicated that pollution level and the quantity of leaf PM2.5 were positively correlated [11]. Other researchers reported that the saturation isothermal remanent magnetization (SIRM) of leaves was at least four times higher in the vicinity of main roads and industrial zones than in parks and residential zones. These researchers used this technique (SIRM) to study the distribution of PM in an urban tropical environment [34].
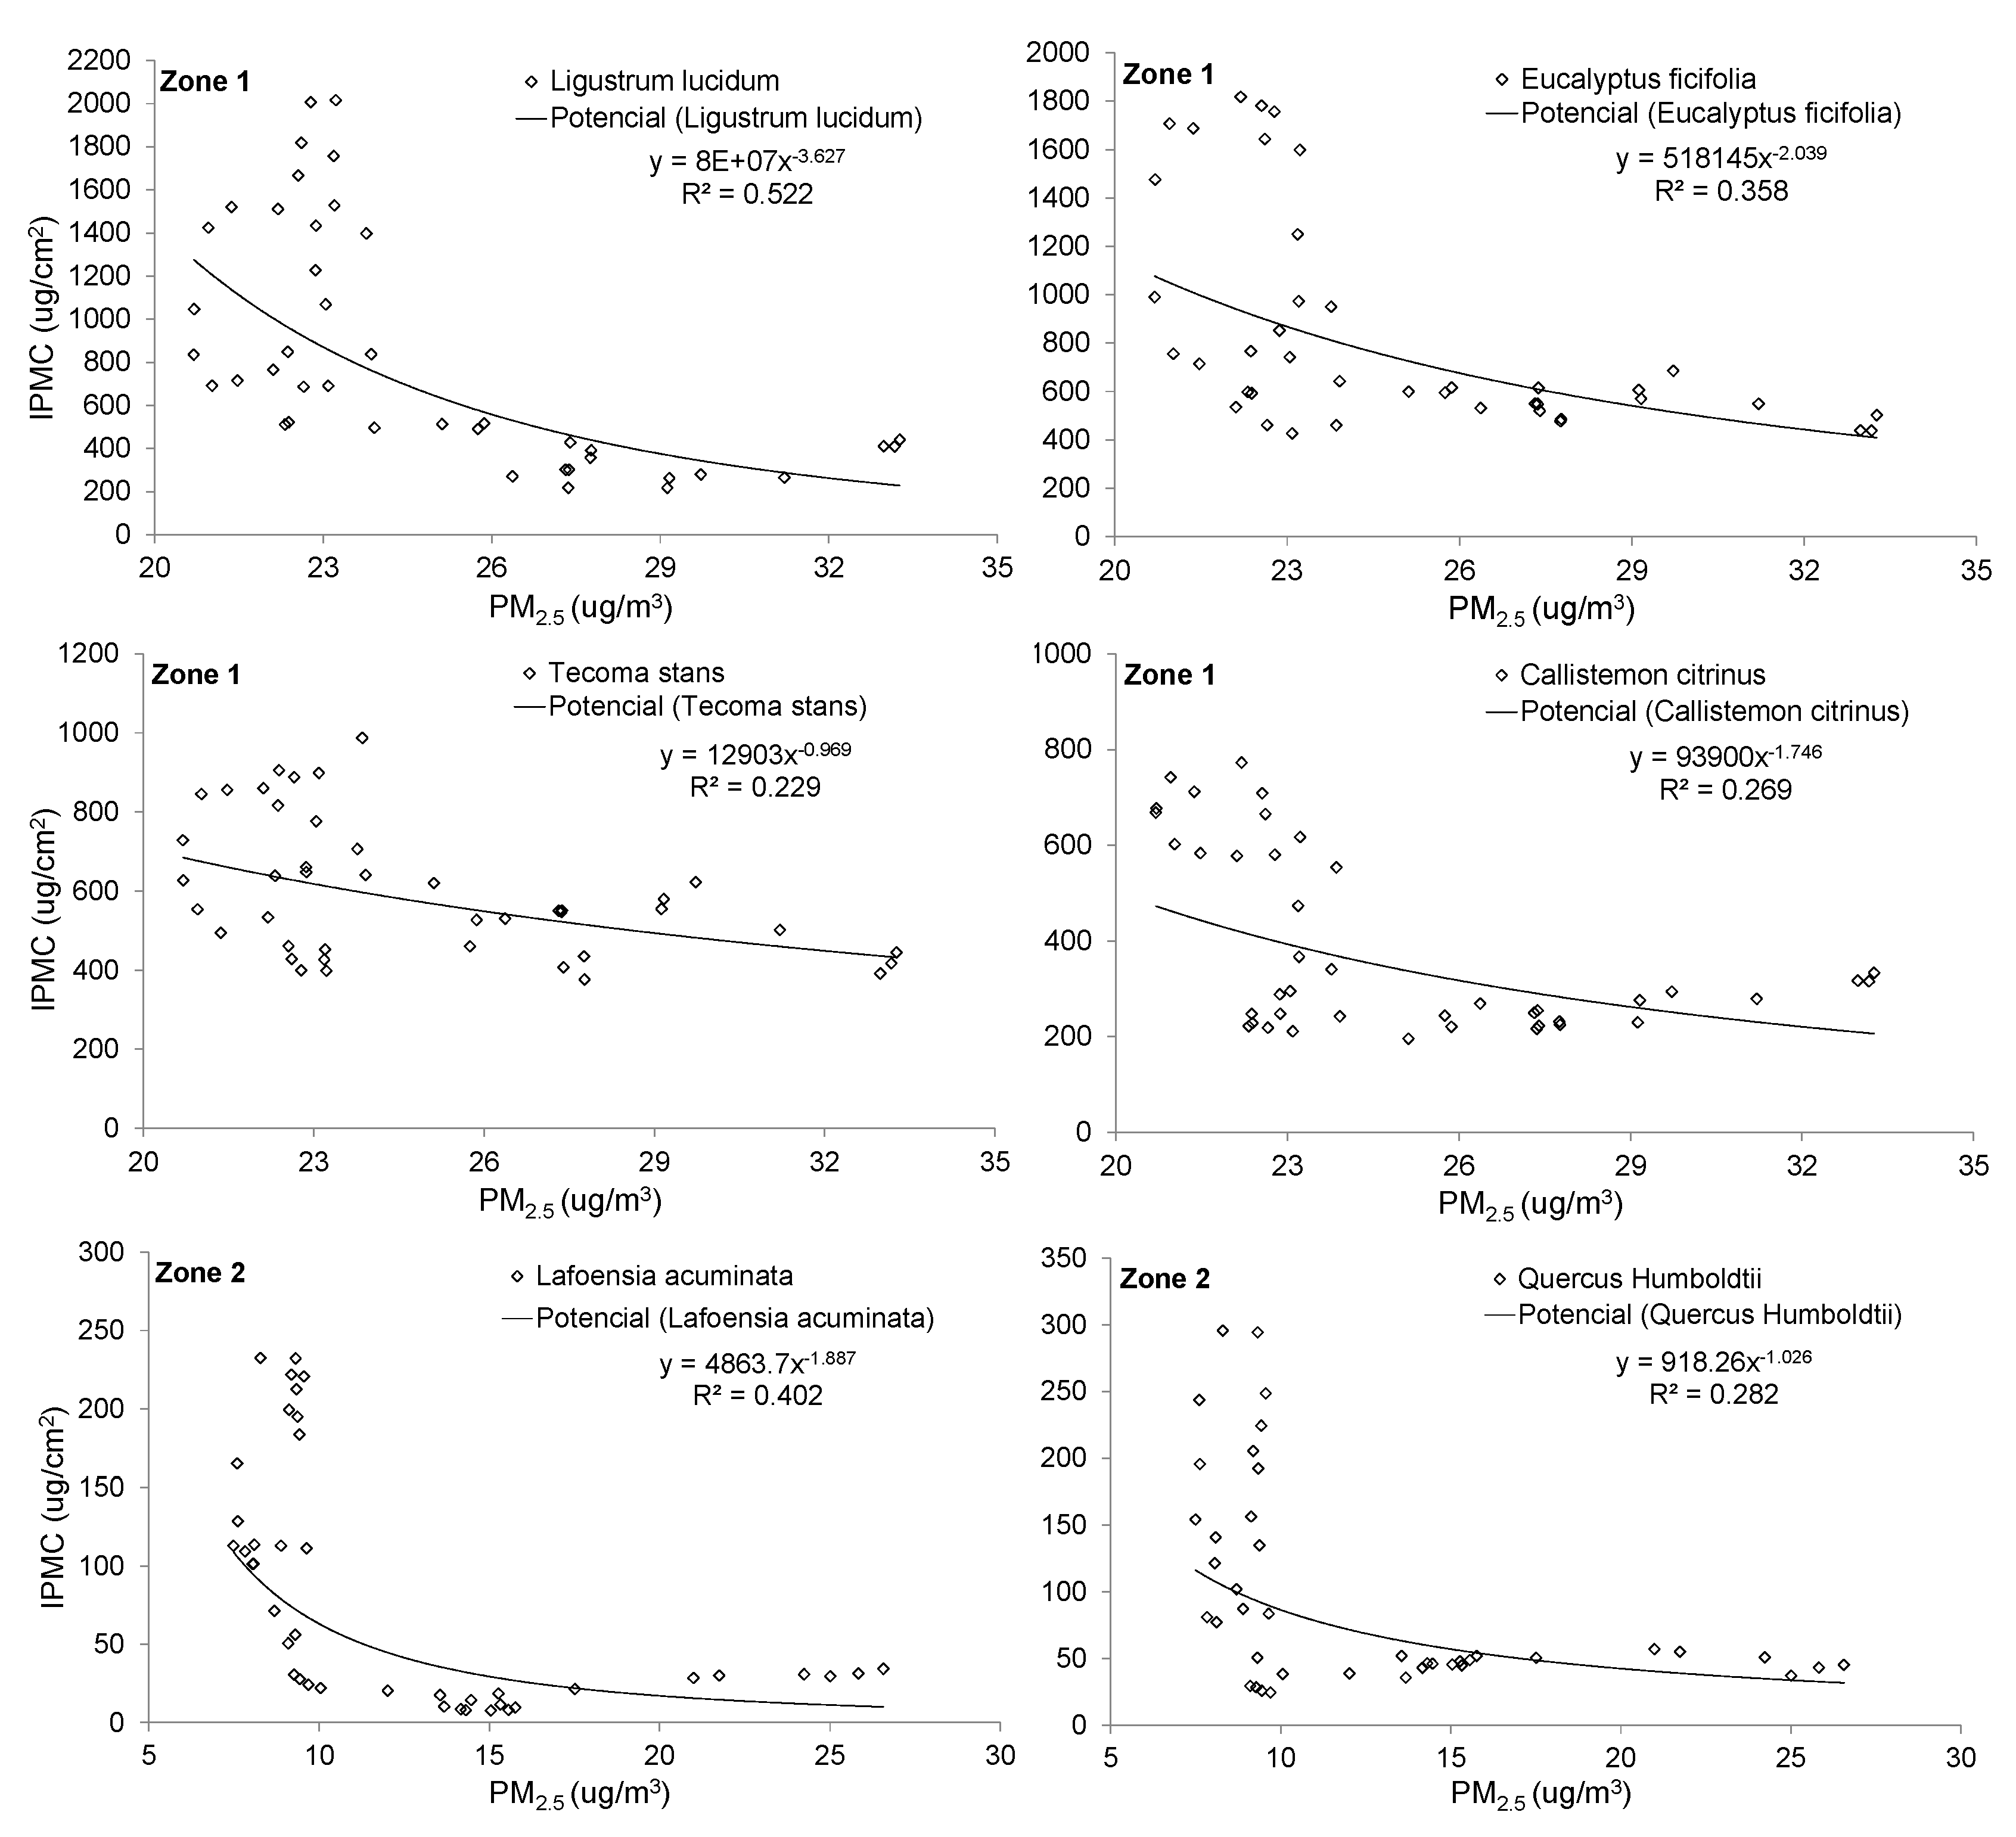
In each study zone, the variation in time of the PM quantity accumulated on the leaves was analyzed. In this analysis, three time scales were considered: daily, weekly, and monthly. The monthly time scale was the one that showed the best results during this analysis. The results showed an inverse correlation between IPMC and PM2.5 concentrations observed at air quality monitoring stations. In Zone 1, results showed the following order of precedence from a correlation analysis with Spearman’s coefficient: Ligustrum lucidum (rs = −0.707; p-value < 0.001, n = 42) > Eucalyptus ficifolia (rs = −0.607; p-value < 0.001, n = 42) > Tecoma stans (rs = −0.468; p-value = 0.002, n = 42) > Callistemon citrinus (rs = −0.458; p-value = 0.002, n = 42). In Zone 2, the order of precedence was as follows: Lafoensia acuminata (rs = −0.667; p-value < 0.001, n = 42) > Quercus humboldtii (rs = −0.530; p-value < 0.001, n = 42). Thus, the findings suggested that IPMC decreased as the PM2.5 concentration increased over time (Figure 3). Namely, the leaf surface available in the trees for PM interception was possibly decreasing as the PM2.5 concentration increased over time. In this study, PM2.5 was the size fraction that showed the best correlations with the IPMCs, compared to PM10 and TSP. Studies on leaf surface saturation with PM have been scarce. Nevertheless, some researchers reported that PM accumulation on new leaves was rapid and reached a high quantity within 4–7 days under a high level of PM exposure. In addition, these studies reported that PM accumulation on the leaves did not increase continuously, on the contrary, the PM accumulation tended towards an equilibrium condition possibly due to the effect of rainfall and wind speed [35,36]. In other words, the IPMC tended to decrease over time.
Additionally, monthly regression models were developed between IPMC and PM2.5 concentration. Linear, exponential, potential, and logarithmic regression models were tested. The results showed that the potential model was the best fit (Figure 3). The findings suggested that the species Ligustrum lucidum and Lafoensia acuminata were the best correlated with PM2.5 concentrations in zones 1 and 2, respectively. Indeed, the analysis with Pearson’s coefficient showed medium to considerable relationship between IPMC and PM2.5 concentrations for these two species: Ligustrum lucidum (rs = −0.707; p-value < 0.001) and Lafoensia acuminata (rs = −0.667; p-value < 0.001). These species could be used as possible indicators of PM2.5 pollution at each of these study zones. On average, it was observed that in Zone 1 during the highest PM2.5 concentration (33 µg/m3) the IPMCs tended to decrease 5.15, 2.51, 1.55, and 2.20 times for the species Ligustrum lucidum, Eucalyptus ficifolia, Tecoma stans, and Callistemon citrinus, respectively. Reductions in the IPMCs in Zone 2 during the highest PM2.5 concentration (27 µg/m3) were 12.8 and 4.0 times for the species Lafoensia acuminata and Quercus humboldtii, respectively. The results suggested that species with the highest IPMC under average conditions of PM2.5 concentration were those with the greatest decreased in their IPMC during periods of increased in PM2.5 concentration (see maximum and minimum IPMC in Table 1). The results also suggested that local environmental authorities should implement a periodic tree-washing plan to increase their IPMC and thus contribute more effectively to improving air quality in the study areas.
Additionally, the findings showed monthly that IPMC tended to decrease to a minimum level. This minimum level was evidenced during the maximum PM2.5 concentrations observed in the study areas. Namely, possibly during this minimum IPMC level, the saturation with PM of the leaf surface was reached (Figure 3). In the zone of highest PM2.5 pollution (Zone 1: 21–33 µg/m3), the minimum IPMC levels per species had the following order of precedence: Tecoma stans (436 µg/cm2) > Eucalyptus ficifolia (415 µg/cm2) > Ligustrum lucidum (249 µg/cm2) > Callistemon citrinus (210 µg/cm2). In the zone with the lowest PM2.5 concentration (Zone 2: 7–27 µg/m3), the findings were as follows: Quercus humboldtii (31.3 µg/cm2) > Lafoensia acuminata (9.68 µg/cm2). To better analyze this trend, the maximum and minimum IPMCs were studied, which occurred during the periods of lower and higher PM2.5 concentrations, respectively. In this regard, effective IPMC was determined as the difference between the maximum and minimum IPMCs. The results showed that possibly the best species to intercept PM in zones 1 and 2 were Ligustrum lucidum and Lafoensia acuminata, respectively. These two species had an effective IPMC of 1032 µg/cm2 (80.6%) and 114 µg/cm2 (92.2%), respectively (Table 1).
On a monthly basis, the results suggested on average that for each 5.0 µg/m3 increase in PM2.5 concentration the IPMCs of the species Ligustrum lucidum and Lafoensia acuminata decreased by 33.6% and 23.1%, respectively. The rates between the IPMCs and PM2.5 concentrations were −94.7 and −7.57 µg/cm2 for each µg/m3, respectively. In relation to PM10, the results suggested that a 10 µg/m3 increase in its concentration would result in a decrease of 28.8% and 31.8% in IPMC of the species Ligustrum lucidum and Lafoensia acuminata, respectively. Indeed, the rates between the IPMCs and PM10 concentrations were similar compared to PM2.5. This is possibly due to the very strong correlation observed between PM2.5 and PM10 concentrations (rs = 0.923, p-value < 0.001, n = 49).
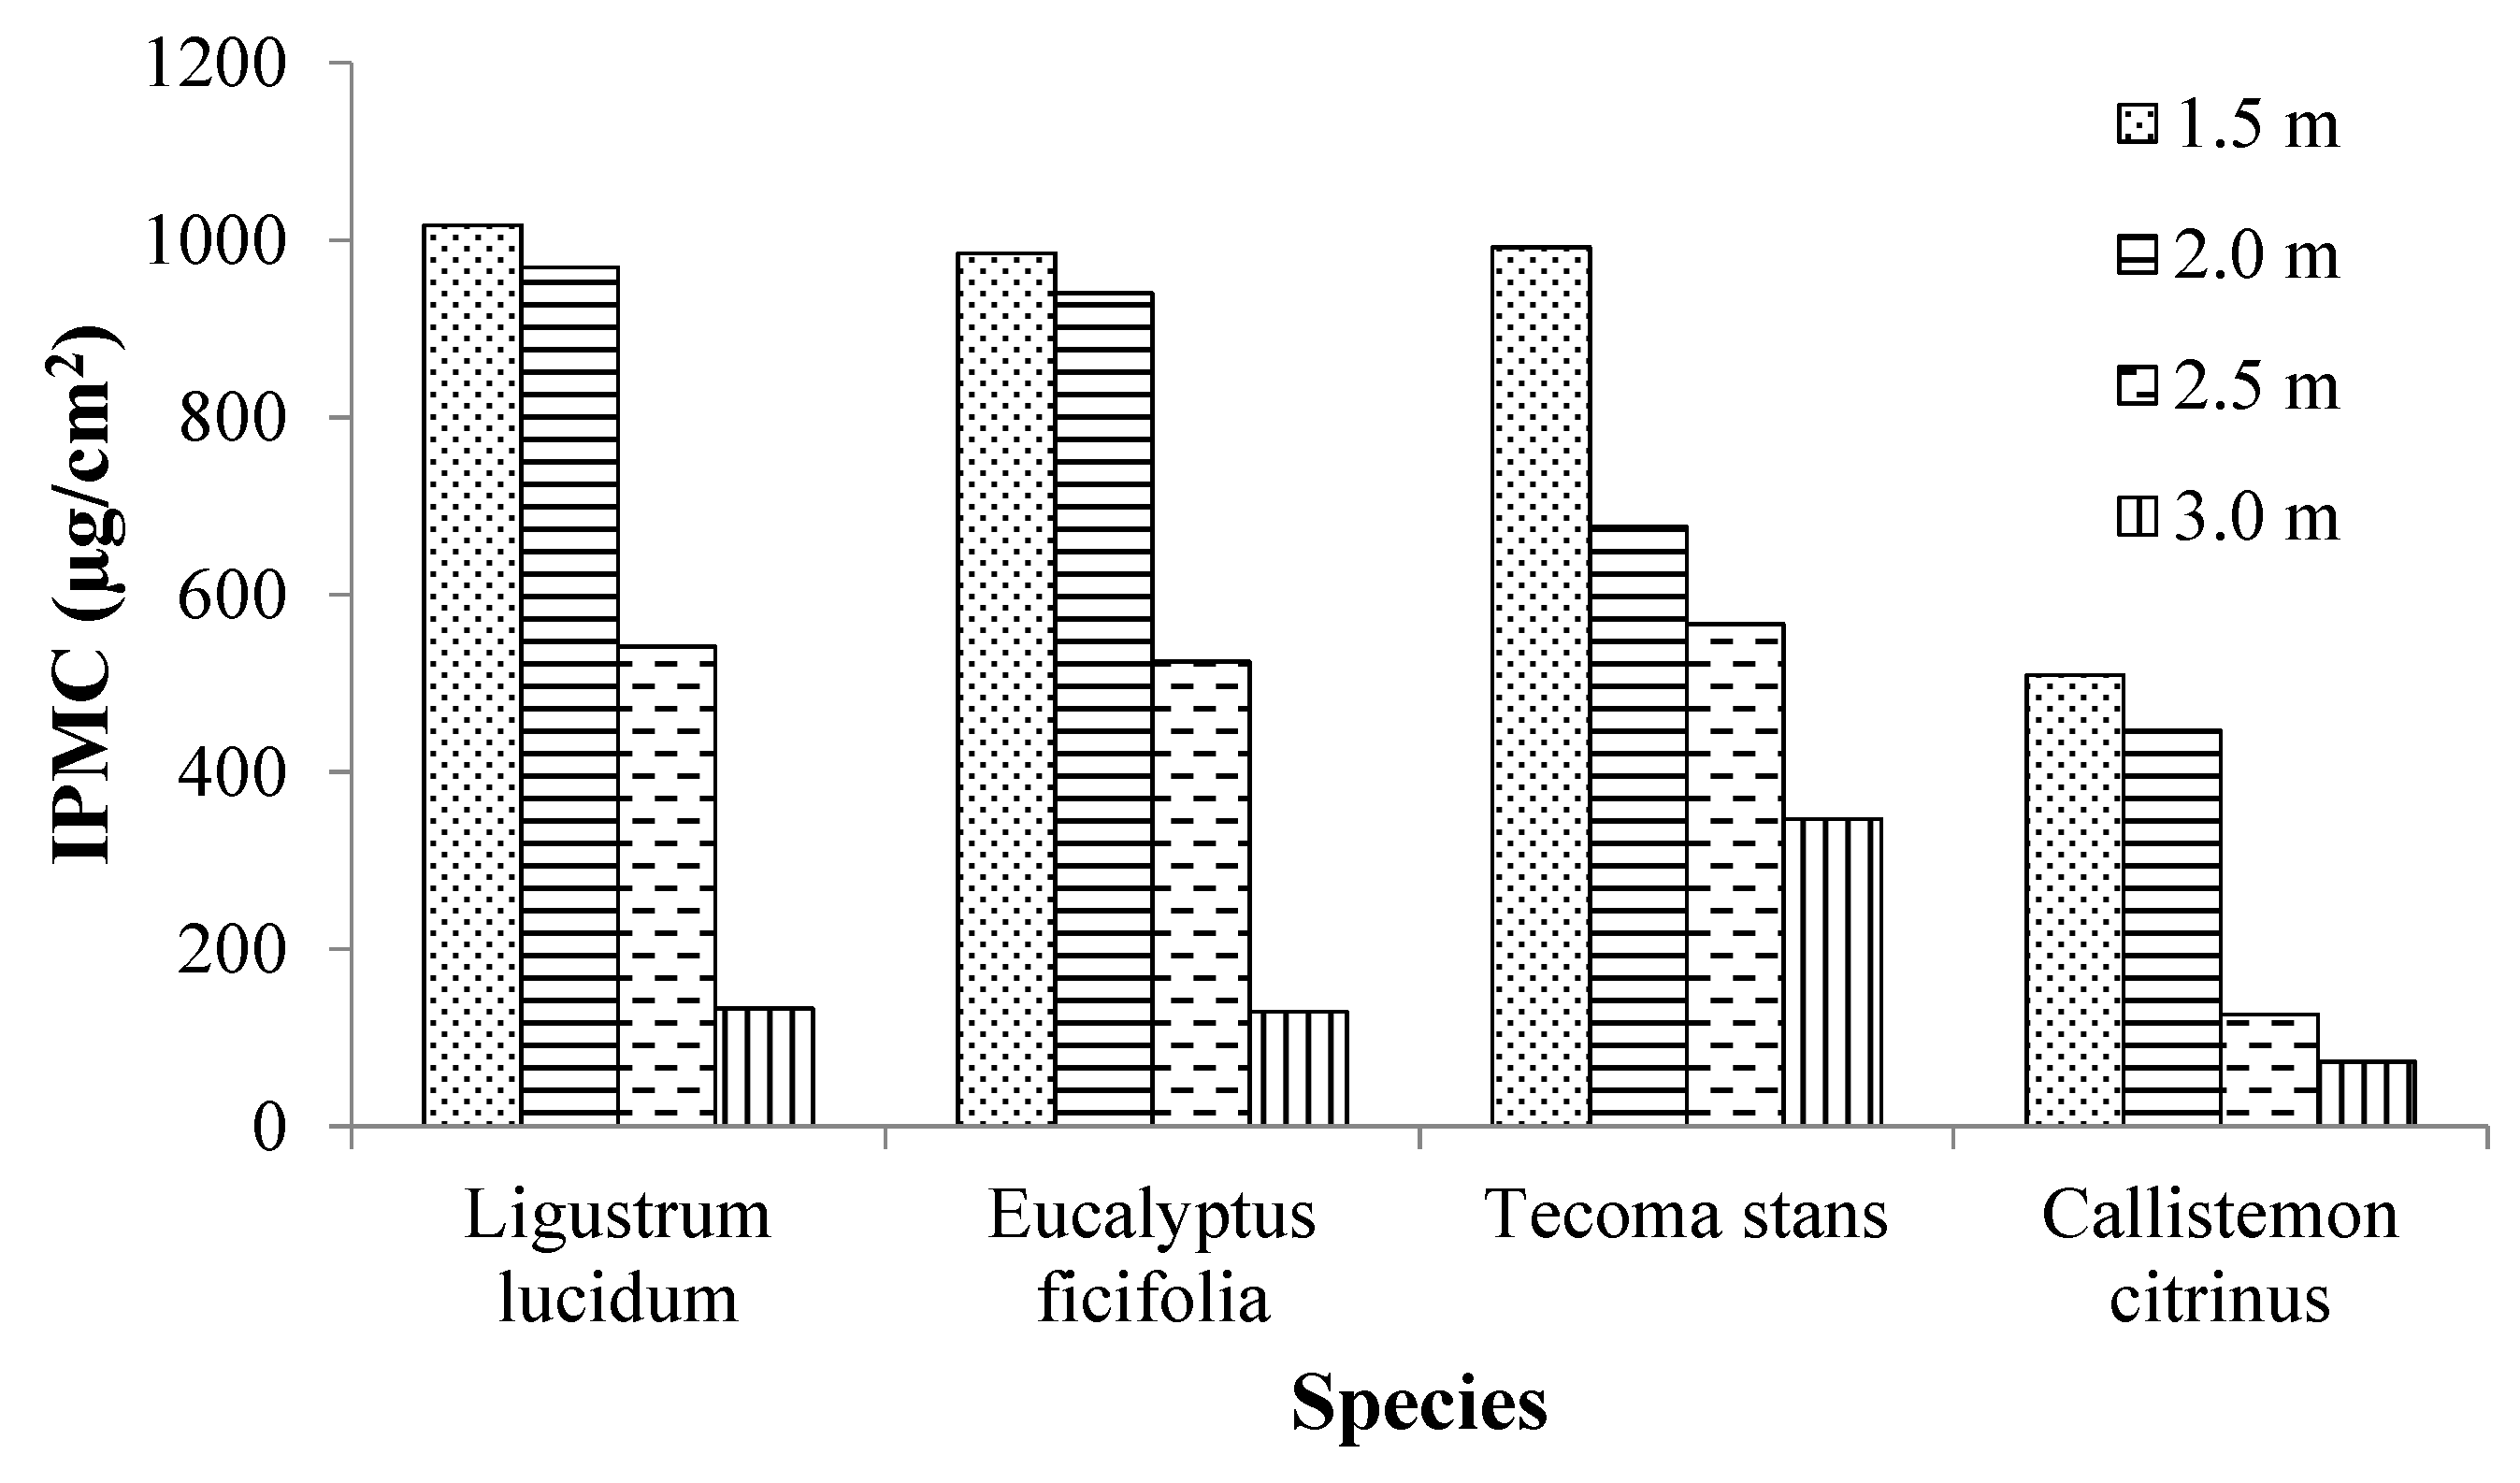
During the study period, leaves were collected at different heights for the four species selected in Zone 1 (between 1.5 and 3.0 m). These leaves were collected in direction of the roadway. The results showed a similar trend in the variation of IPMC with the sampling height for all species. Namely, the largest IPMC was observed for the sampling height closest to the road surface (1.50 m) and subsequently the IPMCs tended to decrease as the sampling height increased (Figure 4). On average, IPMC at 1.50 m was 5.13 times higher compared to IPMC at 3.0 m. In this study, the findings suggested that PM mobile emission sources were possibly located at a height less than or equal to 1.50 m (i.e., vehicle exhaust). The PM from road traffic also comes from other sources such as brake wear, tire wear, and vehicle-induced resuspension of road dust [37]. The results also suggested that the PM resuspension phenomenon had a greater effect for heights less than or equal to 1.50 m, and that it decreased with the height.
Additionally, regression models were developed to study the decrease in IPMC with sampling height in Zone 1 species. Linear, potential, logarithmic, and exponential models were tested. The results suggested the exponential model as the one that best explained this trend (R2 ≥ 0.83). The average rates between IPMC and sampling height were −308 (Ligustrum lucidum), −298 (Eucalyptus ficifolia), −204 (Tecoma stans), and −163 µg/cm2 for every 1.0 m of height (Callistemon citrinus). The species that had the lowest IPMC were those that showed the least decrease in their PM interception capacity with the sampling height (Table 1). On average, in Zone 1 the species that least decreased its IPMC with the sampling height was Callistemon citrinus (65.0% to 3.0 m). The other species comparatively showed a similar decrease with the sampling height (average: 86.5% to 3.0 m) (Figure 4). In this study, the results also suggested that the predominant use of trees with a crown start height between 1.50–2.00 m could be more effective in intercepting PM on urban roads.
3.2. Climate Influence
The monthly influence of the following climate variables on IPMC was studied: Temperature, rainfall, and wind speed. The climate variables that best correlated with IPMC in Zone 1 were in order of precedence temperature (rs ≤ −0.771, p-value < 0.001, n = 49) and wind speed (rs ≥ 0.358, p-value< 0.001, n = 49). In this zone, there were no significant correlations between IPMC and rainfall (Table 2). In Zone 2, there were significant correlations in order of precedence with temperature, rainfall, and wind speed. In this study, the results suggested that the possible indicator climate variables of IPMC were in order of precedence temperature and wind speed.
The findings showed that the relationship between IPMC and temperature was inverse. In contrast, the relationship between IPMC and wind speed was direct. The results also showed that when the wind speed increased, PM2.5 concentrations were also increased (Table 2). Namely, possibly during these periods of increase in wind speed the PM resuspension phenomenon was more intense, which probably generated an increase in PM2.5 concentrations in the study zones. Some researchers also reported the intensification of PM resuspension phenomenon during periods of wind speed increase. During these periods, there was an increase in PM concentrations [38,39]. Other researchers reported that it was possible to disaggregate the PM10 concentrations into one component that was diluted when the wind speed increased and another component that increased with the wind speed. This latter component was attributed to wind-induced resuspension processes and was associated with fine PM (≤2.5 µm) [40]. The results showed that these increases in PM2.5 concentrations were also associated with a decrease in IPMCs. In other words, when wind speed was increased in the study zones there was a reduction in IPMCs. Possibly, during these episodes of high PM2.5 concentrations and wind speeds, the leaves reached their minimum level of IPMC due to a reduction in the leaf surface available to intercept atmospheric particles (Figure 3).
Finally, differences between the study areas in relation to rainfall were observed. It is important to mention that during the study period it was under the influence of a moderate ‘El Niño’ phenomenon [41]. On average, and on a multi-year basis, rainfall during the study period decreased by 53.1% (dry period). The results showed that in the zone of high PM2.5 pollution (Zone 1), there was no correlation between IPMC and rainfall. On the contrary, in the zone of low PM2.5 pollution (Zone 2), there was a correlation between IPMC and rainfall (Table 2). These findings could suggest that during ‘El Niño’ phenomenon periods the rainfall did not have enough intensity to wash off the PM intercepted by the leaves in areas of high PM2.5 pollution. However, in areas of low PM pollution, rainfall possibly had a direct effect on the washing of particles intercepted by the leaves, and thus on their IPMC. On this matter, researchers indicated that the amount of PM2.5 on leaves was not necessarily reduced during rainfall events and that higher rainfall intensity could reduce the cycle length (PM accumulation and removal) and enhance the PM2.5 wash-off efficiency [21].
3.3. Leaf Morphology Influence
In order to study the possible relationship between IPMC and leaf morphology, the following parameters were considered: leaf area (LA), maximum leaf length (MLL), maximum leaf width (MLW), leaf shape, and leaf surface type. In relation to LA, the results showed on average the following order of precedence in Zone 1: Ligustrum lucidum (30.6 ± 3.07 cm2) > Eucalyptus ficifolia (23.8 ± 4.00 cm2) > Tecoma stans (18.0 ± 2.44 cm2) > Callistemon citrinus (2.52 ± 0.33 cm2). This sequence coincided with the order of precedence observed for IPMC (Table 3). In other words, the results suggested a direct relationship between IPMC and the leaf area of the tree species studied. An analysis with Spearman’s coefficient showed correlations of medium to considerable between IPMC and LA in Zone 1 (rs = 0.728, p-value < 0.001, n = 114). In Zone 2, the correlations between IPMC and LA were not significant (p-value = 0.218, n = 61). Although in this zone, a direct relationship between IPMC and LA was comparatively observed. The findings suggested that in the zone of highest PM2.5 pollution there was a direct relationship between IPMC and LA and that in the zone of lowest PM2.5 pollution, this relationship was not significant. Indeed, this relationship was apparently conditioned by the PM pollution degree of the study area. In this regard, researchers reported that the morphological parameters based on leaf area were the most significant during the study of PM interception capacity (dry deposition rate) [17].
On average for Zone 1, the results suggested that the species Ligustrum lucidum, Eucalyptus ficifolia, Tecoma stans, and Callistemon citrinus had an effective IPMCs of 4302 and 633 µg per exposed leaf, respectively. In Zone 2, the effective IPMCs for the species Quercus humboldtii and Lafoensia acuminata were 3442 and 1820 µg per exposed leaf, respectively (Table 1 and Table 3). Indeed, these differences in the IPMCs were associated with the LAs of each tree species. However, these differences in the IPMCs were possibly also due to the different levels of PM2.5 pollution in the zones under study. Zone 1 showed the highest degree of PM2.5 pollution, and probably because of this, the species located in this area showed the highest effective IPMCs compared to the species in Zone 2.
The results showed through Friedman’s test that there were significant differences in the MLL/MLW ratio between the species considered in Zone 1 (p-value < 0.001, n = 64). Moreover, the findings showed significant differences between the IPMCs in this zone (p-value < 0.001, n = 42). The results comparatively suggested that species with high magnitudes in the MLL/MLW ratio tended to show the lowest IPMC (Table 3). This was the case of Callistemon citrinus in Zone 1 (MLL/MLW = 11.5 ± 0.46), which showed an MLL/MLW ratio of 5.53, 3.83, and 4.98 times higher compared with Ligustrum lucidum, Eucalyptus ficifolia, and Tecoma stans, respectively. This species was also the only one that showed a lanceolate leaf shape in Zone 1. Some researchers reported that this leaf morphology characteristic was crucial for capturing PM [42].
Additionally, the results showed by Friedman’s test that there were significant differences in the MLL/MLW ratio between the species considered in Zone 2 (p-value < 0.001, n = 64). Similarly, the findings showed significant differences between the IPMCs of tree species in this zone (p-value = 0.008, n = 42). However, in this zone, a comparatively high magnitude in the MLL/MLW ratio was not observed among the species under study to explain the differences observed in IPMC. Probably the difference that could explain the largest IPMC of Quercus humboldtii compared to Lafoensia acuminata was its pubescent and non-smooth leaf surface (Table 3). For example, researchers indicated that the smooth leaves might have a higher PM wash-off level than rough leaves [5]. For smooth leaf surfaces, long duration-low intensity rainfall could increase PM removal rate while for rough leaf surfaces, short duration-high intensity rainfall could achieve a larger removal rate using the same amount of total rainfall [43].
4. Conclusions
The findings of this study show the following conclusions:
- The urban zones with the highest PM2.5 concentration also show the highest PM concentrations on exposed leaves of the trees. On average, PM concentrations on leaves in the zone of highest PM2.5 pollution (daily concentration = 25.4 µg/m3) are 6.56 times higher compared to the zone of lowest PM2.5 pollution (daily concentration = 13.2 µg/m3).
- The IPMC decreases as the PM2.5 concentration increases over time (potential trend). Namely, the leaf surface available in trees for PM interception is likely to decrease as the PM2.5 concentration increases. The species that best describe this trend in the zones of highest and lowest PM2.5 pollution are Ligustrum lucidum and Lafoensia acuminata, respectively. These two species are also those that show the largest effective IPMCs in their leaves (80.6% and 92.2%).
- On average, it is observed that for each 5.0 µg/m3 increase in PM2.5 concentration the IPMCs of the species Ligustrum lucudum and Lafoensia acuminata decrease by 33.6% and 23.1%, respectively. The IPMC also decreases with the leaf location height in the tree (exponential trend). Overall, the IPMC of the leaves located at 1.50 m from the ground is 5.13 times higher compared to the leaves located at a 3.0 m height. This trend is possibly associated with the location of PM emission sources on the roadways (e.g., vehicle exhaust height) and with the intensity of PM resuspension phenomenon from the surface road, which is generated by the vehicle turbulence and high wind speeds.
- The results show that when wind speed is increased in the study areas, there is an increase in PM2.5 concentrations and a reduction in the IPMCs. During these episodes, the leaves may reach their minimum level in IPMC because of a reduction in the leaf surface available for intercepting atmospheric particles.
- In the zone of highest PM2.5 pollution, a direct relationship of medium to considerable is observed between IPMC and LA of the species under study. Indeed, tree species that show the greatest LA are those with the highest IPMC. The results comparatively suggest that species with high magnitudes in the MLL/MLW ratio tend to show the lowest IPMC. This is the case of Callistemon citrinus, which has on average an MLL/MLW ratio of 11.5.
Author Contributions
Conceptualization, C.Z.-M., J.S.-L. and H.R.-Q.; Data curation, C.Z.-M.; Formal analysis, C.Z.-M., J.S.-L. and H.R.-Q.; Funding acquisition, C.Z.-M.; Investigation, C.Z.-M. and J.S.-L.; Methodology, C.Z.-M., J.S.-L. and H.R.-Q.; Project administration, C.Z.-M.; Resources, C.Z.-M. and J.S.-L.; Software, C.Z.-M. and H.R.-Q.; Supervision, C.Z.-M.; Validation, C.Z.-M., J.S.-L. and H.R.-Q.; Visualization, C.Z.-M., J.S.-L. and H.R.-Q.; Writing—original draft, C.Z.-M. and H.R.-Q.; Writing—review & editing, J.S.-L. and H.R.-Q. All authors have read and agreed to the published version of the manuscript.
Funding
This research received no external funding.
Institutional Review Board Statement
Not applicable.
Informed Consent Statement
Not applicable.
Data Availability Statement
Restrictions apply to the availability of these data. Data was obtained from Red de Monitoreo de Calidad del Aire de Bogotá (RMCAB) and Botanical Garden of Bogotá (JBB), and are available at http://201.245.192.252:81/Report/stationreport (accessed on 6 February 2020) and http://sigau.jbb.gov.co/SigauJBB/VisorPublico/VisorPublico (accessed on 6 February 2020) with the permission of RMCAB and JBB, respectively.
Acknowledgments
The authors wish to thank the Universidad Distrital Francisco José de Caldas, Botanical Garden of Bogotá, and Bogotá Environment Secretariat (Colombia).
Conflicts of Interest
The authors declare no conflict of interest.
References
- Escobedo, F.J.; Kroeger, T.; Wagner, J.E. Urban forests and pollution mitigation: Analyzing ecosystem services and disservices. Environ. Pollut. 2011, 159, 2078–2087. [Google Scholar] [CrossRef]
- Guidolotti, G.; Salviato, M.; Calfapietra, C. Comparing estimates of EMEP MSC-W and UFORE models in air pollutant reduction by urban tres. Environ. Sci. Pollut. Res. Int. 2016, 23, 19541–19550. [Google Scholar] [CrossRef]
- Nowak, D.J.; Hirabayashi, S.; Bodine, A.; Greenfield, E. Tree and forest effects on air quality and human health in the United States. Environ. Pollut. 2014, 193, 119–129. [Google Scholar] [CrossRef] [Green Version]
- Bell, M.L.; Morgenstern, R.D.; Harrington, W. Quantifying the human health benefits of air pollution policies: Review of recent studies and new directions in accountability research. Environ. Sci. Policy 2011, 14, 357–368. [Google Scholar] [CrossRef]
- Xu, X.; Xia, J.; Gao, Y.; Zheng, W. Additional focus on particulate matter wash-off events from leaves is required: A review of studies of urban plants used to reduce airborne particulate matter pollution. Urban For. Urban Green. 2020, 48, 126559. [Google Scholar] [CrossRef]
- Przybysz, A.; Nersisyan, G.; Gawroński, S.W. Removal of particulate matter and trace elements from ambient air by urban greenery in the winter season. Environ. Sci. Pollut. Res. Int. 2019, 26, 473–482. [Google Scholar] [CrossRef] [PubMed] [Green Version]
- Popek, R.; Gawrońska, H.; Wrochna, M.; Gawroński, S.W.; Saebø, A. Particulate matter on foliage of 13 woody species: Deposition on surfaces and phytostabilisation in waxes-a 3-year study. Int. J. Phytoremediation 2013, 15, 245–256. [Google Scholar] [CrossRef] [PubMed]
- Mori, J.; Hanslin, H.M.; Burchi, G.; Sæbø, A. Particulate matter and element accumulation on coniferous trees at different distances from a highway. Urban For. Urban Green. 2015, 14, 170–177. [Google Scholar] [CrossRef]
- Serbula, S.M.; Miljkovic, D.D.; Kovacevic, R.M.; Ilic, A.A. Assessment of airborne heavy metal pollution using plant parts and topsoil. Ecotoxicol. Environ. Saf. 2012, 76, 209–214. [Google Scholar] [CrossRef]
- Bealey, W.J.; McDonald, A.G.; Nemitz, E.; Donovan, R.; Dragosits, U.; Duffy, T.R.; Fowler, D. Estimating the reduction of urban PM10 concentrations by trees within an environmental information system for planners. J. Environ. Manag. 2007, 85, 44–58. [Google Scholar] [CrossRef]
- Lu, S.; Yang, X.; Li, S.; Chen, B.; Jiang, Y.; Wang, D.; Xu, L. Effects of plant leaf surface and different pollution levels on PM2.5 adsorption capacity. Urban For. Urban Green. 2018, 34, 64–70. [Google Scholar] [CrossRef]
- Chen, X.; Pei, T.; Zhou, Z.; Teng, M.; He, L.; Luo, M.; Liu, X. Efficiency differences of roadside greenbelts with three configurations in removing coarse particles (PM10): A street scale investigation in Wuhan, China. Urban For. Urban Green. 2015, 14, 354–360. [Google Scholar] [CrossRef]
- Yin, S.; Cai, J.; Chen, L.; Shen, Z.; Zou, X.; Wu, D.; Wang, W. Effects of vegetation status in urban green spaces on particle removal in a street canyon atmosphere. Acta Ecol. Sin. 2007, 27, 4590–4595. [Google Scholar] [CrossRef]
- Tallis, M.; Taylor, G.; Sinnett, D.; Freer-Smith, P. Estimating the removal of atmospheric particulate pollution by the urban tree canopy of London, under current and future environments. Landsc. Urban Plan. 2011, 103, 129–138. [Google Scholar] [CrossRef]
- Vos, P.E.J.; Maiheu, B.; Vankerkom, J.; Janssen, S. Improving local air quality in cities: To tree or not to tree? Environ. Pollut. 2013, 183, 113–122. [Google Scholar] [CrossRef]
- Buccolieri, R.; Gromke, C.; di Sabatino, S.; Ruck, B. Aerodynamic effects of trees on pollutant concentration in street canyons. Sci. Total Environ. 2009, 407, 5247–5256. [Google Scholar] [CrossRef]
- Zhang, X.; Lyu, J.; Han, Y.; Sun, N.; Sun, W.; Li, J.; Liu, C.; Yin, S. Effects of the leaf functional traits of coniferous and broadleaved trees in subtropical monsoon regions on PM2.5 dry deposition velocities. Environ. Pollut. 2020, 265, 114845. [Google Scholar] [CrossRef] [PubMed]
- Räsänen, J.V.; Holopainen, T.; Joutsensaari, J.; Ndam, C.; Pasanen, P.; Rinnan, Å.; Kivimäenpää, M. Effects of species-specific leaf characteristics and reduced water availability on fine particle capture efficiency of tres. Environ. Pollut. 2013, 183, 64–70. [Google Scholar] [CrossRef] [PubMed] [Green Version]
- Sæbø, A.; Popek, R.; Nawrot, B.; Hanslin, H.M.; Gawronska, H.; Gawronski, S.W. Plant species differences in particulate matter accumulation on leaf surfaces. Sci. Total Environ. 2012, 427–428, 347–354. [Google Scholar] [CrossRef]
- Letter, C.; Jäger, G. Simulating the potential of trees to reduce particulate matter pollution in urban areas throughout the year. Environ. Dev. Sustain. 2019. [Google Scholar] [CrossRef] [Green Version]
- Xie, C.; Yan, L.; Liang, A.; Che, S. Understanding the washoff processes of PM2.5 from leaf surfaces during rainfall events. Atmos. Environ. 2019, 214, 116844. [Google Scholar] [CrossRef]
- Secretaría Distrital de Ambiente. Informe Anual Calidad de Aire Bogotá 2019. Alcaldía Mayor de Bogotá. 2019. Available online: https://oab.ambientebogota.gov.co/?post_type=dlm_download&p=14112 (accessed on 18 May 2021).
- Secretaría de Movilidad. Movilidad en Cifras 2012. Alcaldía Mayor de Bogotá. 2012. Available online: http://www.simur.gov.co/portal-simur/wp-content/uploads/2019/files/datos-abiertos/movilidad-cifras/movilidad-cifras-2012-min.pdf (accessed on 5 February 2020).
- Jardín Botánico de Bogotá José Celestino Mutis. Sistema de Información para la Gestión del Arbolado Urbano. Available online: http://sigau.jbb.gov.co/SigauJBB/VisorPublico/VisorPublico (accessed on 6 February 2020).
- Badii, M.; Guillen, A.; Cerna, E.; Valenzuela, J. Nociones Introductorias de Muestreo Estadístico. Daena 2011, 6, 89–105. [Google Scholar]
- Scheaffer, R.L.; Mendenhall, W.; Ott, L. Elementos de Muestreo; Editorial Paraninfo: Madrid, Spain, 2006. [Google Scholar]
- Beckett, K.P.; Freer-Smith, P.H.; Taylor, G. Particulate pollution capture by urban trees: Effect of species and windspeed. Glob. Chang. Biol. 2000, 6, 995–1003. [Google Scholar] [CrossRef]
- U.S.EPA. Compendium of Methods for the Determination of Inorganic Compounds in Ambient Air. 1999. Available online: https://cfpub.epa.gov/si/si_public_record_report.cfm?Lab=NRMRL&direntryid=125969&subject=homeland+security+research&view=desc&sortby=pubdateyear&count=25&showcriteria=1&searchall=ceri&submit=search& (accessed on 23 May 2019).
- Duran, B.; Alzate, F. Total suspended particles interception by five urban tree species in Valle de Aburrá. Rev. Fac. Ing. Univ. Antioq. 2009, 47, 59–66. [Google Scholar]
- Guerrero, N.R.; Quintero, M.A.O.; Naranjo, J.C.P. Determinación del Área Foliar en Fotografías Tomadas con una Cámara Web, un Teléfono Celular o una Cámara Semiprofesional. Rev. Fac. Nac. Agron. Medellín 2012, 65, 6399–6405. [Google Scholar]
- Dobbs, C.; Hernández, J.; Escobedo, F. Above ground biomass and leaf area models based on a nondestructive method for urban trees of two communes in Central Chile. Bosque 2011, 32, 287–296. [Google Scholar] [CrossRef]
- Quiroz, J.; Soria, J. Caracterización Fenotípica del Cacao Nacional de Ecuador. 1994. Available online: https://repositorio.iniap.gob.ec/bitstream/41000/1579/1/Bolet%c3%adn%20t%c3%a9cnico%20N%c2%ba%2074.pdf (accessed on 18 May 2021).
- Hernández, R. Metodología de la Investigación; McGraw Hill: New York, NY, USA, 2014. [Google Scholar]
- Barima, Y.S.S.; Angaman, D.M.; N’gouran, K.P.; Kardel, F.; De Cannière, C.; Samson, R. Assessing Atmospheric Particulate Matter Distribution Based on Saturation Isothermal Remanent Magnetization of Herbaceous and Tree Leaves in a Tropical Urban Environment. Sci. Total Environ. 2014, 470–471, 975–982. [Google Scholar] [CrossRef]
- Wang, L.; Gong, H.; Liao, W.; Wang, Z. Accumulation of Particles on the Surface of Leaves during Leaf Expansion. Sci. Total Environ. 2015, 532, 420–434. [Google Scholar] [CrossRef] [PubMed]
- Mitchell, R.; Maher, B.A.; Kinnersley, R. Rates of Particulate Pollution Deposition onto Leaf Surfaces: Temporal and Inter-Species Magnetic Analyses. Environ. Pollut. 2010, 158, 1472–1478. [Google Scholar] [CrossRef]
- Ferm, M.; Sjöberg, K. Concentrations and Emission Factors for PM2.5 and PM10 from Road Traffic in Sweden. Atmos. Environ. 2015, 119, 211–219. [Google Scholar] [CrossRef]
- Pachón, J.E.; Galvis, B.; Lombana, O.; Carmona, L.G.; Fajardo, S.; Rincón, A.; Meneses, S.; Chaparro, R.; Nedbor-Gross, R.; Henderson, B. Development and Evaluation of a Comprehensive Atmospheric Emission Inventory for Air Quality Modeling in the Megacity of Bogotá. Atmosphere 2018, 9, 49. [Google Scholar] [CrossRef] [Green Version]
- Xie, C.; Kan, L.; Guo, J.; Jin, S.; Li, Z.; Chen, D.; Li, X.; Che, S. A dynamic processes study of PM retention by trees under different wind conditions. Environ. Pollut. 2018, 233, 315–322. [Google Scholar] [CrossRef]
- Harrison, R.M.; Yin, J.; Mark, D.; Stedman, J.; Appleby, R.S.; Booker, J.; Moorcroft, S. Studies of the Coarse Particle (2.5–10 μm) Component in UK Urban Atmospheres. Atmos. Environ. 2001, 35, 3667–3679. [Google Scholar] [CrossRef]
- Idiger. Precipitación y Temperatura. 2020. Available online: https://www.idiger.gov.co/web/guest/precipitacion-y-temperatura (accessed on 11 September 2020).
- Han, D.; Shen, H.; Duan, W.; Chen, L. A review on particulate matter removal capacity by urban forests at different scales. Urban For. Urban Green. 2020, 48, 126565. [Google Scholar] [CrossRef]
- Zhang, L.; Zhang, Z.; Chen, L.; McNulty, S. An investigation on the leaf accumulation-removal efficiency of atmospheric particulate matter for five urban plant species under different rainfall regimes. Atmos. Environ. 2019, 208, 123–132. [Google Scholar] [CrossRef]
Figure 1.
Study sites [24]. (a) Zone 1 = South Highway and (b) Zone 2 = Simón Bolívar Park.
Figure 1.
Study sites [24]. (a) Zone 1 = South Highway and (b) Zone 2 = Simón Bolívar Park.

Figure 2.
Diagram of boxes and whiskers for daily IPMCs of the species under study.

Figure 3.
Monthly IPMCs and PM2.5 concentration in air quality stations. Zone 1: Ligustrum lucidum, Eucalyptus ficifolia, Tecoma stans, and Callistemon citrinus. Zone 2: Lafoensia acuminata and Quercus Humboldtii.
Figure 3.
Monthly IPMCs and PM2.5 concentration in air quality stations. Zone 1: Ligustrum lucidum, Eucalyptus ficifolia, Tecoma stans, and Callistemon citrinus. Zone 2: Lafoensia acuminata and Quercus Humboldtii.

Figure 4.
IPMC variations with respect to the sampling height in Zone 1 species.


Table 1.
Monthly average IPMCs for species under study (potential model).
| Zone. | Species | Maximum IPMC | Minimum IPMC | Effective IPMC | Effective IPMC (%) |
|---|---|---|---|---|---|
| 1 | Ligustrum lucidum | 1281 | 249 | 1032 | 80.6 |
| Eucalyptus ficifolia | 1043 | 415 | 628 | 60.2 | |
| Tecoma stans | 675 | 436 | 239 | 35.4 | |
| Callistemon citrinus | 461 | 210 | 251 | 54.4 | |
| 2 | Lafoensia acuminata | 124 | 9.68 | 114 | 92.2 |
| Quercus Humboldtii | 125 | 31.2 | 93.8 | 75 |
Note. IPMC in µg/cm2.
Table 2.
Correlation (rs) between IPMCs and climate variables considered.
| Zone 1 | ||||||||
| Ll | Ef | Ts | Cc | PM2.5 | R | Vv | T | |
| (µg/cm2) | (µg/cm2) | (µg/cm2) | (µg/cm2) | (µg/m3) | (mm) | (m/s) | (°C) | |
| Ll (µg/cm2) | 1 | |||||||
| Ef (µg/cm2) | 0.858 ** | 1 | ||||||
| Ts (µg/cm2) | −0.14 | −0.293 | 1 | |||||
| Cc (µg/cm2) | 0.671 ** | 0.807 ** | −0.019 | 1 | ||||
| PM2.5 (µg/m3) | −0.613 ** | −0.537 * | −0.471 * | −0.526 * | 1 | |||
| R (mm) | 0.217 | 0.09 | −0.25 | 0.091 | 0.410 * | 1 | ||
| WS (m/s) | 0.481 * | 0.444 * | 0.119 | 0.504 * | −0.724 ** | −0.455 * | 1 | |
| T (°C) | −0.893 ** | −0.774 ** | −0.002 | −0.771 ** | 0.544 * | −0.371 * | −0.455 * | 1 |
| Zone 2 | ||||||||
| Qh | La | PM2.5 | R | Vv | T | |||
| (µg/cm2) | (µg/cm2) | (µg/m3) | (mm) | (m/s) | (°C) | |||
| Qh (µg/cm2) | 1 | |||||||
| La (µg/cm2) | 0.918 ** | 1 | ||||||
| PM2.5 (µg/m3) | −0.478 * | −0.544 * | 1 | |||||
| R (mm) | 0.558 * | 0.701 ** | 0.0851 | 1 | ||||
| WS (m/s) | 0.358 * | 0.378 * | −0.860 ** | −0.148 | 1 | |||
| T (°C) | −0.803 ** | −0.854 ** | 0.301 * | −0.752 ** | −0.094 | 1 | ||
Note: ** = significance < 0.001, * = significance < 0.05, Ll = Ligustrum lucidum, Ef = Eucalyptus ficifolia, Ts = Tecoma stans, Cc = Callistemon citrinus, Qh = Quercus humboldtii, La = Lafoensia acuminata, R = Rainfall, WS = Wind speed, and T = Temperature. In bold, significant correlations between IPMCs and climate variables considered.
Table 3.
Average leaf morphology of the tree species under study.
| Zone 1 | |||||||
|---|---|---|---|---|---|---|---|
| Species | IPMC | LA | MLL (cm) | MLW | MLL/MLW | Shape | Surface |
| (µg/cm2) | (cm2) | (cm) | Ratio | ||||
| Ll | 823 ± 210 | 30.6 ± 3.07 | 9.14 ± 4.02 | 4.40 ± 1.94 | 2.08 ± 0.92 | Oval to oval-lanceolate | Smooth |
| Ef | 791 ± 242 | 23.8 ± 4.00 | 10.7 ± 3.07 | 3.57 ± 1.02 | 3.00 ± 0.86 | Oval-lanceolate | Smooth |
| Ts | 625 ± 127 | 18.0 ± 2.44 | 8.81 ± 0.31 | 3.81 ± 0.14 | 2.31 ± 0.08 | Elliptical-lanceolate | Corrugated |
| Cc | 396 ± 73.4 | 2.52 ± 0.33 | 5.73 ± 0.23 | 0.50 ± 0.02 | 11.5 ± 0.46 | Lanceolate | Pubescent |
| Zone 2 | |||||||
| Qh | 91.3 ± 31.4 | 30.2 ± 4.50 | 9.84 ± 0.42 | 3.01 ± 0.13 | 3.27 ± 0.14 | Elliptical-lanceolate | Pubescent |
| La | 75.7 ± 35.1 | 19.4 ± 2.30 | 8.50 ± 0.31 | 3.47 ± 0.13 | 2.45 ± 0.09 | Elliptical | Smooth |
Note: Ll = Ligustrum lucidum, Ef = Eucalyptus ficifolia, Ts = Tecoma stans, Cc = Callistemon citrinus, Qh = Quercus humboldtii, La = Lafoensia acuminata, LA = Leaf area, MLL = maximum leaf length, and MLW = maximum leaf width.
Publisher’s Note: MDPI stays neutral with regard to jurisdictional claims in published maps and institutional affiliations. |
© 2021 by the authors. Licensee MDPI, Basel, Switzerland. This article is an open access article distributed under the terms and conditions of the Creative Commons Attribution (CC BY) license (https://creativecommons.org/licenses/by/4.0/).
Share and Cite
MDPI and ACS Style
Zafra-Mejía, C.; Suárez-López, J.; Rondón-Quintana, H. Analysis of Particulate Matter Concentration Intercepted by Trees of a Latin-American Megacity. Forests 2021, 12, 723. https://0-doi-org.brum.beds.ac.uk/10.3390/f12060723
AMA Style
Zafra-Mejía C, Suárez-López J, Rondón-Quintana H. Analysis of Particulate Matter Concentration Intercepted by Trees of a Latin-American Megacity. Forests. 2021; 12(6):723. https://0-doi-org.brum.beds.ac.uk/10.3390/f12060723
Chicago/Turabian StyleZafra-Mejía, Carlos, Joaquín Suárez-López, and Hugo Rondón-Quintana. 2021. "Analysis of Particulate Matter Concentration Intercepted by Trees of a Latin-American Megacity" Forests 12, no. 6: 723. https://0-doi-org.brum.beds.ac.uk/10.3390/f12060723
Note that from the first issue of 2016, this journal uses article numbers instead of page numbers. See further details here.