
Characterization of Water in Wood by Time-Domain Nuclear Magnetic Resonance Spectroscopy (TD-NMR): A Review


Key Laboratory of Wooden Material Science and Application (Ministry of Education), Beijing Forestry University, Beijing 100083, China
*
Author to whom correspondence should be addressed.
Forests 2021, 12(7), 886; https://0-doi-org.brum.beds.ac.uk/10.3390/f12070886
Submission received: 4 June 2021
/
Revised: 28 June 2021
/
Accepted: 29 June 2021
/
Published: 7 July 2021
(This article belongs to the Special Issue Evaluation and Protection of Wood and Wood Products)
Abstract
:This review summarizes the development of the experimental technique and analytical method for using TD-NMR to study wood-water interactions in recent years. We briefly introduce the general concept of TD-NMR and magnetic resonance imaging (MRI), and demonstrate their applications for characterizing the following aspects of wood-water interactions: water state, fiber saturation state, water distribution at the cellular scale, and water migration in wood. The aim of this review is to provide an overview of the utilizations and future research opportunities of TD-NMR in wood-water relations. It should be noted that this review does not cover the NMR methods that provide chemical resolution of wood macromolecules, such as solid-state NMR.
1. Introduction
Wood is a hygroscopic and porous material that constantly exchanges water with surrounding environment. The wood polymers (cellulose, hemicelluloses, and lignin) are abundant in hydrophilic functional groups, such as hydroxyls and carboxyls, which attract and bind moisture via hydrogen bonds. Wood also has a hierarchical void structure that can accommodate water clusters or fluids.
The basic unit of wood is wood cell. Water in green wood can be found in the form of bound water within the cell wall, and in the form of liquid or vapor state in cell cavity (lumina, pits, and other intercellular spaces) [1]. Traditionally, cell wall water was nominated as bound water, while cell lumen water as “free” water [2]. Bound water interacts with hydrophilic wood polymers and forms hydrogen bonds, which significantly affects the physical properties of wood [3]. Free water is suggested to drastically increase the decay susceptibility of wood [4]. The interactions between wood and water greatly influence wood structure and performance; thus, wood-water relations have been constantly investigated due to their central role in wood production.
The characterization methods of water in wood have progressed [5], and there are now various experimental techniques for qualitative analysis or quantitative calculation, covering a range of moisture content (MC) from the green state with liquid water to the absolute dry state. The most common method for MC determination is the gravimetric method, which directly provides information about the amount of water within wood. Other techniques characterize water indirectly by measuring the properties of water, such as heat flux, relaxation, spectral features etc., which also provide information for wood-water interactions. The indirect methods also show great potential in measuring and predicting MC in wood. For example, near-infrared spectroscopy (NIR) has been used for predicting the MC and moisture-related properties in wood [6]; the non-destructive ultrasound and wave-based methods are also sensitive to the change in the MC of wood [7]. The in-situ monitoring and characterization of wood MC and moisture-related properties will be realized with the combination of these indirect methods, which is of great importance for wood applications as building materials.
Among many experimental techniques for studying water in wood, time-domain nuclear magnetic resonance (TD-NMR) spectroscopy can cover the entire MC range from the absolute dry state to the fully water-saturated state [5]. It is also capable of distinguishing water molecules within the hierarchical structure of wood, such as cell walls and cell lumina. Also, by encoding the positional information with the NMR signal, magnetic resonance imaging (MRI) exhibits spatial information, providing an efficient method for monitoring water migration at cellular scale during wood drying and water uptake [8].
1.1. Basic Principles of TD-NMR Spectroscopy
Nuclear magnetic resonance (NMR) is primarily a physical phenomenon. TD-NMR, also known as Laplace inversion NMR, is a rapid non-destructive technique extensively used to monitor molecular dynamics, even in complex materials. The term low-field NMR (LF-NMR) has also been used in geological studies because the low magnetic field avoids the signal from influencing metallic ions, and suppresses the adverse effect arose from strong heterogeneities for porous materials [9]. The technique relates the measured signal decay to interactions among nuclear spins, and to the interactions of spins with their surroundings [10].
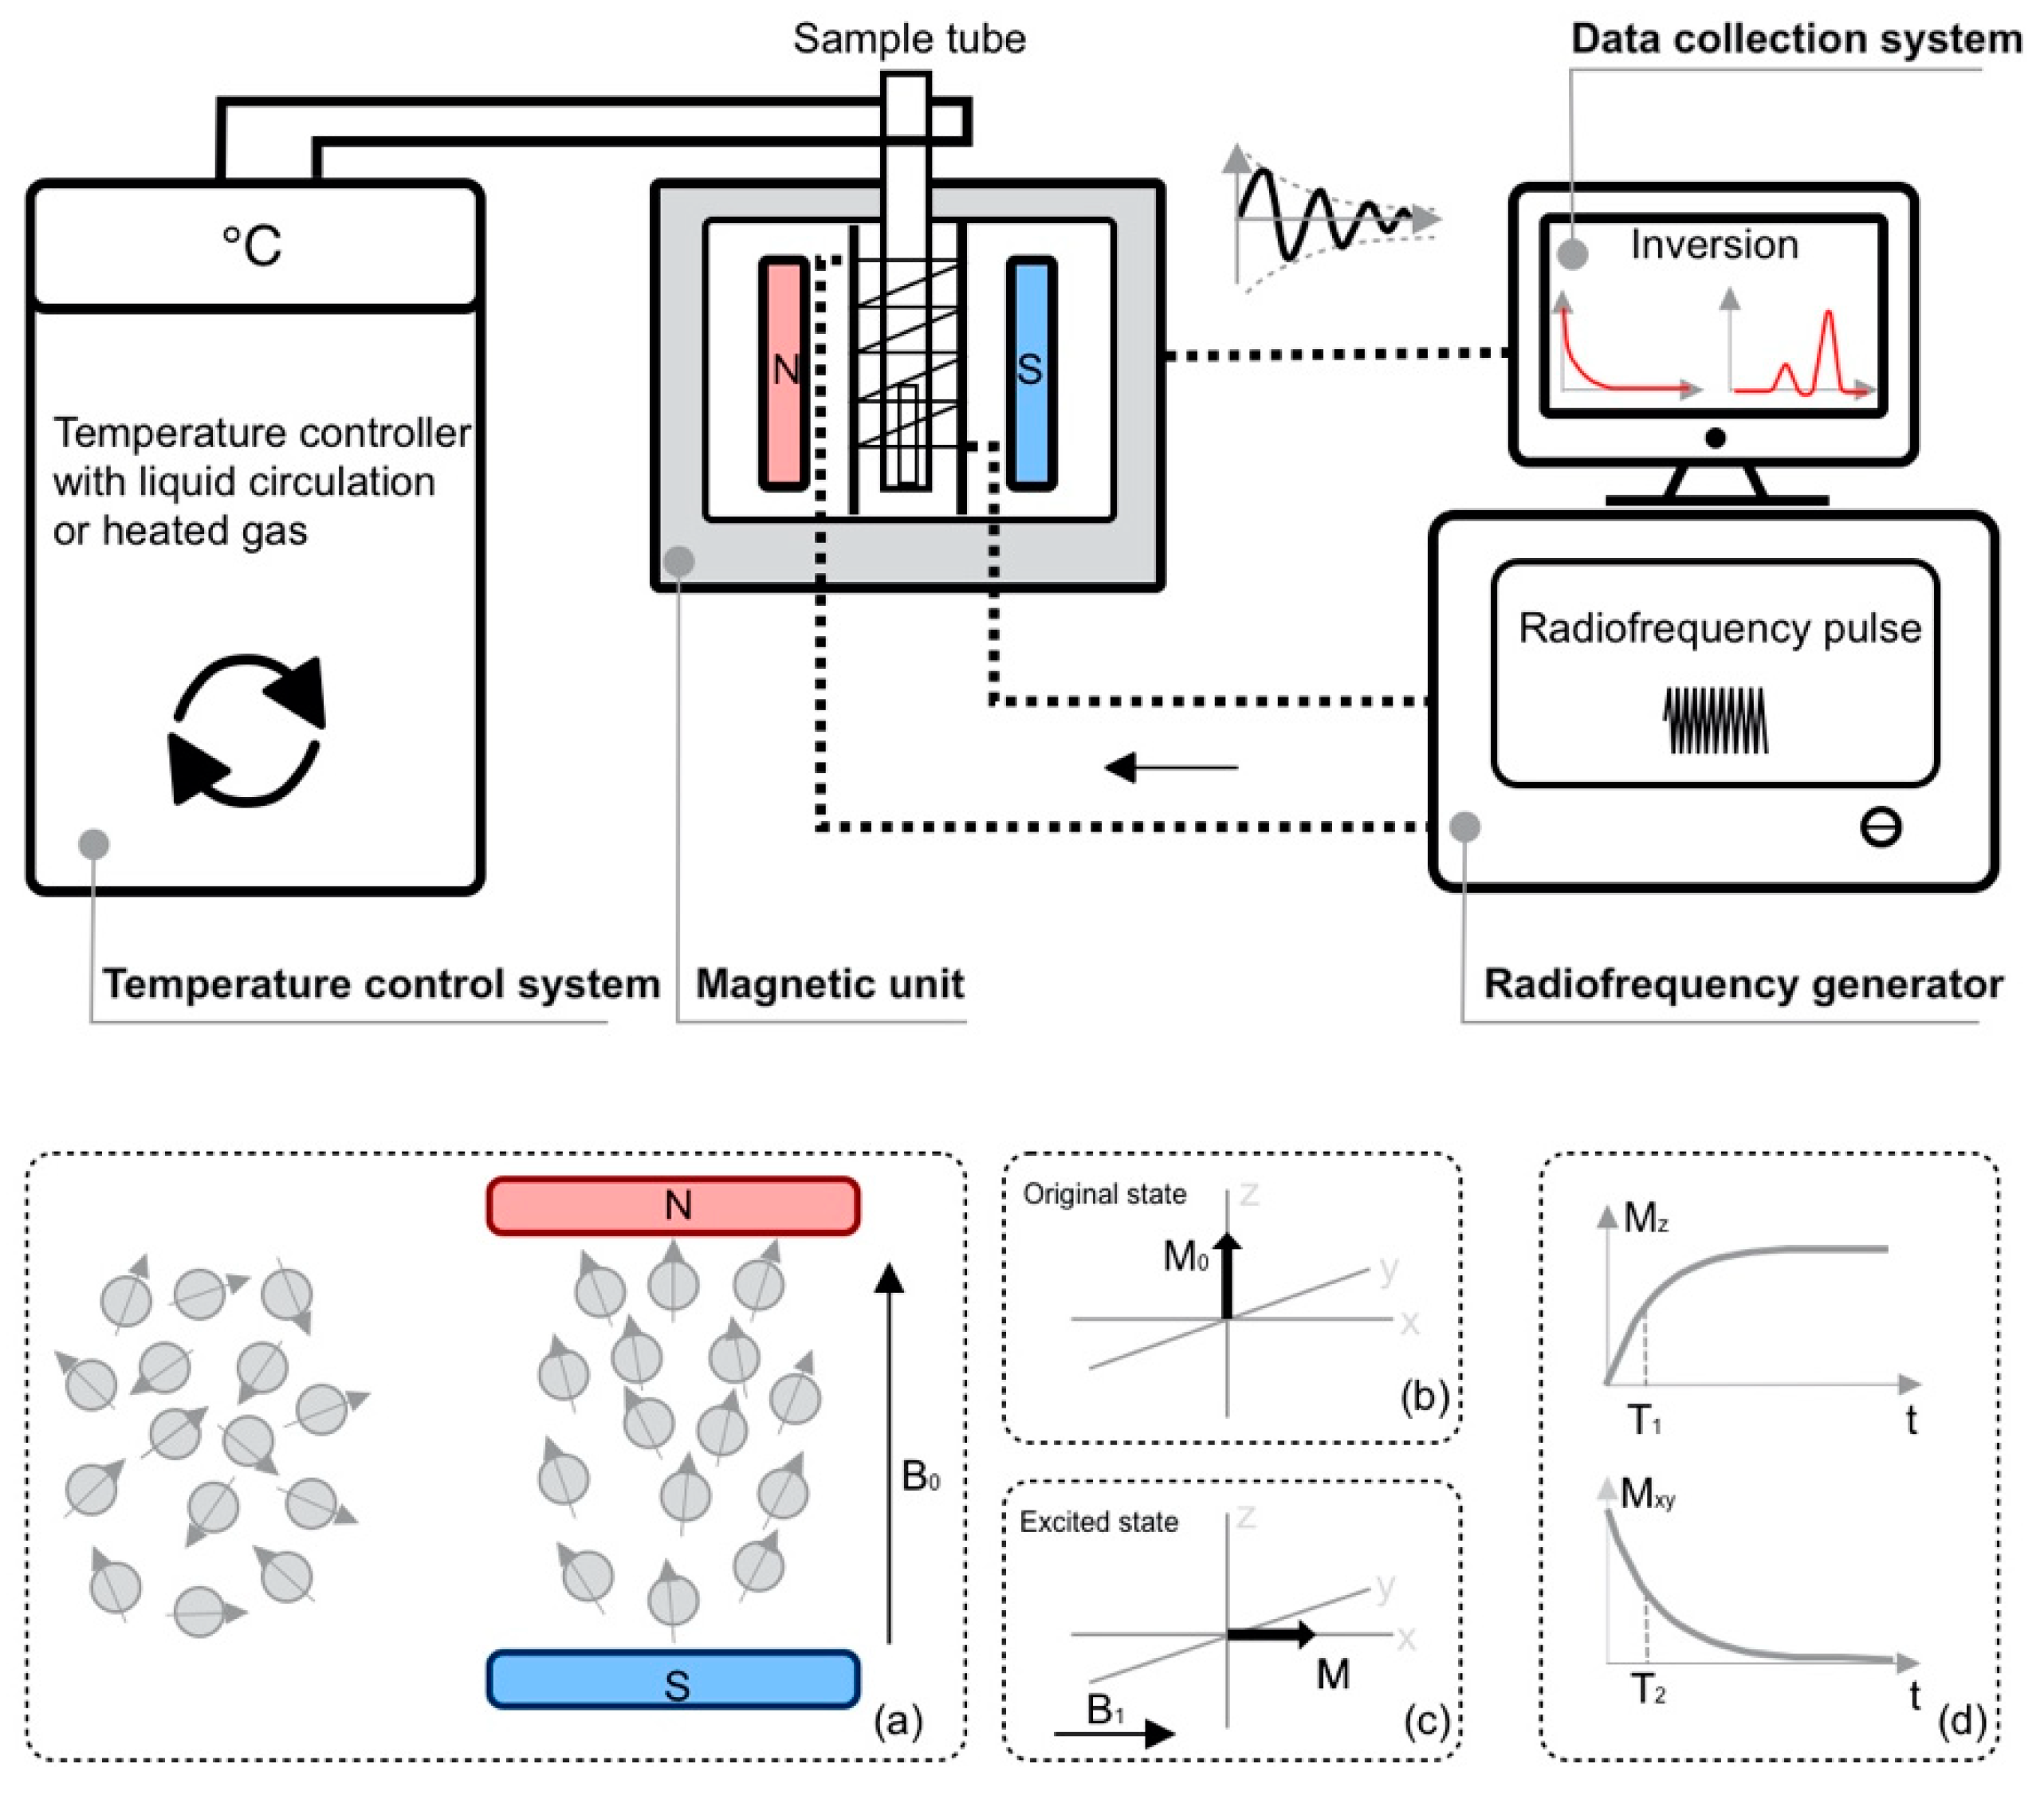
The basic principle for using TD-NMR involves detecting a signal using a spectrometer during the process where protons (hydrogen nuclei) are excited by a radiofrequency in a magnetic field. A magnet unit within the spectrometer generates a permanent magnetic field B0. The spins of hydrogen nuclei within the sample (with and against the field) change the average orientation due to the polarization generated by the field (Figure 1a), which causes a net magnetization vector M0 with B0 (Figure 1b). The excitation of radiofrequency pulses results in a magnetic field B1 oriented perpendicular to B0 (Figure 1c). These pulses will change the orientation of net magnetization M0 to M [5]. When the radiofrequency pulses are withdrawn, the spin system gradually releases energy. The decay of radiofrequency-induced NMR spin polarization is relaxation. The process of releasing energy is called spin-lattice relaxation (or longitudinal relaxation), which is manifested by the gradual recovery of the magnetization vector in the longitudinal direction of B0. At the same time, the spins interact with each other and cause dephasing in transverse direction. The dephasing process is called spin-spin relaxation (transverse relaxation) (Figure 1d). Longitudinal and transverse relaxation can be characterized by two time-domain parameters, longitudinal relaxation time T1 (in the z-axis,) and transverse relaxation time T2 (in the x-y plane) [11].
Relaxation time distribution investigations range from one-dimensional (1D) measurements to more complicated multi-dimensional ones. 1D NMR methods measure one main observable—the nuclear relaxation time constant T1 or T2; however, in multi-dimensional experiments, the signal is measured as a function of two or more independent variables, allowing the spin system to be suitable for different studying purposes [10]. Two-dimensional (2D) NMR offers an improvement in dispersing the constituents compared with basic 1D measurements. The relaxation time is measured twice in succession correlating T1–T2 or T2–T2, and so on [12,13,14]. A T1–T2 correlation map decouples physical and chemical effects by resolving the overlapping peaks in 1D measurements, and the measurement of a T2–T2 exchange map with different mixing times quantifies the molecule exchange rate [14]. The possibility of resolving NMR responses from different components is greatly improved [15], and it has potential applications in determining relaxation mechanisms for each component [9].
As mentioned above, before the signal decay is measured, the spins of the sample are excited by radiofrequency pulses. Different pulse sequences have been applied for acquiring time-domain parameters. For 1D TD-NMR experiments, the inversion recovery or saturation recovery is most often used to determine T1. T2 can be determined by free induction decay (FID) and the Carr-Purcell-Meiboom-Gill (CPMG) sequence [16,17]. The FID signal reflects both T2 effect and effect of field inhomogeneity. In the case of wood, FID provides information on both the solid material and the water inside it, while CPMG only provides information about the water molecules [18]. The signal of hydrogen nuclei in wood polymers rapidly decays, which is distinguishable from the water signal. By adjusting the echo time (TE), the signal decay curve only provides information of the various water components [19]. Moreover, the CPMG pulse sequence overcomes signal losses due to field inhomogeneities and self-diffusion [20]. For 2D TD-NMR, sequences are designed to combine 1D pulse sequences with specific time intervals and gradients [14].
Longitudinal and transverse relaxations are both first-order processes; therefore, they can be described by exponential decay functions with a characteristic relaxation time distribution [5]. The acquired data is evaluated or deconvoluted using two methods: discrete multiexponential fitting [21,22] or inverse Laplace transform (ILT) methods [12,14,15,23]. The ILT methods demonstrate relaxation times in a continuous distribution [12,24].
1.2. The Overview of TD-NMR Applications for Studying Wood-Water Relations
The relaxation property of confined water in porous materials depend on pore size as well as interactions between the pore wall and water. The Bloembergen-Purcell-Pound theory (BPP theory) indicates that the relaxation time measurement of the 1H of water in wood is related to their correlation times of dipolar interaction [9,20], as shown by Equation (1):
where is the Larmor frequency, is correlation time, and K is a constant.
According to the surface relaxation theory, the 1H relaxation time measurements are mainly contributed by the bulk relaxation and surface relaxation of confined water. Assuming the system is in the fast exchange limit, the exchange time between water molecules on the surface and liquid in pore will be short [20]. The relaxation time rates will be exhibited by all the confined water as expressed by a weighted average of the bulk (TB) and surface relaxation (TS) rates, as shown by Equation (2) [9,25]:
where and are the fraction for the bulk and the absorbed volume fraction within the pore. D is the diffusion coefficient of water in porous media, γ is the gyromagnetic ratio of hydrogen nucleus, G is external magnetic field gradient. TE is the echo time. Note that T2 is also affected by diffusion relaxation. If the experiment is done in a uniform low magnetic field with short echo time, the diffusion relaxation can be ignored owing to its small value [9].
Water in wood is of pore size dependence thus can be distinguished based on relaxation time distribution. By measuring the relaxation times and deconvoluting them, the water components in wood, i.e., cell wall water, cell lumen water in pores with various sizes, can be evaluated. Since the late 1970s, some studies have carried out 1D NMR relaxation analysis, including the establishment of the quantitative relationships between MC and FID signals [19,26,27,28,29]. Later works mainly used CPMG relaxation [18,22,28,30,31,32,33,34,35,36,37,38,39,40,41]. Further understanding of the water components was presented with the assistance of T1–T2 TD-NMR [13,42,43,44,45]. The fiber saturation state of water-saturated samples can be determined using a freezing and thawing technique [38,40,46,47,48,49]. The spatial distribution of water was presented by the visualization of MRI [8,45,50,51].
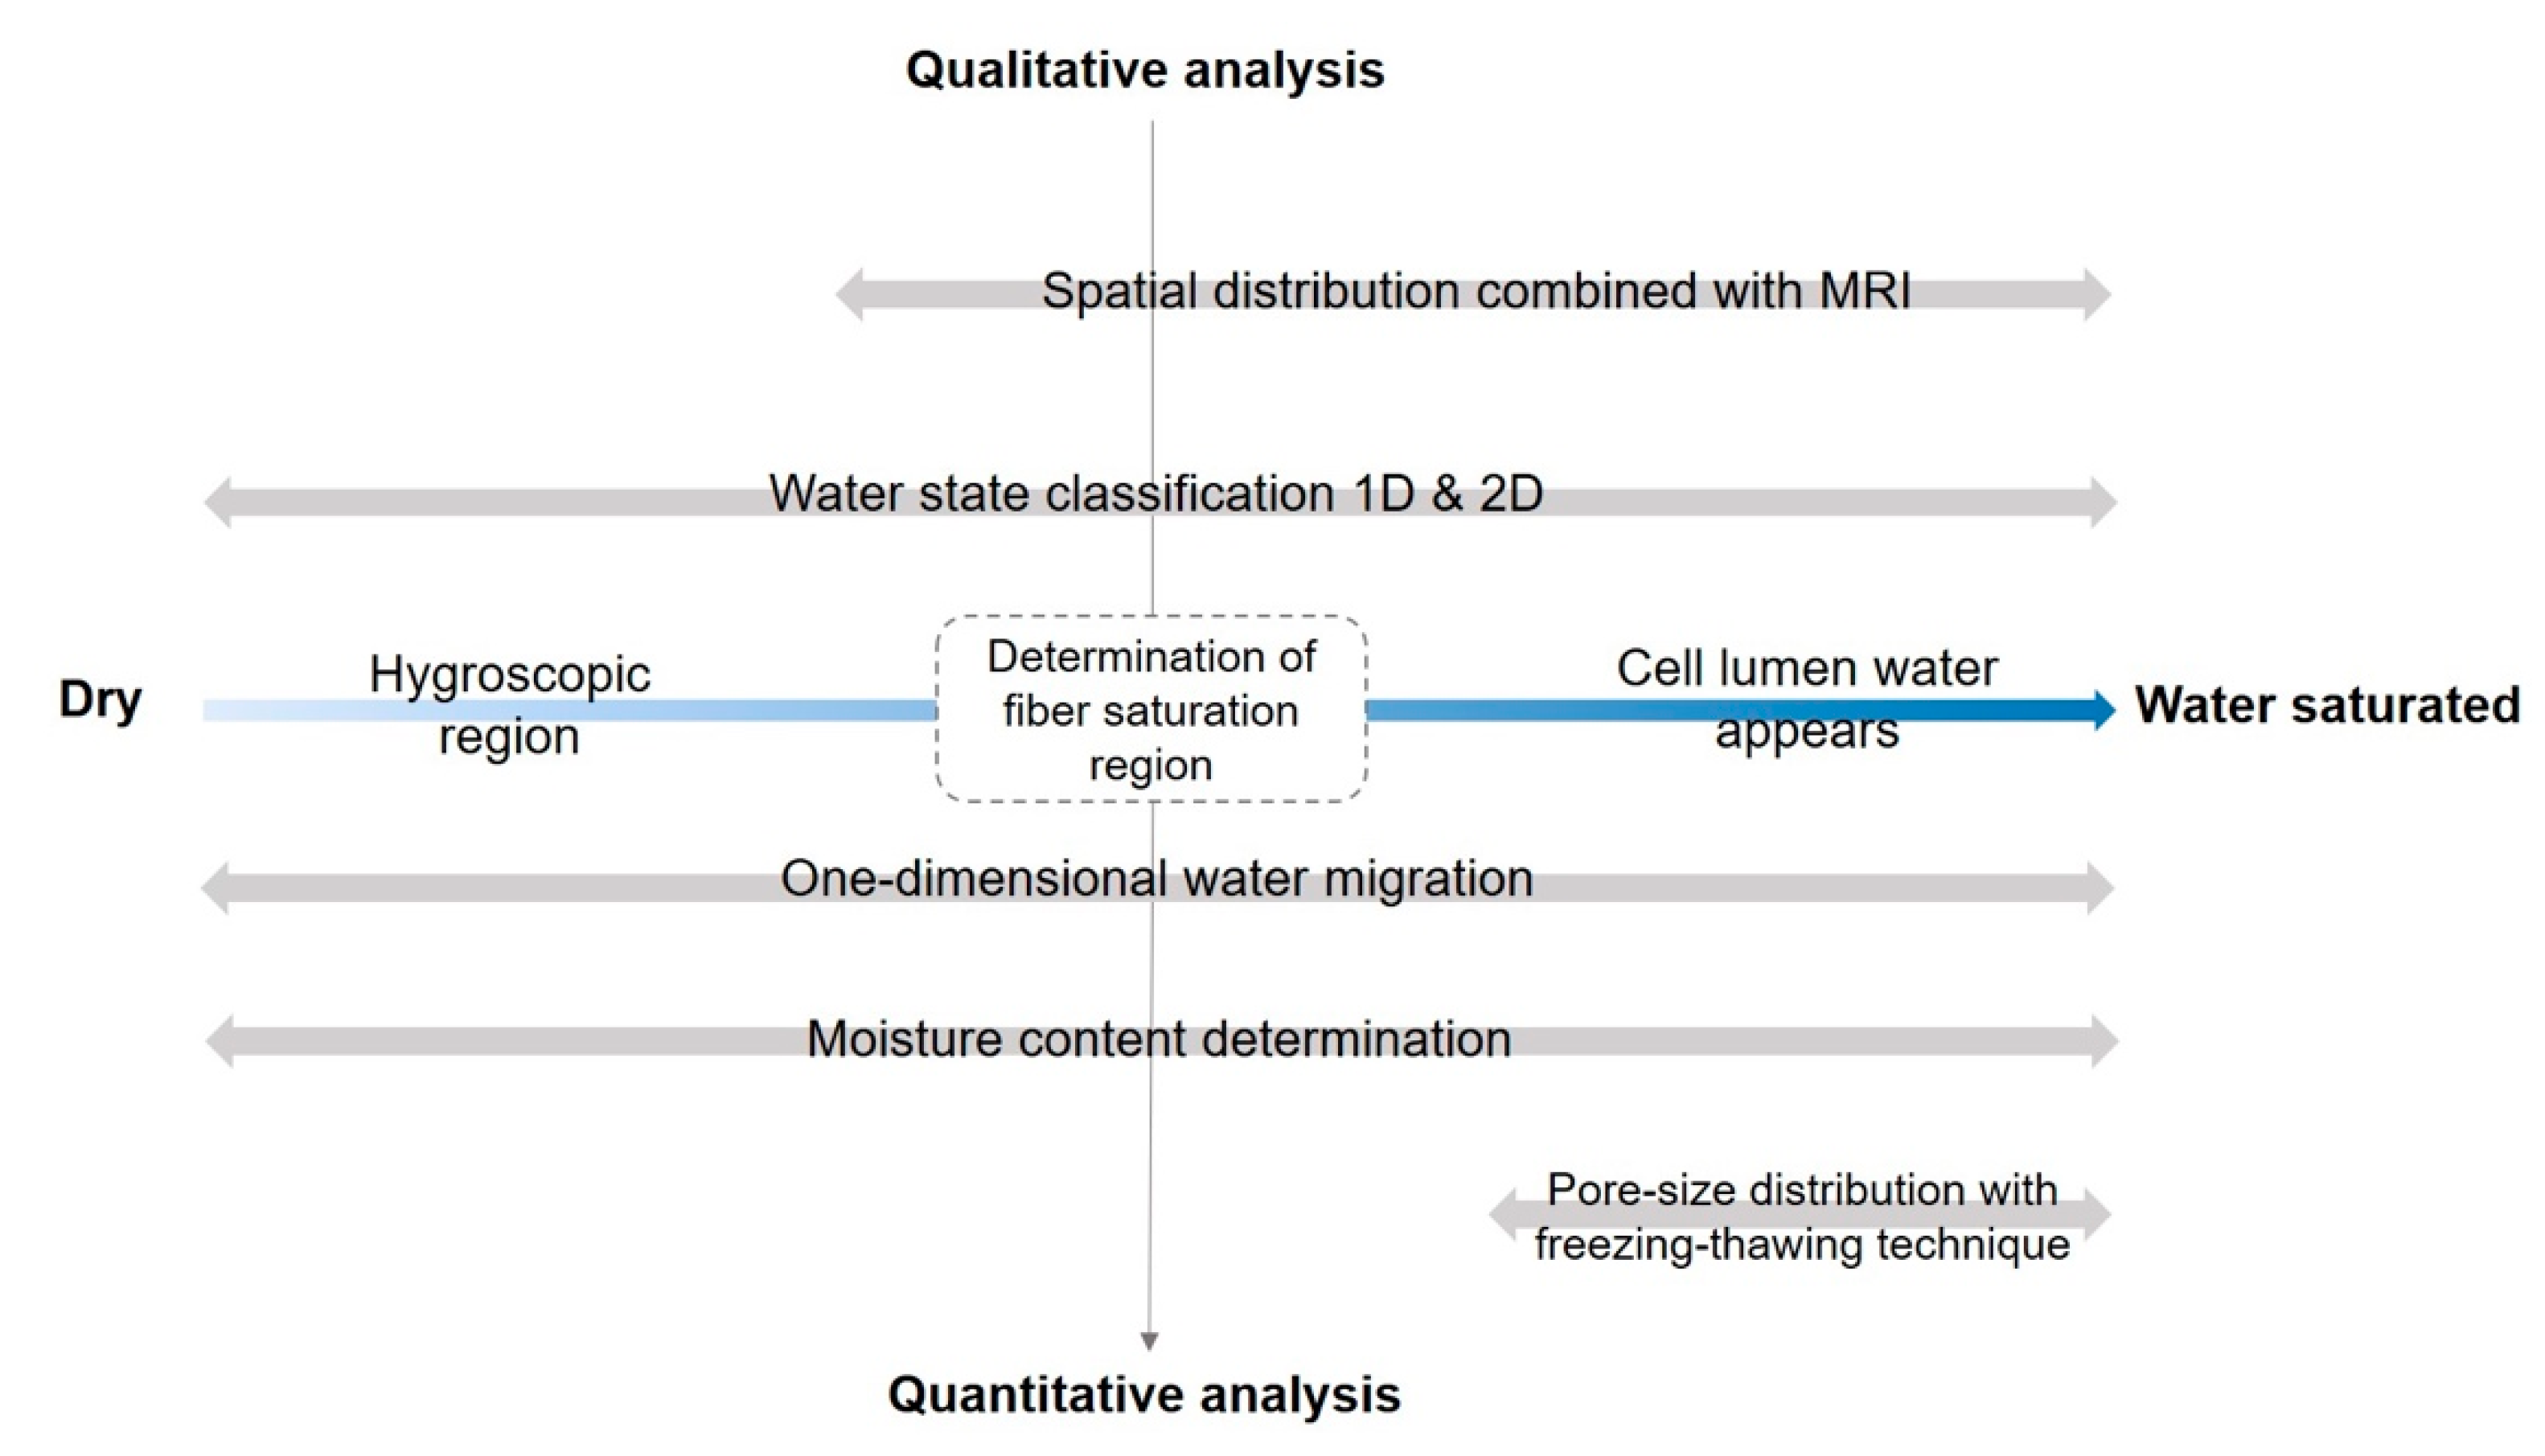
On the basis of the above-mentioned principles, TD-NMR shows potential applications for studying wood-water relations in full moisture content range from dry to water-saturated (Figure 2). In this review, the moisture range was separated into two regions, hygroscopic region and the region where cell lumen water appears. The applications were mapped according to qualitative analysis and quantitative analysis and their coverage of moisture contents. Here quantitative analysis refers to using amplitude of NMR signal. Note that this review does not cover the NMR methods that provide chemical resolution of wood macromolecules, such as solid-state NMR, nor does the review include any diffusion techniques, such as pulsed-field gradient NMR (PFG-NMR), as the relevant studies were thoroughly reviewed by Ref. [52] and Ref. [53], respectively.
2. The TD-NMR Applications in Wood-Water Study
TD-NMR provides detailed insights into the water in wood from the perspective of relaxation. We summarized the studies based on 1D (CPMG) and 2D (T1–T2 or T2–T2) pulse sequences for (a) identifying water components in wood over the whole MC region, (b) re-evaluating fiber saturation state, and (c) detecting the pore distribution in cell walls and locating cell wall water. Also, MRI technology is introduced for (d) visualizing water distribution and migration. Several gaps with opportunities for future research were also briefly discussed.
2.1. States of Water in the Wood
The classification of water components is a critical issue that has been widely discussed with the help of TD-NMR. Several authors have characterized water in wood based on the T2 time distribution from relaxation curves [28,33,54,55,56]. After continuous distribution inversion of exponentials, the water components are displayed as peaks, and different water states are classified by different T2.
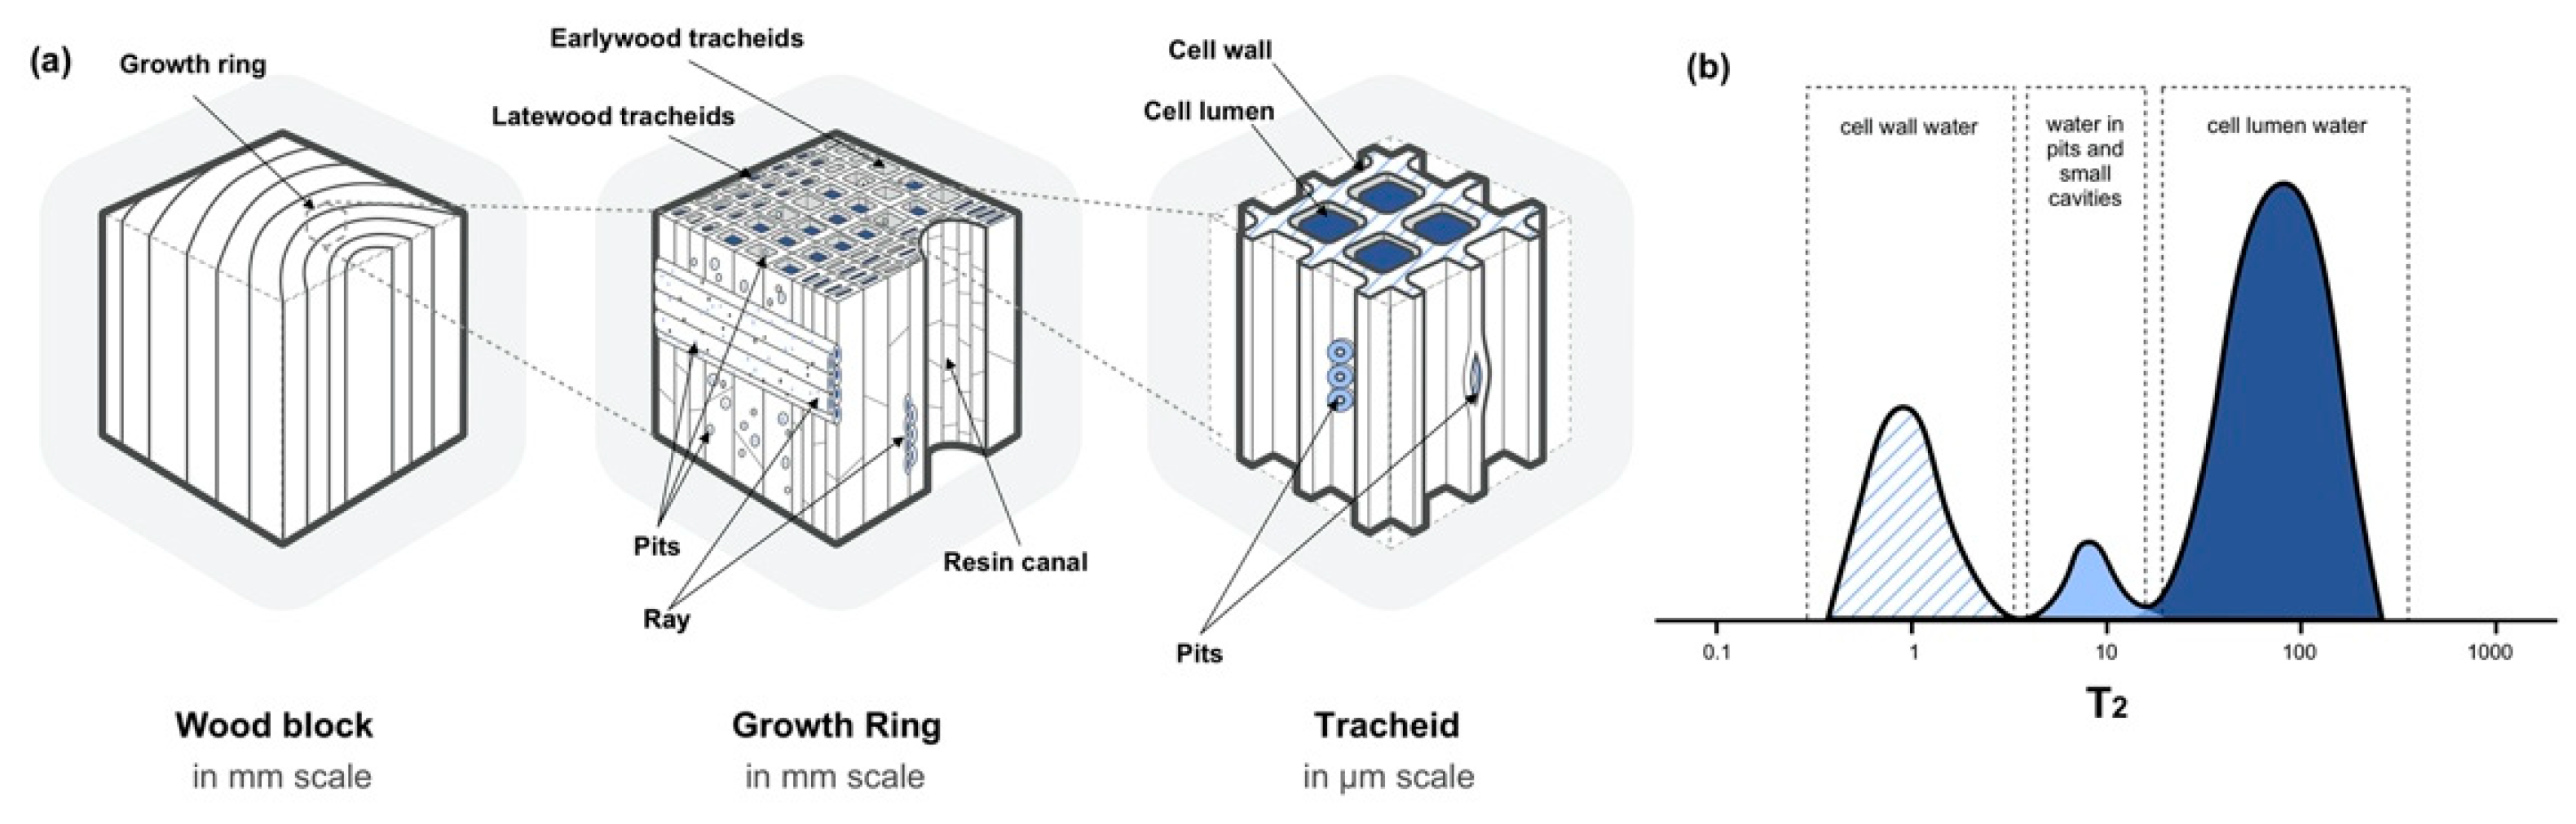
Wood hierarchical structure varies from millimeter scale to nanometer scale. At cellular level, take softwood for an example as shown in Figure 3a, a wood block is made up by growth rings, which are composed of earlywood and latewood cells. The vertical direction of softwood is mostly composed of tracheid, and the horizontal direction is mainly the ray parenchyma cells. For certain species such as pine, resin canals are present in vertical direction as void spaces, which are composed of parenchyma cells that function as resin producers [57].
Using CPMG sequence, TD-NMR can identify two states of water based on its location, which are ascribed to cell wall water and cell lumen water. T2 reveals that cell wall water molecules in wood display shorter T2, where water molecules are confined in more limited spaces or more tightly held by wood polymers. Void size greatly affects the motion of water molecules, the more confined the void space is, the faster the water molecular motion will be. Water molecules adsorb on hydroxyl groups of wood polymers by hydrogen bonding in the cell wall, which allows more intimate contact, and a stronger binding energy between water and cell wall polymers. In this way, the water relaxation occurs faster [18,56,58,59,60,61]. The T2 assignments are briefly demonstrated in Figure 3b, where the peak with the fastest relaxation time was assigned to cell wall water or bound water (~10 ms, blue lined-area). The other two to three peaks (above 10 ms) in water-saturated or green samples were ascribed to free water or water in various macrovoids of wood; water in voids or small cavities appears between 10 to 100 ms (light blue area); cell lumen water appears above 100 ms (dark blue area) [22,35,36,40,46,62]. Table 1 summarizes T2 assignments obtained from CPMG relaxation curves, where the peaks are assigned based on the physical location of water in wood. Note that Table 1 only summarizes the references after the year 2006, for previous studies please refer to Ref. [18].
The T2 of free water is generally proportional to the lumen diameter; therefore, the lumen water peaks are highly variable for different wood species due to wood anatomy. In the studies of water-saturated samples, two lumen water peaks and one surface water peak have been observed [18,22,47,59]. The two lumen water peaks with different intermediate T2 ranges were assigned to cell lumina with various pore sizes. The peak with the longest T2 (100–1000 ms) may result from residual surface water [22]. In Ref. [22], two lumen water populations of Norway spruce (Picea abies (L.) Karst.) were assigned to void types based on the void volumes for cell lumen water. The authors attributed the peak with longer T2 to water in the tracheid cell lumina, and the peak with shorter T2 to water in pits (or pits and ray lumina), as a result of good correlation between the pore volumes and the integral areas of the T2 peaks for water-saturated sample.
Changes in T2 distributions provide detailed information on the changes in wood microstructure due to different modification methods. Peak shifts and intensity are often discussed in wood modification. As shown in Table 1, the removal of hemicellulose produced longer T2 values for cell wall water [60]. The reduced hydrophilicity also increased lumen water T2 values for charring [58], furfurylation [18,59,66], acetylation [38,39], and thermal modification [47,50]. This change occurred because the cell wall became hydrophobic due to modification. It was also suggested that the shorter relaxation time resulted from the reduction in the space accessible to water within the cell wall as a result of cell wall bulking or crosslinking. The combined results of TD-NMR and differential scanning calorimetry (DSC) indicated that the cell wall water interactions with wood polymers were weaker in acetylated wood [39]. Wood modification could be used as a tool to understand the state of water in wood in turn [67].
For 1D TD-NMR, we did not find agreement on one specific criterion for the assignment of cell wall water in wood. In 1D NMR measurements, undistinguished peaks were separated at the T2 time-point with the lowest amplitude, which leads to some ambiguity. The overlapping peaks in the T2 distribution spectra were assigned to water components with similar T2 values.
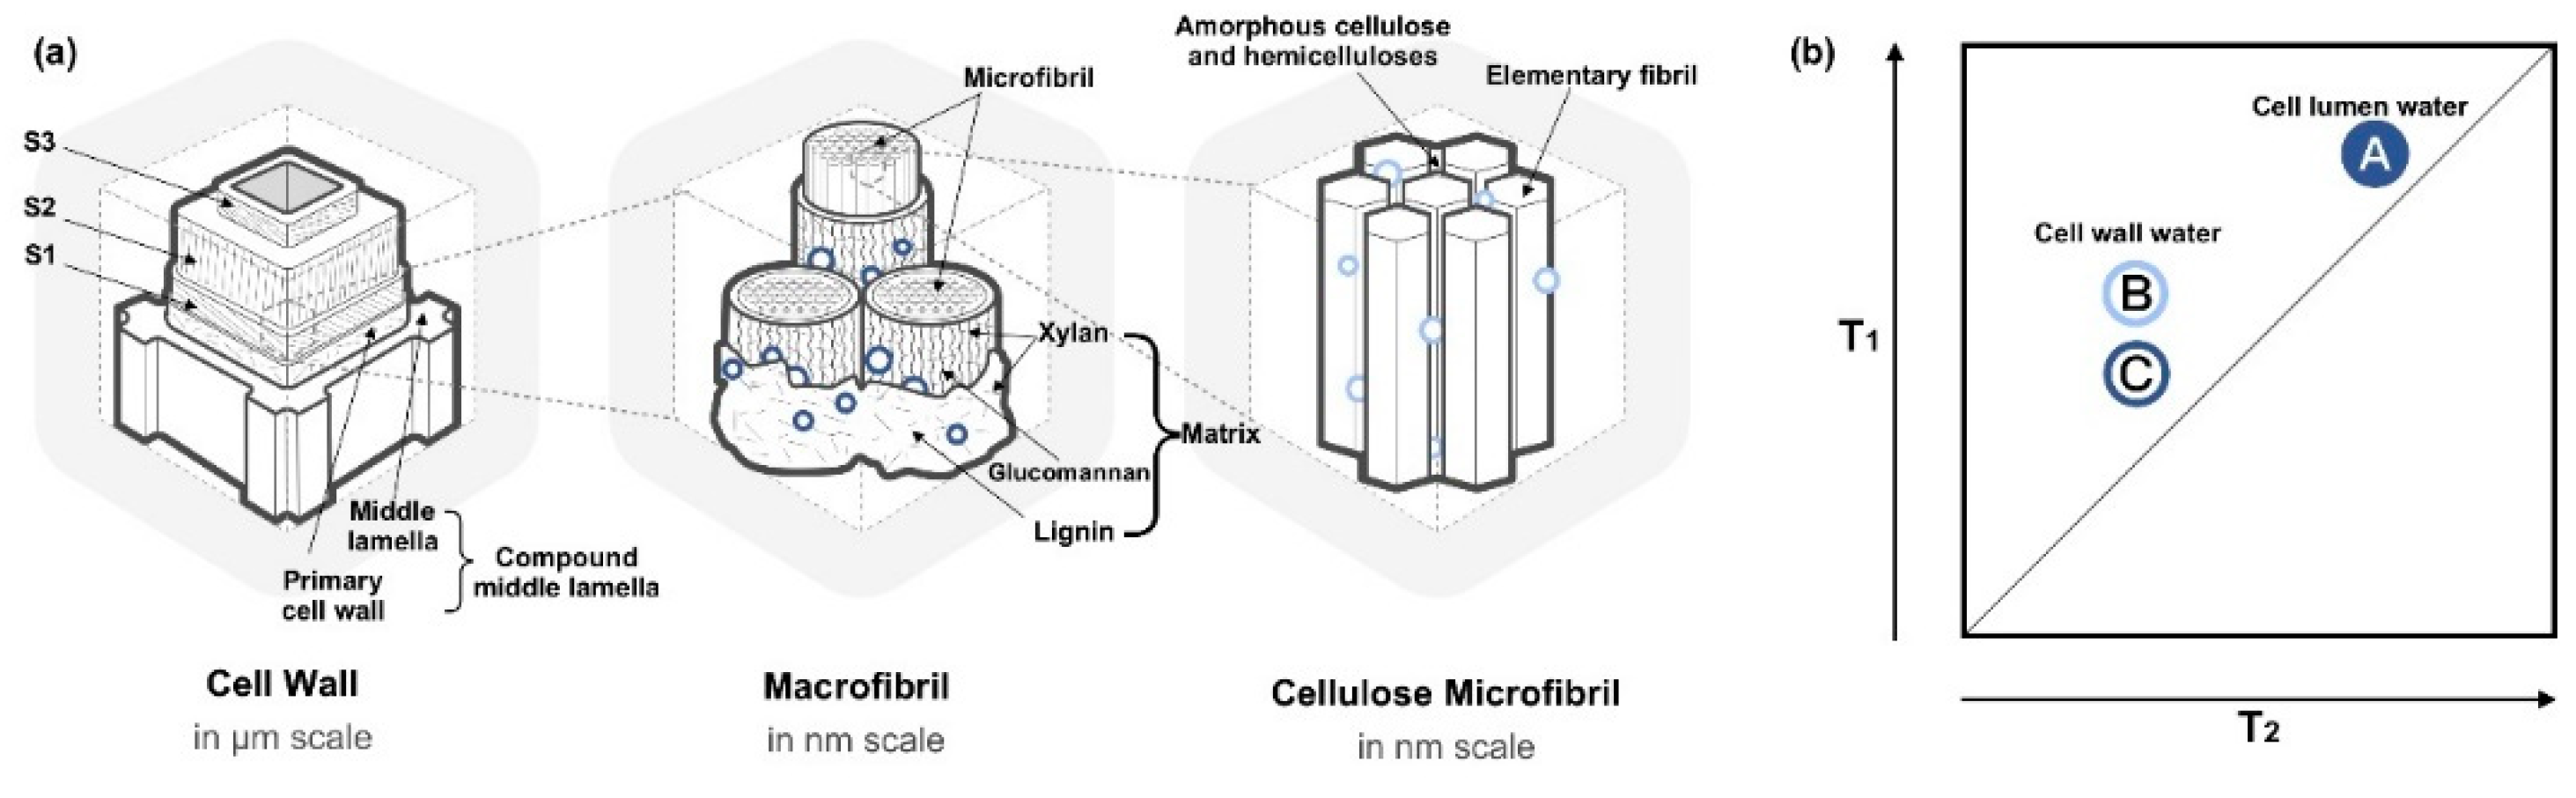
The widths of wood cells are on the order of tens of micrometers. At sub-cellular level, wood cell walls consist of four layers, primary cell wall and three secondary cell wall layers (S1, S2 and S3), as in Figure 4a. The primary wall and middle lamella are often mixed together and difficult to separate, therefore, they are frequently combined into one part called the compound middle lamella (CML). The adjacent cells are held together by CML, which is proposed to be a matrix of mainly lignin and hemicelluloses. Secondary cell wall dominates the most part of the cell wall. The three layers of secondary cell wall are structurally composed of parallel-oriented cellulose microfibrils, which have different helical inclinations to the cell axis often termed as cellulose microfibril angle, MFA [68]. The S2 layer consists of 70–90% thickness of the secondary cell wall, and exhibits low MFA with the longitudinal axis. S1 and S3 have much higher MFAs, which restrains the deformation when S2 swells and shrinks.
In the S2 layer, macrofibrils arrange in concentric lamellar layers in the scale of 10–20 nm [42,69], where cellulose microfibrils aggregate in bundles, embedded within a matrix consisting of hemicelluloses and lignin [68]. The nanoscale macrofibrils are composed of cellulose microfibril, where glucomannan sheath around microfibrils and xylan perpendicular to the microfibrils [69]. Lignin encrusts on the surface of hemicellulose and the remaining S2 volume [69]. The cellulose microfibril bundles are formed by elementary fibrils surrounded with amorphous cellulose and hemicelluloses.
2D TD-NMR produces a matrix of correlated spectra, which facilitates the dispersion of physical confinement and chemical influences, as shown in Figure 4b. Employing a more advanced 2D TD-NMR experiment, cell lumen water (labeled as A) and two different states of water within the wood cell wall were identified (labeled as B and C). Two components had similar T2 but different T1 (Figure 4a), thus resulting in only one CPMG peak in 1D NMR. Shorter T1 and T2 indicated a reduced mobility of the water molecules, which may cause by physically-confined environment like smaller pores. Higher T1/T2 (>1) ratios indicated the dominant influence of the local chemical composition on decreasing T2 [42,43,44,70]. The two components were tentatively assigned to “small water clusters or mobile water and possibly water in small voids which did not contribute to moisture-induced deformations (as in Figure 4b—C)” and to “adsorbed water or less mobile water that swells wood polymers (as in Figure 4b—B)”, respectively [13]. These two water components were further confirmed to be bound to the mixed sorption sites with different natures; thus, they were located in various environments with different mobility [42]. The two cell wall water components were hypothetically assigned to two reservoirs at the macrofibril scale: the strong cell wall water (B) located in lamellar areas at the interface with microfibrils and in amorphous areas of microfibrils; the weakly-bound cell wall water (C) located at the interface with macrofibrils and matrix. In contrast to the previous study [13], Ref. [42] proposed that both the types of cell wall water would interact with wood polymers and induce deformation.
The result of Quasielastic Neutron Scattering (QENS) also proposed that two water components were detected in the cell wall with different dynamic states, namely slow water and fast water [71]. Slow water corresponded to water interacting with the surface of the wood polymers, whereas, fast water corresponded to confined water which mainly interacted with water molecules. Whether the two water components detected by QENS and 2D TD-NMR are aligned need further research. One possible method could be applying 2D TD-NMR on hemicellulose-removed or lignin-removed wood samples to explore the changes in cell wall water B and C.
In summary, TD-NMR is a powerful tool for identifying water states at different moisture contents. In 1D TD-NMR, it is challenging to distinguish overlapping peaks for cell wall water in wood. 2D T1–T2 TD-NMR shows distinct advantages for resolving peaks and can distinguish different water components of porous materials with spatially heterogeneous chemical compositions [72]; however, due to the long T1 signal acquisition times, experiments should be carefully designed, and the sample tube should be modified to prevent moisture exchange with the environment.
Determining the water state is crucial for developing a sorption theory. A wood sorption isotherm has been developed by water cluster theory [73,74] and further verified by NMR. It was proposed that, at high relative humidity, the hydrogen bonds between hydroxyl sites and water molecules were weakened because the water molecules formed clusters with other water molecules, which then moved as a unit from site-to-site. Study examined the T1 distribution of water bonded to the sorption sites of wood polymers and found that the exchange between hydroxyl bonds and water clusters was slow in the case of pine wood [46]. If the assumptions of cluster theory were accurate, the exchange between the hydrogen-bonded molecules and the clusters should be fast [46]. However, according to the experimental results of NMR results in Ref. [46], the exchange was slow; thus, the water cluster model does not seem to be valid in the case of pine. In this case, TD-NMR showed the ability to study wood-water interactions from the T1 of water molecules. By identifying the bonding or clustering state of water molecules below the fiber saturation point, the understanding of sorption theory was enriched from the perspective of molecular dynamics.
2.2. Determining the MC and Fiber Saturation State
Traditional gravimetric methods cannot distinguish the state of water nor determine its moisture content separately. With the non-intrusive nature and sensitivity to water, TD-NMR can be used to quantitatively determine water in wood by measuring proton concentrations. Studies have shown that TD-NMR is comparable in accuracy and reliability to the gravimetric method. The measurement is based on the assumption that only water signal is captured and the relationship between the amplitude of the total signal and the mass of water in the sample can be precisely calibrated; therefore, the MC of a sample can be determined instantaneously, regardless of wood species. Thus, it has short measurement times with a high accuracy [29].
After determining the total amount of water in the sample, the TD-NMR signals were further analyzed by deconvoluting the T2 relaxation curves. Peaks with different relaxation time ranges are assigned to different water components; therefore, the TD-NMR signal can be converted into the MC. In this way, different water components are quantified during water uptake and drying [40,49,61,75,76].
Quantitative analysis of the relaxation time distributions is based on the fact that the MC of each water component can be determined from the integral areas of NMR signals. The moisture content of each peak is calculated by Equation (3) [46,49]:
where MCtotal is the total MC of the wood sample (the ratio of the mass of water to the mass of the oven-dried wood); MCi is the MC of the subpeaks; Si is the integral of the subpeaks; and Stotal is the integral of the whole T2 spectrum.
Drying reduces the moisture content in green wood and desaturates the cell wall water. The moisture content that differentiates between the states of water and indicates an evident change in wood properties is defined as the fiber saturation point (FSP). The original definition of the FSP was brought up by Tiemann in 1906 [77]. Tiemann described the macroscopic behaviour of wood drying and water uptake. The FSP was designated as the moisture content at which the free water had disappeared, and further reduction of moisture caused drying of cell walls and changes in wood strength. Later researchers kept on identifying the definition and further evaluated other properties of wood and water. Stamm in 1929 described FSP in terms of cellular structure, and emphasized that FSP may be considered as the state in which the cavity of the fiber is entirely free from water and its wall is saturated throughout [78]. As almost every wood property is influenced by cell wall water, therefore FSP could be determined by the total capacity of cell wall water. Stone and Scallan in 1967 defined that FSP was the amount of water contained within the saturated cell wall [79]. To measure the FSP, the TD-NMR method followed the definition of Ref. [79] and related FSP to “the amount of water contained within the water-saturated cell wall” [38,41,46,47,48,49].
For wood with high water contents or complex pore structures, the FSP calculated by sample relaxation inversion was unstable and tended to decrease upon increasing water content. The difference was once attributed to the fast exchange between cell lumen water and cell wall water components [46]. To avoid this error, the MC of cell walls can be measured and calculated above 0 °C and below –3 °C in saturated state [46]. Due to the fast exchange of water components, the integrals of the cell wall water and cell lumen water peaks do not reflect accurately the amount of water on those sites. As originally shown in Ref. [46], cooling the sample below melting point of bulk water caused freezing of cell lumen water in wood sample. This stopped the exchange between the water within and outside of the cell wall, and only cell wall water signal was observed in CPMG experiment due to short T2 of ice. Therefore, below −3 °C, the water outside of the cell wall is frozen, and the relaxation signal is not visible; thus, cell wall water signal is exclusively observed. The comparison of total signal above and below the water melting point determines FSP. The total MC of cell wall (Mcw) can be calculated using Equation (4):
where MCx is the MC at room temperature in the water-saturated state, and S270K is the integral area at 270 K. In contrast, Sx is the integral area at room temperature. Note that the signal amplitude is temperature dependent which has to be corrected according to the Curie equation [46,48,49]. Therefore, the amplitudes measured at different temperatures should be multiplied by the factor Tx/Tr, in which Tx is the experimental temperature and Tr is the reference temperature. The reference temperature was selected according to the actual condition [46].
Based on the integral of the remaining cell wall water peak, taking pine wood for example, the FSP was calculated to be around 35% [40,41,46,48], which was closer to the FSP determined by solute exclusion [80]. Moreover, the total cell wall water content of different species was determined to be approximately 38% to 48% among various species [48]. The results were higher than the FSP values measured by the extrapolation method (approximately 30%), but they were similar to the results obtained from the solute exclusion method [80], pressure plate technique [2,81,82], and DSC approach [83], which measured cell wall water content of water-saturated samples.
Adopted from soil studies, the moisture content of cell water and cell lumen water can be calculated by the T2 cutoff method, which compared the T2 spectrum in the water-saturated condition at room temperature and cell wall water at −3 °C [49]. The T2 cutoff value was determined by calculating the corresponding T2 value at the intersection of accumulated data lines at 25 °C and −3 °C, which further permitted the quantitative analysis of water components within and outside of the cell wall.
TD-NMR appears to be a potent tool for characterizing water components within and outside cell walls, which allows further discussion on the theoretical definition of FSP. Based on a previous debate, it was reported that numerous problems within the reported range of FSP could be solved by categorizing FSP into two classes: the hygroscopicity limit (HL) and cell wall saturation (CWS) [84]. The volumetric swelling occurred on the samples conditioned over distilled water at 20 °C for 5 months to the HL state and further immersed in water for 1 month to the CWS state. The different amounts of water, as well as the characteristics of the water within the cell wall between HL and CWS, remain undetermined. Using 1D TD-NMR and freezing-thawing method, the differences in the FSP for Southern pine (Pinus spp.) between the HL and CWS were clarified [40]. The results showed that HL FSP was aligned to the MC where volumetric shrinkage drastically changed; the cell wall water increased by around 10% from the HL state to CWS. The difference between HL and CWS could be further analyzed by 2D TD-NMR methods (with freezing-thawing technique if possible).
FSP measurements can be roughly classified into direct and indirect approaches. Most direct methods require the sample to be water-saturated. The higher FSP values obtained using these methods may be attributed to the introduction of new water molecules in the cell wall, while HL is more relevant to the MC determined by indirect methods. The difference between HL and CWS may somehow provide proof of the fiber saturated region or state introduced by Ref. [3], which proposed that fiber saturation may not be achieved at a specific MC (i.e., a point). Instead, it is a gradual transition from a scenario in which new water molecules enter the cell wall (i.e., up to about 30% MC), leading to the breakage of intra- and intermolecular H-bonds in wood cell wall polymers, to a scenario in which new water molecules are accommodated in the cell wall without further breaking the H-bonds in cell wall polymers (i.e., about 30% MC to 40% MC). The exact difference between the HL and CWS is still unclear, and TD-NMR shows great potential for analyzing the discrepancy in this fiber saturation region.
2.3. Pore Size and Cell Wall Water Distribution
Since cell wall water is still detectable in nanoscale pores at temperatures below the melting (freezing) point of bulk water [85], the remaining water molecules can be used as a probe for determining the pore size distribution of wood cell walls, known as cryoporometry [86,87]. The frozen water has a much shorter T2 than that of unfrozen water, therefore, only the signal of the remaining unfrozen water is detected [86]. Cell wall water confined within small pores shows a reduction in its melting (freezing) point. The melting point distribution can be determined by the amplitude of the signal of the unfrozen water as a function of temperature [41,47,88,89]. Given the assumption that all pores are cylindrical, the melting or freezing-point depression is proportional to the pore size, and can be calculated using the Gibbs-Thomson equation Equation (5) [90,91]:
where ΔT is the melting or freezing-point depression at a specific pore diameter; T0 is the melting or freezing point of bulk water; Tm is the depressed freezing or melting point at a specific pore diameter; γ1s is the surface energy at the ice-water interface; θ is the contact angle between ice and the pore wall; D is the diameter of the pore; ρ and Hf are the density and the specific heat of fusion of freezing cell wall water, respectively. To calculate the effective pore diameter D (nm) in accordance with the Gibbs-Thomson equation, the following parameters are used to obtain a simplified Equation (6): Tm = 273.15 K, γ1s = 12.1 mJ m−2, θ = 180 °, ρ = 1000 kg m−3, and Hf = 333.6 J g−1 [90,92].
It is estimated that there is a non-freezing layer of cell wall water within pores with a thickness of 0.3–0.8 nm [86]. A value of 0.6 nm is added to the diameters obtained by NMR cryoporometry to determine accurate pore sizes [47]. It should be noted that the resolution and accuracy of pore size distribution obtained by NMR cryoporometry are critically dependent on temperature resolution as well as temperature gradient within the sample [9]. Choosing the reliable temperature controlling equipment with high resolution, and allowing the sample to be stabilized in the cooling environment for enough time may give a sound and repeatable result.
A closely-related technique also involves thermoporometry using DSC measurements. Similarly, this method is based on the fact that frozen water within small pores has an elevated internal pressure with a lower melting point at an appropriate pore diameter [83,92,93,94]. Both NMR and DSC measurements are promising for studying wood-water relations. Compared with TD-NMR, DSC requires a slice of the sample on the scale of 10 mg or so, which is easy to acquire, but the low sample mass results in a rather low signal-to-noise ratio. On the other hand, TD-NMR provides more stable and reproducible results [39]. The sample tube of TD-NMR equipment allows for larger samples, and some can even be designed with 150 mm in diameter, which is more instructive for practical applications in the wood industry. Moreover, the sample tube can be designed to realize in-situ relative humidity (RH) conditioning [42,95].
TD-NMR cryoporometry results have indicated that the pore size distribution of water-saturated cell walls is not homogeneous, where bound water sites are mostly below 2.5 nm in diameter [47]. The moisture in pores larger than 5 nm did not exceed 10% of the total quantity of cell wall water, while the proportion of pores with diameters below 2 nm was about 70% [48]. Setting more temperature points gave a more specific pore diameter distribution in the water-saturated state [41]. With high resolution of temperature control apparatus and optimized experimental conditions, TD-NMR cryoporometry can be used to measure pore size distribution from 2 nm to 1 μm [9].
Since the pore size is directly related to the specific melting or freezing point given by the Gibbs-Thomson equation, the MC distribution in nanopores can therefore be determined by TD-NMR at each temperature point [40]. That is to say, the distribution of freezable moisture can be accurately assigned to a range of pores by calculating the nonfreezing MC from the integral of the T2 relaxation spectra at different temperatures. Observing the T2 spectra during freezing and melting may provide an insight into the dynamic changes of subpeaks. Equation (7) gives the freezing water distribution within various nanopores as a percentage (DP).
where ΔMnfcw is the amount of freezing cell wall water between two specific temperature points below –3 °C, and Mcw is the total moisture content of cell wall water.
Using this method, the nanopore water distribution can be calculated, and a difference of up to 11% in MC was detected in the cell wall nanopores between 1.73 nm and 13.80 nm. A total of 6.34% of freezing cell wall water was estimated in the nanopores of the cell wall matrix components, and 5.06% was attributed to water within the nanopores of inter-microfibrils [40].
2.4. MRI and Water Transport
MRI obtains spatial pictures of the non-homogeneous and time-dependent water distribution within wood, as well as water migration in the unsteady state, and dynamic changes during water uptake or drying.
Based on the same principle as TD-NMR, the MRI technique is equipped with considerably stronger magnetic field gradient pulses in addition to a static magnetic field. The additional gradient field is applied to encode the signal in space; therefore, spacial information is provided [96]. MRI mainly reflects the spatial distribution image of free water [45,50,51,97,98]. With the assistance of TD-NMR, the water components can be separated and projected as a moisture profile in one dimension [8,30,99,100,101,102,103,104].
For instance, setting the sample at one fixed place, the moisture content distribution was mapped onto multiple positions covering the whole sample [102]. In such experiments, the sides of the samples were commonly sealed, only allowing water to enter into the wood from one side. The water within wood was projected into a MC profile based on the NMR signals, providing a clear picture of water migration and a gradient distribution during water uptake and drying [103].
To visualize the water distribution in wood samples, MRI can be applied to both hygroscopic [51,94] and above-FSP ranges [11,47,105,106].
Taking Ref. [50] for example, MRI was used for characterizing unmodified and thermally-modified pine wood samples. The samples were measured as a function of immersion time. Setting sample slices oriented along the axial to the radial planes of wood, the middle slice was selected for the measurement. 1D profiles of the image intensity along the axial direction were plotted. The signal amplitude in each pixel was directly proportional to the MC of cell lumen water at that position. Only cell lumen water signal was visible in the images because the relaxation time of solid wood and cell wall water is shorter than the echo time [47]. The images of MRI vividly demonstrated the water absorption rate and gave a clear picture of the water distribution in earlywood and latewood.
MRI has also been used to spatially detect fungal decay at the initial stage and to visualize the decomposition process with the combination of T1–T2 analysis, as a result of newly produced free water becoming visible in the active regions of fungus and the damages in the microstructure [45,107].
The MRI results can be analyzed as well by combining them with other experimental techniques. For example, Ref. [51] mapped the distribution of cell lumen water and cell wall water in four tree species under equilibrium moisture contents below the FSP, and interpreted the obtained MRI spectra with the help of scanning electron microscopy images. The limit of MRI application in wood water studies may be the inaccuracy of its quantitative information in the hygroscopic range.
3. Remaining Issues
During the last couple of years, several new findings within wood-water relations have been found using TD-NMR. The technique appears to be a helpful tool, but some challenges remain.
Due to limitations of the instrumentation, some critical experimental issues should be addressed to study water in wood. Most of these issues can be solved by sequence setting and experimental design. To capture enough information, a suitable sequence should be chosen, and the parameters should be set with caution. A sample with maximum moisture content is suggested to be used to determine the duration of a scan to record a fully decayed signal. Moreover, the dead time of a specific instrument limits the detection of the components with the shortest relaxation time. To compensate for this, it is suggested that at least five data points should be acquired before the shortest expected characteristic relaxation time to yield reasonable curve fits [5]. When dealing with the signal acquired from TD-NMR, the deconvolution algorithms vary among previous studies, which leads to difficulties in peak assignments. To ensure consistent data analysis, results should be compared using the same deconvolution method. Moreover, the existing Laplace inversion ILT methods exhibit artifacts [14], and more efficient acquisition protocols and analysis approaches must be developed.
Several problems still exist beyond experiments. One is the lack of understanding for the sequence settings and relaxation mechanism for wood-study researchers, which acts as a barrier to the application of TD-NMR for studying wood-water relations; however, this may be tackled by interdisciplinary research and cooperation. The other is the rather long signal acquisition time. The sequence contains a large number of radiofrequency pulses, leading to an increase in the sample’s temperature, which can be problematic because isothermal conditions are required for TD-NMR and certain wood-water studies. One way to tackle this problem is to apply the modified CPMG pulse sequence with varying waiting time, which could be designed to shorten the total experiment time, as in Ref. [46]. Another method is to equip a cooling system at the bottom of the sample tube, which will keep the sample at a more stable temperature. The sample tube should also be improved to maintain a stable RH environment for long time scale detection. For experiments underwent in hygroscopic range, the saturated salt solutions could be equipped into the sample tube for RH control as suggested in Ref. [102] and Ref. [42].
In water distribution studies, limitations also exist for MRI technique. One drawback of using MRI to study wood drying is the low signal intensity below the FSP where the remaining water exhibits low mobility. Below the FSP, water molecules have a relaxation time similar to the solid wood polymer because the cell wall water molecules are tightly bonded to wood. The shorter T2 time limits the use of spin-echo sequences, leading to uncertainty when attempting to quantify MC based on the signal. The use of MRI to study wood is mainly appropriate for high RH and above FSP regions where the water signal exhibits a longer relaxation time.
4. Conclusions
Although TD-NMR has been applied to identify water components, there are still few strict rules, principles, or standards that define how to accurately separate each component. However, it is clear that 2D TD-NMR will play a dominant role in providing considerable insight into water components. The combination of TD-NMR with other techniques is a new trend for identifying water components and water dynamics at a molecular level.
Being a powerful measurement technique covering the full moisture content range, TD-NMR can provide moisture content information about the fiber saturation range, which has been long discussed and of significance in wood product processing industry.
The pore size distribution in water-saturated samples can be detected by TD-NMR using a freezing-thawing technique, which may provide information about the physical distribution of cell wall water.
MRI exhibits promise for visualizing water migration in wood, which is of practical use to wood drying techniques.
Author Contributions
Conceptualization, J.L. and E.M.; investigation, J.L.; writing—original draft preparation, J.L.; writing—review and editing, J.L. and E.M.; visualization, J.L.; supervision, E.M.; project administration, E.M.; funding acquisition, E.M. All authors have read and agreed to the published version of the manuscript.
Funding
This research was funded by the National Natural Science Foundation of China, grant number No. 31971583.
Acknowledgments
China Suzhou Niumag Analytical Instrument Co. is acknowledged.
Conflicts of Interest
The authors declare no conflict of interest.
References
- Glass, S.V.; Zelinka, S.V. Moisture Relations and Physical Properties of Wood. In Wood Handbook: Wood as an Engineering Material; Forest Products Laboratory, Forest Service, U.S. Department of Agriculture: Madison, WI, USA, 2010; p. 80. [Google Scholar]
- Skaar, C. Wood-Water Relations; Springer Science & Business Media: Berlin/Heidelberg, Germany, 1988; p. 42. [Google Scholar]
- Engelund, E.T.; Thygesen, L.G.; Svensson, S.; Hill, C.A.S. A Critical Discussion of the Physics of Wood-Water Interactions. Wood Sci. Technol. 2013, 47, 141–161. [Google Scholar] [CrossRef] [Green Version]
- Siau, J.F. Transport Processes in Wood; Springer: Berlin/Heidelberg, Germany; New York, NY, USA; Tokyo, Japan, 1984; p. 1. [Google Scholar]
- Thybring, E.E.; Kymäläinen, M.; Rautkari, L. Experimental Techniques for Characterising Water in Wood Covering the Range from Dry to Fully Water-Saturated. Wood Sci. Technol. 2018, 52, 297–329. [Google Scholar] [CrossRef] [Green Version]
- Nasir, V.; Nourian, S.; Zhou, Z.; Rahimi, S.; Avramidis, S.; Cool, J. Classification and Characterization of Thermally Modified Timber Using Visible and near-Infrared Spectroscopy and Artificial Neural Networks: A Comparative Study on the Performance of Different Nde Methods and Anns. Wood Sci. Technol. 2019, 53, 1093–1109. [Google Scholar] [CrossRef]
- Fathi, H.; Kazemirad, S.; Nasir, V. A Nondestructive Guided Wave Propagation Method for the Characterization of Moisture-Dependent Viscoelastic Properties of Wood Materials. Mater. Struct. 2020, 53, 1–14. [Google Scholar] [CrossRef]
- Wang, W.; Chen, J.; Cao, J. Using Low-Field NMR and MRI to Characterize Water Status and Distribution in Modified Wood During Water Absorption. Holzforschung 2019, 73, 997–1004. [Google Scholar] [CrossRef]
- Zhou, B. The Applications of NMR Relaxometry, NMR Cryoporometry, and FFC NMR to Nanoporous Structures and Dynamics in Shale at Low Magnetic Fields. Energy Fuels 2018, 32, 8897–8904. [Google Scholar] [CrossRef]
- Berman, P.; Leshem, A.; Etziony, O.; Levi, O.; Parmet, Y.; Saunders, M.; Wiesman, Z. Novel 1H Low Field Nuclear Magnetic Resonance Applications for the Field of Biodiesel. Biotechnol. Biofuels 2013, 6, 55–76. [Google Scholar] [CrossRef] [PubMed] [Green Version]
- Lamason, C.; MacMillan, B.; Balcom, B.; Leblon, B.; Pirouz, Z. Examination of Water Phase Transitions in Black Spruce by Magnetic Resonance and Magnetic Resonance Imaging. Wood Fiber Sci. 2014, 46, 423–436. [Google Scholar]
- Song, Y.Q.; Venkataramanan, L.; Hurlimann, M.D.; Flaum, M.; Frulla, P.; Straley, C. T1-T2 Correlation Spectra Obtained Using a Fast Two-Dimensional Laplace Inversion. J. Magn. Reson. 2002, 154, 261–268. [Google Scholar] [CrossRef] [PubMed]
- Cox, J.; McDonald, P.J.; Gardiner, B.A. A Study of Water Exchange in Wood by Means of 2D NMR Relaxation Correlation and Exchange. Holzforschung 2010, 64, 259–266. [Google Scholar] [CrossRef] [Green Version]
- Telkki, V.-V. Hyperpolarized Laplace NMR. Magn. Reson. Chem. 2018, 56, 619–632. [Google Scholar] [CrossRef]
- Bernin, D.; Topgaard, D. NMR Diffusion and Relaxation Correlation Methods: New Insights in Heterogeneous Materials. Curr. Opin. Colloid Interface Sci. 2013, 18, 166–172. [Google Scholar] [CrossRef]
- Carr, H.Y.; Purcell, E.M. Effects of Diffusion on Free Precession in Nuclear Magnetic Resonance Experiments. Phys. Rev. 1954, 94, 630–638. [Google Scholar] [CrossRef]
- Meiboom, S.; Gill, D. Modified Spin--Echo Method for Measuring Nuclear Relaxation Times. Rev. Sci. Instrum. 1958, 29, 688–691. [Google Scholar] [CrossRef] [Green Version]
- Thygesen, L.G.; Elder, T. Moisture in Untreated, Acetylated, and Furfurylated Norway Spruce Studied during Drying Using Time Domain NMR. Wood Fiber Sci. 2008, 40, 309–320. [Google Scholar] [CrossRef]
- Menon, R.S.; MaCkay, A.L.; Hailey, J.R.T.; Bloom, M.; Burgess, A.E.; Swanson, J.S. An NMR Determination of the Physiological Water Distribution in Wood during Drying. J. Appl. Polym. Sci. 1987, 33, 1141–1155. [Google Scholar] [CrossRef]
- Mitchell, J.; Stark, S.C.; Strange, J.H. Probing Surface Interactions by Combining Nmr Cryoporometry and NMR Relaxometry. J. Phys. D 2005, 38, 1950–1958. [Google Scholar] [CrossRef]
- Pedersen, H.T.; Bro, R.; Engelsen, S.B. Towards Rapid and Unique Curve Resolution of Low-Field NMR Relaxation Data: Trilinear Slicing Versus Two-Dimensional Curve Fitting. J. Magn. Reson. 2002, 157, 141–155. [Google Scholar] [CrossRef] [PubMed]
- Fredriksson, M.; Thygesen, L.G. The States of Water in Norway Spruce (Picea abies (L.) Karst.) Studied by Low-Field Nuclear Magnetic Resonance (LFNMR) Relaxometry: Assignment of Free-Water Populations Based on Quantitative Wood Anatomy. Holzforschung 2017, 71, 77–90. [Google Scholar] [CrossRef] [Green Version]
- Whittall, K.P.; Bronskill, M.J.; Henkelman, R.M. Investigation of Analysis Techniques for Complicated Nmr Relaxation Data. J. Magn. Reson. 1991, 95, 221–234. [Google Scholar] [CrossRef]
- Provencher, S.W. CONTIN: A General Purpose Constrained Regularization Program for Inverting Noisy Linear Algebraic and Integral Equations. Comput. Phys. Commun. 1982, 27, 229–242. [Google Scholar] [CrossRef]
- Li, X.; Zhao, Z. Time Domain-NMR Studies of Average Pore Size of Wood Cell Walls during Drying and Moisture Adsorption. Wood Sci. Technol. 2020, 54, 1241–1251. [Google Scholar] [CrossRef]
- Sharp, A.R.; Riggin, M.T.; Kaiser, R.; Schneider, M. Determination of Moisture Content of Wood by Pulsed Nuclear Magnetic Resonance. Wood Fiber Sci. 1978, 10, 74–81. [Google Scholar]
- Riggin, M.T.; Sharp, A.R.; Kaiser, R.; Schneider, M.H. Transverse NMR Relaxation of Water in Wood. J. Appl. Polym. Sci. 1979, 23, 3147–3154. [Google Scholar] [CrossRef]
- Araujo, C.D.; MacKay, A.L.; Hailey, J.R.T.; Whittall, K.P.; Le, H. Proton Magnetic Resonance Techniques for Characterization of Water in Wood: Application to White Spruce. Wood Sci. Technol. 1992, 26, 101–113. [Google Scholar] [CrossRef]
- Merela, M.; Oven, P.; Serša, I.; Mikac, U. A Single Point Nmr Method for an Instantaneous Determination of the Moisture Content of Wood. Holzforschung 2009, 63, 348–351. [Google Scholar] [CrossRef]
- Menon, R.S.; Mackay, A.L.; Flibotte, S.G.; Hailey, J.R.T. Quantitative Separation of NMR Images of Water in Wood on the Basis of T2. J. Magn. Reson. 1989, 82, 205–210. [Google Scholar] [CrossRef]
- Flibotte, S.; Menon, R.S.; Mackay, A.L.; Hailey, J.R.T. Proton Magnetic Resonance of Western Red Cedar. Wood Fiber Sci. 1990, 22, 362–376. [Google Scholar]
- Araujo, C.D.; Avramidis, S.; MacKay, A.L. Behaviour of Solid Wood and Bound Water as a Function of Moisture Content. A Proton Magnetic Resonance Study. Holzforschung 1994, 48, 69–74. [Google Scholar] [CrossRef]
- Hartley, I.D.; Avramidis, S.; MacKay, A.L. H-NMR Studies of Water Interactions in Sitka Spruce and Western Hemlock: Moisture Content Determination and Second Moments. Wood Sci. Technol. 1996, 30, 141–148. [Google Scholar] [CrossRef]
- Xu, Y.; Araujo, C.D.; MacKay, A.L.; Whittall, K.P. Proton Spin–Lattice Relaxation in Wood—T1 Related to Local Specific Gravity Using a Fast-Exchange Model. J. Magn. Reson. 1996, 110, 55–64. [Google Scholar] [CrossRef]
- Labbé, N.; Jéso, B.D.; Lartigue, J.-C.; Daudé, G.; Pétraud, M.; Ratier, M. Moisture Content and Extractive Materials in Maritime Pine Wood by Low Field 1H NMR. Holzforschung 2002, 56, 25–31. [Google Scholar] [CrossRef]
- Labbé, N.; De Jéso, B.; Lartigue, J.-C.; Daudé, G.; Pétraud, M.; Ratier, M. Time-Domain 1H NMR Characterization of the Liquid Phase in Greenwood. Holzforschung 2006, 60, 265–270. [Google Scholar] [CrossRef]
- Almeida, G.; Gagné, S.; Hernández, R.E. A NMR Study of Water Distribution in Hardwoods at Several Equilibrium Moisture Contents. Wood Sci. Technol. 2006, 41, 293–307. [Google Scholar] [CrossRef]
- Beck, G.; Thybring, E.E.; Thygesen, L.G.; Hill, C. Characterization of Moisture in Acetylated and Propionylated Radiata Pine Using Low-Field Nuclear Magnetic Resonance (LFNMR) Relaxometry. Holzforschung 2018, 72, 225–233. [Google Scholar] [CrossRef]
- Guo, Y.; Zhang, M.; Xiao, Z.; Chen, H.; Xie, Y. Vaporization Heat of Bound Water in Wood Chemically Modified via Grafting and Crosslinking Patterns by DSC and NMR Analysis. Holzforschung 2018, 72, 1043–1049. [Google Scholar] [CrossRef]
- Li, J.; Ma, E.; Yang, T. Differences between Hygroscopicity Limit and Cell Wall Saturation Investigated by LF-NMR on Southern Pine (Pinus spp.). Holzforschung 2019, 73, 911–921. [Google Scholar] [CrossRef]
- Cai, C.; Javed, M.A.; Komulainen, S.; Telkki, V.-V.; Haapala, A.; Heräjärvi, H. Effect of Natural Weathering on Water Absorption and Pore Size Distribution in Thermally Modified Wood Determined by Nuclear Magnetic Resonance. Cellulose 2020, 27, 4235–4247. [Google Scholar] [CrossRef] [Green Version]
- Bonnet, M.; Courtier-Murias, D.; Faure, P.; Rodts, S.; Care, S. NMR Determination of Sorption Isotherms in Earlywood and Latewood of Douglas Fir. Identification of Bound Water Components Related to Their Local Environment. Holzforschung 2017, 71, 481–490. [Google Scholar] [CrossRef]
- Rostom, L.; Courtier-Murias, D.; Rodts, S.; Care, S. Investigation of the Effect of Aging on Wood Hygroscopicity by 2D 1H NMR Relaxometry. Holzforschung 2019, 74, 400–411. [Google Scholar] [CrossRef] [Green Version]
- Rostom, L.; Caré, S.; Courtier--Murias, D. Analysis of Water Content in Wood Material through 1D and 2D 1H NMR Relaxometry: Application to the Determination of the Dry Mass of Wood. Magn. Reson. Chem. 2021, 59, 614–627. [Google Scholar] [CrossRef]
- Hiltunen, S.; Mankinen, A.; Javed, M.A.; Ahola, S.; Venäläinen, M.; Telkki, V.-V. Characterization of the Decay Process of Scots Pine Caused by Coniophora Puteana Using NMR and MRI. Holzforschung 2020, 74, 1021–1032. [Google Scholar] [CrossRef]
- Telkki, V.-V.; Yliniemi, M.; Jokisaari, J. Moisture in Softwoods: Fiber Saturation Point, Hydroxyl Site Content, and the Amount of Micropores as Determined from NMR Relaxation Time Distributions. Holzforschung 2013, 67, 291–300. [Google Scholar] [CrossRef]
- Kekkonen, P.M.; Ylisassi, A.; Telkki, V.-V. Absorption of Water in Thermally Modified Pine Wood as Studied by Nuclear Magnetic Resonance. J. Phys. Chem. C 2014, 118, 2146–2153. [Google Scholar] [CrossRef]
- Gao, X.; Zhuang, S.; Jin, J.; Cao, P. Bound Water Content and Pore Size Distribution in Swollen Cell Walls Determined by NMR Technology. Bioresources 2015, 10, 8202–8224. [Google Scholar] [CrossRef]
- Wang, Z.; Wang, X.-M.; Chen, Z.-J. Water States and Migration in Xinjiang Poplar and Mongolian Scotch Pine Monitored by TD-NMR During Drying. Holzforschung 2018, 72, 113–123. [Google Scholar] [CrossRef]
- Javed, M.A.; Kekkonen, P.M.; Ahola, S.; Telkki, V.-V. Magnetic Resonance Imaging Study of Water Absorption in Thermally Modified Pine Wood. Holzforschung 2015, 69, 899–907. [Google Scholar] [CrossRef]
- Passarini, L.; Malveau, C.; Hernández, R.E. Distribution of the Equilibrium Moisture Content in Four Hardwoods below Fiber Saturation Point with Magnetic Resonance Microimaging. Wood Sci. Technol. 2015, 49, 1251–1268. [Google Scholar] [CrossRef]
- Maunu, S. NMR Studies of Wood and Wood Products. Prog. Nucl. Magn. Reson. Spectrosc. 2002, 40, 151–174. [Google Scholar] [CrossRef]
- Rodin, V.V. One- and Two-Dimensional NMR in Studying Wood–Water Interaction at Moisturizing Spruce. Anisotropy of Water Self-Diffusion. Colloids Interfaces 2019, 3, 54. [Google Scholar] [CrossRef] [Green Version]
- Almeida, G.; Hernandez, R.E. Changes in Physical Properties of Yellow Birch Below and above the Fiber Saturation Point. Wood Fiber Sci. 2006, 38, 74–83. [Google Scholar]
- Almeida, G.; Hernández, R.E. Changes in Physical Properties of Tropical and Temperate Hardwoods Below and above the Fiber Saturation Point. Wood Sci. Technol. 2006, 40, 599–613. [Google Scholar] [CrossRef]
- Passarini, L.; Malveau, C.; Hernández, R.E. Water State Study of Wood Structure of Four Hardwoods below Fiber Saturation Point with Nuclear Magnetic Resonance. Wood Fiber Sci. 2014, 46, 480–488. [Google Scholar]
- Wiedenhoeft, A. Structure and Function of Wood. In Wood Handbook: Wood as an Engineering Material; Forest Products Laboratory, Forest Service, U.S. Department of Agriculture: Madison, WI, USA, 2010; p. 72. [Google Scholar]
- Elder, T.; Labbe, N.; Harper, D.; Rials, T. Time Domain-Nuclear Magnetic Resonance Study of Chars from Southern Hardwoods. Biomass Bioenergy 2006, 30, 855–862. [Google Scholar] [CrossRef]
- Thygesen, L.G.; Elder, T. Moisture in Untreated, Acetylated, and Furfurylated Norway Spruce Monitored During Drying Below Fiber Saturation Using Time Domain NMR. Wood Fiber Sci. 2009, 41, 194–200. [Google Scholar]
- Elder, T.; Houtman, C. Time-Domain NMR Study of the Drying of Hemicellulose Extracted Aspen (Populus Tremuloides Michx.). Holzforschung 2012, 67, 405–411. [Google Scholar] [CrossRef]
- Zhang, M.; Wang, X.; Gazo, R. Water States in Yellow Poplar During Drying Studied by Time-Domain Nuclear Magnetic Resonance. Wood Fiber Sci. 2013, 45, 423–428. [Google Scholar]
- Felby, C.; Thygesen, L.G.; Kristensen, J.B.; Jørgensen, H.; Elder, T. Cellulose–Water Interactions during Enzymatic Hydrolysis as Studied by Time Domain NMR. Cellulose 2008, 15, 703–710. [Google Scholar] [CrossRef]
- Thygesen, L.G.; Tang Engelund, E.; Hoffmeyer, P. Water Sorption in Wood and Modified Wood at High Values of Relative Humidity. Part I: Results for Untreated, Acetylated, and Furfurylated Norway Spruce. Holzforschung 2010, 64, 315–323. [Google Scholar] [CrossRef]
- Fredriksson, M.; Johansson, P. A Method for Determination of Absorption Isotherms at High Relative Humidity Levels: Measurements on Lime-Silica Brick and Norway Spruce (Picea abies (L.) Karst.). Dry. Technol. 2015, 34, 132–141. [Google Scholar] [CrossRef] [Green Version]
- Yang, T.; Thybring, E.E.; Fredriksson, M.; Ma, E.; Cao, J.; Digaitis, R.; Thygesen, L.G. Effects of Changes in Biopolymer Composition on Moisture in Acetylated Wood. Forests 2020, 11, 719. [Google Scholar] [CrossRef]
- Yang, T.; Cao, J.; Ma, E. How Does Delignification Influence the Furfurylation of Wood? Ind. Crop. Prod. 2019, 135, 91–98. [Google Scholar] [CrossRef]
- Thybring, E.E.; Fredriksson, M. Wood Modification as a Tool to Understand Moisture in Wood. Forests 2021, 12, 372. [Google Scholar] [CrossRef]
- Salmén, L.; Burgert, I. Cell Wall Features with Regard to Mechanical Performance. A Review Cost Action E35 2004–2008: Wood Machining–Micromechanics and Fracture. Holzforschung 2009, 63, 121–129. [Google Scholar] [CrossRef]
- Jakes, J.E.; Hunt, C.G.; Zelinka, S.L.; Ciesielski, P.N.; Plaza, N.Z. Effects of Moisture on Diffusion in Unmodified Wood Cell Walls: A Phenomenological Polymer Science Approach. Forests 2019, 10, 1084. [Google Scholar] [CrossRef] [Green Version]
- Jeoh, T.; Karuna, N.; Weiss, N.D.; Thygesen, L.G. Two-Dimensional 1H-Nuclear Magnetic Resonance Relaxometry for Understanding Biomass Recalcitrance. ACS Sustain. Chem. Eng. 2017, 5, 8785–8795. [Google Scholar] [CrossRef]
- Plaza, R.N.Z. Neutron Scattering Studies of Nano-Scale Wood-Water Interactions; University of Washington: Madison, WI, USA, 2017. [Google Scholar]
- Wiesman, Z.; Linder, C.; Resende, M.T.; Ayalon, N.; Levi, O.; Bernardinelli, O.D.; Colnago, L.A.; Mitre, C.I.N.; Jackman, R. 2D and 3D Spectrum Graphics of the Chemical-Morphological Domains of Complex Biomass by Low Field Proton NMR Energy Relaxation Signal Analysis. Energy Fuels 2018, 32, 5090–5102. [Google Scholar] [CrossRef]
- Hartley, I.D.; Kamke, F.A.; Peemoeller, H. Cluster Theory for Water Sorption in Wood. Wood Sci. Technol. 1992, 26, 83–99. [Google Scholar] [CrossRef]
- Hartley, I.D.; Avramidis, S. Analysis of the Wood Sorption Isotherm Using Clustering Theory. Holzforschung 1993, 47, 163–167. [Google Scholar] [CrossRef]
- Li, X.; Gao, Y.; Zhang, M.; Wang, X.; Wei, X. Water Migration in Poplar Wood During Microwave Drying Studied by Time Domain Nuclear Magnetic Resonance (TD-NMR). Holzforschung 2017, 71, 881–887. [Google Scholar] [CrossRef]
- Xu, K.; Lu, J.; Gao, Y.; Wu, Y.; Li, X. Determination of Moisture Content and Moisture Content Profiles in Wood During Drying by Low-Field Nuclear Magnetic Resonance. Dry. Technol. 2017, 35, 1909–1918. [Google Scholar] [CrossRef]
- Tiemann, H.D. Effect of Moisture upon the Strength and Stiffness of Wood; Forest Service, US Department of Agriculture: Madison, WI, USA, 1906; pp. 83–84.
- Stamm, A.J. The Fiber-Saturation Point of Wood as Obtained from Electrical Conductivity Measurements. Ind. Eng. Chem. Anal. Ed. 1929, 1, 94–97. [Google Scholar] [CrossRef]
- Stone, J.; Scallan, A. The Effect of Component Removal upon the Porous Structure of the Cell Wall of Wood. Ii. Swelling in Water and the Fiber Saturation Point. Tappi 1967, 50, 496–501. [Google Scholar]
- Hill, C.A.S. The Reduction in the Fibre Saturation Point of Wood Due to Chemical Modification Using Anhydride Reagents: A Reappraisal. Holzforschung 2008, 62, 423–428. [Google Scholar] [CrossRef]
- Stamm, A.J. Review of Nine Methods for Determining the Fiber Saturation Points of Wood and Wood Products. Wood Sci. Technol. 1971, 4, 114–128. [Google Scholar]
- Fredriksson, M.; Thybring, E.E. On Sorption Hysteresis in Wood: Separating Hysteresis in Cell Wall Water and Capillary Water in the Full Moisture Range. PLoS ONE 2019, 14, e0225111. [Google Scholar] [CrossRef]
- Zauer, M.; Kretzschmar, J.; Großmann, L.; Pfriem, A.; Wagenführ, A. Analysis of the Pore-Size Distribution and Fiber Saturation Point of Native and Thermally Modified Wood Using Differential Scanning Calorimetry. Wood Sci. Technol. 2013, 48, 177–193. [Google Scholar] [CrossRef]
- Babiak, M.; Kúdela, J. A Contribution to the Definition of the Fiber Saturation Point. Wood Sci. Technol. 1995, 29, 217–226. [Google Scholar] [CrossRef]
- Berthold, J.; Rinaudo, M.; Salmeń, L. Association of Water to Polar Groups; Estimations by an Adsorption Model for Ligno-Cellulosic Materials. Colloids Surf. A 1996, 112, 117–129. [Google Scholar] [CrossRef]
- Hansen, E.W.; Stöcker, M.; Schmidt, R. Low-Temperature Phase Transition of Water Confined in Mesopores Probed by NMR. Influence on Pore Size Distribution. J. Phys. Chem. 1996, 100, 2195–2200. [Google Scholar] [CrossRef]
- Petrov, O.V.; Furo, I. NMR Cryoporometry: Principles, Applications and Potential. Prog. Nucl. Magn. Reson. Spectrosc. 2009, 54, 97–122. [Google Scholar] [CrossRef]
- Kärenlampi, P.P.; Tynjälä, P.; Ström, P. Phase Transformations of Wood Cell Wall Water. J. Wood Sci. 2005, 51, 118–123. [Google Scholar] [CrossRef]
- Javed, M.A.; Komulainen, S.; Daigle, H.; Zhang, B.; Vaara, J.; Zhou, B.; Telkki, V.-V. Determination of Pore Structures and Dynamics of Fluids in Hydrated Cements and Natural Shales by Various 1H and 129Xe NMR Methods. Microporous Mesoporous Mater. 2019, 281, 66–74. [Google Scholar] [CrossRef]
- Park, S.; Venditti, R.; Jameel, H.; Pawlak, J. Changes in Pore Size Distribution during the Drying of Cellulose Fibers as Measured by Differential Scanning Calorimetry. Carbohydr. Polym. 2006, 66, 97–103. [Google Scholar] [CrossRef]
- Zauer, M.; Pfriem, A.; Wagenführ, A. Toward Improved Understanding of the Cell-Wall Density and Porosity of Wood Determined by Gas Pycnometry. Wood Sci. Technol. 2013, 47, 1197–1211. [Google Scholar] [CrossRef]
- Simpson, L.A.; Barton, A.F.M. Determination of the Fibre Saturation Point in Whole Wood Using Differential Scanning Calorimetry. Wood Sci. Technol. 1991, 25, 301–308. [Google Scholar] [CrossRef]
- Nakamura, K.; Hatakeyama, T.; Hatakeyama, H. Studies on Bound Water of Cellulose by Differential Scanning Calorimetry. Text. Res. J. 1981, 51, 607–613. [Google Scholar] [CrossRef]
- Zelinka, S.L.; Glass, S.V.; Jakes, J.E.; Stone, D.S. A Solution Thermodynamics Definition of the Fiber Saturation Point and the Derivation of a Wood–Water Phase (State) Diagram. Wood Sci. Technol. 2015, 50, 443–462. [Google Scholar] [CrossRef]
- Dvinskikh, S.V.; Henriksson, M.; Berglund, L.A.; Furó, I. A Multinuclear Magnetic Resonance Imaging (MRI) Study of Wood with Adsorbed Water: Estimating Bound Water Concentration and Local Wood Density. Holzforschung 2011, 65, 103–107. [Google Scholar] [CrossRef]
- Nguyen, D.M.; Almeida, G.; Nguyen, T.M.L.; Zhang, J.; Lu, P.; Colin, J.; Perré, P. A Critical Review of Current Imaging Techniques to Investigate Water Transfers in Wood and Biosourced Materials. Transp. Porous Med. 2021, 137, 21–61. [Google Scholar] [CrossRef]
- Almeida, G.; Leclerc, S.; Perre, P. NMR Imaging of Fluid Pathways during Drainage of Softwood in a Pressure Membrane Chamber. Int. J. Multiph. Flow 2008, 34, 312–321. [Google Scholar] [CrossRef]
- Hernández, R.E.; Cáceres, C.B. Magnetic Resonance Microimaging of Liquid Water Distribution in Sugar Maple Wood below Fiber Saturation Point. Wood Fiber Sci. 2010, 42, 259–272. [Google Scholar]
- Meder, R.; Codd, S.L.; Franich, R.A.; Callaghan, P.T.; Pope, J.M. Observation of Anisotropic Water Movement in Pinus Radiata D. Don Sapwood above Fiber Saturation Using Magnetic Resonance Micro-Imaging. Holz. Roh. Werkst. 2003, 61, 251–256. [Google Scholar] [CrossRef]
- Quick, J.J.; Hailey, J.R.; MacKay, A.L. Radial Moisture Profiles of Cedar Sapwood during Drying: A Proton Magnetic Resonance Study. Wood Fiber Sci. 2007, 22, 404–412. [Google Scholar]
- Dvinskikh, S.V.; Henriksson, M.; Mendicino, A.L.; Fortino, S.; Toratti, T. NMR Imaging Study and Multi-Fickian Numerical Simulation of Moisture Transfer in Norway Spruce Samples. Eng. Struct. 2011, 33, 3079–3086. [Google Scholar] [CrossRef]
- Gezici-Koç, Ö.; Erich, S.J.F.; Huinink, H.P.; van der Ven, L.G.J.; Adan, O.C.G. Bound and Free Water Distribution in Wood During Water Uptake and Drying as Measured by 1d Magnetic Resonance Imaging. Cellulose 2016, 24, 535–553. [Google Scholar] [CrossRef] [Green Version]
- Zhou, M.; Caré, S.; Courtier-Murias, D.; Faure, P.; Rodts, S.; Coussot, P. Magnetic Resonance Imaging Evidences of the Impact of Water Sorption on Hardwood Capillary Imbibition Dynamics. Wood Sci. Technol. 2018, 52, 929–955. [Google Scholar] [CrossRef]
- Gezici-Koç, Ö.; Erich, S.J.F.; Huinink, H.P.; van der Ven, L.G.J.; Adan, O.C.G. Moisture Content of the Coating Determines the Water Permeability as Measured by 1d Magnetic Resonance Imaging. Prog. Org. Coat. 2019, 130, 114–123. [Google Scholar] [CrossRef]
- Houts, J.H.v.; Wang, S.; Shi, H.; Pan, H.; Kabalka, G.W. Moisture Movement and Thickness Swelling in Oriented Strandboard, Part 1. Analysis Using Nuclear Magnetic Resonance Microimaging. Wood Sci. Technol. 2004, 38, 617–628. [Google Scholar] [CrossRef]
- Žlahtič Zupanc, M.; Mikac, U.; Serša, I.; Merela, M.; Humar, M. Water Distribution in Wood after Short Term Wetting. Cellulose 2018, 26, 703–721. [Google Scholar] [CrossRef]
- Müller, U.; Bammer, R.; Halmschlager, E.; Stollberger, R.; Wimmer, R. Detection of Fungal Wood Decay Using Magnetic Resonance Imaging. Holz. Roh. Werkst. 2001, 59, 190–194. [Google Scholar] [CrossRef]
Figure 1.
Schematic diagram of a TD-NMR instrument with four components—magnetic unit, radiofrequency generator, temperature control system, and data collection system. (a–d) demonstrate the basic NMR working principle.
Figure 1.
Schematic diagram of a TD-NMR instrument with four components—magnetic unit, radiofrequency generator, temperature control system, and data collection system. (a–d) demonstrate the basic NMR working principle.

Figure 2.
Schematic overview of the application of TD-NMR for studying wood-water relations.

Figure 3.
Schematic illustration of (a) softwood hierarchical structure at cellular level and the presence of different water states, and (b) T2 assignments of the water states in green wood by TD-NMR. Dark blue represents cell lumen water, light blue represents water in pits and small cavities, blue lined-area refers to the cell wall water.

Figure 4.
Schematic illustration of (a) softwood cell wall at sub-cellular level with the presence of two water populations dominating in different areas, and (b) 2D correlation map of moisture in the wood with a schematic identification of three water populations manifested as pools of A–C. Illustration of 2D correlation map was inspired from Refs. [13,42], and the tree samples were acquired from spruce and Douglas fir.


Table 1.
Literature data for T2 assignments using CPMG experiments.
| Reference | Species | Wood Type | MC Range (%) | Water Component Assignment and Their T2 (ms) |
|---|---|---|---|---|
| Ref. [37] | One tropical (Robinia coccinea Aublet) and two temperate (Acer saccharum Marsh. and Fagus grandifolia Ehrh.) hardwoods | Diffuse porous woods | Determined at different equilibrium moisture contents during desorption at 25 °C | FastT2 (0–10, bound or cell wall water); Medium T2 (10–100, liquid water in fiber and parenchyma elements); Slow T2 (above 100, liquid water in vessel elements) |
| Refs. [18,59,63] | Norway spruce (Picea abies (L.) Karst.) | Acetylated and furfurylated sapwood | Above fiber saturation point | Lumen water in earlywood tracheids moved from about 80–100 ms to 200–300 ms by both furfurylation and acetylation; Cell wall water reduced from about 1.4 to 0.65 by furfurylation, while acetylation had less effect on this water |
| Ref. [60] | Aspen (Populus tremuloides Michx.) | Hemicellulose-extracted pulp | Vacuum-saturated | Free water: 15–150; Bound water: 1–2; The removal of hemicelluloses results in longer T2 for the bound water |
| Ref. [64] | Norway spruce (Picea abies (L.) Karst.) | Sapwood and heartwood, mature and juvenile | Vacuum-saturated | Bound water: 1.2–2.0; Water in pits: 8.0–31.4; Water in tracheid lumina: 48.8–95.4; Surface water on the specimen: 226.7–1469.4 |
| Ref. [39] | Radiata pine (Pinus radiata D. Don) | Sapwood modified with acetic anhydride and glutaraldehyde | Water-saturated | Two bound water peaks were separated |
| Ref. [65] | Poplar (Populus euramericana Cv.) | Sapwood | Vacuum-saturated | Cell wall water: below 10; Water in small voids or small cavities: 10 to 100; Cell lumen water: above 100; |
Publisher’s Note: MDPI stays neutral with regard to jurisdictional claims in published maps and institutional affiliations. |
© 2021 by the authors. Licensee MDPI, Basel, Switzerland. This article is an open access article distributed under the terms and conditions of the Creative Commons Attribution (CC BY) license (https://creativecommons.org/licenses/by/4.0/).
Share and Cite
MDPI and ACS Style
Li, J.; Ma, E. Characterization of Water in Wood by Time-Domain Nuclear Magnetic Resonance Spectroscopy (TD-NMR): A Review. Forests 2021, 12, 886. https://0-doi-org.brum.beds.ac.uk/10.3390/f12070886
AMA Style
Li J, Ma E. Characterization of Water in Wood by Time-Domain Nuclear Magnetic Resonance Spectroscopy (TD-NMR): A Review. Forests. 2021; 12(7):886. https://0-doi-org.brum.beds.ac.uk/10.3390/f12070886
Chicago/Turabian StyleLi, Jingyu, and Erni Ma. 2021. "Characterization of Water in Wood by Time-Domain Nuclear Magnetic Resonance Spectroscopy (TD-NMR): A Review" Forests 12, no. 7: 886. https://0-doi-org.brum.beds.ac.uk/10.3390/f12070886
Note that from the first issue of 2016, this journal uses article numbers instead of page numbers. See further details here.