
Aboveground Biomass Estimation in Short Rotation Forest Plantations in Northern Greece Using ESA’s Sentinel Medium-High Resolution Multispectral and Radar Imaging Missions

 , ,
, ,  and
and
Abstract
:1. Introduction
2. Materials and Methods
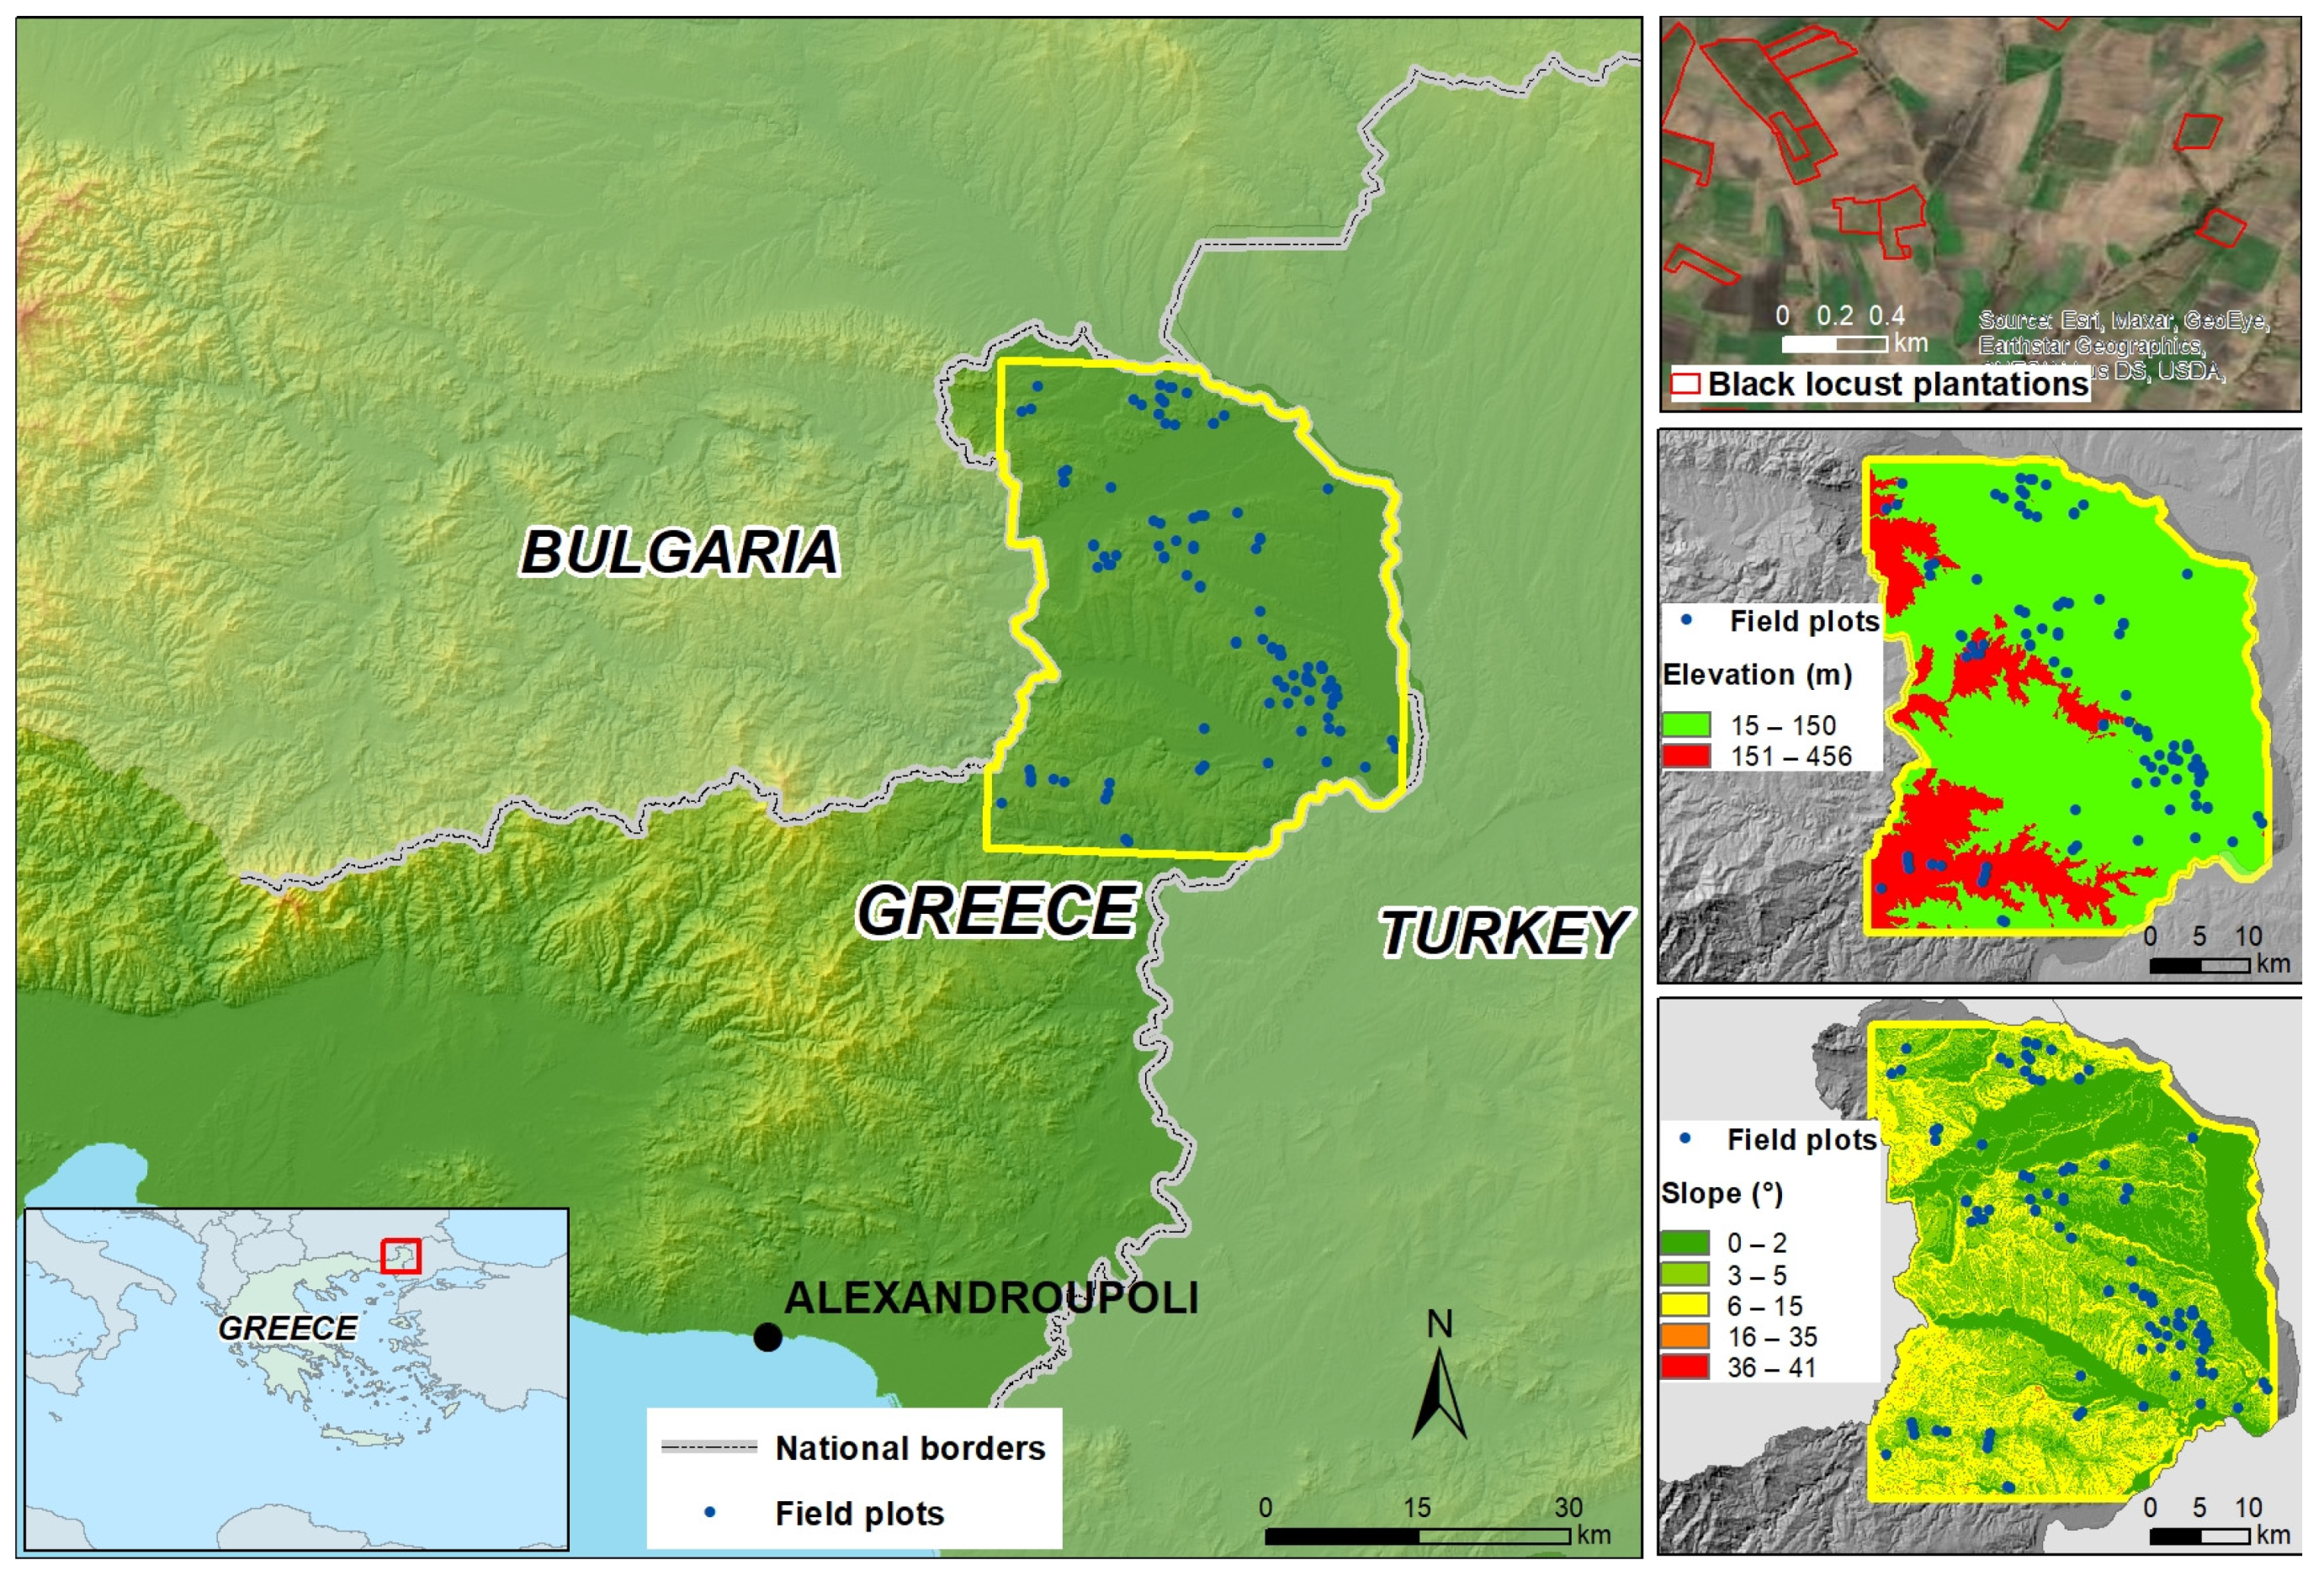
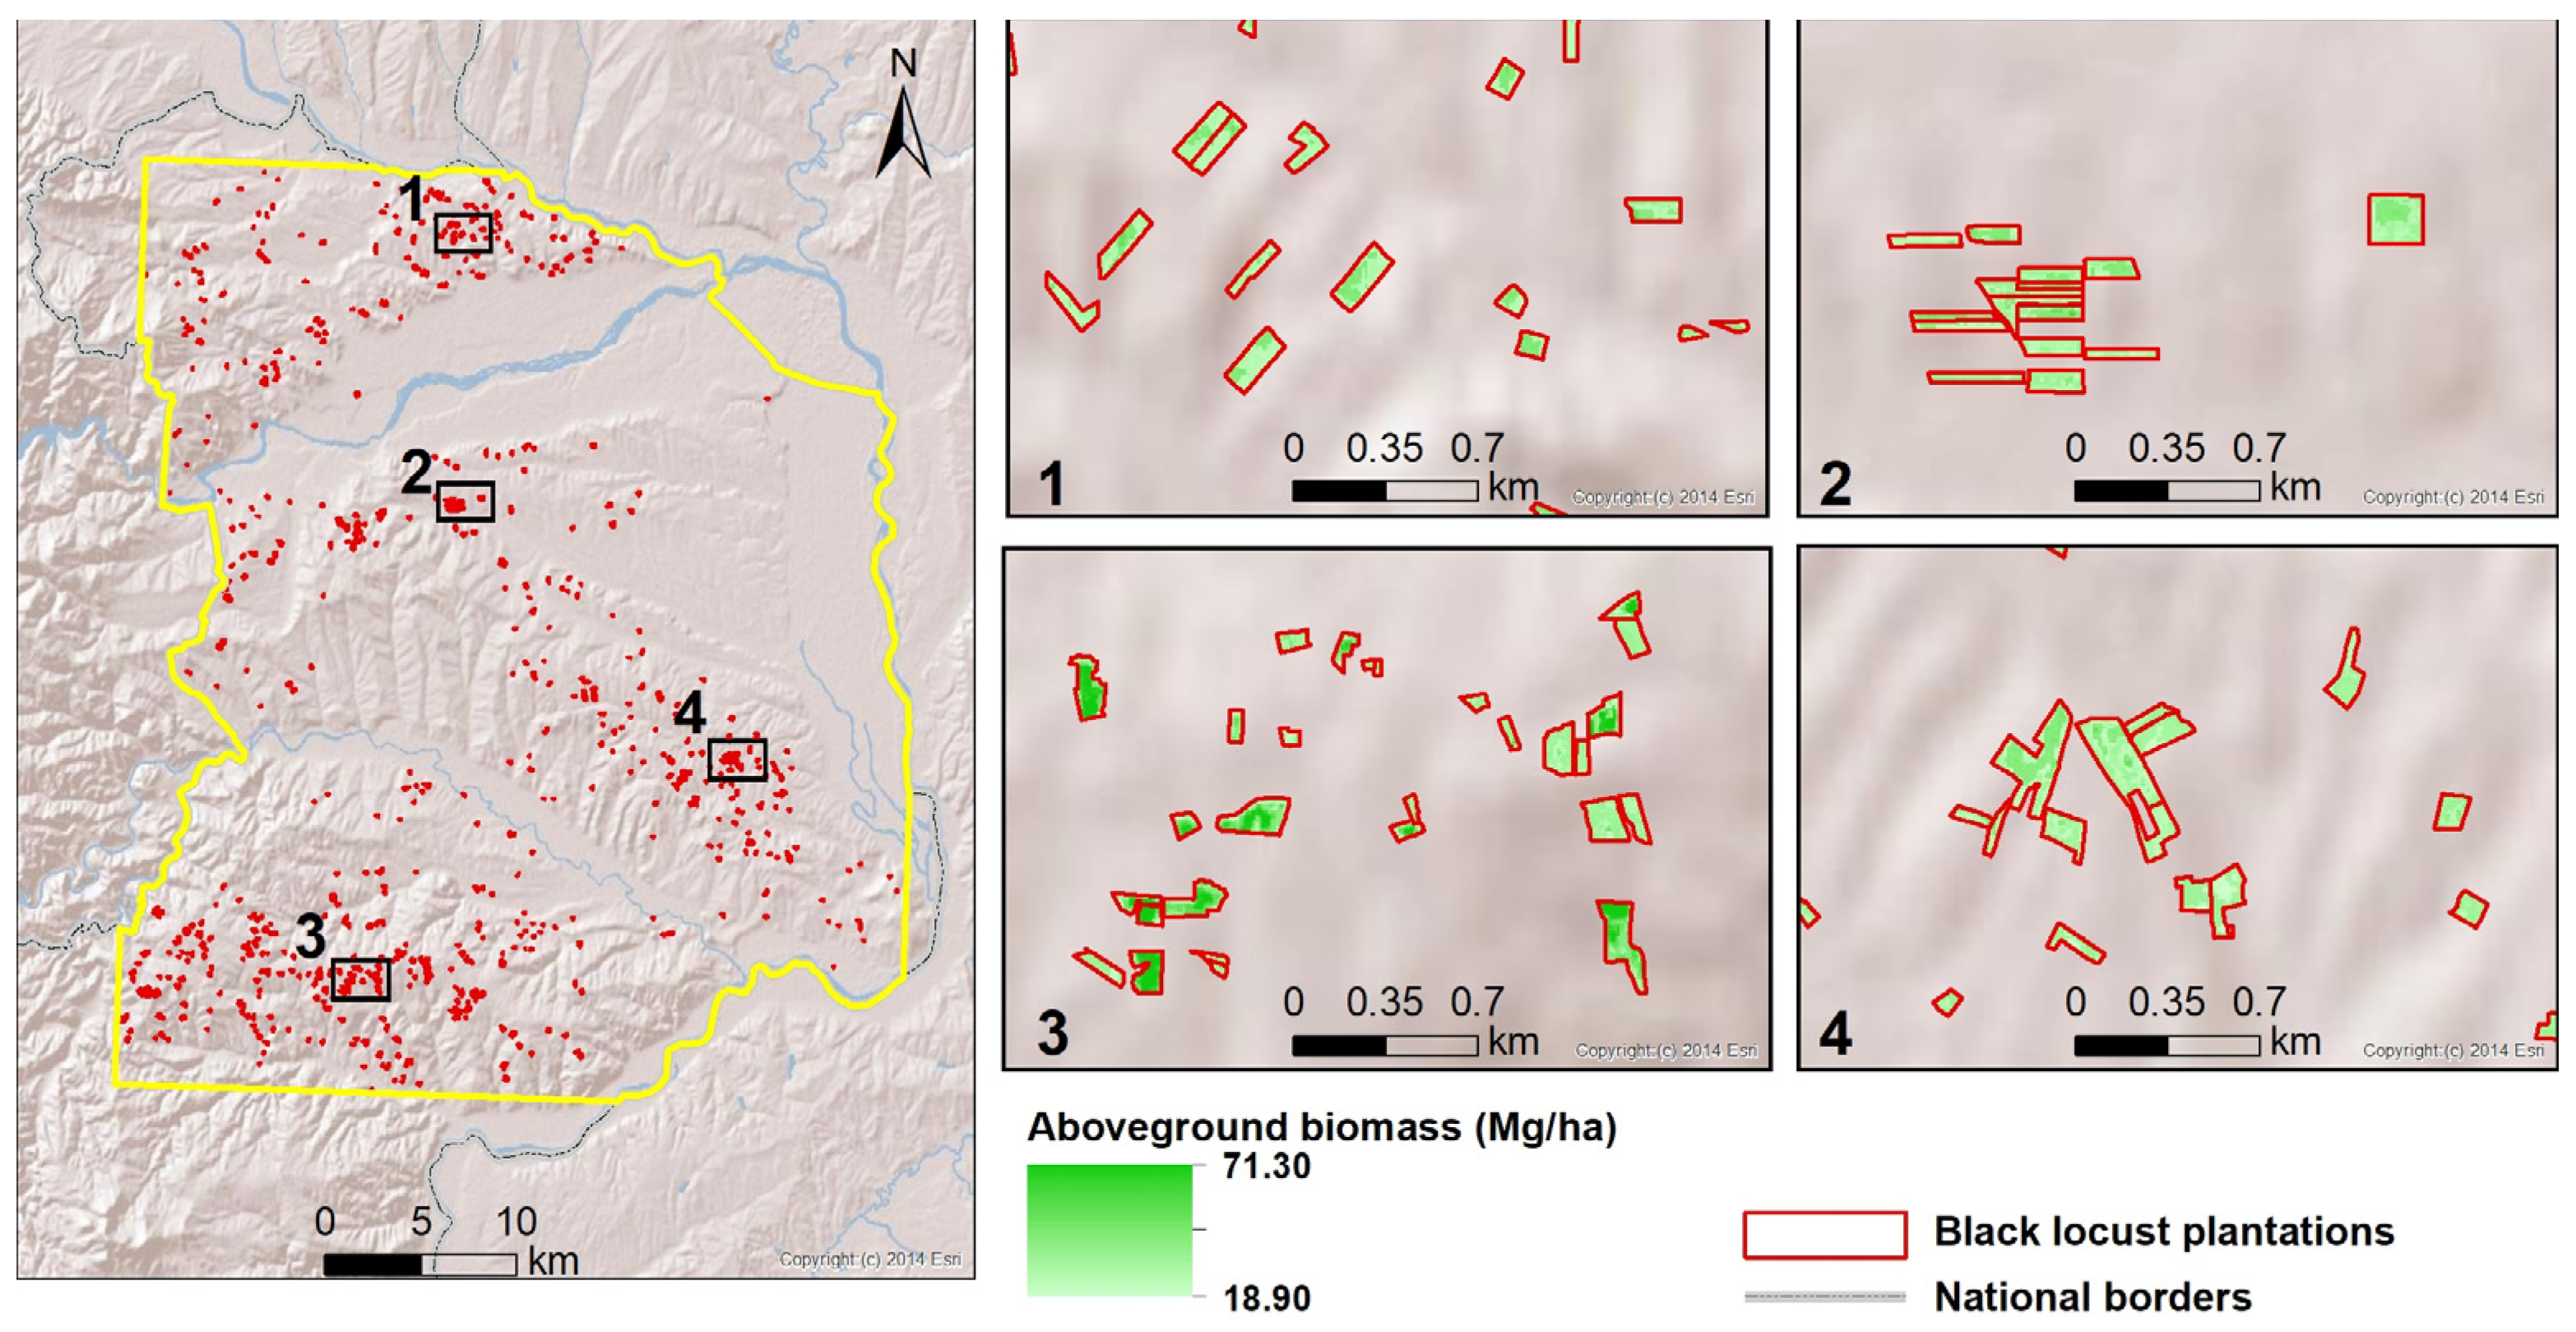
2.1. Study Area
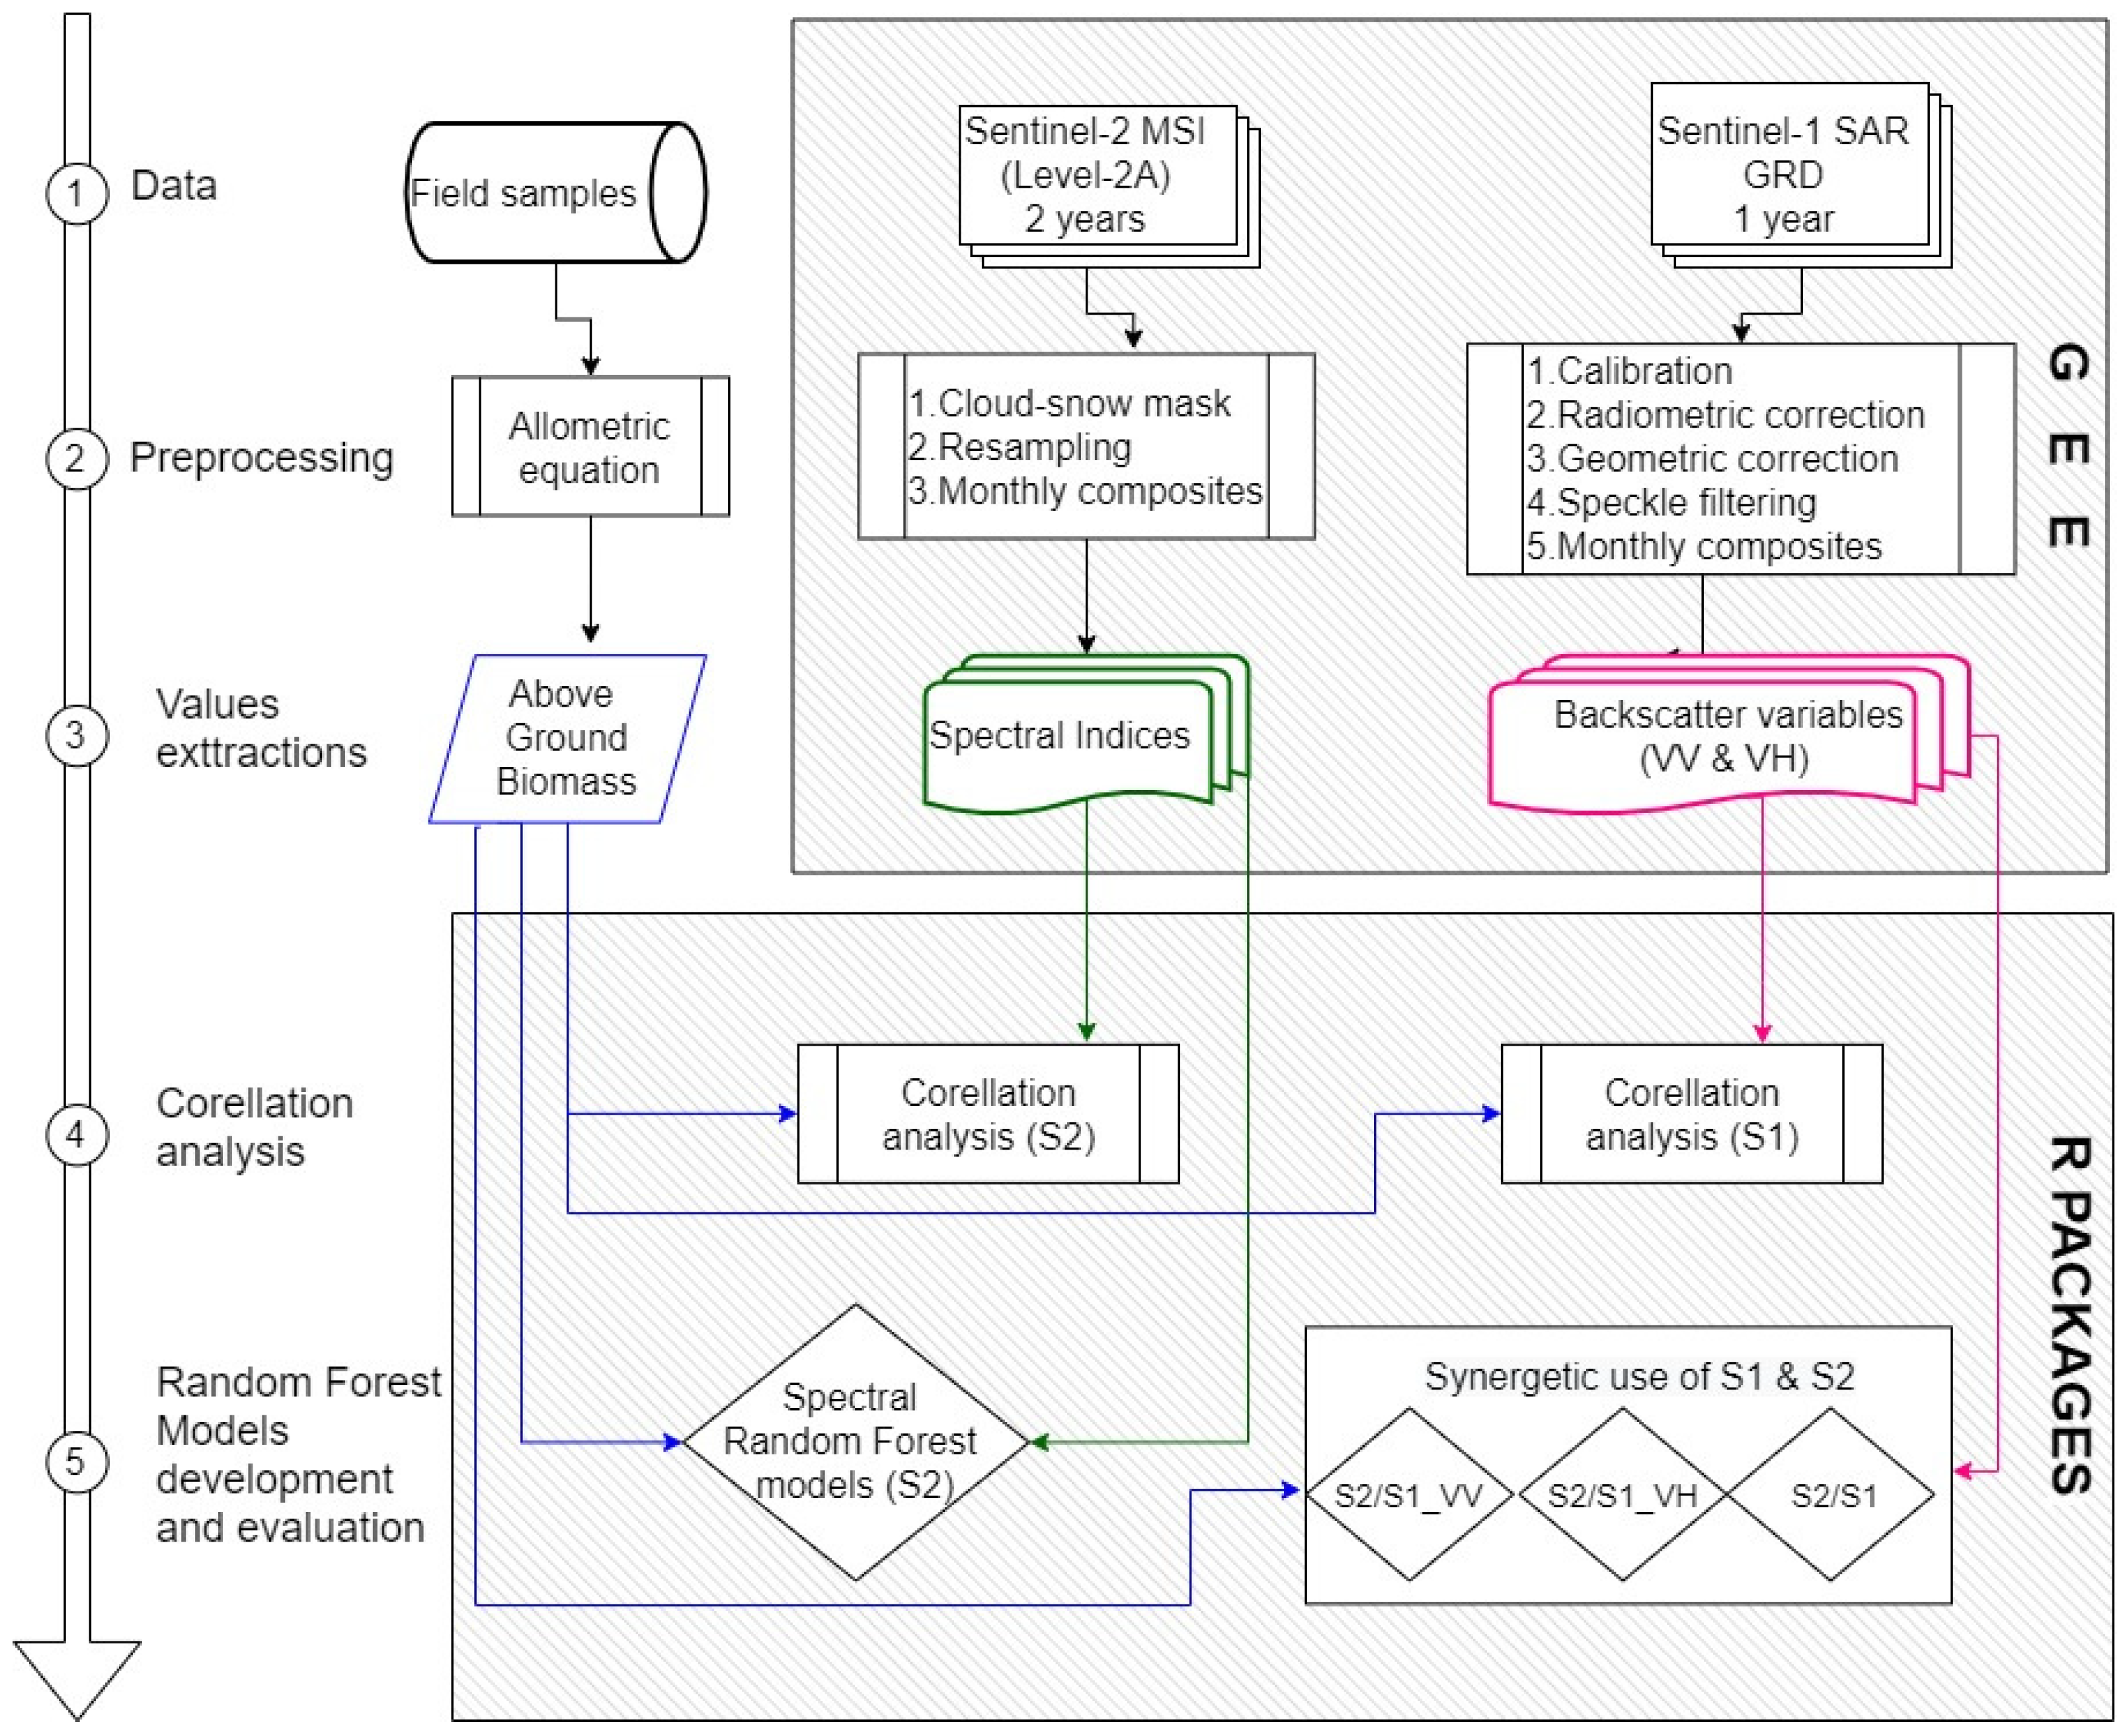
2.2. Analysis Workflow
2.3. In Situ Measurements
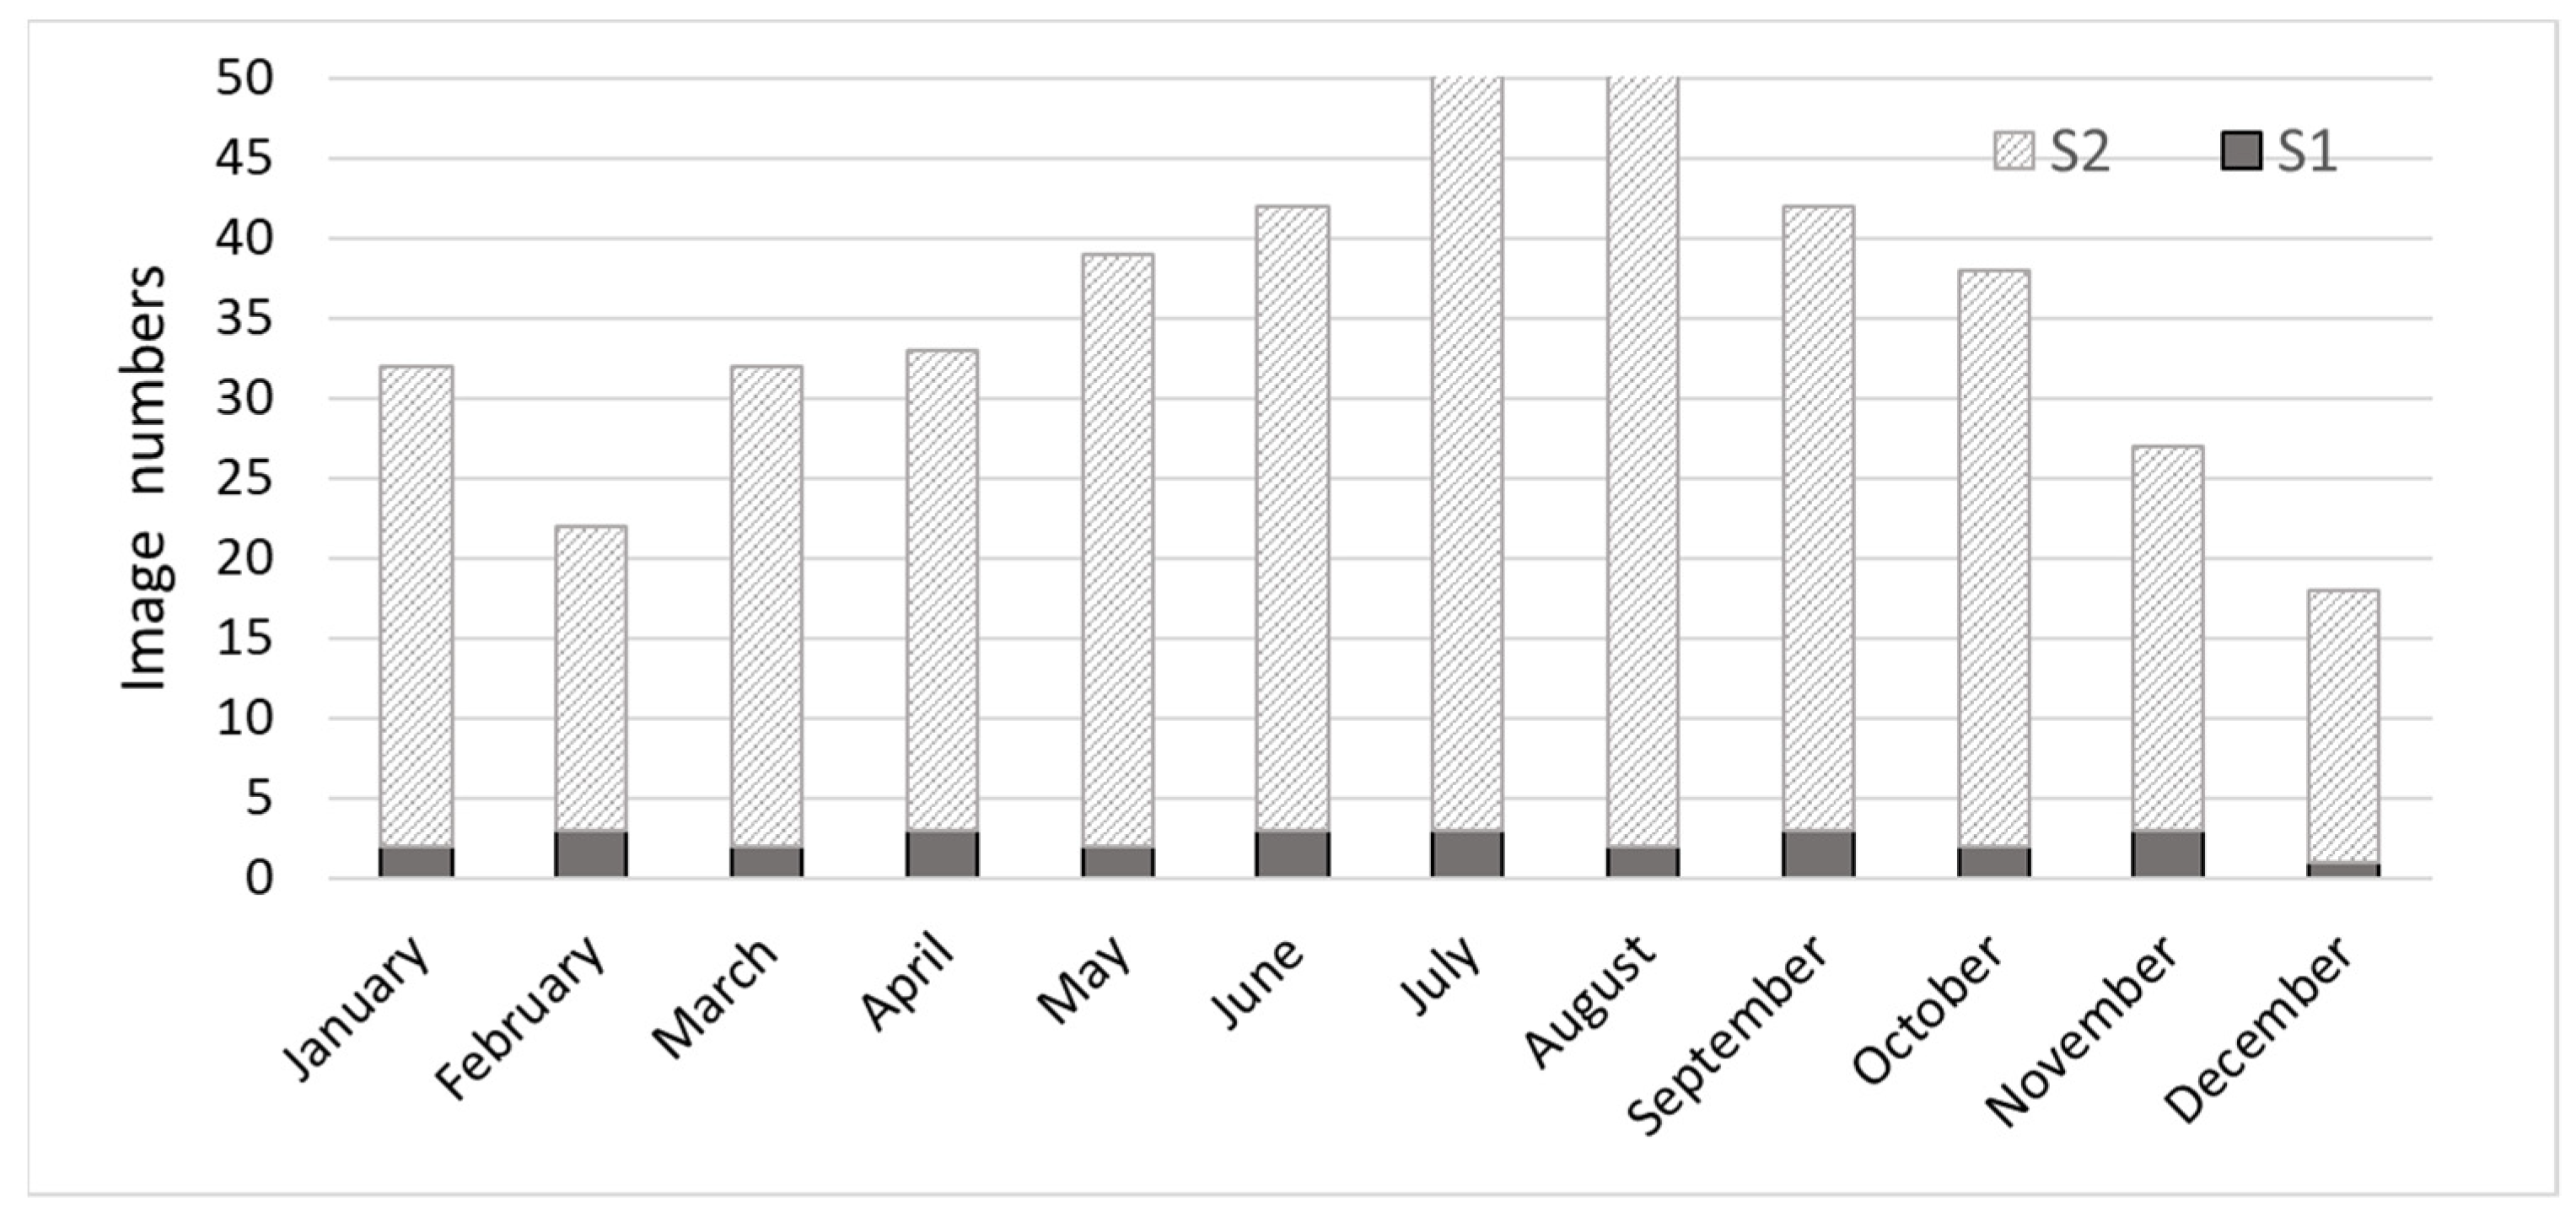
2.4. Remote Sensing Data and Preprocessing

| Index | Formula | Reference |
|---|---|---|
| Sentinel 2 | ||
| NDVI | [34] | |
| NDWI | [35] | |
| NDI45 | NDI45= | [36] |
| MCARI | MCARI = | [37] |
| PSSRa | [38] | |
| GEMI | [39] | |
| where | [39] | |
| WET | [40] | |
| RSR | RSR= | [41] |
| EVI | [42] | |
| GNDVI | GNDVI = | [43] |
| Sentinel 1 | ||
| VV | vertical transmit and vertical receive polarization | |
| VH | vertical transmit and horizontal receive polarization | |
2.5. Random Forest Modeling and Assessment
3. Results
4. Discussion
4.1. AGB Models Using Sentinel-1 and Sentinel-2 Data
4.2. Information Content of Individual Variables
5. Conclusions
Author Contributions
Funding
Data Availability Statement
Acknowledgments
Conflicts of Interest
References
- Sikkema, R.; Proskurina, S.; Banja, M.; Vakkilainen, E. How can solid biomass contribute to the EU’s renewable energy targets in 2020, 2030 and what are the GHG drivers and safeguards in energy- and forestry sectors? Renew. Energy 2021, 165, 758–772. [Google Scholar] [CrossRef]
- Xu, Z.; Smyth, C.E.; Lemprière, T.C.; Rampley, G.J.; Kurz, W.A. Climate change mitigation strategies in the forest sector: Biophysical impacts and economic implications in British Columbia, Canada. Mitig. Adapt. Strateg. Glob. Chang. 2018, 23, 257–290. [Google Scholar] [CrossRef] [Green Version]
- Lelieveld, J.; Klingmüller, K.; Pozzer, A.; Burnett, R.T.; Haines, A.; Ramanathan, V. Effects of fossil fuel and total anthropogenic emission removal on public health and climate. Proc. Natl. Acad. Sci. USA 2019, 116, 7192–7197. [Google Scholar] [CrossRef] [PubMed] [Green Version]
- Freer-Smith, P.; Muys, B.; Bozzano, M.; Drössler, L.; Farrelly, N.; Jactel, H.; Korhonen, J.; Minotta, G.; Nijnik, M.; Orazio, C. Plantation Forests in Europe: Challenges and Opportunities; European Forest Institute: Joensu, Finland, 2019; Volume 9, pp. 1–52. [Google Scholar]
- Silva, L.N.; Freer-Smith, P.; Madsen, P. Production, restoration, mitigation: A new generation of plantations. New For. 2019, 50, 153–168. [Google Scholar] [CrossRef]
- Lindegaard, K.N.; Adams, P.W.R.; Holley, M.; Lamley, A.; Henriksson, A.; Larsson, S.; von Engelbrechten, H.-G.; Esteban Lopez, G.; Pisarek, M. Short rotation plantations policy history in Europe: Lessons from the past and recommendations for the future. Food Energy Secur. 2016, 5, 125–152. [Google Scholar] [CrossRef]
- Pleguezuelo, C.R.R.; Zuazo, V.H.D.; Bielders, C.; Bocanegra, J.A.J.; PereaTorres, F.; Martínez, J.R.F. Bioenergy farming using woody crops. A review. Agron. Sustain. Dev. 2015, 35, 95–119. [Google Scholar] [CrossRef] [Green Version]
- Deng, X.; Guo, S.; Sun, L.; Chen, J. Identification of Short-Rotation Eucalyptus Plantation at Large Scale Using Multi-Satellite Imageries and Cloud Computing Platform. Remote Sens. 2020, 12, 2153. [Google Scholar] [CrossRef]
- Latifi, H.; Nothdurft, a.; Koch, B. Non-parametric prediction and mapping of standing timber volume and biomass in a temperate forest: Application of multiple optical/LiDAR-derived predictors. Forestry 2010, 83, 395–407. [Google Scholar] [CrossRef] [Green Version]
- Hosseini, Z.; Naghavi, H.; Latifi, H.; Bakhtiari Bakhtiarvand, S. Estimating biomass and carbon sequestration of plantations around industrial areas using very high resolution stereo satellite imagery. iForest Biogeosci. For. 2019, 12, 533–541. [Google Scholar] [CrossRef] [Green Version]
- Mauya, E.W.; Koskinen, J.; Tegel, K.; Hämäläinen, J.; Kauranne, T.; Käyhkö, N. Modelling and predicting the growing stock volume in small-scale plantation forests of tanzania using multi-sensor image synergy. Forests 2019, 10, 279. [Google Scholar] [CrossRef] [Green Version]
- Galidaki, G.; Zianis, D.; Gitas, I.; Radoglou, K.; Karathanassi, V.; Tsakiri–Strati, M.; Woodhouse, I.; Mallinis, G. Vegetation biomass estimation with remote sensing: Focus on forest and other wooded land over the Mediterranean ecosystem. Int. J. Remote Sens. 2017, 38, 1940–1966. [Google Scholar] [CrossRef] [Green Version]
- Marsden, C.; le Maire, G.; Stape, J.-L.; Lo Seen, D.; Roupsard, O.; Cabral, O.; Epron, D.; Lima, A.M.N.; Nouvellon, Y. Relating MODIS vegetation index time-series with structure, light absorption and stem production of fast-growing Eucalyptus plantations. For. Ecol. Manag. 2010, 259, 1741–1753. [Google Scholar] [CrossRef]
- Issa, S.; Dahy, B.; Saleous, N.; Ksiksi, T. Carbon stock assessment of date palm using remote sensing coupled with field-based measurements in Abu Dhabi (United Arab Emirates). Int. J. Remote Sens. 2019, 40, 7561–7580. [Google Scholar] [CrossRef]
- Chen, L.; Wang, Y.; Ren, C.; Zhang, B.; Wang, Z. Optimal Combination of Predictors and Algorithms for Forest Above-Ground Biomass Mapping from Sentinel and SRTM Data. Remote Sens. 2019, 11, 414. [Google Scholar] [CrossRef] [Green Version]
- Zhao, Q.; Yu, S.; Zhao, F.; Tian, L.; Zhao, Z. Comparison of machine learning algorithms for forest parameter estimations and application for forest quality assessments. For. Ecol. Manag. 2019, 434, 224–234. [Google Scholar] [CrossRef]
- Dube, T.; Mutanga, O. The impact of integrating WorldView-2 sensor and environmental variables in estimating plantation forest species aboveground biomass and carbon stocks in uMgeni Catchment, South Africa. ISPRS J. Photogramm. Remote Sens. 2016, 119, 415–425. [Google Scholar] [CrossRef]
- Lu, J.; Wang, H.; Qin, S.; Cao, L.; Pu, R.; Li, G.; Sun, J. Estimation of aboveground biomass of Robinia pseudoacacia forest in the Yellow River Delta based on UAV and Backpack LiDAR point clouds. Int. J. Appl. Earth Obs. Geoinf. 2020, 86, 102014. [Google Scholar] [CrossRef]
- Laurin, G.V.; Balling, J.; Corona, P.; Mattioli, W.; Papale, D.; Puletti, N.; Rizzo, M.; Truckenbrodt, J.; Urban, M. Above-ground biomass prediction by Sentinel-1 multitemporal data in central Italy with integration of ALOS2 and Sentinel-2 data. J. Appl. Remote Sens. 2018, 12, 1. [Google Scholar] [CrossRef]
- Navarro, J.A.; Algeet, N.; Fernández-Landa, A.; Esteban, J.; Rodríguez-Noriega, P.; Guillén-Climent, M.L. Integration of UAV, Sentinel-1, and Sentinel-2 data for mangrove plantation aboveground biomass monitoring in Senegal. Remote Sens. 2019, 11, 77. [Google Scholar] [CrossRef] [Green Version]
- Morel, A.C.; Saatchi, S.S.; Malhi, Y.; Berry, N.J.; Banin, L.; Burslem, D.; Nilus, R.; Ong, R.C. Estimating aboveground biomass in forest and oil palm plantation in Sabah, Malaysian Borneo using ALOS PALSAR data. For. Ecol. Manag. 2011, 262, 1786–1798. [Google Scholar] [CrossRef]
- Baghdadi, N.; Le Maire, G.; Bailly, J.; Osé, K.; Nouvellon, Y.; Zribi, M.; Lemos, C.; Hakamada, R. Evaluation of ALOS/PALSAR L-Band Data for the Estimation of Eucalyptus Plantations Aboveground Biomass in Brazil. IEEE J. Sel. Top. Appl. Earth Obs. Remote Sens. 2015, 8, 3802–3811. [Google Scholar] [CrossRef] [Green Version]
- Chen, L.; Wang, Y.; Ren, C.; Zhang, B.; Wang, Z. Assessment of multi-wavelength SAR and multispectral instrument data for forest aboveground biomass mapping using random forest kriging. For. Ecol. Manag. 2019, 447, 12–25. [Google Scholar] [CrossRef]
- YPEKA. Special Secretariat of Forest Environment. Annual Report of Forest Service Activities during 2010; Athens, 2012. Available online: https://ypen.gov.gr/wp-content/uploads/legacy/Files/Dash/Diethnh%20Themata%20-%20Statistika/Apologismoi%20Drasthriothtwn%20Dasikwn%20Yphresiwn/apologismos_2010_final.pdf (accessed on 10 July 2021).
- Straker, K.C.; Quinn, L.D.; Voigt, T.B.; Lee, D.K.; Kling, G.J. Black Locust as a Bioenergy Feedstock: A Review. BioEnergy Res. 2015, 8, 1117–1135. [Google Scholar] [CrossRef]
- Dikau, R. The application of a digital relief model to landform analysis in geomorphology. Three Dimens. Appl. GIS 1989. [Google Scholar] [CrossRef]
- Beck, H.E.; Zimmermann, N.E.; McVicar, T.R.; Vergopolan, N.; Berg, A.; Wood, E.F. Present and future köppen-geiger climate classification maps at 1-km resolution. Sci. Data 2018, 5, 1–12. [Google Scholar] [CrossRef] [Green Version]
- Annighöfer, P.; Mölder, I.; Zerbe, S.; Kawaletz, H.; Terwei, A.; Ammer, C. Biomass functions for the two alien tree species Prunus serotina Ehrh. and Robinia pseudoacacia L. in floodplain forests of Northern Italy. Eur. J. For. Res. 2012, 131, 1619–1635. [Google Scholar] [CrossRef] [Green Version]
- Main-Knorn, M.; Pflug, B.; Louis, J.; Debaecker, V.; Müller-Wilm, U.; Gascon, F. Sen2Cor for Sentinel-2. SPIE Proc. 2017, 10427, 1042704. [Google Scholar] [CrossRef] [Green Version]
- Gorelick, N.; Hancher, M.; Dixon, M.; Ilyushchenko, S.; Thau, D.; Moore, R. Google Earth Engine: Planetary-scale geospatial analysis for everyone. Remote Sens. Environ. 2017, 202, 18–27. [Google Scholar] [CrossRef]
- Ghasemi, N.; Sahebi, M.R.; Mohammadzadeh, A. A review on biomass estimation methods using synthetic aperture radar data. Int. J. Geomatics Geosci. 2011, 1, 776–788. [Google Scholar]
- Rouse, J.W.; Haas, R.H.; Schell, J.A.; Deering, D.W. Monitoring the Vernal Advancement and Retrogradation (Green Wave Effect) of Natural Vegetation. Prog. Rep. RSC 1978-1. 1973. Available online: https://core.ac.uk/download/pdf/42887948.pdf (accessed on 10 July 2021).
- Gao, B.C. NDWI—A normalized difference water index for remote sensing of vegetation liquid water from space. Remote Sens. Environ. 1996, 58, 257–266. [Google Scholar] [CrossRef]
- Delegido, J.; Verrelst, J.; Alonso, L.; Moreno, J. Evaluation of sentinel-2 red-edge bands for empirical estimation of green LAI and chlorophyll content. Sensors 2011, 11, 7063–7081. [Google Scholar] [CrossRef] [Green Version]
- Daughtry, C.S.T.; Walthall, C.L.; Kim, M.S.; De Colstoun, E.B.; McMurtrey, J.E. Estimating corn leaf chlorophyll concentration from leaf and canopy reflectance. Remote Sens. Environ. 2000, 74, 229–239. [Google Scholar] [CrossRef]
- Blackburn, G.A. Spectral indices for estimating photosynthetic pigment concentrations: A test using senescent tree leaves. Int. J. Remote Sens. 1998, 19, 657–675. [Google Scholar] [CrossRef]
- Pinty, A.B.; Verstraete, M.M.; Vegetatio, S.; Jul, N.; Pinty, B. GEMI: A Non-Linear Index to Monitor Global Vegetation from Satellites. Vegetatio 2011, 101, 15–20. [Google Scholar] [CrossRef]
- Henrich, V.; Jung, A.; Götze, C.; Sandow, C.; Thürkow, D.; Gläßer, C. Development of an online indices database: Motivation, concept and implementation. In Proceedings of the 6th EARSeL Imaging Spectroscopy SIG Workshop Innovative Tool for Scientific and Commercial Environment Applications, Tel Aviv, Israel, 16–18 March 2009. [Google Scholar]
- Stenberg, P.; Rautiainen, M.; Manninen, T.; Voipio, P.; Smolander, H. Reduced simple ratio better than NDVI for estimating LAI in Finnish pine and spruce stands. Silva Fenn. 2004, 38, 3–14. [Google Scholar] [CrossRef] [Green Version]
- Schober, P.; Schwarte, L.A. Correlation coefficients: Appropriate use and interpretation. Anesth. Analg. 2018, 126, 1763–1768. [Google Scholar] [CrossRef]
- Breiman, L. Random forests. Mach. Learn. 2001, 45, 5–32. [Google Scholar] [CrossRef] [Green Version]
- Hengl, T.; Nussbaum, M.; Wright, M.N.; Heuvelink, G.B.M.; Gräler, B. Random forest as a generic framework for predictive modeling of spatial and spatio-temporal variables. PeerJ 2018, 2018. [Google Scholar] [CrossRef] [Green Version]
- Tomaschek, F.; Hendrix, P.; Baayen, R.H. Strategies for addressing collinearity in multivariate linguistic data. J. Phon. 2018, 71, 249–267. [Google Scholar] [CrossRef]
- Latifi, H.; Koch, B. Evaluation of most similar neighbour and random forest methods for imputing forest inventory variables using data from target and auxiliary stands. Int. J. Remote Sens. 2012, 33, 6668–6694. [Google Scholar] [CrossRef]
- Liaw, A.; Wiener, M. Package ‘randomForest’: Breiman and Cutler’s Random Forests for Classification and Regression. 2014, Volume 4, pp. 6–10. Available online: https://rdrr.io/cran/randomForest/ (accessed on 10 July 2021).
- Trevor, H.; Tibshirani, R.; Friedman, J. The Elements of Statistical Learning Data Mining, Inference, and Prediction; 2009; Volume 2, ISBN 9780387848570. Available online: https://web.stanford.edu/~hastie/ElemStatLearn/ (accessed on 10 July 2021).
- Ehrlinger, J. ggRandomForests: Visually Exploring a Random Forest for Regression. Clevel. Clevel. Clin. 2015. Available online: https://www.semanticscholar.org/paper/ggRandomForests%3A-Random-Forests-for-Regression-Ehrlinger/1bc5ba9301d2b23743b09e2210797bc49e5eacea (accessed on 10 July 2021).
- Bartha, D.; Csiszár, Á.; Zsigmond, V. Black locust (Robinia pseudoacacia L.). In The Most Important Invasive Plants in Hungary; Botta-Dukát, Ζ., Balogh, L., Eds.; Institute of Ecology and Botany, Hungarian Academy of Sciences: Vácrátót, Hungary, 2008; pp. 63–76. [Google Scholar]
- Hosseini, Z.; Latifi, H.; Naghavi, H.; Bakhtiarvand Bakhtiari, S.; Fassnacht, F.E. Influence of plot and sample sizes on aboveground biomass estimations in plantation forests using very high resolution stereo satellite imagery. For. Int. J. For. Res. 2021, 94, 278–291. [Google Scholar] [CrossRef]
- Li, J.; Alvarez, B.; Siwabessy, J.; Tran, M.; Huang, Z.; Przeslawski, R.; Radke, L.; Howard, F.; Nichol, S. Application of random forest, generalised linear model and their hybrid methods with geostatistical techniques to count data: Predicting sponge species richness. Environ. Model. Softw. 2017, 97, 112–129. [Google Scholar] [CrossRef]
- Forkuor, G.; Benewinde Zoungrana, J.-B.; Dimobe, K.; Ouattara, B.; Vadrevu, K.P.; Tondoh, J.E. Above-ground biomass mapping in West African dryland forest using Sentinel-1 and 2 datasets - A case study. Remote Sens. Environ. 2020, 236, 111496. [Google Scholar] [CrossRef]
- Li, Y.; Li, M.; Li, C.; Liu, Z. Forest aboveground biomass estimation using Landsat 8 and Sentinel-1A data with machine learning algorithms. Sci. Rep. 2020, 10, 9952. [Google Scholar] [CrossRef]
- Nuthammachot, N.; Askar, A.; Stratoulias, D.; Wicaksono, P. Combined use of Sentinel-1 and Sentinel-2 data for improving above-ground biomass estimation. Geocarto Int. 2020, 0, 1–11. [Google Scholar] [CrossRef]
- Wolter, P.T.; Berkley, E.A.; Peckham, S.D.; Singh, A.; Townsend, P.A. Exploiting tree shadows on snow for estimating forest basal area using Landsat data. Remote Sens. Environ. 2012, 121, 69–79. [Google Scholar] [CrossRef] [Green Version]
- Zhu, X.; Liu, D. Improving forest aboveground biomass estimation using seasonal Landsat NDVI time-series. ISPRS J. Photogramm. Remote Sens. 2015, 102, 222–231. [Google Scholar] [CrossRef]
- Chrysafis, I.; Mallinis, G.; Gitas, I.; Tsakiri-Strati, M. Estimating Mediterranean forest parameters using multi seasonal Landsat 8 OLI imagery and an ensemble learning method. Remote Sens. Environ. 2017, 199, 154–166. [Google Scholar] [CrossRef]
- Smith, P.F.; Ganesh, S.; Liu, P. A comparison of random forest regression and multiple linear regression for prediction in neuroscience. J. Neurosci. Methods 2013, 220, 85–91. [Google Scholar] [CrossRef]
- Maleki, M.; Arriga, N.; Barrios, J.M.; Wieneke, S.; Liu, Q.; Peñuelas, J.; Janssens, I.A.; Balzarolo, M. Estimation of Gross Primary Productivity (GPP) Phenology of a Short-Rotation Plantation Using Remotely Sensed Indices Derived from Sentinel-2 Images. Remote Sens. 2020, 12, 2104. [Google Scholar] [CrossRef]
- Camps-Valls, G.; Campos-Taberner, M.; Moreno-Martínez, Á.; Walther, S.; Duveiller, G.; Cescatti, A.; Mahecha, M.D.; Muñoz-Marí, J.; García-Haro, F.J.; Guanter, L.; et al. A Unified Vegetation Index for Quantifying the Terrestrial Biosphere. Sci. Adv. 2021, 1–11. [Google Scholar]
- Barati, S.; Rayegani, B.; Saati, M.; Sharifi, A.; Nasri, M. Comparison the accuracies of different spectral indices for estimation of vegetation cover fraction in sparse vegetated areas. Egypt. J. Remote Sens. Sp. Sci. 2011, 14, 49–56. [Google Scholar] [CrossRef] [Green Version]
- Zhu, G.; Ju, W.; Chen, J.M.; Liu, Y. A novel Moisture Adjusted Vegetation Index (MAVI) to reduce background reflectance and topographical effects on LAI retrieval. PLoS ONE 2014, 9, 1–15. [Google Scholar] [CrossRef] [Green Version]
- Pham, T.D.; Le, N.N.; Ha, N.T.; Nguyen, L.V.; Xia, J.; Yokoya, N.; To, T.T.; Trinh, H.X.; Kieu, L.Q.; Takeuchi, W. Estimating Mangrove Above-Ground Biomass Using Extreme Gradient Boosting Decision Trees Algorithm with Fused Sentinel-2 and ALOS-2 PALSAR-2 Data in Can Gio Biosphere Reserve, Vietnam. Remote Sens. 2020, 12, 777. [Google Scholar] [CrossRef] [Green Version]
- Mariën, B.; Balzarolo, M.; Dox, I.; Leys, S.; Lorène, M.J.; Geron, C.; Portillo-Estrada, M.; AbdElgawad, H.; Asard, H.; Campioli, M. Detecting the onset of autumn leaf senescence in deciduous forest trees of the temperate zone. New Phytol. 2019, 224, 166–176. [Google Scholar] [CrossRef]
- Feng, W.; Wu, Y.; He, L.; Ren, X.; Wang, Y.; Hou, G.; Wang, Y.; Liu, W.; Guo, T. An optimized non-linear vegetation index for estimating leaf area index in winter wheat. Precis. Agric. 2019. [Google Scholar] [CrossRef] [Green Version]
- Hufkens, K.; Friedl, M.; Sonnentag, O.; Braswell, B.H.; Milliman, T.; Richardson, A.D. Linking near-surface and satellite remote sensing measurements of deciduous broadleaf forest phenology. Remote Sens. Environ. 2012, 117, 307–321. [Google Scholar] [CrossRef]
- Rautiainen, M.; Lukeš, P.; Homolová, L.; Hovi, A.; Pisek, J.; Mõttus, M. Spectral Properties of Coniferous Forests: A Review of In Situ and Laboratory Measurements. Remote Sens. 2018, 10, 207. [Google Scholar] [CrossRef] [Green Version]
- Zhang, L.; Sun, X.; Wu, T.; Zhang, H. An Analysis of Shadow Effects on Spectral Vegetation Indexes Using a Ground-Based Imaging Spectrometer. IEEE Geosci. Remote Sens. Lett. 2015, 12, 2188–2192. [Google Scholar] [CrossRef]


| Trees per Ha | Height (m) | Diameter at Breast Height (cm) | Above Ground Biomass (Mg ha−1) | |
|---|---|---|---|---|
| Average | 1589 | 7.64 | 8.71 | 33.43 |
| Range | 733–3522 | 0.5–22 | 3–28.7 | 4.41–98.12 |
| Standard Deviation | 355 | 1.98 | 2.77 | 16.45 |
| MONTH | NDVI | NDWI | NDI45 | MCARI | PSSRA | GEMI | WET | RSR | EVI | GNDVI |
|---|---|---|---|---|---|---|---|---|---|---|
| JANUARY | 0.00 | −0.02 | −0.03 | −0.11 | 0.01 | −0.09 | 0.04 | 0.12 | −0.07 | 0.04 |
| FEBRUARY | 0.11 | 0.05 | 0.13 | −0.03 | 0.12 | −0.02 | 0.14 | 0.30 ** | −0.02 | 0.13 |
| MARCH | 0.13 | 0.06 | 0.09 | −0.11 | 0.14 | 0.01 | 0.18 | 0.26 ** | −0.02 | 0.16 |
| APRIL | 0.20 * | 0.15 | 0.21 * | 0.05 | 0.22 * | 0.16 | 0.17 | 0.23 * | 0.13 | 0.15 |
| MAY | 0.22 * | 0.37 ** | 0.18 | 0.21 * | 0.24 * | 0.34 ** | 0.32 ** | 0.10 | 0.41 ** | 0.21 * |
| JUNE | 0.39 ** | 0.48 ** | 0.34 ** | 0.27 ** | 0.39 ** | 0.51 ** | 0.35 ** | 0.28 ** | 0.48 ** | 0.36 ** |
| JULY | 0.60 ** | 0.64 ** | 0.63 ** | 0.38 ** | 0.60 ** | 0.62 ** | 0.62 ** | 0.59 ** | 0.60 ** | 0.53 ** |
| AUGUST | 0.28 ** | 0.63 ** | 0.32 ** | 0.52 ** | 0.30 ** | 0.39 ** | 0.64 ** | 0.31 ** | 0.54 ** | 0.20 * |
| SEPTEMBER | 0.54 ** | 0.51 ** | 0.62 ** | 0.31 ** | 0.55 ** | 0.49 ** | 0.51 ** | 0.55 ** | 0.41 ** | 0.48 ** |
| OCTOBER | 0.38 ** | 0.37 ** | 0.45 ** | 0.38 ** | 0.39 ** | 0.35 ** | 0.41 ** | 0.37 ** | 0.33 ** | 0.30 ** |
| NOVEMBER | 0.15 | 0.08 | 0.21 * | 0.09 | 0.17 | 0.05 | 0.11 | 0.20 * | 0.05 | 0.15 |
| DECEMBER | 0.24 * | −0.01 | 0.20 * | −0.06 | 0.22 * | 0.01 | 0.11 | 0.29 ** | −0.02 | 0.21 * |
| MONTH | VV | VH | MONTH | VV | VH |
|---|---|---|---|---|---|
| JANUARY | 0.12 | 0.47 ** | July | 0.29 ** | 0.34 ** |
| FEBRUARY | 0.23 * | 0.44 ** | August | 0.18 | 0.22 * |
| MARCH | 0.35 ** | 0.29 ** | September | 0.22 * | 0.35 ** |
| APRIL | 0.19 | 0.28 ** | October | 0.27 ** | 0.07 |
| MAY | 0.27 ** | 0.28 ** | November | 0.14 | 0.26 ** |
| JUNE | 0.11 | 0.14 | December | 0.24 * | 0.25 * |
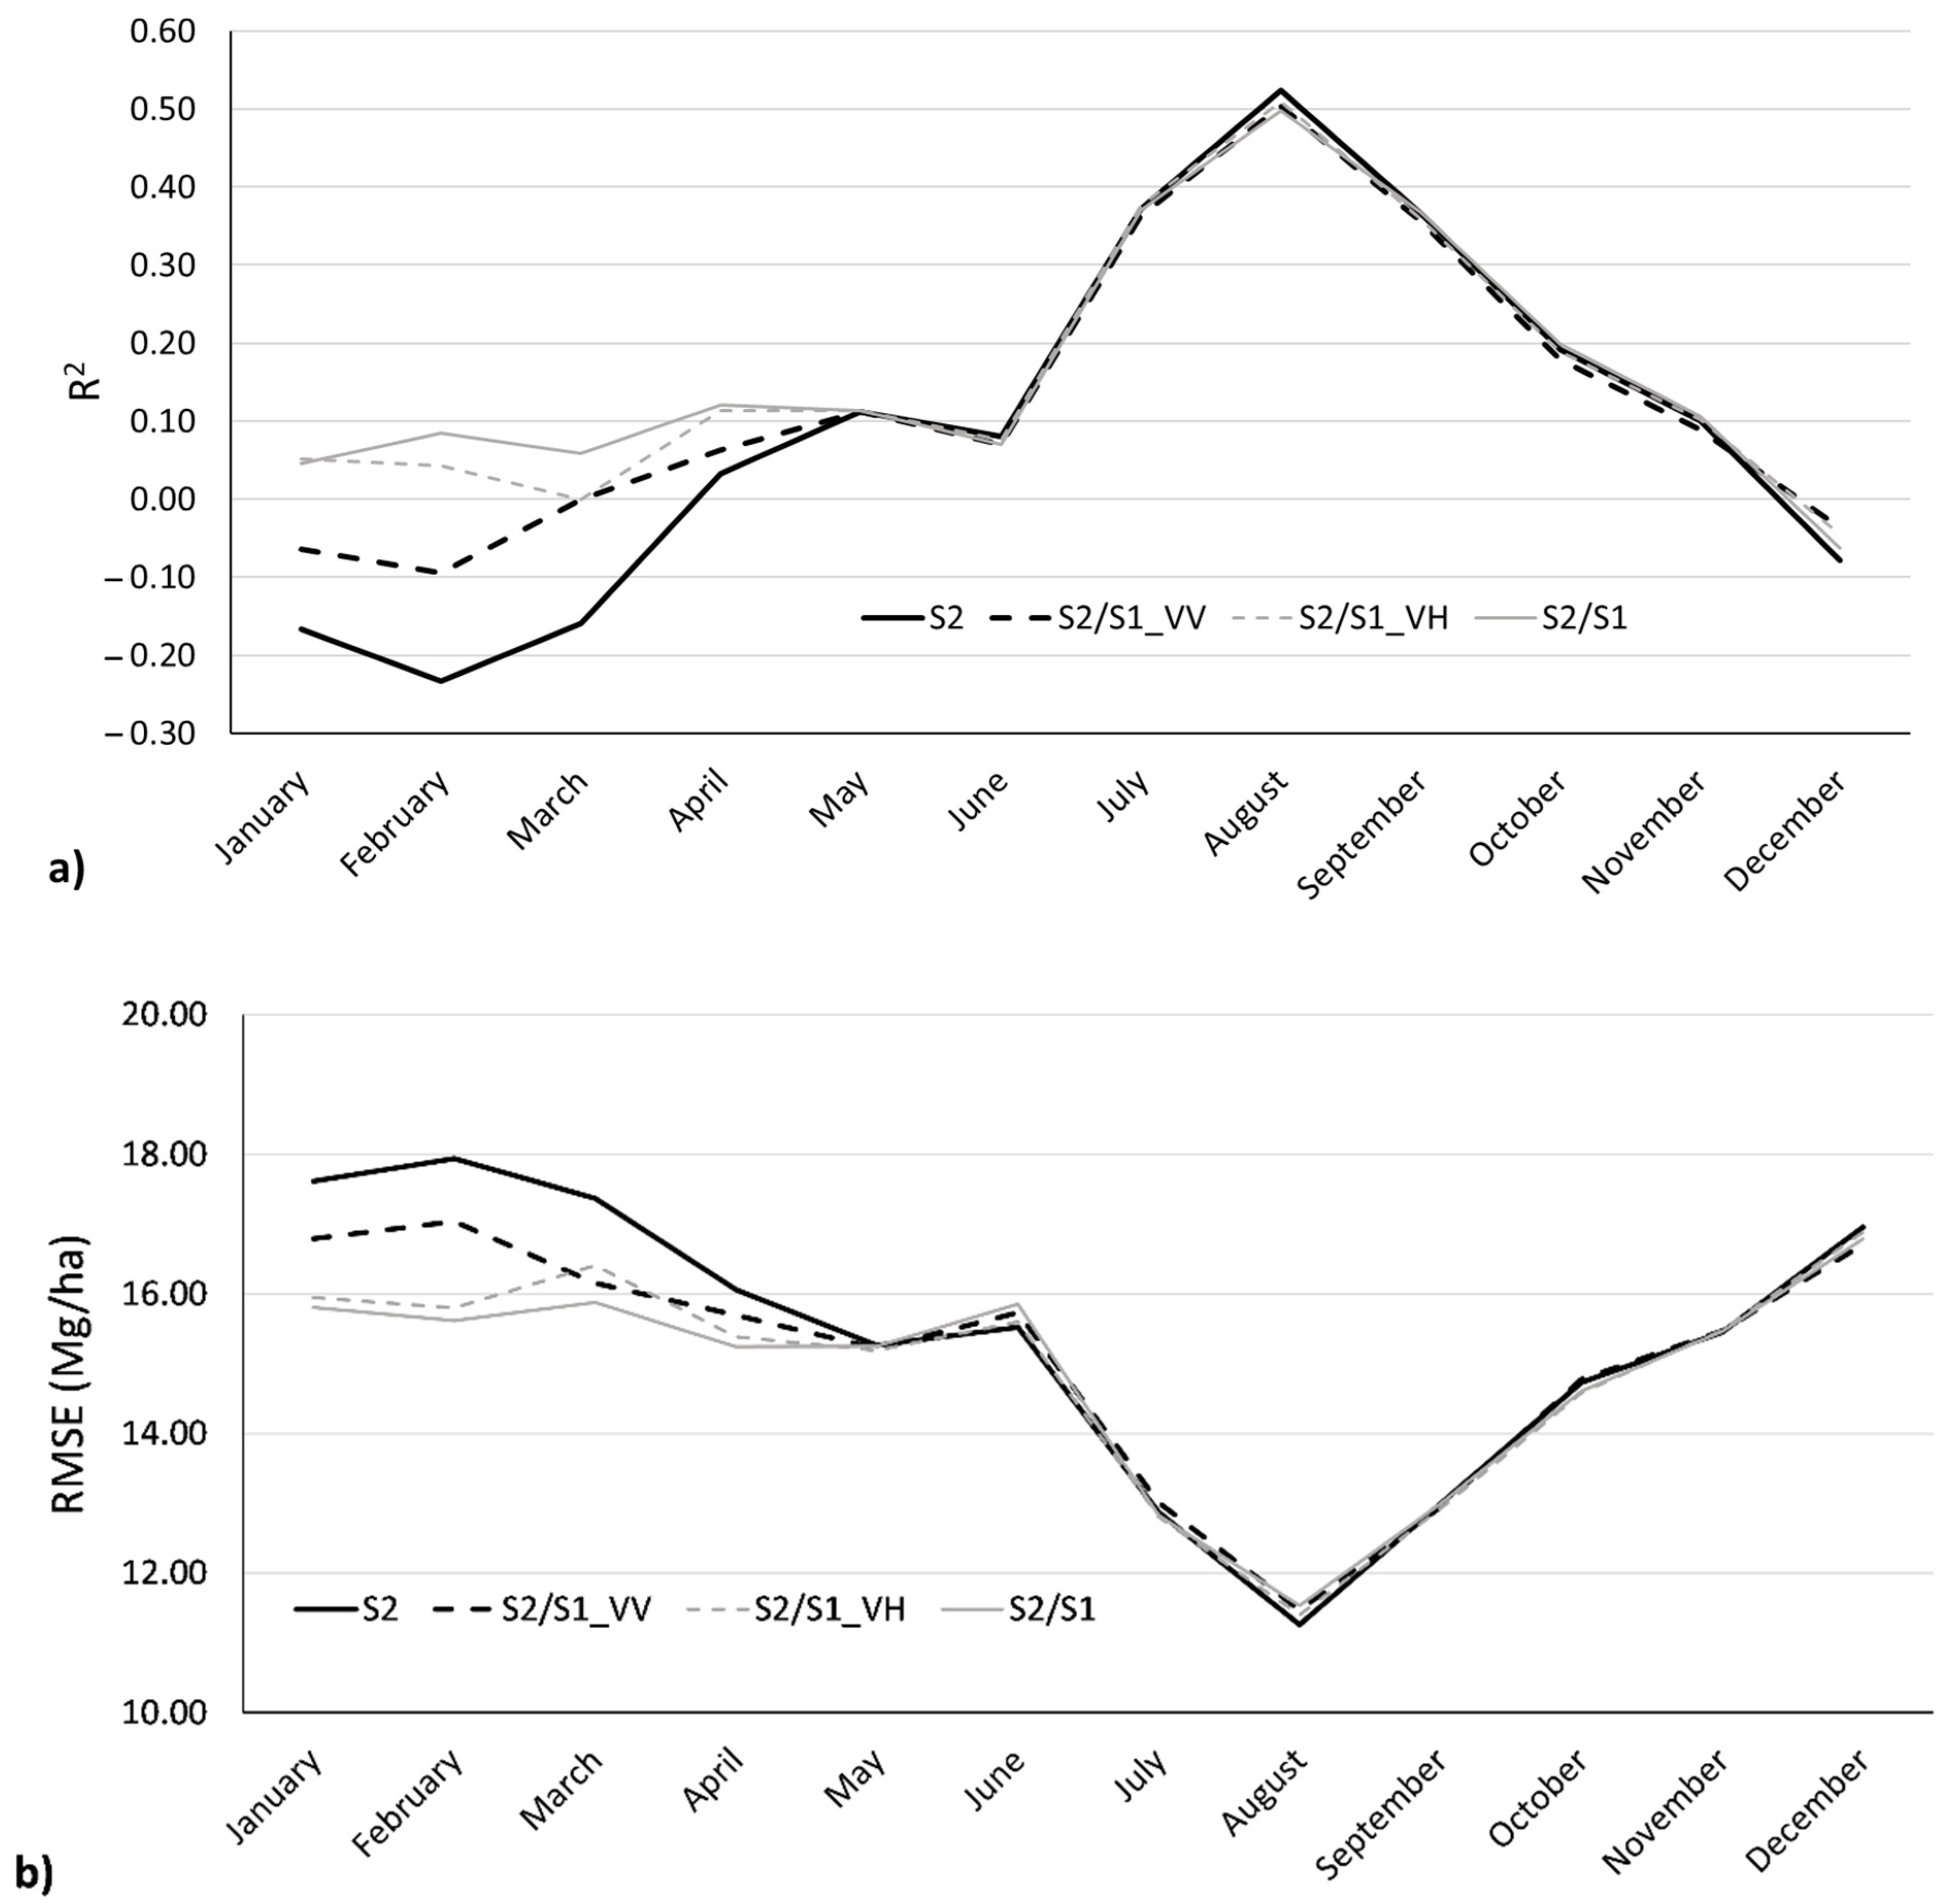
| S2 | S2/S1_VV | S2/S1_VH | S2/S1 | |||||
|---|---|---|---|---|---|---|---|---|
| Month | R2 | RMSE | R2 | RMSE | R2 | RMSE | R2 | RMSE |
| January | −0.17 | 17.62 | −0.06 | 16.79 | 0.05 | 15.95 | 0.05 | 15.81 |
| February | −0.23 | 17.94 | −0.09 | 17.04 | 0.04 | 15.80 | 0.08 | 15.62 |
| March | −0.16 | 17.37 | 0.00 | 16.16 | 0.00 | 16.41 | 0.06 | 15.88 |
| April | 0.03 | 16.06 | 0.06 | 15.70 | 0.11 | 15.39 | 0.12 | 15.25 |
| May | 0.11 | 15.27 | 0.11 | 15.22 | 0.11 | 15.19 | 0.11 | 15.25 |
| June | 0.08 | 15.53 | 0.07 | 15.73 | 0.08 | 15.60 | 0.07 | 15.85 |
| July | 0.37 | 12.87 | 0.36 | 13.01 | 0.38 | 12.81 | 0.37 | 12.83 |
| August | 0.52 | 11.26 | 0.50 | 11.47 | 0.51 | 11.40 | 0.50 | 11.54 |
| September | 0.37 | 12.99 | 0.36 | 12.95 | 0.36 | 12.93 | 0.37 | 12.99 |
| October | 0.19 | 14.73 | 0.18 | 14.77 | 0.19 | 14.58 | 0.20 | 14.61 |
| November | 0.10 | 15.45 | 0.09 | 15.47 | 0.10 | 15.48 | 0.11 | 15.47 |
| December | −0.08 | 16.96 | −0.04 | 16.71 | −0.05 | 16.89 | −0.06 | 16.79 |
Publisher’s Note: MDPI stays neutral with regard to jurisdictional claims in published maps and institutional affiliations. |
© 2021 by the authors. Licensee MDPI, Basel, Switzerland. This article is an open access article distributed under the terms and conditions of the Creative Commons Attribution (CC BY) license (https://creativecommons.org/licenses/by/4.0/).
Share and Cite
Theofanous, N.; Chrysafis, I.; Mallinis, G.; Domakinis, C.; Verde, N.; Siahalou, S. Aboveground Biomass Estimation in Short Rotation Forest Plantations in Northern Greece Using ESA’s Sentinel Medium-High Resolution Multispectral and Radar Imaging Missions. Forests 2021, 12, 902. https://0-doi-org.brum.beds.ac.uk/10.3390/f12070902
Theofanous N, Chrysafis I, Mallinis G, Domakinis C, Verde N, Siahalou S. Aboveground Biomass Estimation in Short Rotation Forest Plantations in Northern Greece Using ESA’s Sentinel Medium-High Resolution Multispectral and Radar Imaging Missions. Forests. 2021; 12(7):902. https://0-doi-org.brum.beds.ac.uk/10.3390/f12070902
Chicago/Turabian StyleTheofanous, Nikos, Irene Chrysafis, Giorgos Mallinis, Christos Domakinis, Natalia Verde, and Sofia Siahalou. 2021. "Aboveground Biomass Estimation in Short Rotation Forest Plantations in Northern Greece Using ESA’s Sentinel Medium-High Resolution Multispectral and Radar Imaging Missions" Forests 12, no. 7: 902. https://0-doi-org.brum.beds.ac.uk/10.3390/f12070902