Article

Evaluation of Long-Term Shortleaf Pine Progeny Tests in the Ouachita and Ozark National Forests, USA

1
Forestry, Ecology and Wildlife Program (FEWP), Alabama A&M University, Huntsville, AL 35762, USA
2
USDA Forest Service, Southern Research Station, Monticello, AR 71656, USA
3
USDA Forest Service, Southern Research Station, Hot Springs, AR 71902, USA
4
State and Private Forestry, USDA Forest Service, Eastern Region, West Lafayette, IN 47907, USA
5
USDA Forest Service, Southern Region, Atlanta, GA 30309, USA
6
USDA Forest Service, Southern Research Station, Forest Health Research and Education Center, Lexington, KY 40546, USA
7
USDA Forest Service, Southern Research Station, Southern Institute of Forest Genetics, Saucier, MS 39574, USA
*
Author to whom correspondence should be addressed.
Retired.
Submission received: 11 May 2021 / Revised: 10 July 2021 / Accepted: 15 July 2021 / Published: 19 July 2021
(This article belongs to the Section Genetics and Molecular Biology)

Abstract

:
Between the late 1970s and the early 1990s, the USDA Forest Service installed 155 shortleaf pine (Pinus echinata Mill.) progeny tests in national forests across the Southern Region of the United States. Using control-pollinated crosses from the Mount Ida Seed Orchard, 84 of these progeny tests were established in the Ouachita and Ozark-St. Francis National Forests in Arkansas and Oklahoma. Each of these 84 test locations had, on average, 33 full-sibling families representing three local geographic seed sources (East Ouachita, West Ouachita, and Ozark). Though largely abandoned years ago, the progeny tests that remain provided an opportunity to determine if significant genetic and genetic × environment variance exists for performance traits (d.b.h., tree height, and survival) decades after installation. In 2018 and 2019, we remeasured d.b.h. and height and determined survival in 15 fully stocked progeny tests. Family variances were significant (p < 0.01) for both d.b.h. and height but not for survival (p > 0.05). Seed sources differed significantly (p < 0.05) for d.b.h., with more pronounced latitudinal differences. Additionally, we determined that individual tree and full-sibling family mean heritabilities were moderate (0.15 and 0.72, respectively, for d.b.h and 0.09 and 0.41, for height), suggesting relatively high genetic to environmental variation and good potential for genetic improvement. We also found that shortleaf pine families were broadly adapted in this region since family-by-test variances were non-significant (p > 0.05).

1. Introduction

Shortleaf pine (Pinus echinata Mill.) is native to 22 states from southern New York to eastern Texas and has the largest natural range of the four major southern pines [1,2]. The extensive distribution of shortleaf pine suggests its adaptability to a wide variety of environmental conditions and considerable genetic diversity [3,4,5]. Shortleaf pine is also known for its commercial and ecological importance. For example, the species has excellent stem form, good growth rates, notable drought tolerance, high resistance to fusiform rust, and yields valuable sawtimber and pulpwood [6,7,8]. The species also offers better opportunities for some conservation purposes than its common associate loblolly pine (Pinus taeda L.)—as an example, red-cockaded woodpeckers (Picoides borealis Vieillot) prefer mature or over-mature shortleaf pine forests [7].
Over the last half-century, shortleaf pine has experienced a significant decline in coverage area and importance across its range, with a particularly dramatic decrease between 1980 and 2013 [9,10,11,12]. While this decline is especially prominent in Piedmont, East Gulf Coastal Plain, and the southern Appalachians, it has also been noticeable in the western part of shortleaf pine’s range, where the species tends to be most prominent [13]. Research and manager experiences suggest that there are several contributing factors to this decline. For example, decades of changes to fire regimes (leading to more hybridization with loblolly pine and insufficient natural regeneration), selection bias in harvest treatments, and other unfavorable forest management practices (e.g., preferential planting of loblolly pine on shortleaf pine sites) have all greatly reduced shortleaf pine abundance [9,12,14].
Not surprisingly, then, shortleaf pine has become a species of growing conservation concern, especially on public lands [9,15]. Consequently, efforts are underway to halt, if not reverse, the range-wide decline of shortleaf pine. In part, this may be achieved by restoring the species to sites it formerly dominated, particularly on the national forests of Arkansas, Missouri, and Oklahoma, where conditions are generally most favorable for the establishment and development of shortleaf pine [16]. Widespread shortleaf pine restoration also presents an opportunity to improve the quality of this commercially important species through the selection of genetic materials better suited for timber production, carbon sequestration, drought tolerance, and/or disease resistance in a changing climate [17,18,19].
Tree improvement and the genetics of shortleaf pine have been studied since at least the 1950s, including seed source trials and progeny tests [20,21,22]. This includes the Southwide Pine Seed Source Study, the first major regional test of growth performance and disease resistance of shortleaf and other southern pines from different geographic sources [21,23,24]. By the 1960s, a shortleaf pine tree improvement program was initiated by the Southern Region of the USDA Forest Service (USFS) using hundreds of superior trees from 12 geographic seed sources selected for their form and straightness, insect and disease resistance, flowering and cone production, and growth. This work led to the establishment of first-generation seed orchards in Arkansas, Louisiana, Mississippi, and North Carolina. Controlled breeding among the first-generation trees began in the late 1970s to develop full-sibling families for progeny testing in support of the Southern Region’s tree improvement program to produce genetically improved seed for their timber management program [8,25].
From the late 1970s and running into the early 1990s, the USFS established 155 shortleaf pine full-sibling family progeny tests on national forests across the entire Southern Region [17]. Of these, 84 progeny tests were established on the Ouachita and Ozark-St. Francis National Forests, and two analyses have been conducted on data collected at 5 and 10 years of age, respectively [17,26]. Researchers found that height and survival at age 5 did not vary among the three tested seed sources (East and West Ouachita and Ozark) [26]. Due to this lack of difference, ref. [26] recommended merging the different seed sources into one breeding population. By year 10, however, ref. [17] they found significant differences among seed sources for both height and diameter and large differences among families for both performance traits, which led them to conclude that family selection would be effective. However, they still recommended maintaining a single breeding population across the Ouachita and Ozark-St. Francis National Forests because there were good families from all three seed sources.
During the mid-1990s, the USFS’s mission evolved into sustainable ecosystem management, while production forestry through intensive timber management became a secondary priority [27]. As a result, USFS’s tree improvement work was significantly curtailed because less seed was needed for reforestation, and declining budgets led to the abandonment of most of the Southern Region’s progeny plantings [28]. The study in [17] of family performance and seed source differences on these Ouachita and Ozark-St. Francis shortleaf pine progeny tests at age 10 was the last scientific analysis conducted. Recently, growing concerns about the range-wide decline of shortleaf pine and a desire to expand agency reforestation efforts to restore shortleaf pine have led to renewed interest in existing shortleaf pine progeny tests.
Given that the Southern Region’s progeny tests are now considerably older (at or near rotation age), it would be of interest to forest and seed orchard managers as well as tree improvement specialists to better understand the relative importance of genetic (i.e., seed sources and families-within-sources) and environmental (i.e., planting regions and test sites-within-regions) variances and their interaction (G × E) on individual tree performance traits. As such, the objective of this study was to determine if significant genetic and G × E variance existed for d.b.h., tree height, and survival in these existing progeny tests. The information obtained over longer time scales can help managers understand the importance of family and seed source selection for restoration efforts, especially those looking to return shortleaf pine to areas that had been converted to loblolly pine or other cover types. A further objective, currently underway in a separate analysis, is to consider if these tests can be used to estimate the genetic parameters needed for breeding value prediction. Together, addressing these objectives should help tree improvement specialists and seed orchard managers to determine which parents to maintain in their current orchard and which tree should be considered when developing a next-generation orchard.

2. Materials and Methods
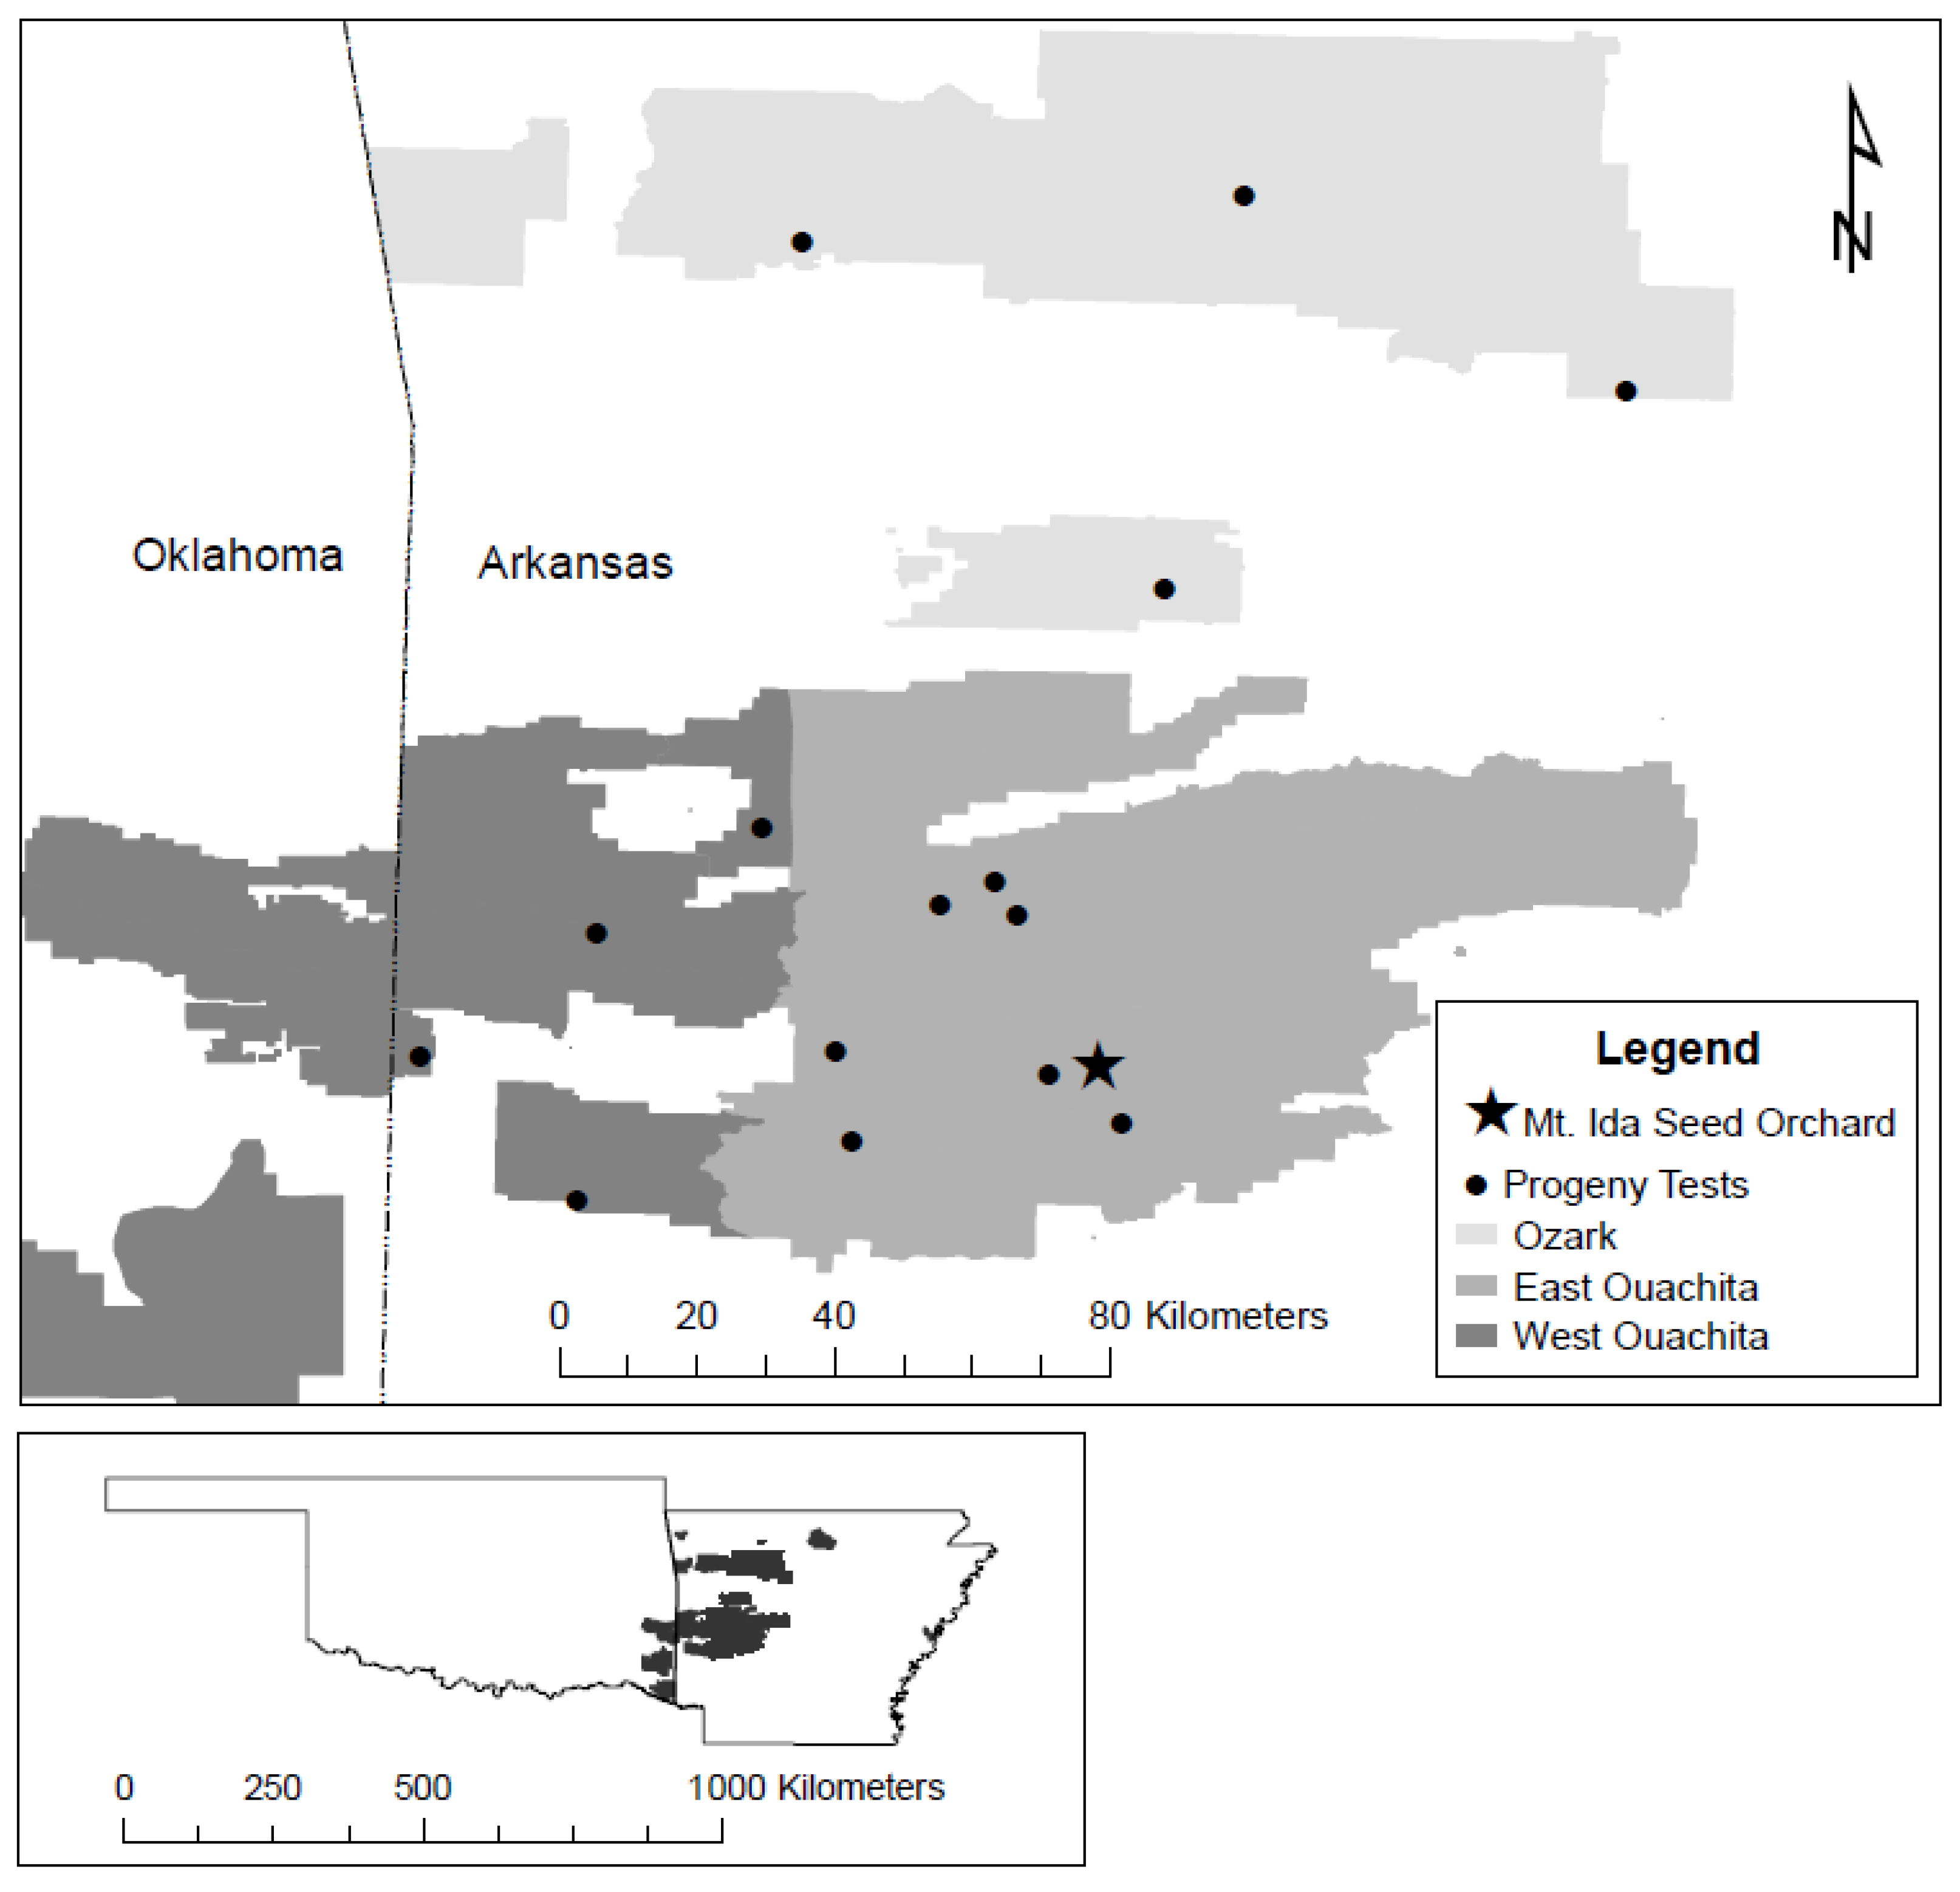
2.1. Study Area

The original 84 shortleaf pine progeny tests were well distributed across the Ouachita National Forest in western Arkansas and eastern Oklahoma and the Ozark-St. Francis National Forest in northern and eastern Arkansas; however, our sampled tests were exclusively in western and northern Arkansas (Figure 1). The Ouachita Mountains are characterized by folded ridges and valleys composed of Paleozoic rocks [29]. The ridges are generally aligned east to west, resulting in an extensive south-facing slope that is exposed to sunlight and becomes dry, and a north-facing slope that is protected from direct solar radiation and is consequently cooler and more mesic. This orientation created alternate bands of distinct vegetation types, with the south-facing slopes dominated by xeric shortleaf pine and shortleaf pine-oak forests and woodlands and north-facing slopes dominated by mesic hardwood forests. Annual precipitation (primarily rainfall) in the Arkansas Ouachita Mountains ranges from 1200 mm to 1400 mm. The mean minimum (January) and maximum (July) monthly temperatures in these mountains are 8.7° and 22.0 °C, respectively [30,31]. The Ozark Mountains are characterized by flat-topped plateaus, rugged hills, and deep valleys carved by streams into the limestone and dolomite bedrock that underlies most of the area. The Ozarks are comprised of three distinct plateaus—Boston, Springfield, and Salem—each representing a slightly different vegetation type [29]. Similar to the Ouachita Mountains, the warm south-facing Ozark slopes are dominated by xeric shortleaf pine and shortleaf pine–oak forests, and cool, north-facing slopes are mostly mesic oak–hickory forests. Average minimum and maximum monthly (January and July) temperatures in the Ozark region are 7.1° and 20.2 °C, respectively, while annual precipitation ranges from 1100 mm to 1400 mm [30].

2.2. Seed Sources

The parent trees for the shortleaf pine progeny tests were selected from three then-designated provenances or seed sources within the Ouachita and Ozark-St. Francis National Forests: East Ouachita (EOU), West Ouachita (WOU), and Ozark (OZ) (Figure 1). The division of the Ouachita National Forest into two seed sources was not based on any provenance test or other research information [23]; rather, the demarcation of the East and West Ouachita source areas was defined by the north–south running US Highway 71 in western Arkansas that roughly bisects the Ouachita National Forest [26]. The Ozark region lies north of the Arkansas River at some distance north of the Ouachita seed sources and consists of notably different soil parent materials, climate regime, and land-use history. While this distance is not large (<100 km), when designated it was expected that these seed source areas would have been influenced by different environmental gradients. For example, the West Ouachita and Ozark seed sources have more severe summer droughts than in East Ouachita [26], which could cause discernable performance-related variation.

2.3. Original Design of Crosses and Test Plantations

Controlled crossing of parent trees was conducted at the Mount Ida Seed Orchard (MISO) in Arkansas. The shortleaf pine component of the MISO consists of the following: ~176 ha of first-generation selections, 6 ha of pedigreed second-generation selections (the “production” orchard), a 4.5 ha of pedigreed second-generation selections (the “breeding” orchard), and a block of shortleaf pine from the Mark Twain National Forest in the Missouri Ozarks (established in 1972) [32]. The progeny tests sampled in this study were the offspring of the first-generation shortleaf pine of Arkansas origin. Furthermore, a recent genetic analysis of the MISO revealed that none of these first-generation shortleaf pine selections were F1 hybrids with any other southern pine species [18].
The MISO’s shortleaf pine breeding plan for the progeny tests was implemented with a six-by-six disconnected half-diallel crossing scheme in which clones from the East Ouachita, Ozark, and West Ouachita seed sources were used as female and male parents using 25 crossing groups (half-diallel) for a total of 150 parents and 375 full-sibling families [26]. The potential number of crosses in a six-by-six half-diallel is 15, and in this case, three of which included parents from the same seed source (intra-provenance crosses), while the other 12 were between parents from different seed sources (inter-provenance crosses). All crosses included in the analysis were full-sibling families assumed to be composed of unrelated parents [17,33].
Seeds from controlled-pollinated crosses (hereafter, full-sibling “families”, as very few reciprocal crosses were made) were planted in progeny field tests at locations across the Ouachita and Ozark National Forests, with one progeny test per planting location (hereafter, “test” or “test site”). The planting design, a randomized block, consisted of five replications (at most locations) of 10-tree row plots, with trees on a 2.4 m × 2.4 m spacing. As replicates were not complete in some tests (i.e., all families were not present in all replications), it resulted in an unequal number of families in the tests. Therefore, while the entire progeny test effort averaged 33 families per test location, the 15 progeny tests in this study (Table 1) averaged 31 families.

2.4. Current Sampling and Data Collection

In 2013, the USFS Southern Region Genetics Program documented the condition of the original 84 shortleaf pine progeny tests on the Ouachita and Ozark-St. Francis National Forests to provide guidance on their future use and maintenance. This assessment showed that the hosting ranger districts managed these abandoned progeny tests inconsistently, from reserving some from management to putting them into general timber operations. Over the years, others were partially or fully destroyed by fires, inadvertent logging, ice storms, insects, and wind events. However, enough of these shortleaf pine progeny tests remained sufficiently consistent with their design to warrant further study. After several discussions between the Southern Region and the Southern Research Station, a decision was made to examine some of the most intact progeny tests as a part of a broader project on shortleaf pine genetics in the Arkansas region.
In 2018, the 2013 condition assessment was used as a starting point to place the progeny tests into one of four categories, depending largely on 2013 live tree stocking levels for the surviving replicates. These four categories were: (1) preferred (trees tagged and all replicates fully stocked, i.e., at least 9.3 m2/ha of live basal area); (2) acceptable (most tree tags present and at least four replicates fully stocked); (3) marginal (many tags were missing and/or fewer than three replicates fully stocked); and (4) unacceptable (tests too damaged or destroyed to be viable). Based on these criteria, we selected 39 progeny tests (20 from the Ouachita National Forest and 19 from the Ozark National Forest) for further consideration. The progeny tests on the Ouachita National Forest were in somewhat better condition, with 10, 9, and 1 tests representing preferred, acceptable and marginal categories, respectively, compared to 0, 15, and 4 tests on the Ozark National Forest. After this classification, we visited the 34 preferred and acceptable (as suggested by the 2013 stocking levels) tests in 2018 and 2019 to determine if they remained suitable for re-measurement (e.g., still fully stocked; tags present and legible).
Time and resource constraints during 2018–2019 limited our field sampling to 15 shortleaf pine progeny tests—7 from the EOU, 4 from the WOU, and 4 from the OZ seed sources (Figure 1, Table 1). These progeny tests had been established on moderate-quality sites (50-year site indices of 15.2 to 21.3 m; [34]) between 1978 and 1988, and hence were between 31 and 40 years old when remeasured in 2018 or 2019 (Table 1). For the current field sampling effort, shortleaf pine families were identified based on tags placed beside them during planting and their location on their respective deployment maps. All 10 trees in a row plot were designated and counted as either alive or dead. This produced a sample of nearly 11,000 live shortleaf pines in these progeny tests, ranging from 437 to 1086 trees per test location (Table 1). A total of 345 full-sibling families were remeasured; of these, 249 were found in only one progeny test (i.e., unique families), 88 were found in two progeny tests (i.e., shared-1 families), and only 8 were found in three or more progeny tests (i.e., shared-2 families) (Table 2). The number of unique families per test location ranged from 1 to 30, the majority of which appeared in the EOU region’s tests (112 families), followed by the OZ (82 families) and WOU (55 families) tests.
Diameter at breast height (d.b.h.) was measured (to the nearest 0.1 cm) on all live trees. Two of these trees per 10-tree plot were randomly selected for total tree height (to the nearest 0.1 m) measurement. If a dead or missing tree was encountered, the next live tree would be chosen for both d.b.h. and height measurements. A simple condition/status assessment was taken on both live (e.g., storm damage, fork defect, and insect damage) and dead trees (e.g., dead standing, dead and down, and dead missing). For storm damage, live trees were categorized as either injured in the past (for example, trees with a “crook” in the upper stem; see Figure 2) or apparently undamaged. For each test, we also determined planting date and age (difference between establishment year and sampling year of a test).
Note that the prior studies of [17,26,32] were based on 30 of the shortleaf pine progeny tests from the original 84 tests on the Ouachita and Ozark-St. Francis National Forests; we do not know if the 15 progeny tests we studied included any from those sampled by these earlier researchers. Further, we did not have a balanced sample of families for analysis, partly because we deliberately chose a subset of progeny tests that were well-stocked to represent the best growth and yield information, and partly because family representation was not uniform across the progeny test sites. Due to these conditions, we chose to analyze families as a random effect and tested for the significance of the family variance component instead of as a fixed effect with the focus on comparisons of family means (see Section 2.5).

2.5. Data Analysis

To investigate the sources of variance in the traits measured (i.e., d.b.h., height, and survival) in these progeny tests, linear mixed model analyses (Proc Mixed, SAS v9.4, [35]) were used (model 1). We used age-adjusted (base age 35 years) values for d.b.h and height by multiplying both d.b.h. and height variables by the ratio of base age (35 years) to test age, which replaced the need for using age in the model as a separate independent variable. For survival, we used a binary code to reflect the tree’s status (0 = dead or 1 = alive) when sampled in 2018 and 2019. In addition to Proc Mixed, we used Proc Glimmix (SAS v9.4) for survival, specifying a binary distribution and the same model (1) as for the growth traits. The independent variables included in the model were full-sibling family (F), test site (S), replication (R), interactions with family, and residual ( ε ) using the following statistical model:
Y i j k l = µ + S i + R ( S ) i ( j ) + F k + S F i k + F R   ( S ) k i ( j ) + ε i j k l
where Y represents d.b.h., height, or survival; μ was the overall mean; and all other effects were considered random. Only the 96 families that were planted on multiple test sites (i.e., shared-1 and shared-2 families) were included in this analysis because we are specifically interested in family and family × test site variation in these traits.
Since less than a third of the families (96 of 345) were tested on more than one test sites (see model 1) we determined it would be informative to use all families at each test site to look at trends in the family variance of the measured traits on a test-by-test basis (model 2). To do this, we conducted linear mixed model analyses (Proc Mixed, SAS v9.4) using the following statistical model:
  Y i j k = µ + R i + F j + R F i j + ε i j k
where Y represents d.b.h., height, or survival; μ was the overall mean; and all other effects were random (as above). All 345 families were included in the analysis, with from 19 to 36 families planted on the 15 test sites.
The effects of seed source on the measured variables (e.g., d.b.h., height, and survival) across all 15 tests were assessed (model 3) using linear mixed model analyses (SAS Proc Mixed v 9.4). The independent variables included in the model were provenance, i.e., seed sources (P), test site (S), replication (R), and the interactions with provenance and error ( ε ) using the following statistical model:
Y i j k l = µ + S i + R   ( S ) j ( i ) + P k + P S i k + P R   ( S ) k j ( i ) + ε i j k l
where Y represents d.b.h., height, or survival; S was test site; μ was the overall mean; Provenance was set as a fixed effect; and all other effects were considered random. A total of 285 families that could be assigned to a given seed source (i.e., both female and male parents from the same source) were included in this analysis (93 in EOU, 128 in WOU, and 64 in OZ), providing three seed sources for the analysis (EE = EOU × EOU, WW = WOU × WOU, and OO = OZ × OZ crosses). The values for d.b.h and height were adjusted with the base age of 35 as described above.
Additionally, we conducted linear mixed model analyses (model 4) to compare intra- vs. inter-provenance families (provenance types) across all 15 tests using the following statistical model:
  Y i j k l = µ + S   i + R   ( S ) j ( i ) + T + S T i k + T R   ( S ) k j ( i ) + ε i j k l
where provenance type (T) was set as a fixed effect, such that comparisons were made between intra-provenance (EE + WW + OO) and inter-provenance (EW + EO + WO) families, and all other effects were random (as above). Based on our selection criteria (i.e., parents from the same sources for intra-provenance and parents from different sources for inter-provenance), all 345 families (285 families intra-provenance and 60 families inter-provenance) were included in this analysis. The provenance type effects were not significant (p > 0.05) for any of the traits and thus were not considered further.
As a measure of the relative importance of genetic and environmental variation for the measured traits in these progeny tests, we estimated heritabilities—proportion of genetic to phenotypic variance—based on individual trees and full-sibling family means. The individual tree heritability (model 5) is based on the traits’ covariance among full-siblings and is thus biased upward from the narrow-sense heritability by the presence of dominance genetic variance. Family mean heritability (model 6) provides some insight into the value of family information in evaluating a tree’s genetic value. Breeding value estimates (additive genetic value of a tree), which rely on a clean estimate of the additive genetic variance and are needed for making selections in an open-pollinated species, such as shortleaf pine, were beyond the scope of this study and will be obtained and reported in a separate analysis. The general statistical model of estimating individual tree heritability (h2) is as follows:
  h 2 i = 2 σ 2 f ( σ 2 f + σ 2 s f + σ 2 r f ( s ) + σ 2 ε )
where the numerator is an estimate of the additive genetic variance and the denominator is an estimate of the phenotypic variance [36]. In this case, variances ( σ 2 ) come from model (1) where σ 2 f is family variance, σ 2 sf is test × family interaction variance, σ 2 rf(s) is replication × family within-test interaction variation, and σ 2 ε is the residual error variance. For family mean heritability (h2FS), the following statistical model was used:
  h F S 2 = σ 2 f / [ σ 2 f + ( σ 2 s f ) / e + ( σ 2 r f ( s ) ) / r + ( σ 2 e ) / n ]
where the variances are the same as in (5), from model (1), and the coefficients from the expected means squares (provided by SAS) of the analysis as follows: e = number of test sites (~2.6); r = number of replications × number of test sites (~10.4); and n = number of trees per family (~20.3 for height and survival and ~40.9 for d.b.h.). Standard errors of the heritability estimates were calculated using the Delta method [37].

3. Results and Discussion

3.1. Tree Size Differences

Similar tree sizes were observed among the three family types (i.e., unique and the two shared categories)—mean d.b.h. and height ranged between 23.1 and 24.4 cm (standard deviations = 3.9 to 5.0 cm) and between 17.4 and 18.7 m (standard deviations = 1.7 to 2.9 m), respectively (Table 2). In addition, tree size varied noticeably within a family for all family types—ranges of d.b.h. and height varied from 7.8 to 44.6 cm and from 8.8 to 30.5 m, respectively (Table 2). Ranges of d.b.h. and height appeared to be wider for all families compared to either the unique or shared families alone, as expected. When considering the eight families found in at least three tests (shared-2), considerable variation in tree size was observed, with mean d.b.h. and height ranging between 21.8 and 28.1 cm (standard deviations = 4.2 to 5.8 cm) and between 17.7 and 19.9 m (standard deviations = 2.7 to 3.1 m), respectively (Table 3). Within-family variation of tree size was also observed—ranges of d.b.h. and height varied from 9.4 to 42.7 cm and from 10.4 to 27.4 m, respectively, for these eight families (Table 3).
Full-sibling family was the most important predictor in explaining variation in tree size across test sites (model 1). Family variances were highly significant (p < 0.001) for both d.b.h. and height (Table 4), indicating large family differences for tree size. This is substantiated by the fact that family × test interaction term was non-significant (p > 0.05) for both d.b.h. and height, suggesting that families performed consistently across test sites. When considering individual test sites (model 2), family was also the most significant (p < 0.05) predictor for both d.b.h. and height (Table 5). In addition, replication for d.b.h. and height and replication × family interaction term for d.b.h. were non-significant (p > 0.05) for the majority of test sites, indicating relatively strong family (i.e., genetic) variance relative to environmental variance (Table 5). However, the replication × family interaction term for height was significant (p < 0.05) for several tests (Table 5), suggesting that family performances in these tests were largely dependent upon environmental variation. These results indicate a wide range in family performance within the sampled seed sources across the sampled test sites, suggesting an opportunity to improve the current seed orchards [17,38] based on the progeny test information. Site variances were significant for both d.b.h. and height across test sites (p < 0.001, Table 4); however, test × family interaction term was non-significant (p > 0.05) so genotype-related variation appeared to be independent of the environmental variation. This suggests that shortleaf pine populations in our study system are broadly adapted.
Consistent with our results, two prior studies conducted at age 5 and 10, respectively, found a significant (p < 0.05) effect of family on d.b.h. [17] and tree height [26], suggesting that the family differences for tree size at early ages (between 5 and 10 years) in these progeny tests may have been sustained through time. Not surprisingly, tree size increased appreciably when compared to earlier measurements of the general populations of progeny tests (e.g., d.b.h. averaged 10.3 cm at age 10 across the seed sources [17], but it averaged 23.6 cm across all our tested families in this study). Notably, we found a significant seed source effect for d.b.h. (p = 0.05; model 3, Table 6) but no such effect for height between sources (p = 0.64). The EOU seed source exhibited the best performance in terms of mean d.b.h. (24.6 cm) while the OZ seed source demonstrated the poorest performance (22.4 cm mean d.b.h.) (Table 7).
Although modest, the variation in d.b.h among seed sources is meaningful in that they parallel certain environmental gradients (e.g., temperature and precipitation regimes). For example, we expected the EOU (southern) seed source to grow faster than the OZ (northern) seed source in part because the Ozark-St. Francis National Forest has more severe summer droughts producing a more conservative seed source (OZ) with respect to drought response than the eastern side of the Ouachita (EOU) [26]. This is consistent with past studies in southern pines which have shown that seed sources from warmer climates tend to grow faster than those from local sources if their climates do not differ greatly [17,21,39,40,41]. In contrast, east–west transfers are generally limited by the amount of rainfall. According to [38], eastern sources of southern pines should not be planted too far in the west due to the increased risk of drought. In loblolly pine, this is partly due to the eastern sources being physiologically intolerant to droughts due to a lack of adaptation [42]. As differences of performance traits between the EOU and WOU seed sources were small, we believe that east–west transfers within the range of these progeny tests should be successful (see also [17]).

3.2. Survival

At ages 5 and 10, mean seedling survival rates were approximately 91 and 72%, respectively, for different subsets of these Ouachita and Ozark-St. Francis National Forest shortleaf pine progeny tests [17,26]. Given 25 to 30 years of additional self-thinning and periodic mortality events, we expected a considerably lower level of survival by 2018–2019, and on average, only 52% (range: 36 to 70%) of the shortleaf pine in our 345 families from the 15 sampled progeny tests survived (Table 1). For the eight families that were found in three or more progeny tests, mean family survival was comparable to the 345 families, averaging about 51% (ranging between approximately 46 and 57%) (Table 3).
Statistically, family variances were small and non-significant (p > 0.05) for survival across test sites (model 1, Table 4). However, family variances were broadly significant (p < 0.05) for survival when considering individual tests (model 2, Table 5), suggesting that early survival differences between families may have persisted for decades after establishment. This result corroborates a different subset of these tests at age 10 [17], who reported a significant effect of family on survival by test site. Seed source area also had a significant (p < 0.05) impact on survival (model 3, Table 6). In particular, families planted in the Ozark-St. Francis National Forest progeny tests had the best survival (57%), followed by the WOU (51%) and EOU (50%) seed sources (Table 6 and Table 7). This finding contrasts with the work of [17,26], both of whom found no impact of seed source area on survival. Hence, the survival differences between seed source areas became evident as these progeny plantings matured.
While further investigation is needed to confirm this, both exogenous and endogenous factors were likely to contribute to family performance differences in survival. Over the decades, these progeny tests were impacted by several natural disturbances, including diseases, insects, fires, multiple storms (ice and wind), and droughts. Some of these exogenous events can be linked directly to genetic differences. For instance, some families can more readily survive extreme droughts due to better adaptation(s) [43]. The higher survival in the OZ seed source could be related to those families having better adaptations to summer drought [17]. However, storm damage may be as influential as drought in terms of survival. Parts of Arkansas have been impacted by multiple ice and wind storms over the last 40 years, some of which have produced significant levels of damage and mortality in planted pine [44]. These storm events tend to be geographically variable in both frequency and intensity, making their impact on survival in these progeny tests hard to determine. In our limited assessment (storm damaged or not) of these remeasured shortleaf pine, we found about half of those on the Ouachita showed evidence (Figure 2) of injury, with the EOU test sites having the highest proportion (71.2%) of impacted trees, followed by the WOU (58.3%) and OZ (5.8%) seed source areas (Table 1). Due to the pronounced differences in storm damage between the Ouachita and Ozark test sites, which corroborated well with the survival ranking cited above, it is likely that our survival observations in these progeny tests have been affected.

3.3. Trait Heritability

For both the individual tree (model 5) and full-sibling family (model 6) mean estimates, heritability was larger for d.b.h. (0.15 and 0.72, respectively) compared to height (0.09 and 0.41, respectively) (Table 8). Heritability for d.b.h was moderate in scale with low standard errors (±0.03 to ± 0.05) and it was somewhat lower for height with larger standard errors (±0.04 to ±0.12). The larger standard errors for heritability of height is expected given the fewer trees measured for height than for d.b.h. Survival had the lowest heritability on the individual tree basis (0.07) and modest (0.52) for full-sibling family means (Table 8). It appeared that survival in this study, by this age (31 to 40 years), was strongly driven by test and replications-within-test variation (Table 3).
Family heritability estimates for all performance traits (d.b.h., height, and survival) in these progeny tests were moderate in scale (i.e., >0.4), suggesting the potential for parental selection within the sampled first-generation population. However, our purpose here was not to use these heritability values to estimate genetic gain from selection in any specific way. Instead, we calculated heritability as a representation of the relative genotypic to phenotypic variation expressed in the measured growth and survival traits. Unbiased narrow-sense heritability estimates for these traits in this population as well as parental and individual tree breeding values require a diallel genetic analysis to cleanly estimate the additive genetic variance or, specifically in this case (diallel cross), the general combining ability [36]. As noted above, this is beyond the scope of the present report, but it is the subject of an ongoing analysis.

4. Management Implications

Given that recommendations for seed sources of shortleaf pine have been somewhat inconsistent over the years and more work is needed to identify tree improvement opportunities, any opportunity to develop new sources of information to help restore this species of conservation need should be embraced [11]. To this end, we found that the remaining, well-stocked shortleaf pine progeny tests on the Ouachita and Ozark National Forests retain useful information on the relative importance of genetic and environmental variation based on their growth and survival performance over several decades (up to 41 years from planting). This information can be adapted to advise managers about the potential utility of selection for future tree improvement activities, which should have implications for shortleaf pine timber production and restoration efforts. For example, these Arkansas shortleaf pine progeny tests could help translate taxon-specific genetic information into seed-collection zone evaluations [45].
The insights provided by this progeny test reexamination also include the genetic (seed sources and full-sib family) and environmental (test and test × family interaction) variation associated with tree size and survival. For instance, because family variances were significant for d.b.h and height and family heritability was moderate, managers can improve the current seed orchard or develop new orchards through selection in this population. The selection process for restoration planting should focus on identifying parents and individuals from a range of good-performing families to maintain genetic diversity [27]. The limited differences in performance by seed source suggests that our shortleaf pine populations were broadly adapted in this region, as genotype × environmental interaction (i.e., family × test) variances were not significant.
However, we suggest caution when interpreting the observed variation in size- or survival-related traits between seed sources. One should expect some of this variation to occur as it parallels certain environmental (e.g., precipitation and elevation) gradients, although these pines came from a relatively small portion of the species’ range. Geographic variation will be much greater among sources collected from the entire species range than from these more limited three seed sources within the national forests in Arkansas and Oklahoma [46]. While there is some spatial separation between the seed sources, the distances are not great enough to provide a barrier for gene flow by virtue of pollen flight, as suggested between the EOU and WOU seed sources [21,26]. Further, the earlier designation of three seed sources was not based on any a priori provenance test data (e.g., [23]) or predefined environmental parameters [45], nor should this division confer ecotype status since little soil-related ecotypic or photoperiodic differentiation could be expected among these putative seed sources. Hence, we do not think it is necessary to maintain these three seed sources as separate breeding populations as suggested by [17]; rather, as recommended by [47], we suggest treating this as one breeding population. Given the additional logistical challenge of maintaining multiple breeding populations under current resource constraints, shortleaf pine improvement for growth and yield should focus on identifying individuals from the best families (as determined by testing on multiple test sites) from the entire Ouachita–Ozark region.

5. Conclusions

Results from the diallel genetic analysis (discussed above) should help tree improvement specialists and seed orchard managers determine which parents and progeny to select for improving the current seed orchard or developing new, next-generation orchards. Even with our limited subset of 15 shortleaf pine progeny tests, we anticipate that this information on trait heritability in rotation-aged progeny tests may encourage managers to re-evaluate their mature-aged progeny tests for additional opportunities in tree improvement. Ideally, tree improvement programs for shortleaf pine should develop genetically diverse families capable of surviving or being productive in the face of emerging environmental stressors. The selection of families with differential performance can provide additional benefits in terms of maintaining genetic diversity, which could be useful for enhancing resilience under changing climate through maintaining genetic diversity [18]. Our finding that individual tree heritability was significant for both d.b.h and height suggests that selection will be effective; thus, a wide range of families can be retained to maintain genetic diversity while still providing significant improvement in growth traits. For timber production purposes, mass-controlled pollinations to reproduce the best full-sibling families could be contemplated, but additional information would be needed on a broader array of full-sibling families tested over multiple test sites. Hence, we recommend expanding data collection and analysis to cover all the regions tested by the Southern Region.
We recommend that greater collaboration between researchers and managers in different regions should arise to further shortleaf pine’s genetic testing, seed orchard development, and other needed changes. Indeed, the adaptation of existing progeny tests can be used to guide the restoration efforts of shortleaf pine. This may be particularly desirable as new DNA marker technology sheds further light on the genetic variation in different seed sources and parents or families, allowing geneticists to better predict which sources would be appropriate to use in restoration plantings. For instance, if seed sources demonstrate high genetic differences, they may be considered as separate gene pools between which gene migration is marginal, and hence restoration efforts may be based on planting material from certain populations or seed-collection zones (e.g., [45]). DNA-assisted selection processes could also be of utility to assess and address the threats currently putting shortleaf pine at risk of losing genetic integrity [10,11]. Such considerations are important, as emerging factors can further exacerbate family-based performances. As an example, climate change is expected to lead to increasingly frequent drought events in the southern United States, which affect survival as a result of changes in environmental conditions [11]. Likewise, current regional silvicultural practices (e.g., the widespread planting of loblolly, reduction of the use of prescribed fire) likely have contributed to increases in the rate of hybridization between loblolly and shortleaf pine [12,18].

Author Contributions

Conceptualization, D.C.B. and B.S.C.; methodology, S.M.H., D.C.B. and B.S.C.; data collection, S.M.H. and V.L.M.; data curation, S.M.H., V.L.M. and C.D.N.; data analysis, S.M.H., C.C.P. and C.D.N.; writing, S.M.H., D.C.B. and C.D.N.; funding acquisition, D.C.B. All authors have read and agreed to the published version of the manuscript.

Funding

This research was funded by the USDA Forest Service and supported through the Oak Ridge Institute for Science and Education (ORISE).

Data Availability Statement

The data presented in this study are available on request from the corresponding author.

Acknowledgments

The authors would like to thank Austin Heffington and Ben Rowland (both of the Mount Ida Seed Orchard, Caddo-Womble Ranger District, Ouachita National Forest), as well as other USFS field personnel for their assistance with field work related to shortleaf pine progeny test re-measurements. Fikret Isik (North Carolina State University) provided valuable assistance in some of the analyses. We are also thankful to James Warren (Northern Research Station) for his assistance with data management and John Blanton (USFS Contractor and Certified Forest Silviculturist) for his 2013 assessment survey on the condition of these progeny tests. Finally, we are indebted to the Oak Ridge Institute for Science and Education (ORISE) for their logistical assistance. This article was written in part by federal employees on official time and is therefore in the public domain. The findings and conclusions in this publication are those of the authors and should not be construed to represent an official USDA, Forest Service, or US Government determination or policy.

Conflicts of Interest

The authors declare that there is no conflict of interest.

References

  1. Little, E.L., Jr. Atlas of United States Trees. Volume 1. Conifers and Important Hardwoods; Miscellaneous Publication 1146; U.S. Department of Agriculture: Washington, DC, USA, 1971; p. 9.
  2. Sutter, R. Ecological and Social History of Shortleaf Pine; Shortleaf Pine Initiative: Lexington, KY, USA, 2019; Available online: http://shortleafpine.net/why-shortleaf/history (accessed on 16 December 2019).
  3. Mohr, C.T.; Roth, F. The Timber Pines of the Southern United States; Bulletin 13 (Revised); USDA Division of Forestry: Washington, DC, USA, 1897; p. 176.
  4. Mattoon, W.R. The Life History of Shortleaf Pine; Bulletin 244; USDA Forest Service: Washington, DC, USA, 1915; p. 46.
  5. Pickens, B. Silvics of Shortleaf Pine; Shortleaf Pine Initiative: Lexington, KY, USA, 2019; Available online: http://shortleafpine.net/why-shortleaf/silvics/silvics-of-shortleaf-pine/ (accessed on 16 December 2019).
  6. Walker, L.C.; Wiant, H.V. Silviculture of Shortleaf Pine; School of Forestry Bulletin 9; Stephen F. Austin State College: Nacogdoches, TX, USA, 1966; p. 60. [Google Scholar]
  7. Lawson, E.R. Pinus echinata Mill. Shortleaf pine. In Silvics of North America. Volume 1. Conifers; Agriculture Handbook 654; Burns, R.M., Honkala, B.H., Eds.; USDA Forest Service: Washington, DC, USA, 1990; pp. 316–326. [Google Scholar]
  8. Studyvin, C.; Gwaze, D. Genetic Improvement of Shortleaf Pine on the Mark Twain, Ouachita, and Ozark National Forests; General Technical Report NRS-P-15; USDA Forest Service, Northern Research Station: Newtown Square, PA, USA, 2007; pp. 84–88.
  9. Oswalt, C.M. Spatial and temporal trends of the shortleaf pine resource in the eastern United States. In Proceedings of the Shortleaf Pine Conference: East Meets West; Special Report 11; Kush, J., Barlow, R.J., Gilbert, J.C., Eds.; Alabama Agricultural Experiment Station: Auburn, AL, USA, 2012; pp. 33–37. [Google Scholar]
  10. Stewart, J.F.; Tauer, C.G.; Guldin, J.M.; Nelson, C.D. Hybridization in naturally regenerated shortleaf pine near stands of artificially regenerated stands of loblolly pine. South. J. Appl. For. 2013, 37, 102–107. [Google Scholar] [CrossRef]
  11. Stewart, J.F.; Will, R.E.; Robertson, K.M.; Nelson, C.D. Frequent fire protects shortleaf pine (Pinus echinata) from introgression by loblolly pine (P. taeda). Conserv. Genet. 2015, 16, 491–495. [Google Scholar] [CrossRef]
  12. Tauer, C.G.; Stewart, J.F.; Will, R.E.; Lilly, C.J.; Guldin, J.M.; Nelson, C.D. Hybridization leads to loss of genetic integrity in shortleaf pine: Unexpected consequences of pine management and fire suppression. J. For. 2012, 110, 216–224. [Google Scholar] [CrossRef]
  13. Rosson, J.F. Forests of Arkansas, 2015; Resource Update FS-81; USDA Forest Service: Washington, DC, USA, 2016; p. 4.
  14. Bragg, D.C. Silviculture’s impact on the historical shortleaf component of pine forests in the Upper West Gulf Coastal Plain. In Proceedings of the 18th Biennial Southern Silvicultural Research Conference, Knoxville, TN, USA, 2–5 March 2015; Schweitzer, C.J., Clatterbuck, W.K., Oswalt, C.M., Eds.; e-Gen. Tech. Rep. SRS-212. USDA Forest Service, Southern Research Station: Asheville, NC, USA, 2016; pp. 432–443. [Google Scholar]
  15. Anderson, M.L.; Hayes, P.D.; Keyser, C.M.; Lituma, R.D.; Sutter, R.; Zollner, D. Shortleaf Pine Restoration Plan: Restoring an American Forest Legacy; Shortleaf Pine Initiative: Lexington, KY, USA, 2016; Available online: http://shortleafpine.net/tools-and-resources/restoration-plan/shortleaf-pine-restoration-plan (accessed on 21 February 2020).
  16. Guldin, J.M. Restoration and Management of Shortleaf Pine in Pure and Mixed Stands—Science, Empirical Observation, and the Wishful Application of Generalities; General Technical Report NRS-P-15; USDA Forest Service: Newtown Square, PA, USA, 2007; pp. 47–57.
  17. Studyvin, C.; Gwaze, D. Differences among Shortleaf Pine Seed Sources on the Ozark and Ouachita National Forest at Age Ten; General Technical Report SRS-156; USDA Forest Service, Southern Research Station: Asheville, NC, USA, 2012; pp. 329–333.
  18. Crane, B.; Hipkins, V.; Josserand, S.; Echt, C. Genetic integrity of longleaf and shortleaf pine seed orchards and seed banks. Tree Plant. Notes 2019, 62, 95–103. [Google Scholar]
  19. Guldin, J.M. Silvicultural options in forests of the southern United States under changing climate conditions. New For. 2019, 50, 71–87. [Google Scholar] [CrossRef]
  20. Kitchens, R.N. Trends in Shortleaf Pine Tree Improvement; Arkansas Cooperative Extension Service, University of Arkansas at Monticello: Monticello, AR, USA, 1986; pp. 89–100. [Google Scholar]
  21. Schmidtling, R.C. Southern Pine Seed Sources; General Technical Report SRS-44; USDA Forest Service: Asheville, NC, USA, 2001; 25p.
  22. Stewart, J.F.; Will, R.E.; Crane, B.S.; Nelson, C.D. The genetics of shortleaf pine (Pinus echinata Mill.) with implications for restoration and management. Tree Genet. Genomes 2016, 12, 15. [Google Scholar] [CrossRef]
  23. Wells, O.O.; Wakeley, P.C. Variation in shortleaf pine from several geographic sources. For. Sci. 1970, 16, 415–423. [Google Scholar]
  24. Bragg, D.C.; Hossain, S.M. Revisiting shortleaf outplantings of the Southwide Pine Seed Source Study on the Crossett Experimental Forest. In Proceedings of the 20th Biennial Southern Silvicultural Research Conference, Shreveport, LA, USA, 12–14 March 2019; Bragg, D.C., Koerth, N.E., Holley, A.G., Eds.; Gen. Tech. Rep. SRS-253. USDA Forest Service, Southern Research Station: Asheville, NC, USA, 2020; pp. 318–324. [Google Scholar]
  25. Zarnoch, S.J.; Ruehle, J.L.; Belanger, R.P.; Marx, D.H.; Bryan, W.C. Growth and Crown Vigor of 25-Year-Old Shortleaf Pine Progenies on a Littleleaf Disease Site; Research Paper SE-289; USDA Forest Service, Southeastern Forest Experiment Station: Asheville, NC, USA, 1994; 12p.
  26. La Farge, T. Are there significant differences among the three shortleaf pine seed sources on the National Forests in Arkansas? In Proceedings of the 1st Northern Forest Genetics Association Conference, Burlington, VT, USA, 23–25 July 1991; DeHayes, D.H., Hawley, G.J., Hanover, J.W., Eds.; The University of Vermont: Burlington, VT, USA, 1991; pp. 40–47. [Google Scholar]
  27. Crane, B. Shortleaf Pine Genetic Resources to Support Restoration in the Southern Region; Shortleaf Pine Workshop: Ecology and Management for Multiple Objectives in the Interior Highlands, Online Webinar. 2014. Available online: http://shortleafpine.net/media/videos-and-webinars/webinar (accessed on 15 April 2021).
  28. Crane, B. From tree improvement to species improvement: Restoration and conservation efforts on the Forest Service’s Southern National Forests. In Proceedings of the 28th Southern Forest Tree Improvement Conference, Raleigh, NC, USA, 21–23 June 2005; North Carolina State University: Raleigh, NC, USA, 2005; p. 168. [Google Scholar]
  29. Woods, A.J.; Foti, T.L.; Chapman, S.S.; Omernik, J.M.; Wise, J.A.; Murray, E.O.; Prior, W.L.; Pagan, J.B.; Comstock, J.A., Jr.; Radford, M. Ecoregions of Arkansas (Color Poster with Map, Descriptive Text, Summary Tables, and Photographs); U.S. Geological Survey (map scale 1:1,000,000): Reston, VA, USA, 2004.
  30. PRISM Climate Group. 30-yr Normal Mean Temperature [Map]: Annual (Period: 1981–2010); PRISM Climate Group: Oregon State University, Corvallis, OR, USA, 2013; Available online: http://www.prism.oregonstate.edu/normals/ (accessed on 9 May 2019).
  31. Pugh, A.L.; Westerman, D.A. Mean Annual, Seasonal, and Monthly Precipitation and Runoff in Arkansas, 1951–2011; Science Investigation Report 2014-5006; U.S. Department of the Interior Geological Survey: Reston, VA, USA, 2014; p. 40.
  32. Rowland, B.; Ouachita National Forest, Mount Ida, AR, USA. Personal communication, 2019.
  33. La Farge, T.; Gates, J.E. The use of best linear prediction to obtain breeding values for height and survival in 37 full-sib progeny tests of shortleaf pine (Pinus echinata Mill.) on the Ouachita and Ozark-St. Francis National Forests. In Proceedings of the 21st Southern Forest Tree Improvement Conference, Knoxville, TN, USA, 17–20 June 1991; Tennessee Division of Forestry: Knoxville, TN, USA, 1991; pp. 144–151. [Google Scholar]
  34. Web Soil Survey. Natural Resources; Web Soil Survey: Fayetteville, AR, USA, 2020. Available online: https://websoilsurvey.sc.egov.usda.gov/App/WebSoilSurvey.aspx (accessed on 21 January 2020).
  35. SAS Institute Inc. SAS/STAT User’s Guide, Version 9.4 ed; SAS Institute Inc.: Cary, NC, USA, 2018; p. 846. [Google Scholar]
  36. Isik, F.; Holland, J.; Maltecca, C. Genetic Data Analysis for Plant and Animal Breeding; Springer: Cham, Switzerland, 2017; p. 400. [Google Scholar] [CrossRef]
  37. Lynch, M.; Walsh, B. Genetics and Analysis of Quantitative Traits, 1st ed.; Sinauer Associates, Inc.: Sunderland, MA, USA, 1998. [Google Scholar]
  38. Gwaze, D.P.; Melick, R.; Studyvin, C.; Coggeshall, M. Genetic control of growth traits in shortleaf pine in Missouri. South. J. Appl. For. 2005, 29, 2000–2004. [Google Scholar] [CrossRef] [Green Version]
  39. Schmidtling, R.C. Seed Transfer and Genecology in Shortleaf Pine; General Technical Report SRS-1; USDA Forest Service: Asheville, NC, USA, 1995; pp. 373–378.
  40. Schmidtling, R.C. Determining seed transfer guidelines for southern pines. In National Proceedings: Forest and Conservation Nursery Associations-2002; Proceedings RMRS-P-28; Riley, L.E., Dumroese, R.K., Landis, T.D., Tech Cords, Eds.; USDA Forest Service, Rocky Mountain Research Station: Ogden, UT, USA, 2003; pp. 8–11. [Google Scholar]
  41. McCullough, R.B. Phenotypic Variation and Relationships of Several Variables in Shortleaf Pine in Oklahoma. Doctoral Thesis, Oklahoma State University, Stillwater, OK, USA, 1972; p. 53.
  42. Jayawickrama, K.J.S.; McKeand, S.E.; Jett, J.B. Phenological variation in height and diameter growth in provenances and families of loblolly pine. New For. 1998, 16, 11–25. [Google Scholar] [CrossRef]
  43. Fox, T.R.; Jokela, E.J.; Allen, H.L. The development of pine plantation silviculture in the southern United States. J. For. 2007, 105, 337–347. [Google Scholar]
  44. Bragg, D.C.; Shelton, M.G.; Zeide, B. Impacts and management implications of ice storms on forests in the southern United States. For. Ecol. Manag. 2003, 186, 99–123. [Google Scholar] [CrossRef]
  45. Pike, C.; Potter, K.M.; Berrang, P.; Crane, B.; Baggs, J.; Leites, L.; Luther, T. New seed-collection zones for the Eastern United States: The Eastern Seed Zone Forum. J. For. 2020, 118, 444–451. [Google Scholar] [CrossRef] [Green Version]
  46. Bridgewater, F.S., Jr. Genotypic Variation among Shortleaf Pine Seedlings within Oklahoma. Doctoral Thesis, Oklahoma State University, Stillwater, OK, USA, 1969; p. 52. [Google Scholar]
  47. Wells, O.O.; McConnell, J.L. Breeding populations in the R-8 tree improvement program. In Progeny Testing: Proceedings of the a Servicewide Genetics Workshop, Charleston, SC, USA, 5–9 December 1983; Miller, R., Ed.; USDA Forest Service: Washington, DC, USA, 1984; pp. 61–67. Available online: https://www.fs.usda.gov/treesearch/pubs/55399 (accessed on 16 December 2019).
Figure 1. Fifteen shortleaf pine progeny test plantations (circles in black) sampled in the East Ouachita (grey background), West Ouachita (black background), and Ozark (light grey background) seed source regions. The star symbol denotes the location of the Mount Ida Seed Orchard in the Ouachita National Forest.
Forests 12 00953 g001
Figure 2. Shortleaf pine with (probably ice) storm damage in a progeny test in the Ouachita National Forest. The main leader in these mature trees was broken, likely by the same event, years earlier, resulting in a “crook” bole and spike knot (arrows). Photograph by Shaik Hossain.
Forests 12 00953 g002
Table 1. Information on test sites, families, and trees by test site in the shortleaf pine progeny plantations on the East Ouachita (EOU), West Ouachita (WOU), and Ozark (OZ) seed source regions.
Test #Ranger DistrictSource RegionSI50
(m) a
-------Families-------Date Planted------------------------As Measured in 2018–2019------------------------
Unique bSharedAge
(Years) c
% Storm
Damage d
Live #
of Trees
Percent Alive
21OdenEOU21.315819843488.866049.2
29OdenEOU19.824319853365.977258.9
48OdenEOU19.826619873188.370647.7
1WombleEOU18.271219784038.543748
5WombleEOU21.328619813875.777858.3
19WombleEOU21.312719843476.162536.3
31WombleEOU21.3111819853365.357851.7
25Cold SpringsWOU19.825919843568.9108663.8
6MenaWOU19.832819813893.369143.1
10MenaWOU21.3211619823734.272453.2
38MenaWOU19.861519863336.956346.5
14Big PineyOZ15.21515198435875547.1
28Boston MountainsOZ15.22791987328.887154.4
33Mount MagazineOZ18.210121988314.194756
32Pleasant HillOZ18.23071988312.275569.9
Averages 50.4 52.3
Totals 24996 11,058
a SI50 = site index (dominant and codominant total tree height (in m) at base age 50 years). b Unique families were planted on only one progeny test site, while shared families were planted on two or more test sites. c Age when remeasured in 2018 or 2019. d Percent of live trees with visible storm (probably ice) damage.
Table 2. Statistics on the shortleaf pine family types remeasured in 2018–2019.
Family Type aNumber of Families---Live Trees-------------d.b.h. (cm)---------------------Total Height (m)---------
No.Percent bMean (Min.–Max.)CVMean (Min.–Max.)CV
Unique249559355.923.1 (7.80–43.7)16.717.4 (9.14–24.9)9.88
Shared-188363049.524.4 (8.63–44.6)18.318.7 (8.83–30.5)12.5
Shared-28183551.623.5 (9.39–42.7)21.318.3 (10.4–27.4)15.7
All3451105852.323.6 (7.80–44.6)18.818.1 (8.83–30.5)12.8
a Unique families were planted on only one progeny test site, shared-1 families were planted on two test sites, shared-2 families were planted on three or more test sites, and all families included both unique and shared families. b Percent of planted trees still alive in 2018 or 2019. CV = Coefficient of variation (%).
Table 3. Statistics on the shortleaf pine families remeasured on three or more of the progeny tests visited in 2018–2019.
Family aParent Seed Source(s)No. of Tests---Live Trees------------d.b.h. (cm)--------------Total Height (m)-----
No.Percent bMean (Min.–Max.)CVMean (Min.–Max.)CV
103_201EOU1329253.124.3 (10.4–40.6)18.318.7 (10.4–25.9)16.0
115_312EOU & WOU1430252.723.1 (11.6–34.1)18.217.8 (10.9–25.6)15.8
120_333EOU921157.424.1 (10.2–35.8)20.817.8 (11.5–24.4)16.8
135_233EOU34736.628.1 (16.5–39.1)20.819.9 (14.6–25.1)15.3
322_901EOU & WOU1427748.923.2 (11.4–38.3)20.717.8 (11.6–24.1)15.5
620_901EOU & OZ1426746.023.1 (9.39–42.7)23.117.7 (11.3–23.5)15.0
319_913EOU1435059.823.3 (10.2–35.8)20.717.8 (11.3–24.3)17.1
888_999EOU58949.421.8 (10.2–34.3)22.919.1 (15.5–27.4)14.2
a Parent IDs of full-sibling families. b Percent of planted trees still alive in 2018 or 2019. CV = Coefficient of variation (%).
Table 4. Main effect and interaction variances for d.b.h., tree height, and survival across test sites.
VariableCovariance ParameterEstimateZ Valuep > Z
d.b.h.Test 0.632.530.0057
Replication(test)0.062.830.0024
Family0.234.540.0001
Test*family0.041.430.0771
Rep*family(test)0.061.530.0629
Residual2.8843.180.0001
HeightTest37.22.410.0079
Replication(test)13.54.580.0001
Family1.892.330.0096
Test*family1.151.400.0809
Rep*family(Test)10.37.740.0001
Residual27.123.310.0001
SurvivalTest0.092.110.0213
Replication(test)0.032.510.0731
Family0.041.950.1843
Test*family0.052.640.0673
Rep*family(test)0.062.660.0746
Residual0.9771.210.0001
Table 5. Variances of full-sibling family, replication, and replication × family interaction term for d.b.h., tree height, and survival by test sites.
TraitTest------------Family a-------------- ---------Replication a----------- ----Replication × Family a---
no.EstimateZ Val.p > ZEstimateZ Val.p > ZEstimateZ Val.p > Z
d.b.h.
10.231.530.062n.a.n.a.n.a.0.402.300.011
50.332.760.0020.121.070.1420.030.420.337
60.362.860.0020.091.130.1290.010.030.486
100.161.970.0240.020.670.2520.091.010.156
140.061.040.149n.a.n.a.n.a.0.161.340.090
190.251.890.0290.040.750.2260.251.720.042
210.182.160.0150.030.820.206n.a.n.a.n.a.
250.111.900.0280.040.940.1730.202.690.003
280.443.030.001n.a.n.a.n.a.n.a.n.a.n.a.
290.010.500.30800.450.326n.a.n.a.n.a.
310.141.810.0350.061.020.1540.131.400.080
320.161.940.0260.020.630.2650.111.190.116
330.322.890.0010.030.900.1850.060.670.250
380.201.680.0450.091.050.1470.060.500.310
480.111.790.036n.a.n.a.n.a.00.110.454
Height
12.651.320.05641.801.200.11512.102.610.004
51.180.610.27132.101.200.1148.762.610.004
60.290.350.3659.481.350.0885.752.920.001
100n.a.n.a.12.001.190.1175.913.270.001
144.862.290.0111.921.100.1353.331.210.113
190n.a.n.a.10.501.340.0897.052.690.003
212.331.710.0431.240.960.1693.021.530.063
250n.a.n.a.20.101.370.08510.003.540
284.832.370.0080.750.890.1865.582.650.004
290n.a.n.a.29.501.390.0839.244.270
313.511.760.03828.001.380.0835.601.870.030
320n.a.n.a.n.a.n.a.n.a.5.991.690.045
336.011.470.05011.401.250.10429.304.590
383.951.180.11822.901.340.0909.511.670.047
481.691.710.0431.481.150.1250.960.570.285
Survival
10.010.530.2960.010.640.259n.a.n.a.n.a.
50.011.650.04900.090.4650.012.510.006
60.010.770.22000.280.391n.a.n.a.n.a.
100.011.310.09500.870.1930.012.260.011
140.011.610.05300.700.2430.012.100.018
190.012.250.01200.130.4460.011.570.058
210.010.780.21700.850.1980.011.920.027
250.011.490.068n.a.n.a.n.a.0.013.260
280.022.500.00600.430.3330.012.750.003
290.011.800.03500.560.28600.890.187
310.012.290.01100.460.32401.270.102
320.011.700.04400.240.40401.230.108
330.011.400.08100.820.2060.012.920.001
380.022.280.01100.520.30001.530.063
480.022.270.011n.a.n.a.n.a.00.920.179
a Variance parameters. n.a. = Not available.
Table 6. Provenance (i.e., seed source) effects for d.b.h., tree height and survival.
VariableSource of VariationdfFp
d.b.h.Seed source24.200.050
HeightSeed source20.430.644
SurvivalSeed source22.330.023
d.b.h. = Diameter at breast height.
Table 7. Comparison of average d.b.h., total height, and survival among shortleaf pine seed sources (provenance) across all measured test sites; means with the same letter are not significantly different (p > 0.05).
Seed Sourced.b.h.CVTotal HeightCVSurvivalCV
East Ouachita (EOU) 24.6 a6.3418.4 a9.5650.0 a4.78
West Ouachita (WOU) 23.7 a6.4918.2 a8.4151.4 a3.97
Ozark (OZ)22.4 b6.3817.7 a5.9856.7 b5.11
CV = Coefficient of variation (%). a,b Average values.
Table 8. Heritability estimates for d.b.h., height, and survival across 15 progeny tests of shortleaf pine on the Ouachita and Ozark-St. Francis National Forests.
TraitIndividual Tree Heritability (h2i)Standard Error of h2i EstimateFull-Sibling Family Mean Heritability (h2FS)Standard Error of h2FS Estimate
d.b.h.0.1460.0300.7200.054
Height0.0940.0390.4060.118
Survival0.0670.0340.5200.267
Publisher’s Note: MDPI stays neutral with regard to jurisdictional claims in published maps and institutional affiliations.

