Article

Intra-Annual Identification of Local Deforestation Hotspots in the Philippines Using Earth Observation Products

1
Laboratory of Geo-Information and Remote Sensing, Wageningen University and Research, Droevendaalsesteeg 3, 6708 PB Wageningen, The Netherlands
2
Environmental Systems Analysis, Wageningen University and Research, Droevendaalsesteeg 3a, 6708 PB Wageningen, The Netherlands
3
Resources, Environment and Economics Center for Studies Incorporated, Suite 406, The Tower at Emerald Square JP. Rizal Corner P. Tuazon Streets, Brgy. Milagrosa Project 4, Quezon City 1109, Philippines
4
Forest Foundation Philippines, 2F Valderrama Building, Esteban St., Makati, Metro Manila 1223, Philippines
5
The World Bank Group, 26th Floor, One Global Place, 25th St., Taguig, Metro Manila 1634, Philippines
6
College of Forestry and Natural Resources, University of the Philippines Los Baños College, Laguna 4031, Philippines
*
Author to whom correspondence should be addressed.
Submission received: 8 June 2021 / Revised: 23 July 2021 / Accepted: 24 July 2021 / Published: 29 July 2021
(This article belongs to the Section Forest Ecology and Management)

Abstract

:
Like many other tropical countries, the Philippines has suffered from decades of deforestation and forest degradation during and even after the logging era. Several open access Earth Observation (EO) products are increasingly being used for deforestation analysis in support of national and international initiatives and policymaking on forest conservation and management. Using a combination of annual forest loss and near-real time forest disturbance products, we provide a comprehensive analysis of the deforestation events in three forest frontiers of the Philippines. A space-time pattern mining approach was used to map quarterly deforestation hotspots at 1 km pixel size (100 hectares), where hotspots are classified according to the spatial and temporal variability of the 2000–2020 deforestation in the study area. Our results revealed that 79–81% of the hotspots overlap with primary forests and 27–29% are inside the state-declared protected areas. The intra-annual analysis of deforestation in 2020 revealed an alarming trend, where most deforestation occurred between the 1st and 2nd quarter (92–94% in hotspot forests; 87–89% in non-hotspot forests), highly overlapping within the slash-and-burn farming season. We also found “new” hotspots (2020) formed mostly from landslide scars and partly from selective logging, the latter is believed to be underestimated. Our study paves the way for rapid and regular assessment of the country’s deforestation, useful for the respective environmental institutions who convene several times a year. Moreover, our findings assert the imperative of alternative livelihoods to upland farmers, efficient forest protection activities, and even the mitigation of landslide risks.

1. Introduction

Forests provide a broad range of ecosystem services including the mitigation of climate warming and its adverse consequences [1] and the regulation of water to sustain croplands and even mitigate potential floods [2]. Forests also provide aesthetic, cultural and recreational services for the wellness of humans and are home to diverse groups of flora and fauna. The tangible benefits from forests are obviously timber and also non-timber forest products; however, unabated timber harvesting has led to forest loss in most tropical regions [3,4]. Although timber cutting has been found to be on the decline compared with the situation half a century ago, analysis of deforestation trends in recent times pinpoints to “commodity-driven” deforestation as the main driver, owing to the growing local and international demands of agricultural products such as meat, soya and oil [5,6]. Deforestation is blamed for directly causing forest fragmentation and abandoned landscapes, indirectly leading to the decline of forests’ ecosystem services including biodiversity [7,8].
Like many other tropical countries, the Philippines has experienced historical and persistent forest loss, where the peak of deforestation happened from 1977 to 1988, driven by 25-years long logging concessions [9]. Contributing factors including poor and inefficient government oversight and abusive logging companies, some of which operated beyond the legal duration of their permits, resulted in wanton destruction of the countries’ primary dipterocarp forests. Years later, due to the much-diminished forest area, public outcry and log bans, massive logging was slowly put to a halt, although the other root causes driving deforestation had not been addressed [9]. The deforestation after the logging era has been driven mainly by slash-and-burn agriculture, charcoal making, agricultural encroachment, mining, and selective logging [9,10]. Apan et al. (2017) [11] reported that deforestation has continued in recent decades, even in the declared protected areas. Estoque et al. (2018) [12] investigated forest fragmentation and biodiversity loss in the last forested protected area in mainland Philippines and found that these perils were deforestation-driven. More recently, Perez et al. (2020) [13] pointed out that the continuous deforestation activities outweigh the massive reforestation of the government that started in 2011.
These recent studies employed products derived from Earth Observation (EO) satellite data as inputs for deforestation analysis. Using EO and remote sensing (RS), it is possible to capture distinct signals of the land, particularly forestlands before and after a deforestation event i.e., from forest to bare land [14,15]. Optical RS can detect and interpret the emitted solar energy from the vegetation e.g., as surface reflectances after several pre-processing steps. The widely used EO mission is the optical Landsat satellite, with global image collection for at least three decades. However, optical satellites cannot see beneath the clouds which are perennial in tropical regions. Radar RS can transmit and receive signals in the form of backscatter intensity that not only can pass through clouds, but are also sensitive to changes in forest structure. Such advantages of radar were found ideal for monitoring deforestation-driven changes [16,17]. The Sentinel 1 (radar) mission has provided data since 2014 with a spatial resolution of at least 10 m pixel size and temporal resolution of 1–2 weeks. These EO data are inputs to RS technology in producing EO products of forest variables.
The most common and widely used EO product on forest and its dynamics is the Landsat-derived Global Forest Change (GFC) dataset, where tree cover or forest loss (2000–2020) and gain (2000–2012) data are globally available at 30 m pixel size [18]. The GFC dataset has been helpful in both local to global scale analysis of deforestation and its implications. Hansen et al. (2020) [8] applied this dataset to assess forest fragmentation in the tropics and found that smaller fragments have been increasing as a sign of high-rate forest disturbances and increasing land pressure to forestlands. Similarly, Vieilledent et al. (2018) [19] used the loss data in conjunction with a historical baseline forest map to assess the development of fragmented forests in Madagascar and reported not only the increasing fragments, but also the apparent shift of the remaining forest areas towards forest edges.
Some other recent EO products are near-real time forest disturbance alerts: the Global Land Analysis and Discovery alert system (GLAD, 2015–present), which uses terrain and atmospherically corrected Landsat 7 and 8 data to create weekly alerts of tree cover loss in Amazon, Congo and insular Southeast Asia [20]; and the Radar for Detecting Deforestation (RADD) alerts where Sentinel 1 is used to classify forest disturbances for a minimum of 0.1 ha within African (since 2019) and Asian (since 2020) countries. A recent study showed that alert systems could trigger immediate interventions in forest management and conservation by environmental stakeholders [21].
These EO products play a role as inputs to spatially identify hotspots of deforestation. One goal of identifying these hotspots is to prioritize forest areas that need immediate interventions i.e., forest protection. Mapping hotspots can either be through a subjective judgment by experts or using geospatial models [22,23]. Gandhi and Jones et al. (2019) [24] subjectively used the rate of mangrove changes from a set of country data to determine which among Southeast Asian countries are mangrove deforestation hotspots. Mapping hotspots using models may require spatial and temporal (spatio-temporal) data to identify hotspots based on the rate and extent of deforestation over time. Jardeleza et al. (2019) [25] used zonal statistics to identify 2010–2015 hotspots in Philippine forests based on tree cover from different forest covers including a geo-simulated version. Harris et al. (2017) [23] used a space-time pattern mining called Emerging Hotspot Analysis (EHA) to define statistically significant hotspots as a byproduct of the GFC forest loss data. Reddy et al. (2016) [22] did a similar hotspot mapping where each hotspot pixel has a confidence interval while considering the trends in deforestation since 1930, while Sanchez-Cuervo and Aide (2013) [26] applied EHA to assess hotspots in protected areas in relation to hotspot drivers.
No intra-annual deforestation hotspot products have yet been developed and in this sense, the forest disturbance alert products can be useful. The current available EO product for deforestation hotspots is the global EHA-based map [23], being updated every 1–2 years depending on the release of the annual forest loss data [27]. Hotspots can be seasonal, driven by illegal activities usually implemented when the weather is favorable in certain months. This seasonal activity cannot be easily revealed when looking at annual hotspot maps and forest loss per se. Regular hotspot mapping can also help evaluate any progress of interventions such as forest protection. This evaluation can take place during the regular assembly of environmental bodies several times a year.
Here we examine how annual and near-real time EO products can be used to regularly identify deforestation hotspots in the Philippine forests and understand their spatio-temporal trends in relation to the deforestation drivers towards an updated, efficient and practical forest protection and management.

2. Materials and Methods
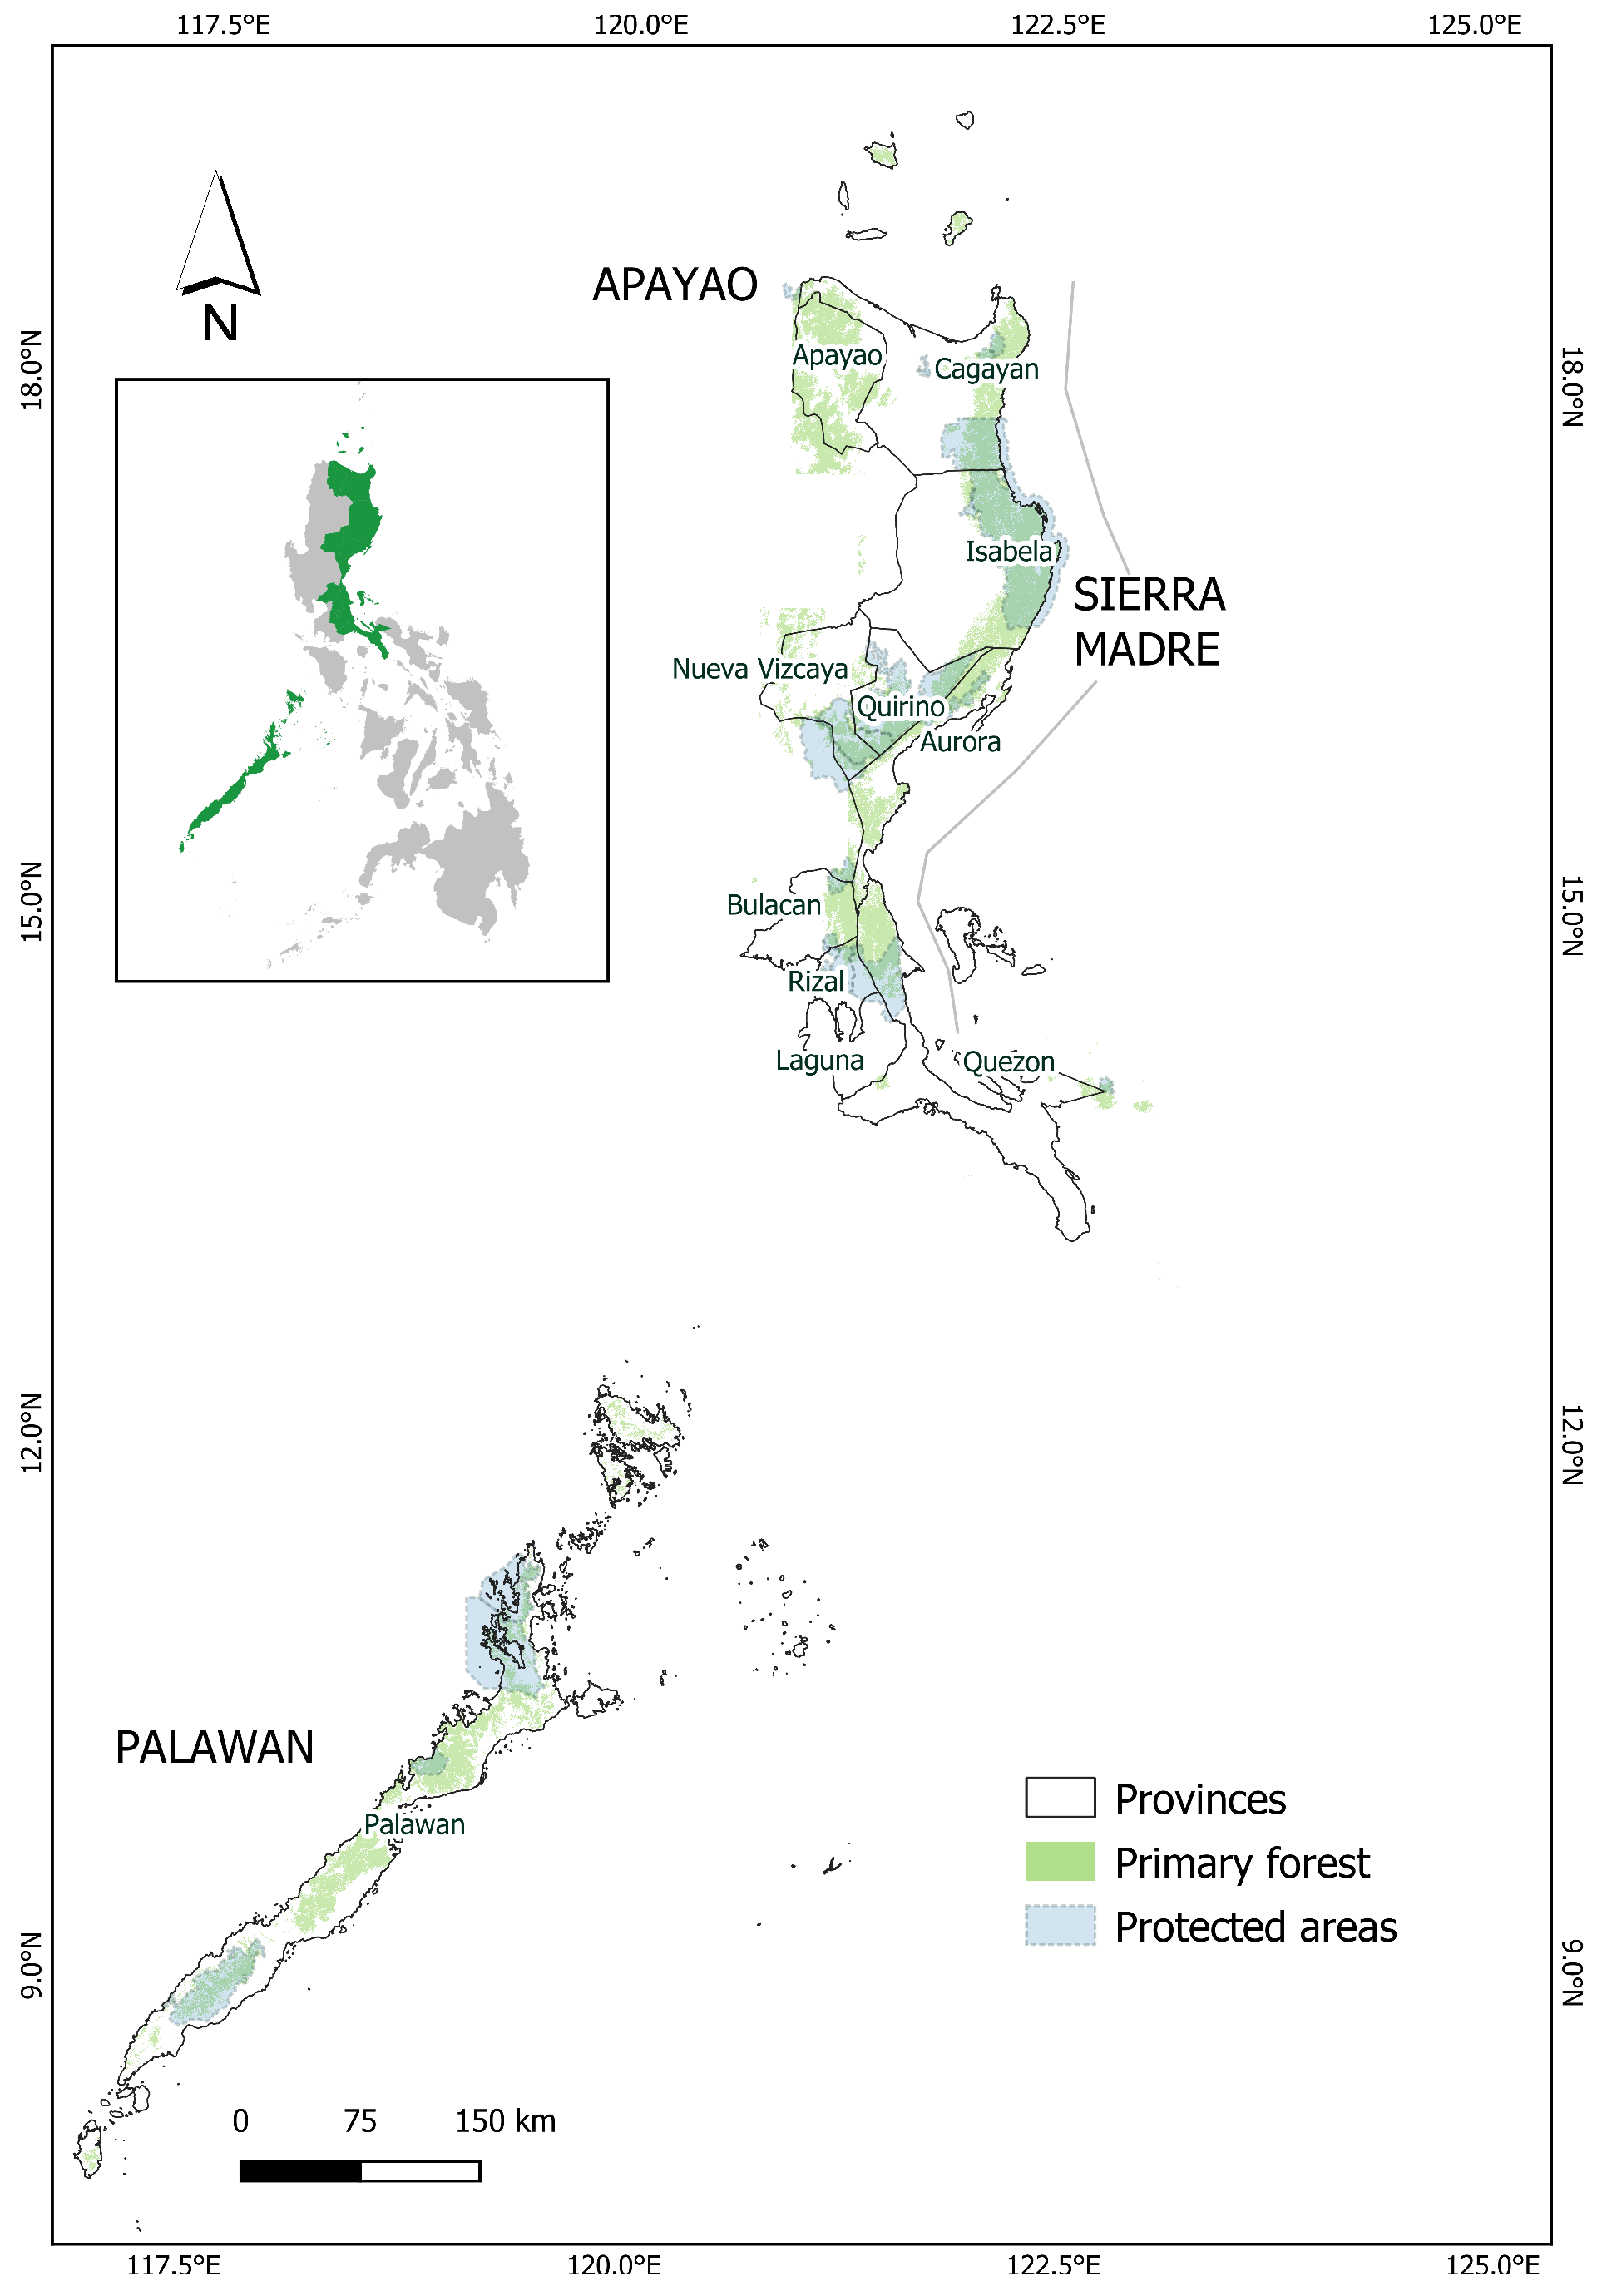
2.1. Study Area

Our study sites are three forest frontiers in the country that encompass eleven provinces. The first is in the Sierra Madre, one of Southeast Asia’s longest mountain ranges that extend within nine provinces. This mountain range is home to the last remaining primary forests in the Philippines, with very high biodiversity and the most number of protected areas. In these mountains, selective logging and agricultural expansion have persisted with alarming rates [28]. The second study site is Palawan province, an elongated island and the largest province in the country. Palawan is known to have primary forests with high endemism of flora and fauna, which are threatened by an increase in active mining operations, slash-and-burn farming, oil palm expansion and timber poaching [29]. The last study site is Apayao province, known to have high endemism of fauna including the rare Philippine eagle, roaming within three highly forested mountains in the province. See Figure 1 for the study area map.

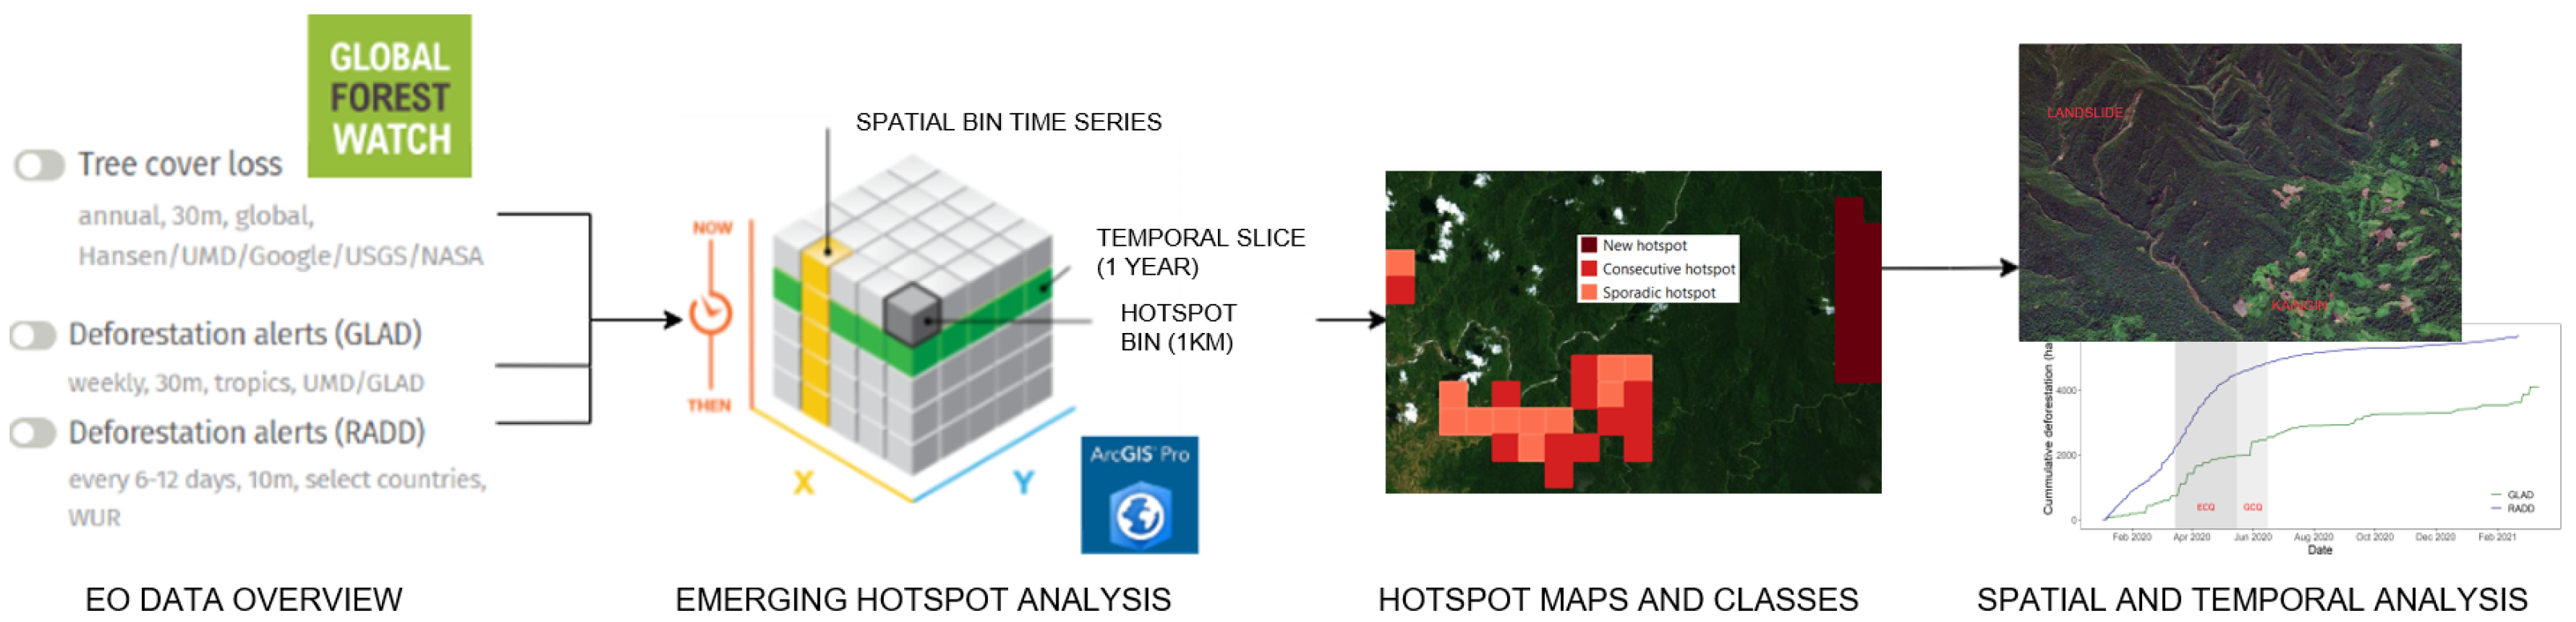
2.2. Method Overview

We used Global Forest Watch (GFW) [27] as a starting point to gain an overview of deforestation in the Philippines over time. After gathering the needed deforestation data, we converted them to space-time data cubes as inputs to the Emerging Hotspot Analysis (EHA) to identify local hotspots and their classes, which were then interpreted spatially and temporally. See Figure 2 for the overview of the main steps of this study.

2.3. Deforestation Data Sources

We used EO products that are widely used to analyze deforestation in the local [11,12,13] and global context [31,32]. First, the GFC forest loss data from the years 2000 to 2019 were accessed from the GFC data portal. This dataset labels a 30 m pixel as “loss” if the pixel before the loss is a vegetated pixel greater than 5 m tall followed by a “removal”, which can be caused by man-made and natural factors [18]. It is cautioned though by the data producers that forest loss is not always equivalent to deforestation. Second, we used GLAD forest disturbance alerts which were accessed using Google Earth Engine (GEE). The GLAD alert system is also a Landsat-derived product (30 m) and can detect disturbances with at least 50% tree canopy removal [20]. The main caveat for this product pertains to the confirmation of the alerts. Each alert pixel should be “confirmed” (detected again after the first detection) and the date of alert would be recorded as the date of said confirmation. Such confirmation can be delayed due to cloud interference. While the next alert product we used, the RADD system, is unaffected by the cloud-induced confirmation delay, the RADD system labels pixels slightly different than the GLAD system as RADD uses the first detection date as the alert date while retracting alert pixels if they are not confirmed within 90 days. Its producers have cautioned of possible undetected small-area disturbances (<0.1 ha). RADD alerts were also accessed via GEE. See Table 1 for additional details about these three deforestation data sources.

2.4. Hotspot Mapping and Assessment

To assess the 2020 deforestation scenario spatially and temporally, we generated quarterly hotspot maps that account for the potential deforestation events from 2000 to 2020 using the annual forest loss data (2000–2019) in combination with each alert product (2020), resulting in two hotspots map versions. We included areas with >30% of the GFC’s tree cover density (TCD) product. This threshold is slightly above the forest mask of the global hotspot data (25% TCD, [23]) and the maximum threshold stipulated in the United Nations Framework Convention on Climate Change [34]. Such forest mask would likely capture disturbances from upland agriculture encroachment. We then resampled the RADD pixels using nearest neighbour method from 10 m to 30 m for consistency in spatial scale i.e., to avoid having three times more pixels than the other products because of the pixel size difference. We also used the same forest mask for the deforestation alerts so we masked out GLAD alerts outside the primary forest baseline year 2019 [30] included in the RADD product. Herein, we call the pixels from the annual forest loss and disturbance alerts as deforestation pixels.
For hotspot mapping, we used EHA (via ArcGIS) being the widely used method from local to global hotspot mapping using EO products. The spatial scale of the EHA matters and we aimed for 1 km × 1 km hotspot bins to preserve small potential hotspots (despite a long computation time), deemed useful for forest protection at local jurisdictional scales. For each bin, we assigned a 3 × 3 window as neighboring bins. The consistency of these hotspots is routinely tested at regular time intervals and we aimed for a 1-year period while updating the 2020 deforestation pixels quarterly (as sufficed by the alert products), hence producing four hotspot maps in 2020.
The technical steps of EHA first involve a clustering method based on the density of deforestation pixels inside the 1-km bins and among neighboring bins, followed by a comparison of such density for each bin relative to all deforestation pixels in the study area. If a bin is found to be relatively dense, a high standard deviation (Z-score) is expected for that bin as evaluated by the Getis-Ord Gi statistic [35]. The second EHA step is a temporal assessment of the deforestation trend for each bin and is performed using the Mann-Kendall trend test to determine whether the trend among bins is increasing or decreasing. Statistical significance (p < 0.05) from these spatial and temporal evaluations would assign a 1-km bin as a hotspot with corresponding classifications described in Table 2. Hotspots are hereby defined as local areas with “statistically significant deforestation”.
Hotspot classes were mapped, counted and analyzed for the year 2020. Hotspots that overlap with the primary forest in 2019 and the government-declared protected areas were also tallied per hotspot class and province. Including these three boundaries would enable joint assessment and interventions by both the national and local governments. The provincial boundaries were obtained from Global Administrative Areas (GADM) while the protected areas were provided by the Biodiversity Management Bureau of the Department of Environment and Natural Resources (BMB-DENR). The primary forest boundary used in the RADD alerts was adapted.
Temporal assessment of the hotspot and deforestation areas was also initiated to investigate deforestation peaks in 2020. Using the 30 m alert pixels (GLAD and resampled RADD), we graphed the accumulated and per month deforested areas. This analysis was extended until April 2021 to assess whether there is a seasonal trend every 1st quarter. We then assessed the deforested areas per hotspot class and outside hotspots (forest non-hotspots), from one quarter to another in 2020.
We finally related the hotspot classes to their main drivers using Sentinel 2 and Planet satellite imageries viewed at GFW, and Google Earth Pro particularly its terrain functionality. Both platforms are useful to easily navigate the landscape and distinguish between two drivers based on spatial patterns i.e., landslide (upslopes) and slash-and-burn (foot slopes). Further validity of the drivers was confirmed by multiple local experts based on their familiarization and access to on-site reports. Lastly, local and international news were collated and summarized in Table A1 as proof that deforestation existed in 2020.

3. Results

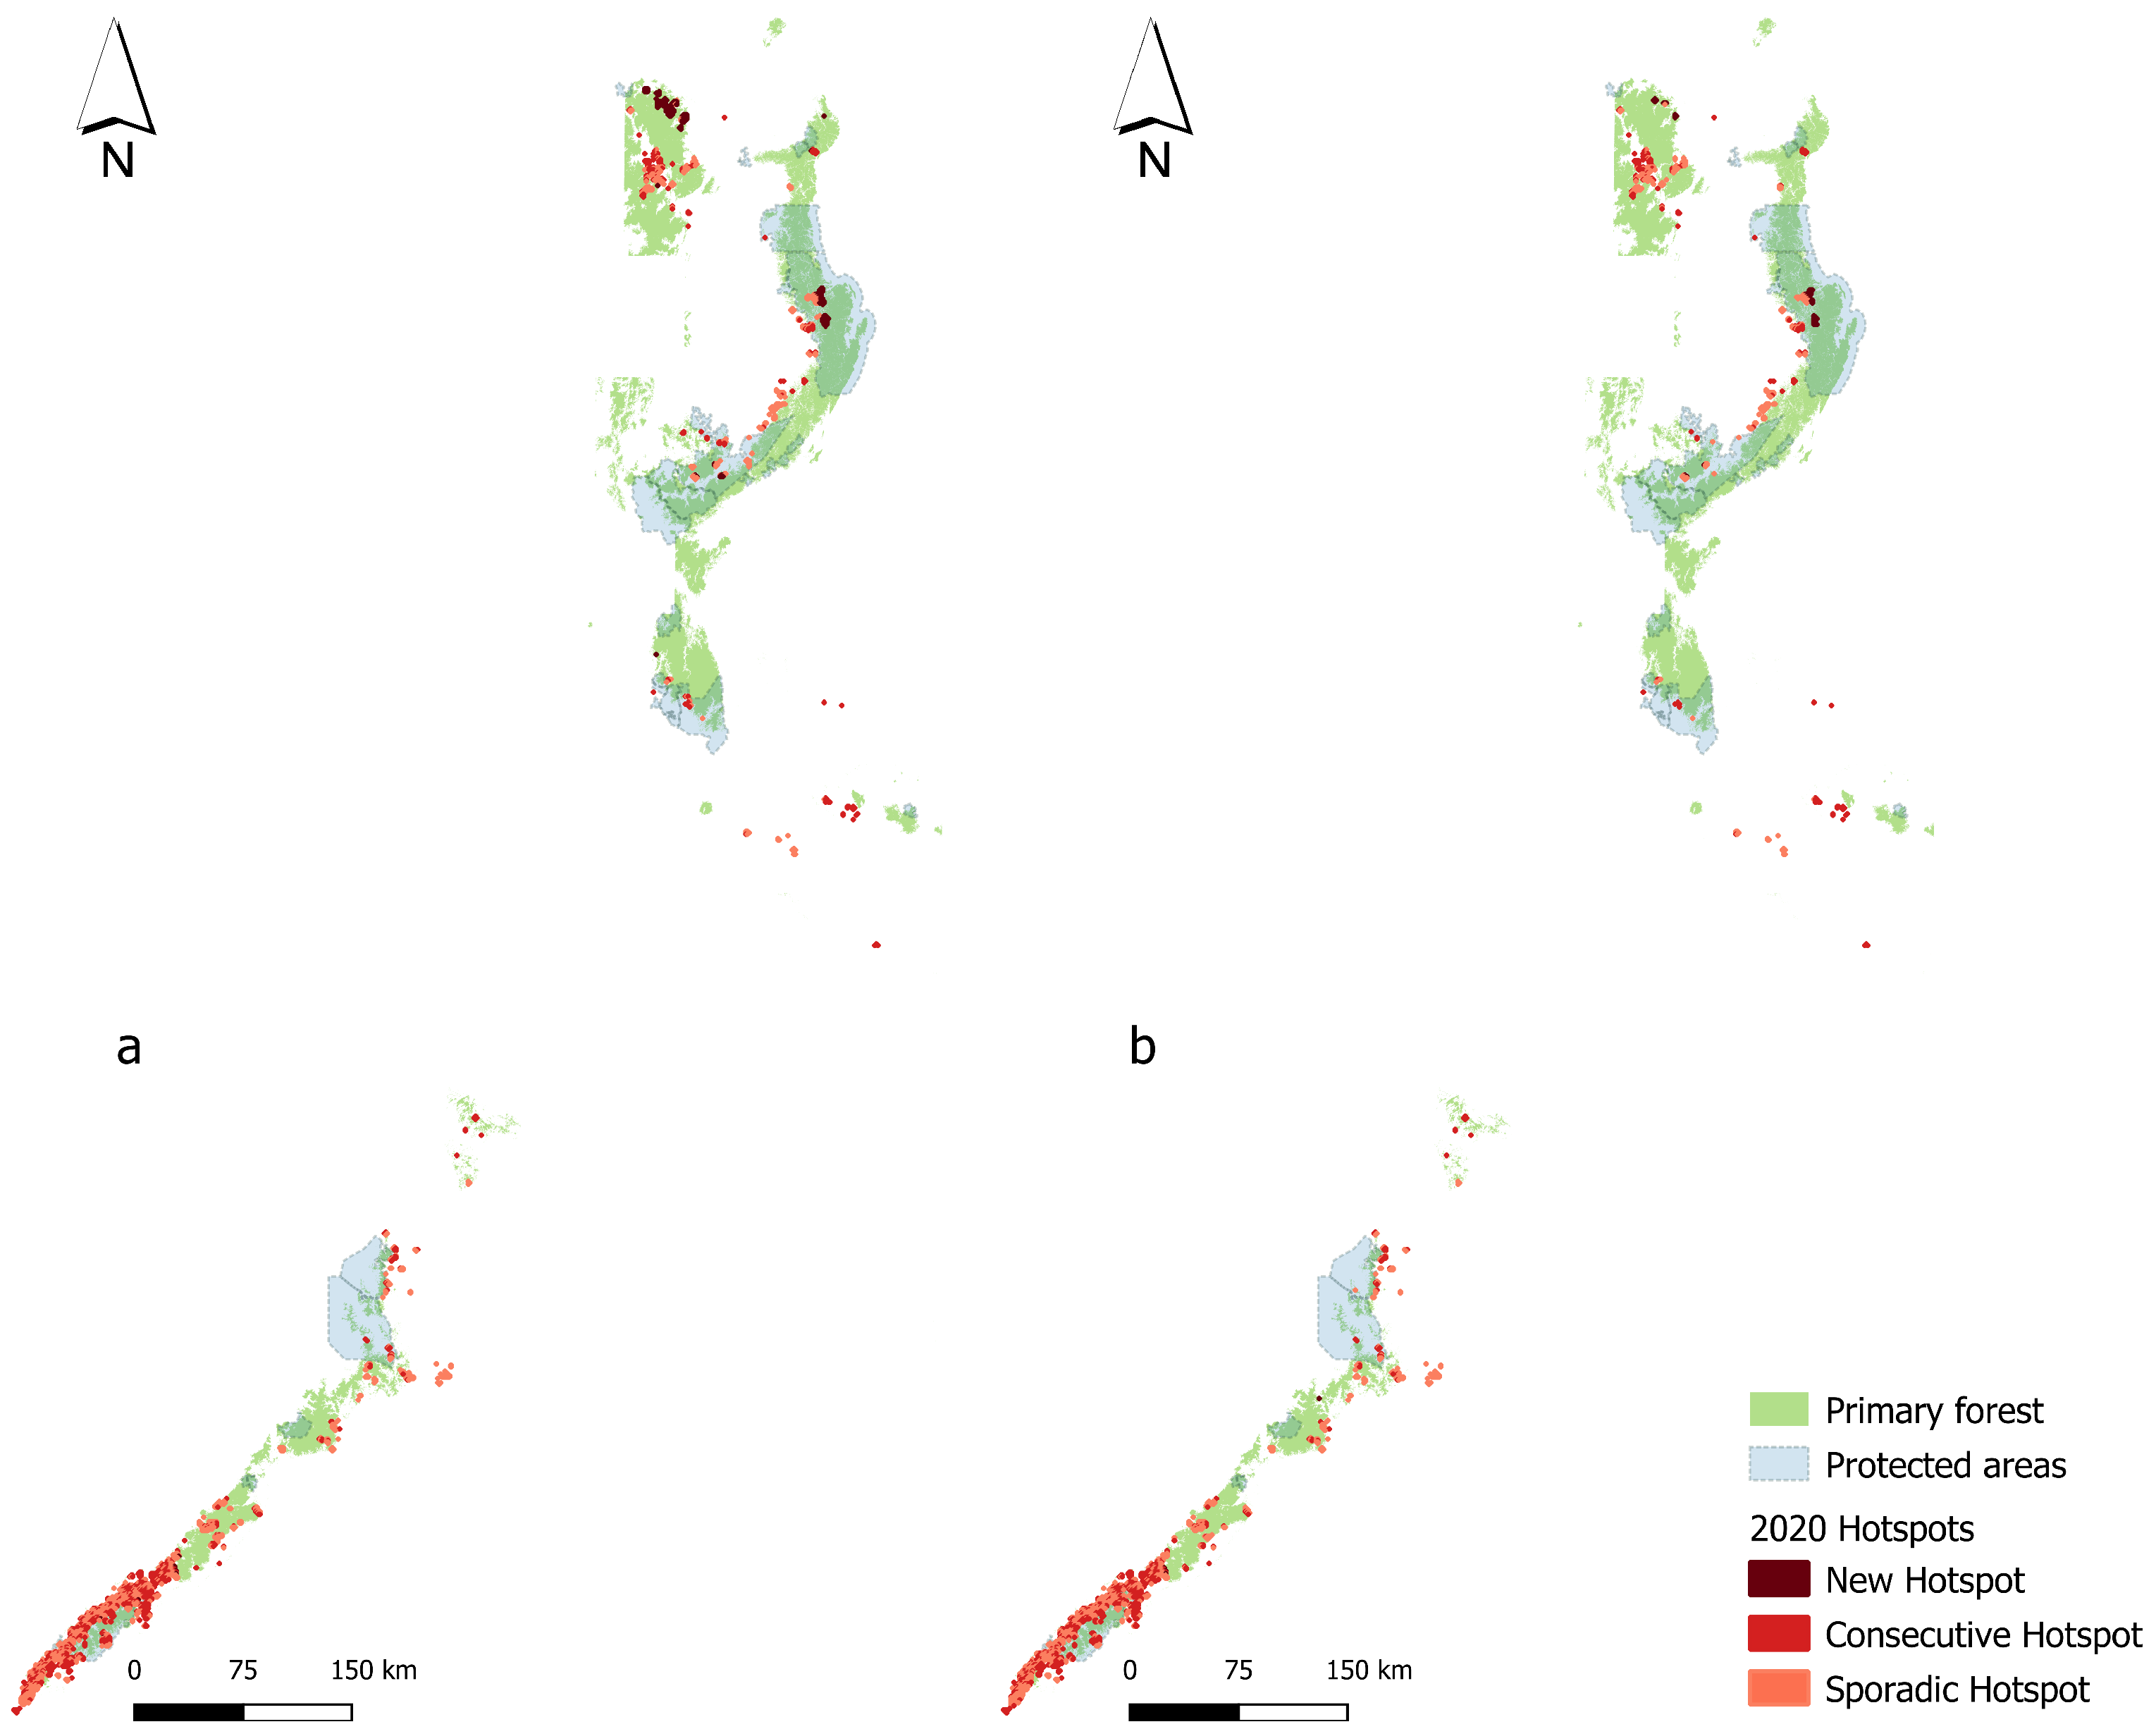
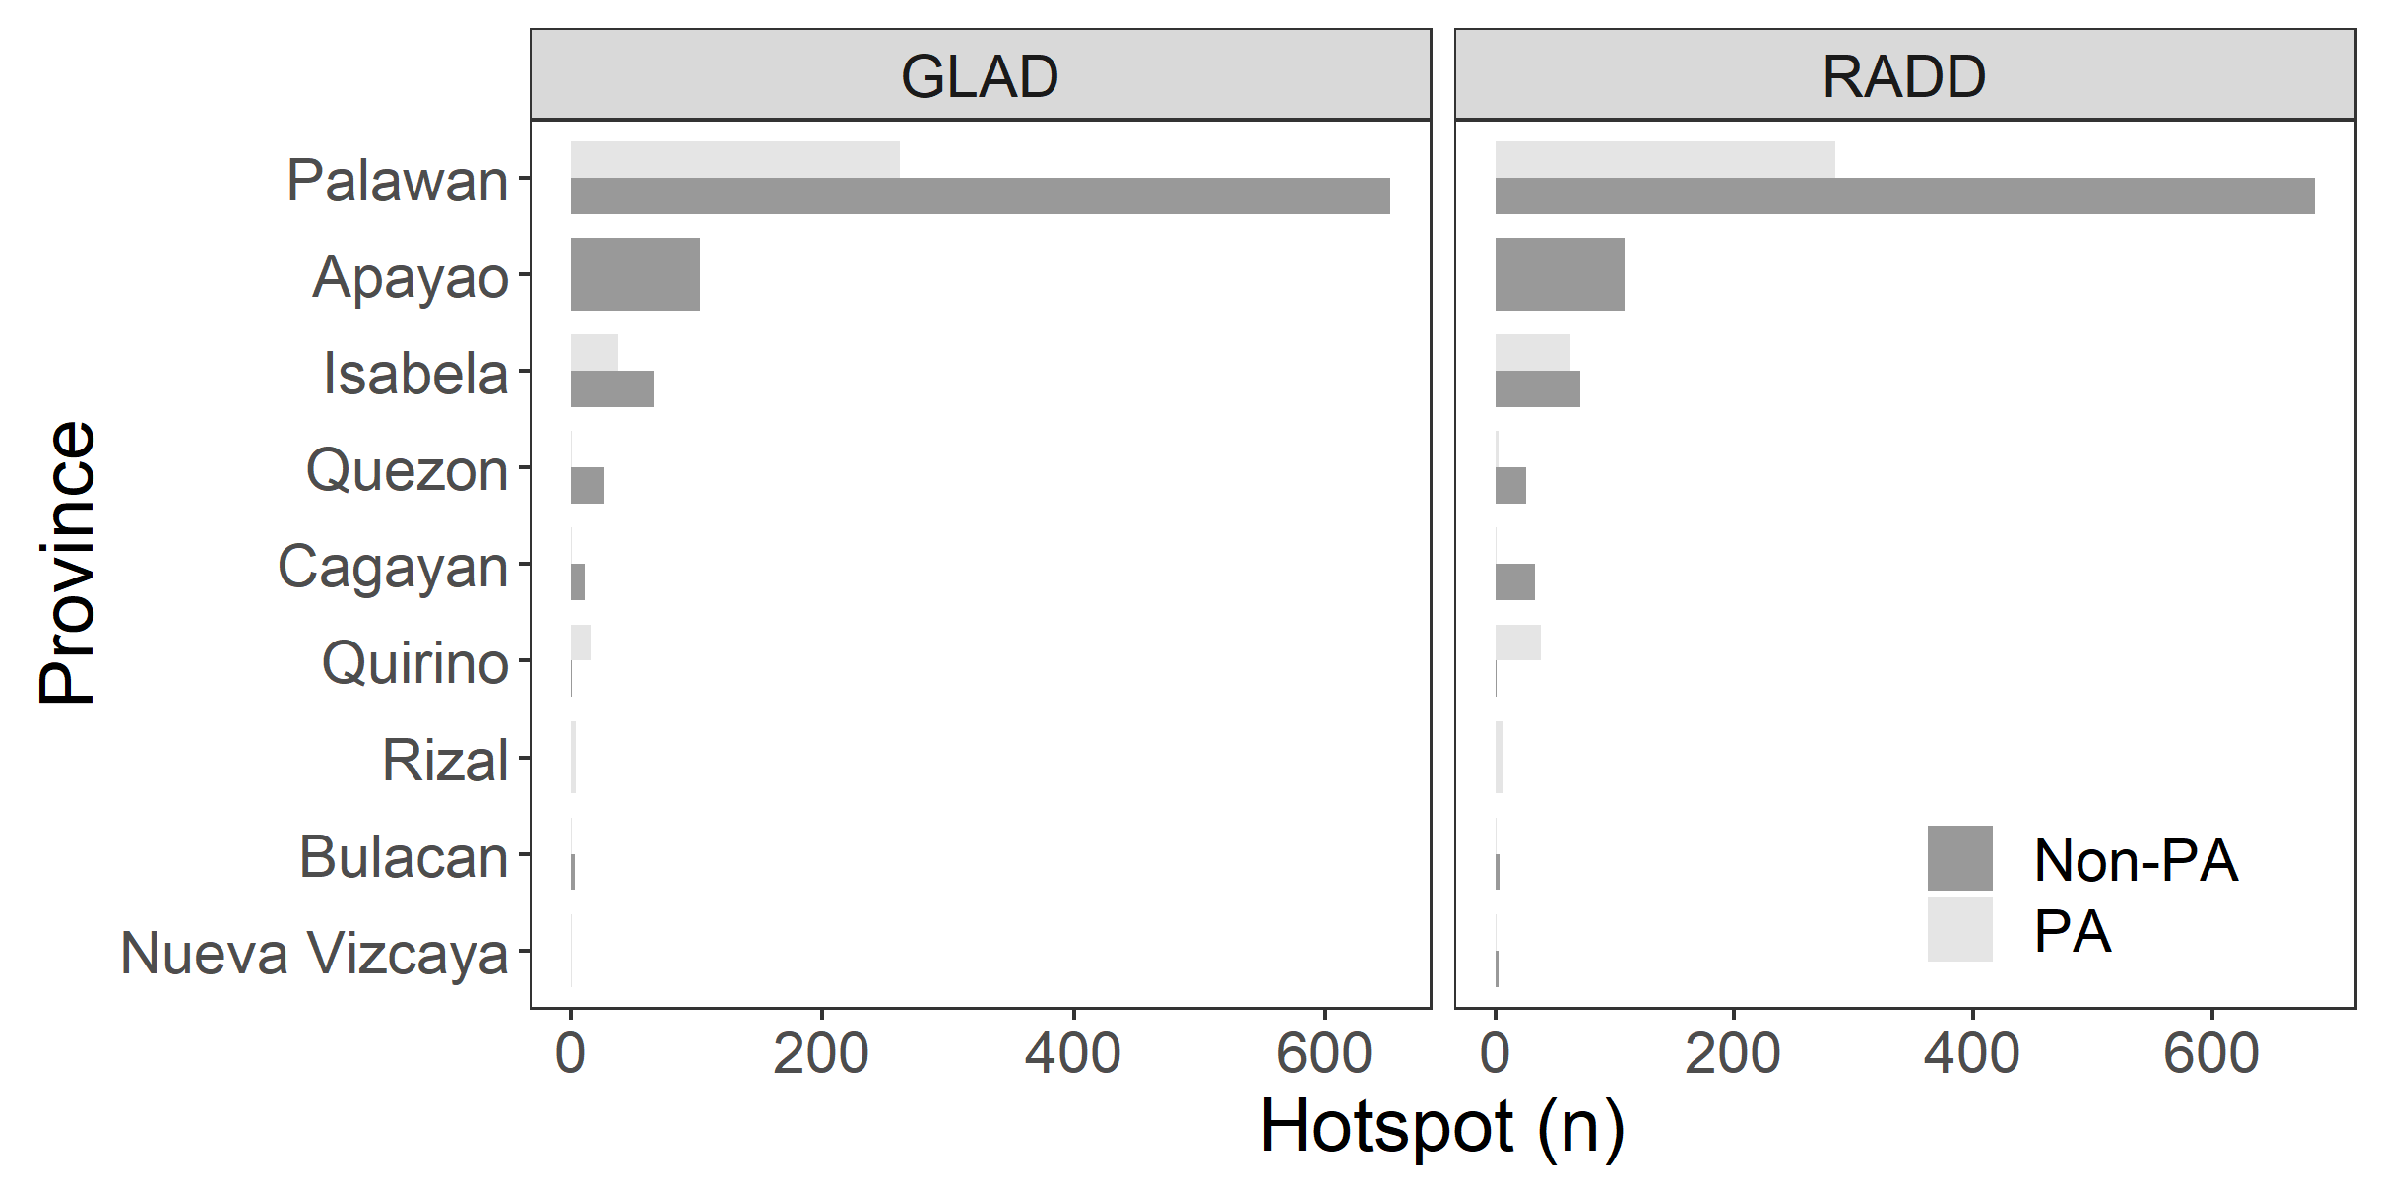
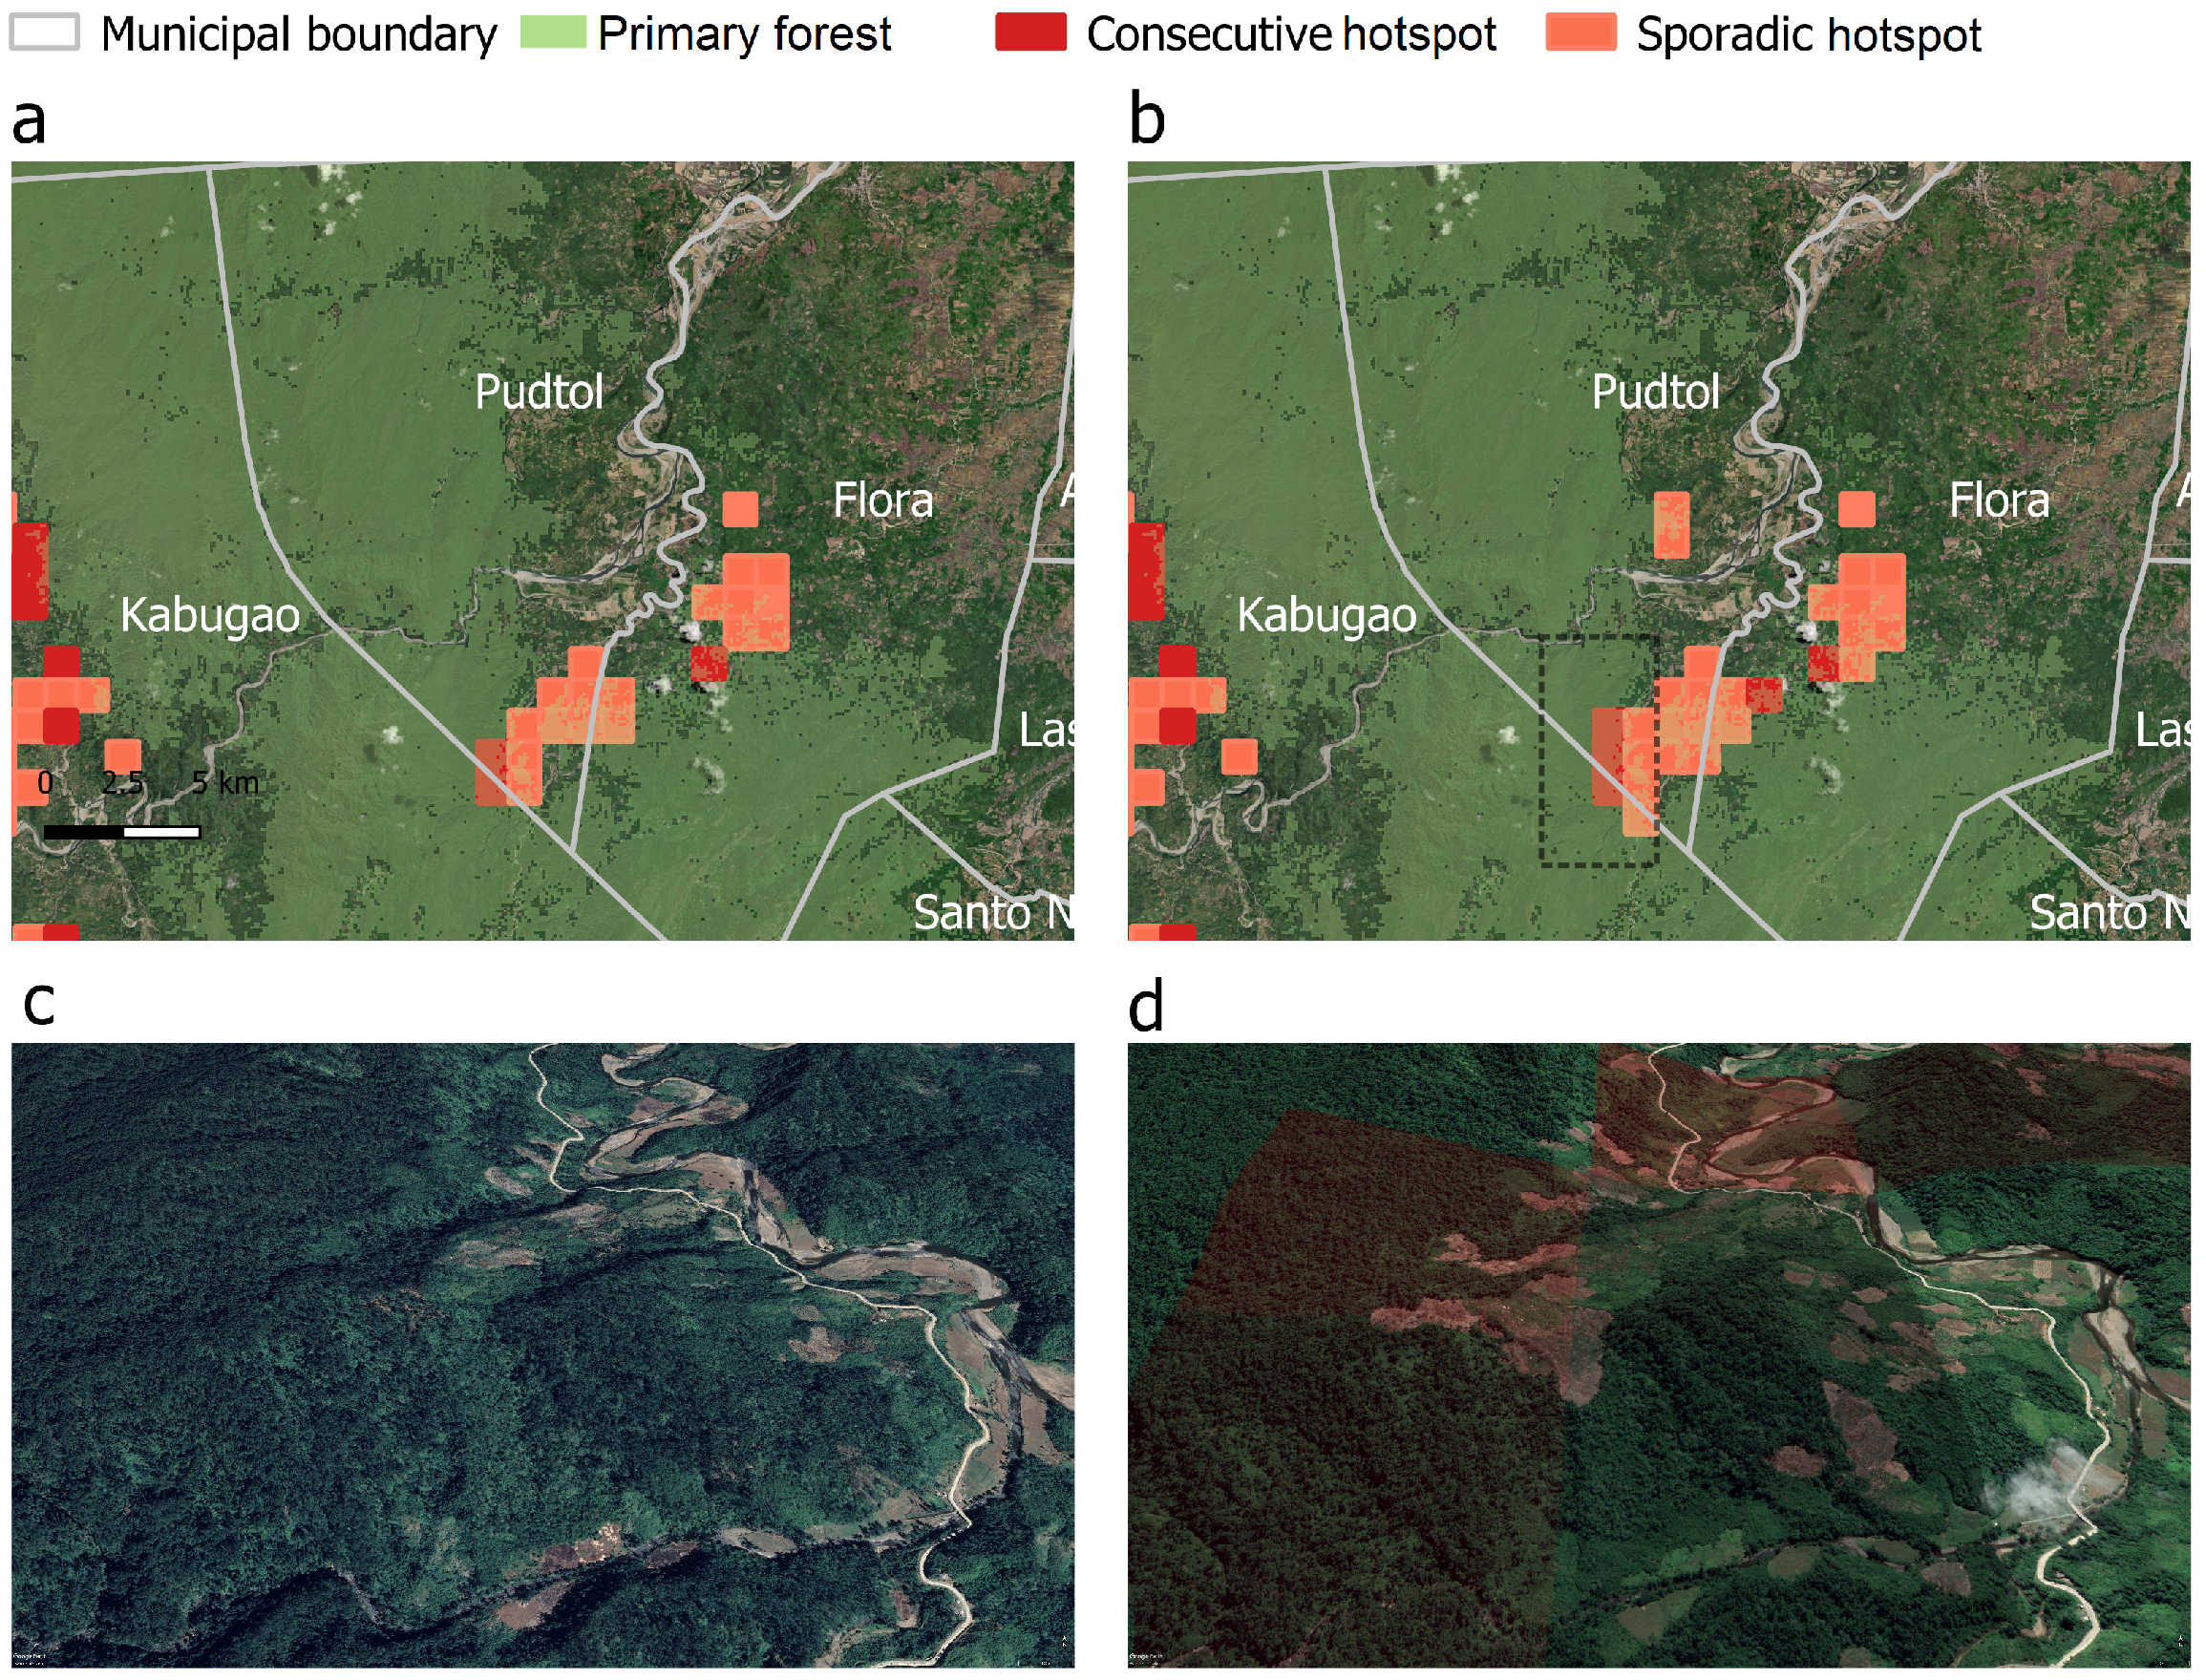
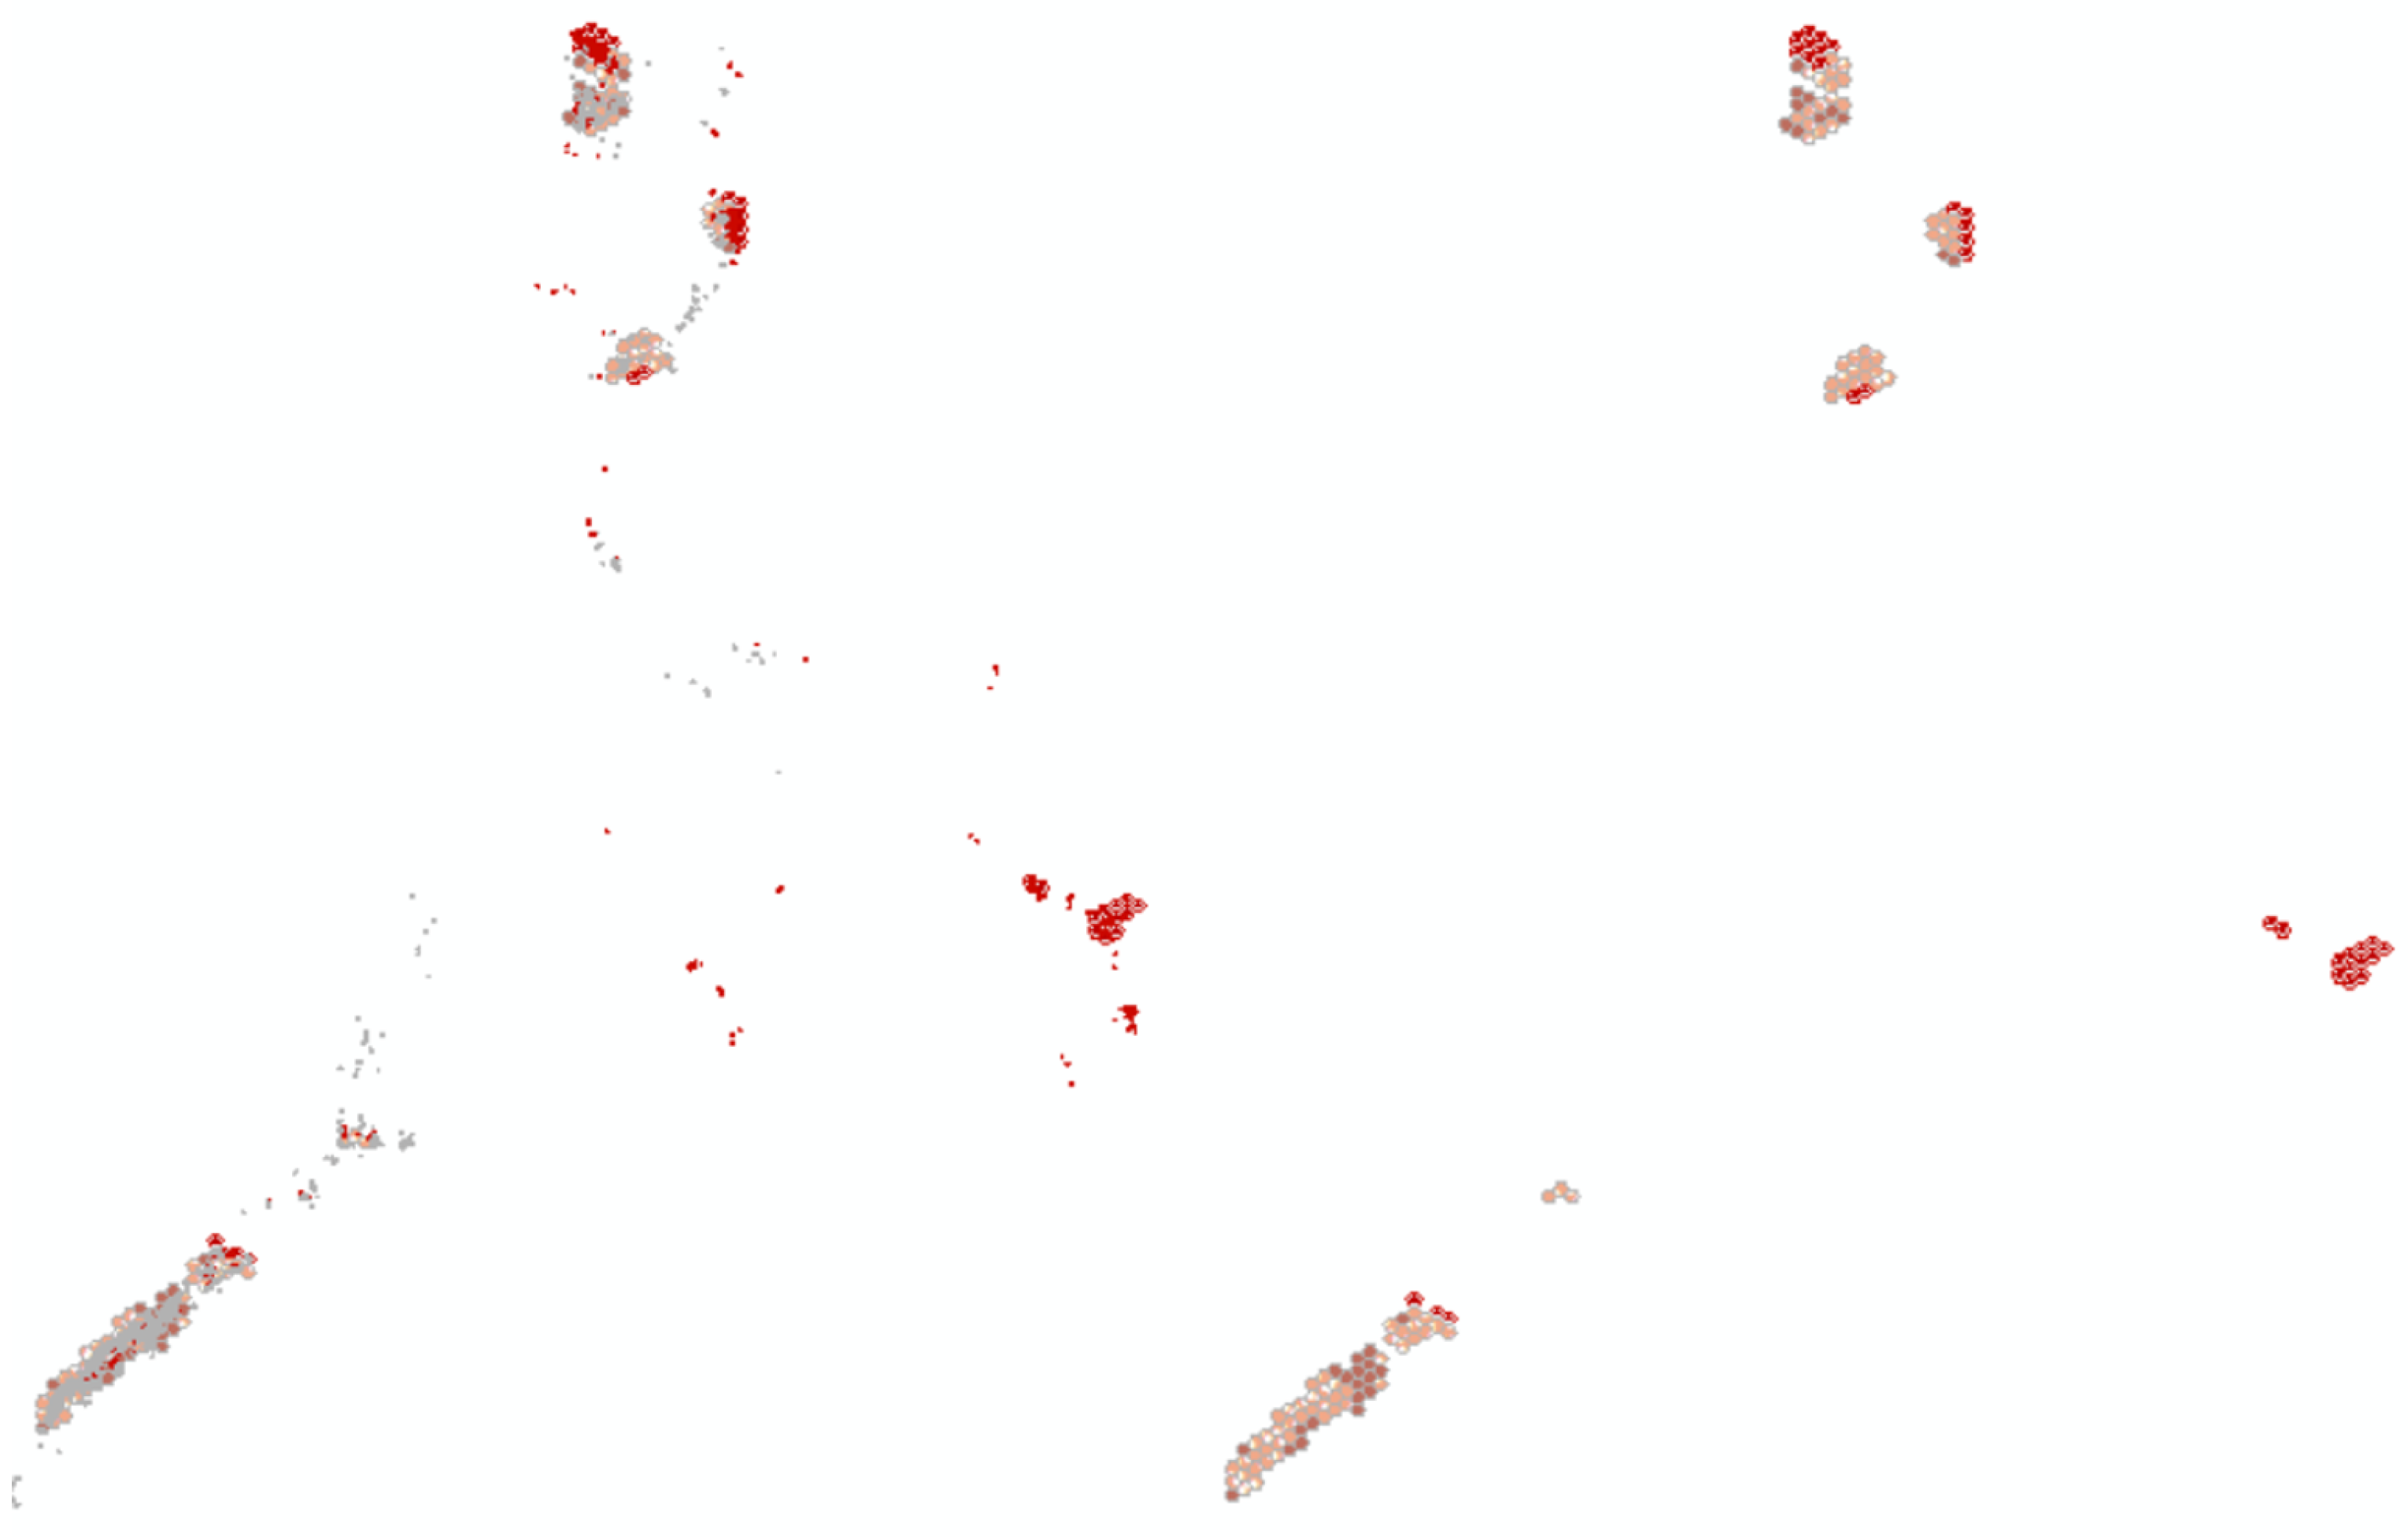
3.1. Hotspot Maps and Analysis

Hotspots that account for the deforestation from 2000 to 2020 were found to exist in the whole study area for both maps that use the RADD and GLAD alerts. These hotspots shown in Figure 3 are a mix of the three hotspot classes located within the remaining primary forests of the country. The detailed breakdown of these hotspots is shown in Table 3 where 1978–2246 hotspots within nine provinces were classified as hotspot areas. Alarmingly, 79–81% of the hotspots overlap with the primary forests in 2020; while 27–29% of them overlap with protected areas. A higher number of hotspots was identified when using RADD alerts (12% higher than GLAD alerts). Results from the two hotspot versions were particularly close for hotspot classes with on-and-off deforestation (sporadic hotspot) and those hotspots formed in recent years (consecutive hotspot). For the hotspots in 2020 (new hotspot), the hotspot map with RADD alerts was found to be higher by 69% than the map with its counterpart alert product. We found one persistent and one historical hotspot and we just merged them to the sporadic class.
The hotspot maps show the regions with the highest number of hotspots such as Southern Palawan, the mountains of Apayao province, and foot slopes of Sierra Madre mountains. The very dense red pixels in Southern Palawan are a combination of sporadic and consecutive hotspots. Notable also are new hotspots forming in the mid-part of the Sierra Madre mountain range and in the northernmost part of Apayao. Visible also in most provinces are scattered hotspots that are either sporadic or consecutive.
The highest number of hotspots that overlap with PAs were found in the provinces of Palawan followed by Isabela and Quirino. These PAs are Mt. Matalingahan and Malamplaya Protected Landscapes in Palawan, and Quirino Protected Landscape and Northern Sierra Madre Natural Park in Sierra Madre. Relatively, the provinces with the highest % hotspot in PAs (almost proportional hotspot count in both PA and non-PA) were ranked and enumerated as follows: Quirino, Isabela, Rizal and Palawan. See Figure 4 for the provincial-level results.

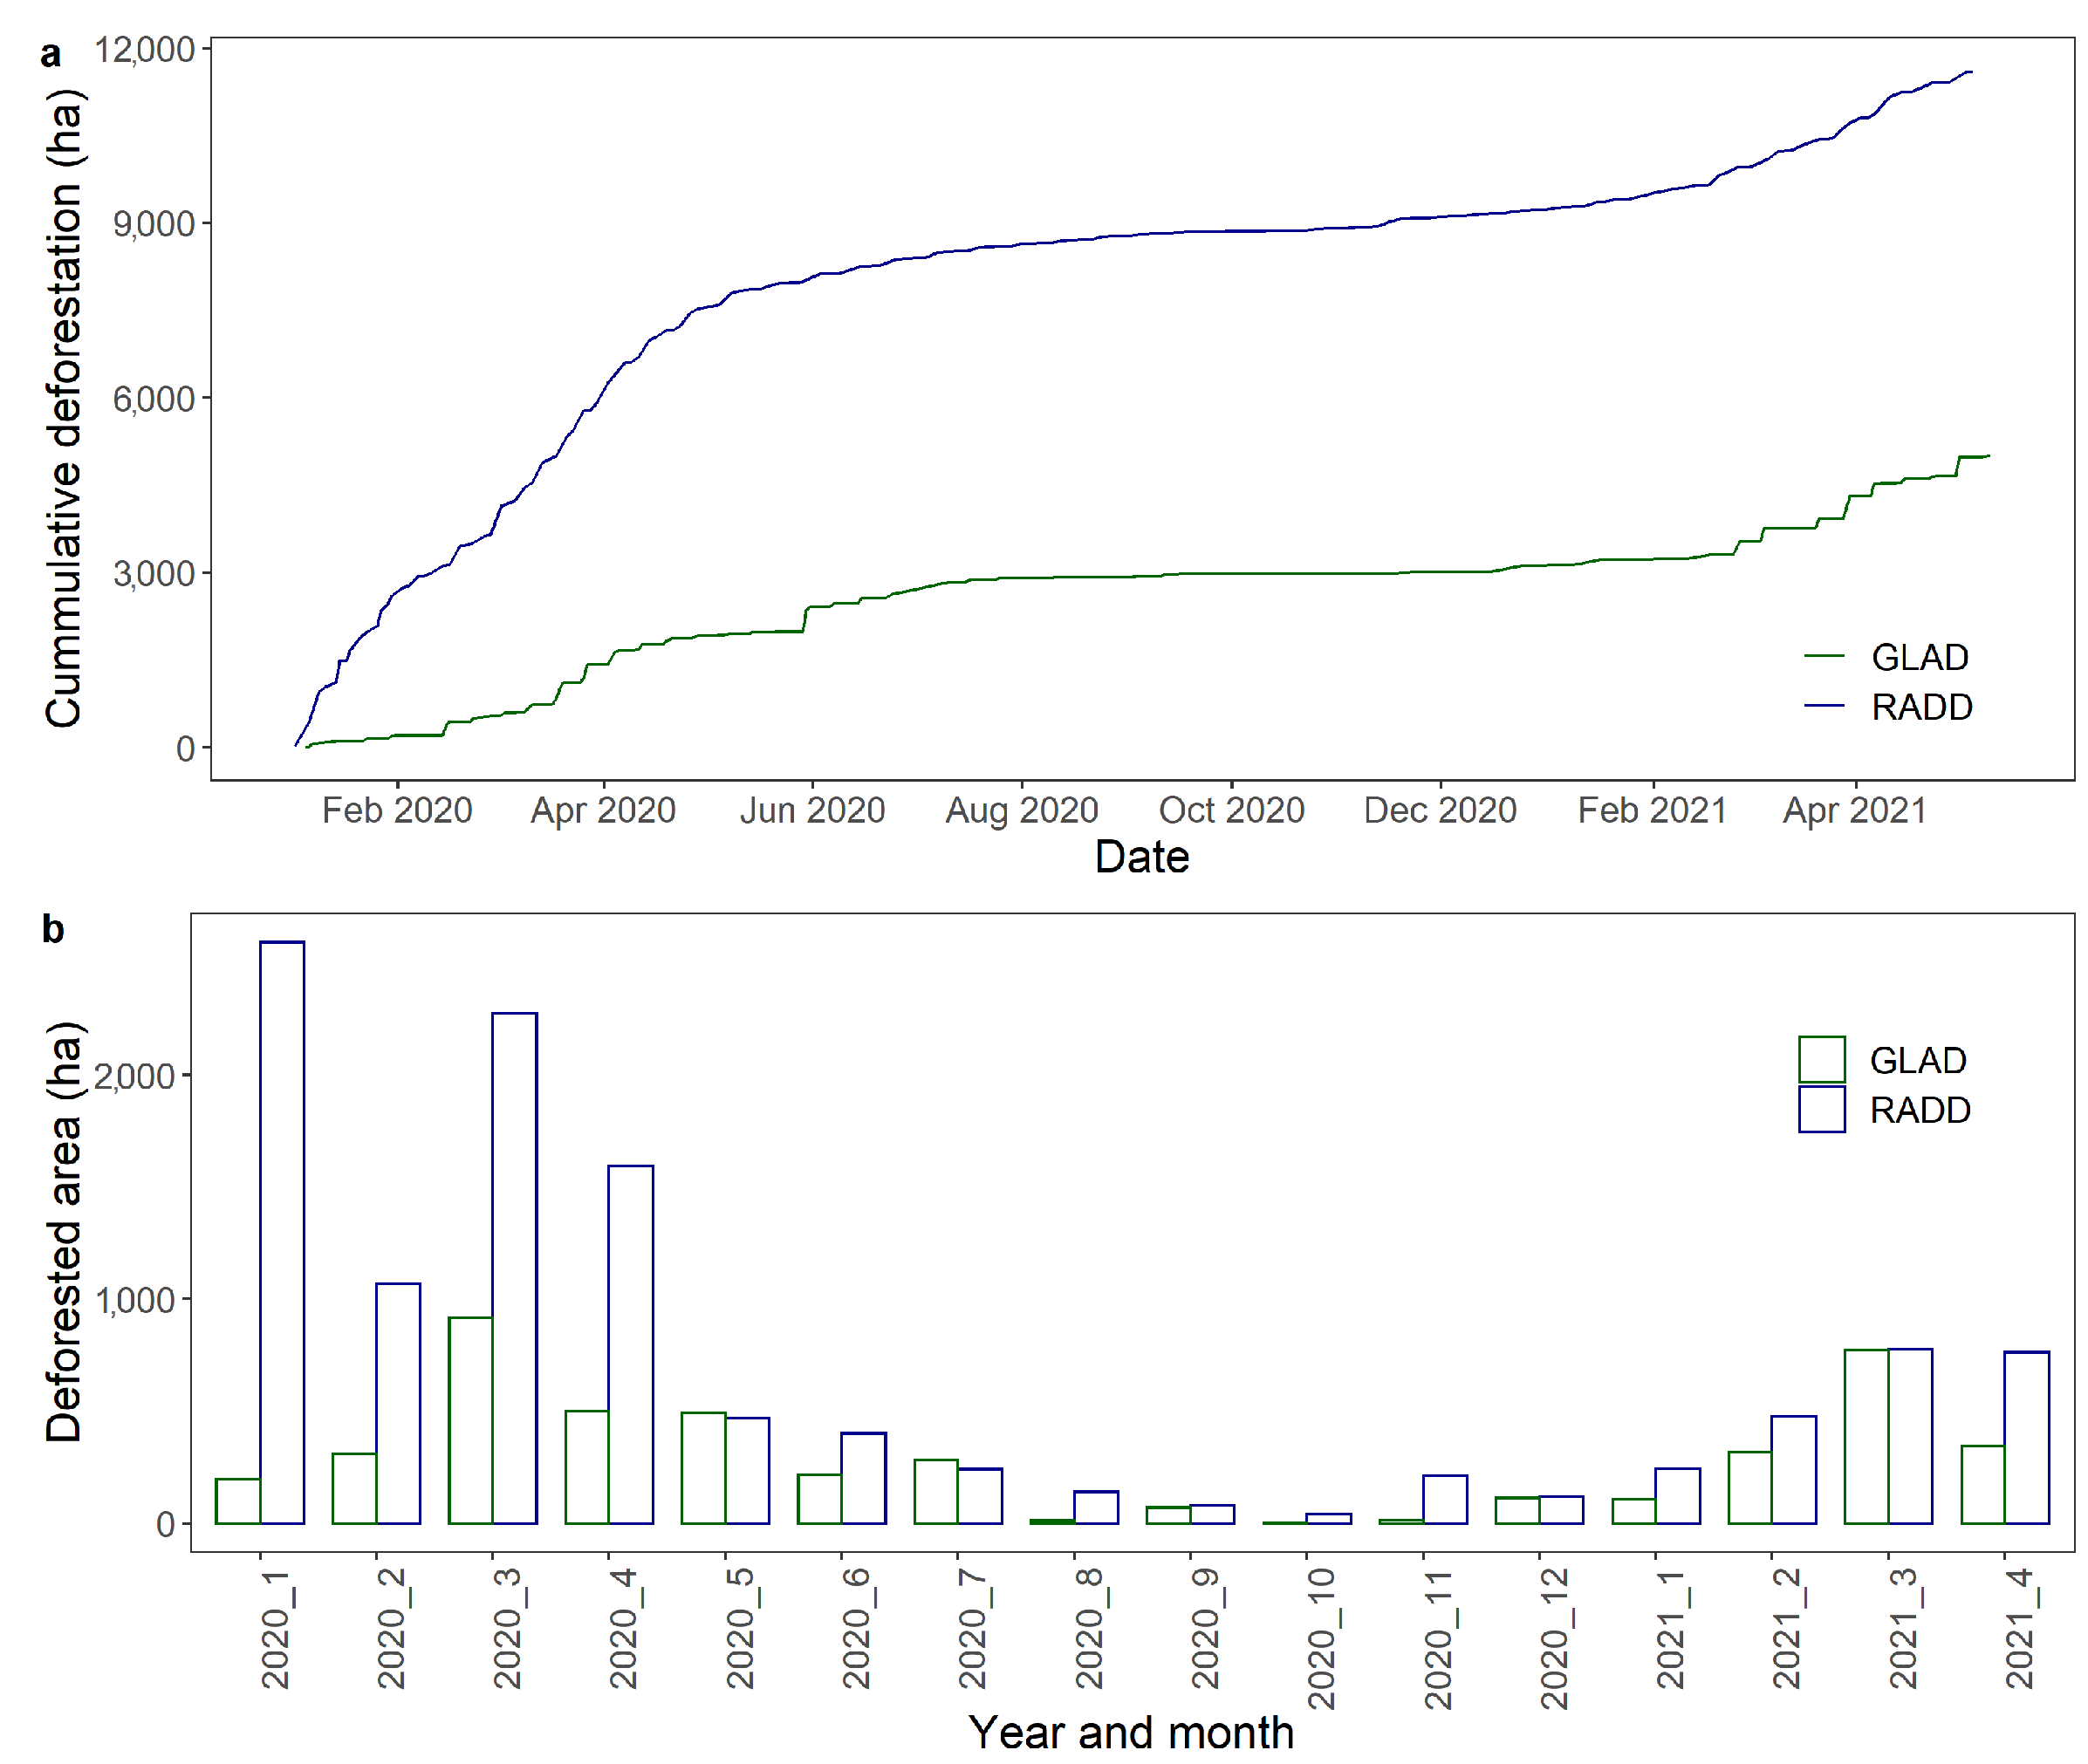
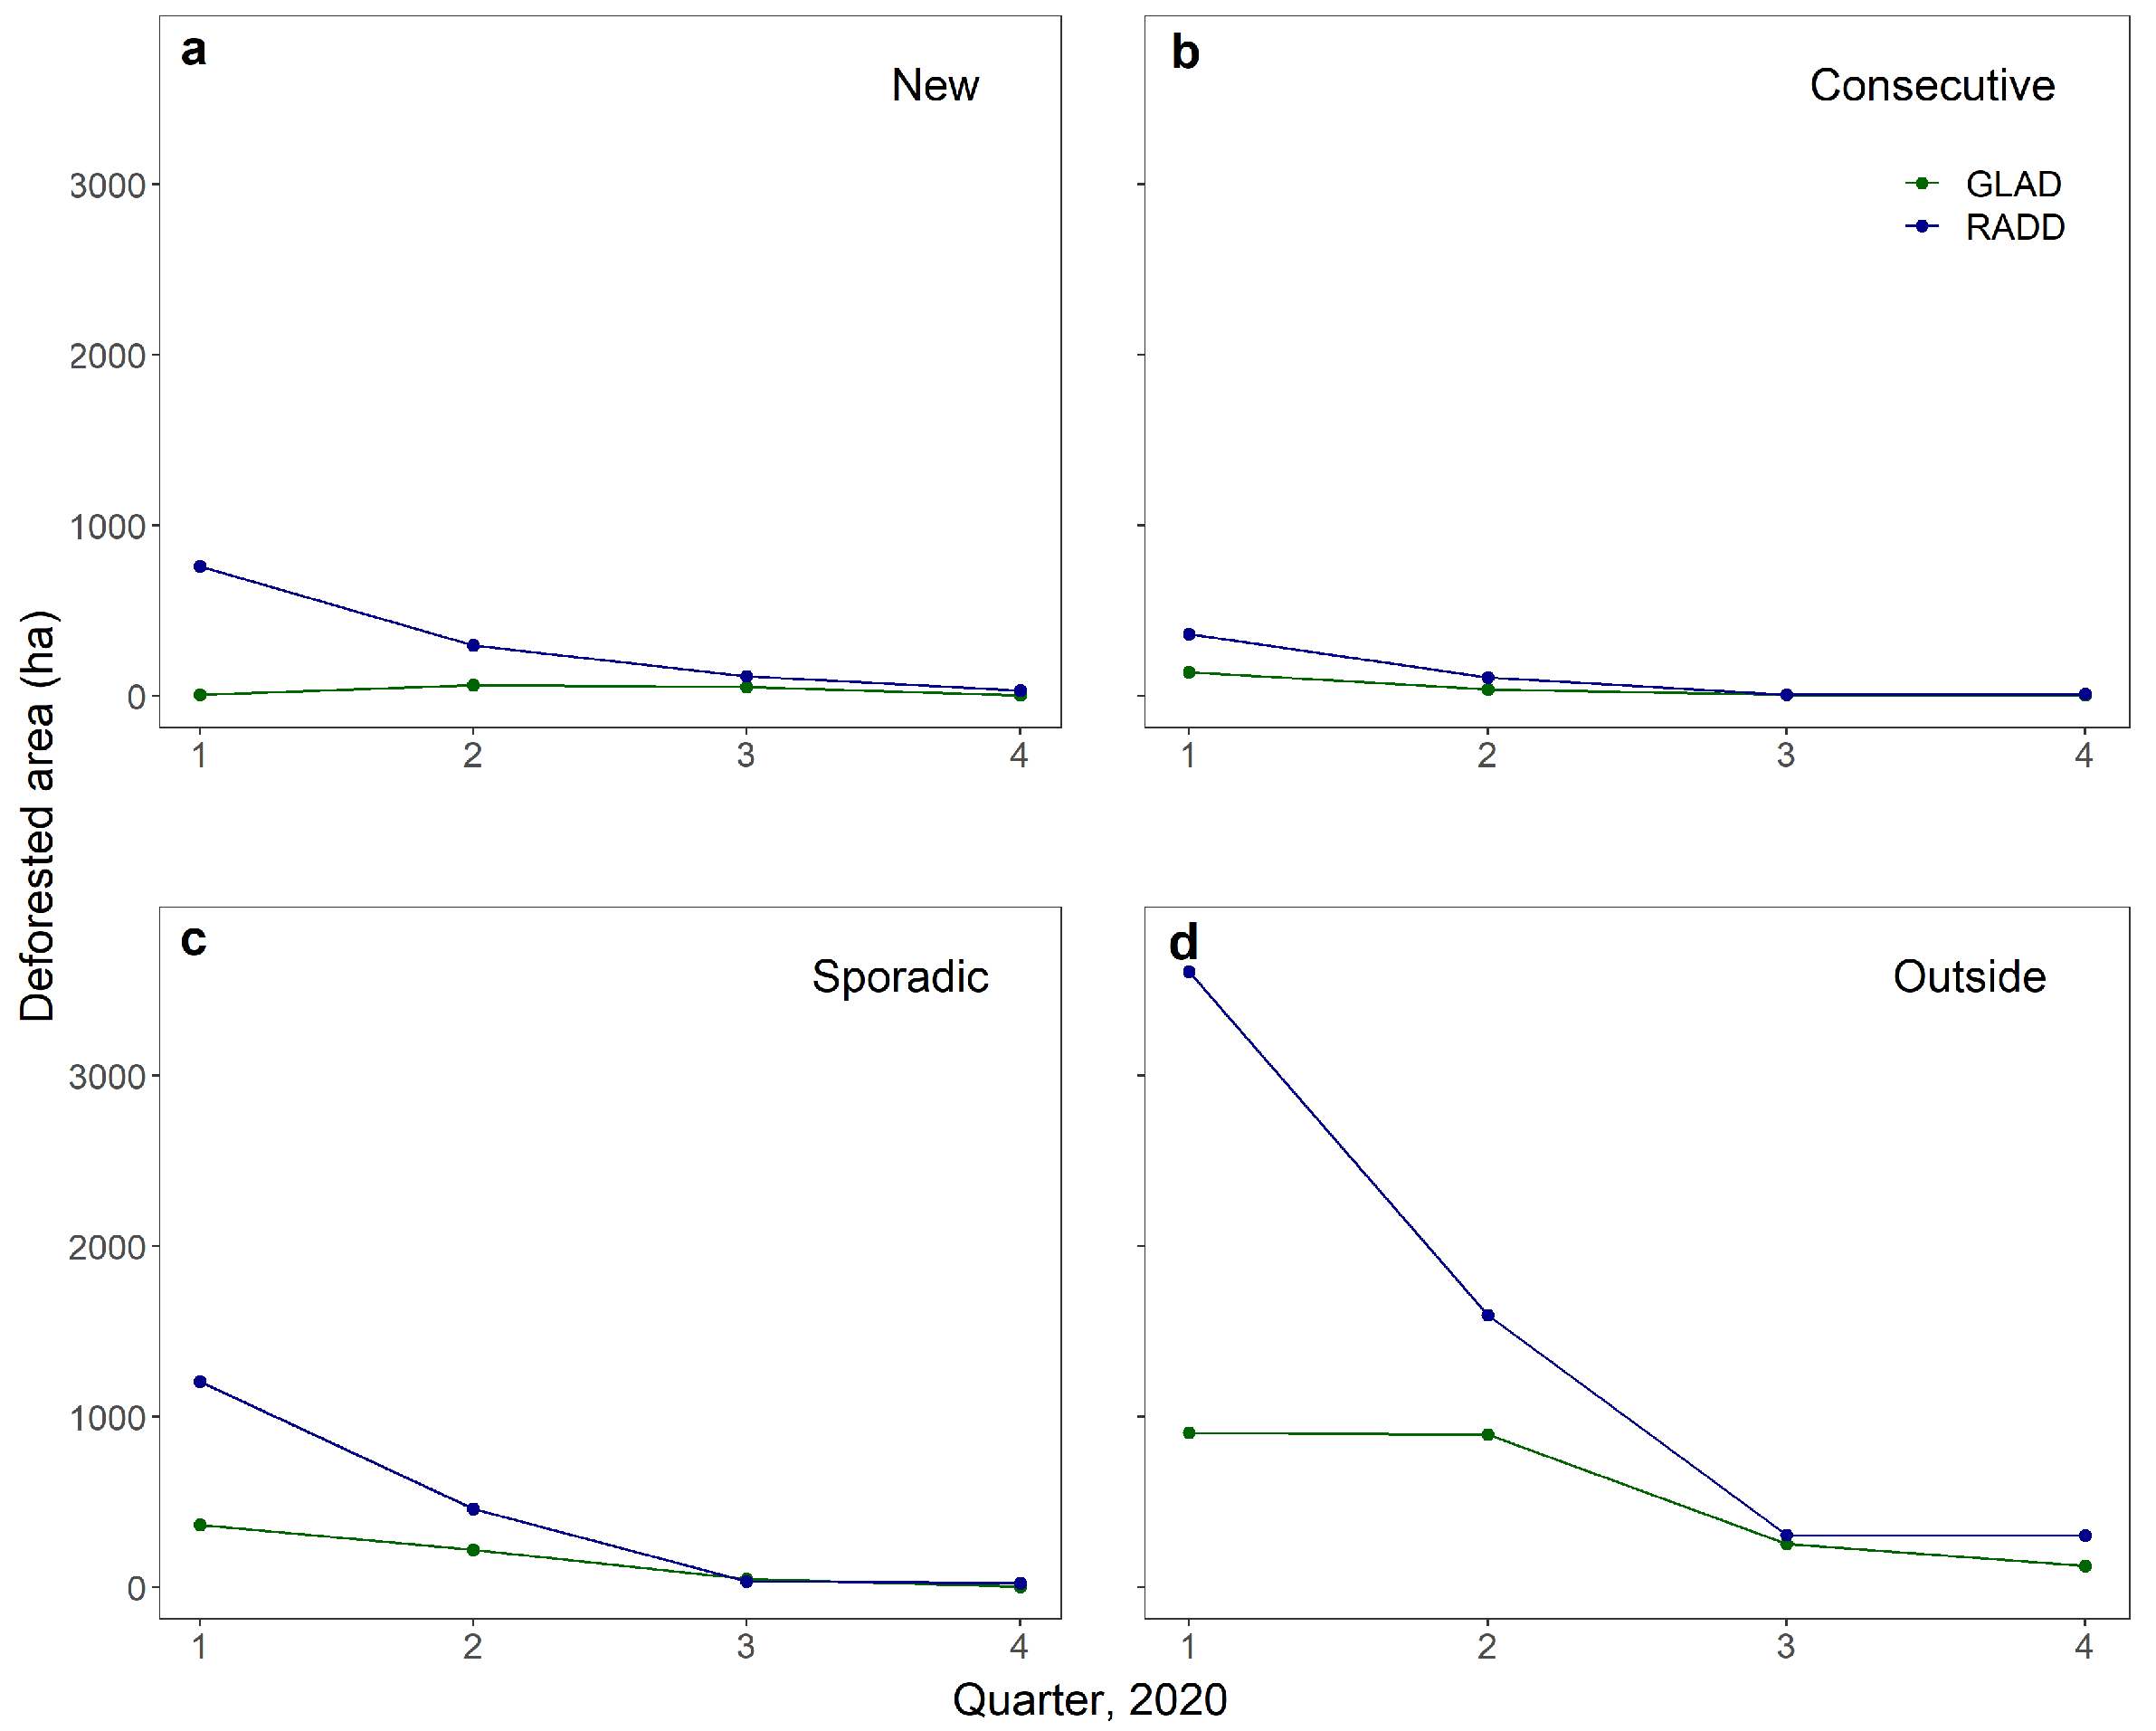
3.2. Deforestation in the Year 2020

The deforestation analysis in 2020 is shown in Figure 5a as cumulative deforested areas per week (default temporal resolution of the alert products) together with its monthly aggregates in Figure 5b. Overall, the highest deforestation was recorded in dry months from February to May (peak in April) resulting in a sharp increase in cumulative deforestation. This trend gradually decreased afterward and hit the lowest alerts around October only to increase again until March 2021, hence suggesting a seasonal trend.
There was a slight difference in the trend between the two alert products. While both had their highest detection in February and April, the RADD alerts were relatively higher at the beginning of the year. These alert pixels can be the forest loss pixels in the late months of 2019 that were not accounted for when the forest mask used for RADD was created. The GLAD alerts fluctuated from August to October, which can be late confirmations of earlier disturbances i.e., in June as the start of the wet (and cloudy) season. In May and July, the GLAD alerts were slightly higher than the RADD alerts.
For the quarterly summary of deforested areas (Figure 6), aside from the higher detection by RADD, we found two key observations. First is the highest deforestation between the 1st and 2nd quarter of 2020 both in forest areas identified as hotspots (92–94%) and forests that are non-hotspots (87–89%), with the exception of the GLAD alerts inside new hotspots. Second is the relatively higher alerts outside hotspots (53–76% of all alerts), which are likely those small deforested areas scattered all over the study area.
Spatial patterns were also observed in the development of hotspots within the year. The example shown in Figure 7 shows that sporadic hotspots increased by 400 ha from 1st to 2nd quarter in 2020, going uplands and within the borders of the primary forests, see Figure 7a,b. This is also depicted in Figure 7c,d where the actual conversion indicates that these hotspots are likely to be driven by slash-and-burn farming judging by the soil color. Another example of hotspot development (500-ha increase from 1st to 3rd quarter) is shown in Figure 8 where landslides are the main driver of deforestation in the mountainous and forested parts of northern Sierra Madre. Strong typhoons also passed through the area in the 2nd and 3rd quarters of 2020. The example hotspots were found to overlap in different municipalities.

4. Discussion

4.1. Hotspot Mapping and Deforestation Detection

Our hotspot maps revealed that 79–81% of the hotspots overlap with the primary forests and around 27–29% are inside the declared protected areas. These hotspots are formed in clusters while some are scattered within the provinces’ forests. These numbers are alarming and relatively higher than the global hotspot map mainly due to the smaller spatial scale (hotspot pixel size) in this study, which is suited for local to regional analysis. Nevertheless, there is still a high overlap between our hotspot maps and the global hotspot particularly in the dense hotspots within Southern Palawan and Apayao mountains mainly driven by the same forest loss input (2000–2019) and hotspot mapping approach (EHA). The map producers of the global hotspot also advised adjusting the spatial scale of hotspot bins to preserve small hotspot patches for local-scale forest protection i.e., from 10 km to 1 km spatial bins [23]. Another study also used the same annual forest loss data and they revealed that protected areas inside Sierra Madre and Palawan experienced the highest forest loss rate from 2010 to 2012 [11]. Using again the loss data and a time series vegetation index, the continuity and severity of deforestation in Sierra Madre were reported to cause a net forest loss even if the potential forest gains from the national reforestation program in 2011 are accounted [13].
Because of the alert products, 57–189 new hotspots (in 2020) and 765–802 consecutive (recent years) hotspots were revealed; while the rest are sporadic hotspots (on-and-off from 2000 to 2020), which would be unidentified without the annual loss data. Though forest loss was reported to be increasing from 2017 to 2019 [13], the relatively high number of new (and consecutive) hotspots could also be linked to the higher deforestation pixels provided by alert products compared to the annual loss pixels. It was reported that the 2000–2019 GFC forest loss may underestimate the actual forest loss in a given year, particularly in the tropics [36]. This potential omission error (missed detection) is mainly caused by the limitation of optical satellites to secure cloud-free images over large scales within the year as well as the inability of the product to detect small-scale disturbances [36]. This limitation can also be the reason for the higher number of hotspots detected when using RADD (radar) compared to GLAD (optical). Such comparison was demonstrated in Congo where higher detection was reported using the radar-based system in comparison with GLAD and the GFC loss data [33] and in Peru when also considering forest edges to detect deforestation [37]. Though it was reported also that the early 2020 RADD alerts in Asia may be overestimated due to the forest baselining of the RADD product [33]. On the other hand, there can still be potential commission errors (false positives) for an alert product since they detect losses based on single-date images instead of image composites [21]. Nevertheless, both (high-confidence) alert products would be useful for future hotspot mapping i.e., GLAD alerts in areas outside primary forests, where radar signals decrease in sensitivity e.g., flooded forest, mangroves and peatlands. The complementation of the two alerts can be further explored using their average for a conservative estimate of deforestation and hotspots.
Those deforested areas unclassified as hotspots (53–76% in 2020) are likely deforestation events that are small and less intensive within a 100 ha spatial scale (the hotspot bin size). A prominent example is selective logging in selected small forest areas to supply domestic needs of lumber. Moreover, upland farmers routinely practice slash-and-burn (locally known as Kaingin) and charcoal making in several small areas, often practiced as a household effort and have been increasing due to upland migration [38]. Technically, the classification of the deforestation pixels as non-hotspot is also due to the EHA itself. The hotspot mapping algorithm only looks for statistically significant hotspots relative to the whole forest area, where most are still naturally protected because of inaccessibility at the very least. The local statistics in a highly disturbed area with a size of 100 ha would be very different from the global statistic (study area), e.g., dense deforested pixels from large landslides were classified as new hotspots while Kaingin areas by households belonged to non-hotspots. Many deforested pixels would be unclassified as hotspots once the hotspot bin size increases. See Figure A1 for omitted hotspots when increasing the hotspot size to 1000 ha instead of 100 ha. The hotspot algorithm also considers the longevity of forest disturbance and those areas with dense disturbances in limited time, e.g., 1–3 years (except recent years) would likely be statistically insignificant and hence non-hotspot. Potential examples of this case would be the conversion of forests to oil palms and surface mining in Palawan.

4.2. Deforestation in the Year 2020

A clear seasonal trend of deforestation was observed in 2020, highest from February to May of the year (peak in April). That period is also the time of slash-and-burn season as verified by the key informants from environmental task force members at the sub-municipal (barangay) level. They further shared that aside from Kaingin and charcoal making, timber poaching still exists. Although the informants also mentioned that loss of jobs during the COVID-19 lockdown has driven the increase of deforestation i.e., halt of eco-tourism in the case of Palawan, and since most people (including forest rangers) were prohibited outside their houses, attributing the increase of deforestation due to the lockdown would need a separate analysis. Once GLAD alerts from 2015 are made publicly available, we would assess whether the spike from 1st to 2nd quarter in 2020 is statistically significant. Nevertheless, we summarized online reports that deforestation existed in 2020 in Table A1. Six published news online reported illegal activities from different parts of the study area, consistent with the information from local experts.
The deforestation in 2020 hints that previously deforested areas in recent years have been expanding as evident in the high number of consecutive hotspots. A recent study used GLAD alerts to conduct an inter-country comparison of deforestation in 2020 and it was concluded that the continuation of deforestation from 2019 to 2020 is a more reasonable root cause of the 2020 deforestation statistics than the pandemic lockdown effect [39].

4.3. The Usefulness of the Hotspot Maps

The quarterly maps of hotspots can be helpful to guide the necessary interventions, depending on the kind of hotspot and their drivers since each driver can have different spatial and temporal patterns [40]. While the sporadic hotspots reasonably consist of mostly Kaingin areas due to the cyclic nature of such practice, the consecutive hotspots, as recently mentioned, can be signs that these cultivated lands are encroaching, likely a consequence of upland migration and high crop yield demands [38]. Similarly, those new hotspots that would exist as a single 1-km pixel (without neighboring pixels) would likely appear in places nearby the first single pixel as an indication of selective logging. This kind of illegal logging is an organized mission by poachers that extends from weeks to months until the target quota of logs is reached and would result in forest degradation [28]. The new hotspots found mostly in Sierra Madre and Apayao (see Figure 3) are formed mostly from landslide scars, reasonably because these regions are mountainous and within typhoon belts. The hotspots in Southern Palawan are mainly sporadic and consecutive, suggesting that deforestation is mainly Kaingin-related as such practice has been a persistent livelihood source in the province for decades [41].
Consider these hotspots an early warning so authorities would know where and when to intervene—which saves time and resources—instead of considering all deforestation pixels. First, the new hotspots mostly from landslides during typhoon months are valuable to the government in the context of disaster risk reduction and management (DRRM) and landslide rehabilitation. Here we provide the first provincial-scale information about the severity of landslides after typhoons. Secondly, potential new hotspots attributed to illegal selective logging should be given priority in forest protection. Several teams can be deployed to monitor strategic checkpoints and other potential transport routes of the logs with regard to the hotspot location. Hotspots sometimes extend over two municipalities so local coordination is of utmost importance for mobility and security reasons. The use of high-technology forest protection tools such as the Lawin app and flying of Unmanned Aerial Vehicles (UAV) for surveillance are additional options given the inaccessibility of these timber poaching zones. Thirdly, the slash-and-burn practice has been a challenge for the past three decades and is still very far from its ideal transition to sustainable farming. Those kaingeros responsible for any identified large and expanding kaingin areas should be the priority recepients of any upland livelihood programs. Lastly, any new hotspots related to mining should be closely monitored now more than ever because of the recent Executive Order 130 of the government that would allow new mining explorations and permits. The impact of any interventions can be evaluated during the quarterly assembly of multi-stakeholder environmental bodies. Evaluations should be in line with the anticipated forest gains from the existing national reforestation program to determine whether such program would indeed result into a net forest gain [13].
The number of hotspots inside protected areas and primary forests are key inputs to Forest Land Use Plans of municipalities. A similar spatial analysis of hotspots with and without tenurial instruments can also be initiated, particularly those under the management of upland communities.

4.4. Updating of the Hotspot Maps

Since our mapping workflow is mostly automated and reproducible, we can efficiently update and modify hotspot maps if the need arises, i.e., adjust time intervals per wet and dry season or modify the 2000 forest baseline. The same routine where alert products are used only in the latest year (e.g., 2021) will be applied for future hotspot maps. We can also produce mangrove deforestation hotspots given a time series mangrove extent input. Similarly, forest degradation hotspots would need to be further integrated into our current hotspot mapping by preserving the RADD alerts’ spatial resolution while resampling the GFC and GLAD data to 10 m, and further adjusting the hotspot size from 1 km to 250–500 m. This, however, would still not account for the disturbances undetected at 10 m pixel size (e.g., small trees for charcoal making) not unless an EO product of degradation alerts comes out or we use time series above-ground biomass as input to EHA instead.
Lastly, the validation of deforestation drivers by local experts especially for timber poaching zones can also be complemented by platforms such as GFW and Google Earth Pro to be more certain on the hotspot drivers (see Figure A2). This method of validation is even more promising now that Planet images with very high spatial and temporal resolution are reported to be available openly.

5. Conclusions

Quarterly deforestation hotspot maps in 2020 were created at 1 km pixel size using the Emerging Hotspot Analysis (EHA) and a time series input of deforestation data from Earth Observation products. The annual forest loss time series is useful to identify sporadic hotspots, likely slash-and-burn farming areas, while the forest disturbance alerts are helpful to reveal consecutive hotspots that indicate encroachment of these cultivated lands, and new hotspots formed mostly from landslide scars. Relating the hotspot classes to the deforestation drivers is best attained with the help of local experts e.g., validation of timber poaching zones. Hotspots solely driven by timber poaching (forest degradation) would be integrated into the next hotspot versions. Succeeding work for this may include the use of the EHA inputs with 10 m pixel size (instead of 30 m), creating smaller hotspot bins, and substituting the forest loss inputs with time series above-ground biomass. Regular updating and assessment of hotspot maps are expected to happen prior to or during the quarterly assembly of environmental institutions, with close attention to any potential hotspot caused by the anticipated new mining areas. Once local hotspots are identified, interventions can be more proactive in order to prohibit hotspot expansions, both preserving forest ecosystem services and government resources.

Author Contributions

Conceptualization, A.B.A.; methodology, A.B.A. and G.B.C.; formal analysis, all authors; data curation, A.B.A., E.D.B., J.R., Y.G.; writing—original draft preparation, A.B.A.; writing—review and editing, L.H., M.H., J.R., Y.G., M.G.Q.V., R.A.R.; resources, M.H.; All authors have read and agreed to the published version of the manuscript.

Funding

This advocacy paper received no external funding.

Data Availability Statement

Workflow and data can be accessed via: https://github.com/arnanaraza/defoPH.

Acknowledgments

The authors would like to thank the Forest Foundation Philippines and the local stakeholders in the study area for helping validate the deforestation drivers. This paper is dedicated to all Filipino forest rangers who died in service, and to our friend, the late Jun Sasuman, Municipal Environment and Natural Resources Officer of San Vicente, Palawan.

Conflicts of Interest

The authors declare no conflict of interest.

Appendix A

Figure A1. The comparison between 1 km (left) and 10 km (right) spatial sizes of hotspots. Spatial detail and local hotspots are preserved in the former which is suited for local enforcement of forest protection activities.
Forests 12 01008 g0a1

Appendix B

Table A1. List of news of reported illegal forest activities in the study area last year.
HeadlineMain DriverScaleNews DateSourceLink
Illegal logging continues in MIMAROPA despite Luzon lockdownSlash-and-burn; charcoal making; illegal loggingLocal, study area3 April 2020Inquirerhttps://www.rappler.com/nation/illegal-logging-continues-mimaropa-despite-luzon-lockdown
DENR seizes illegal logs in Central Luzon operationsIllegal loggingLocal, study area18 June 2020SunStarhttps://www.sunstar.com.ph/article/1860555/Pampanga/Local-News/DENR-seizes-illegal-logs-in-Central-Luzon-operations
Illegal logging in ‘protected areas’ persists during ECQIllegal loggingLocal, study area29 May 2020Business Mirrorhttps://businessmirror.com.ph/2020/05/29/illegal-logging-in-protected-areas-persists-during-ecq/
Authorities seize illegally cut logs in CagayanIllegal loggingLocal, study area10 September 2020Manila Bulletinhttps://mb.com.ph/2020/09/10/authorities-seize-illegally-cut-logs-in-cagayan/
PENRO names illegal logging hotspots in CagayanIllegal loggingLocal, study area12 October 2020Philippine Information Agencyhttps://pia.gov.ph/news/articles/1055748
Illegal mining in Cagayan due to lapses in law enforcement – PalaceMiningLocal, study area17 November 2020PressOnehttps://pressone.ph/illegal-mining-in-cagayan-due-to-lapses-in-law-enforcement-palace/
Bald strips on Cagayan Valley mountains show traces of illegal logging, says policeIllegal loggingLocal, study area20 November 2020MSNhttps://www.msn.com/en-ph/news/national/bald-strips-on-cagayan-valley-mountains-show-traces-of-illegal-logging-says-police/ar-BB1bcZLu
Global forest losses accelerated despite the pandemic, threatening world’s climate goalsIllegal logging, agricultural expansionGlobal30 March 2021Washington posthttps://www.washingtonpost.com/climate-environment/2021/03/31/climate-change-deforestation/
llegal logging in ‘protected areas’ persists during ECQIllegal loggingGlobal19 May 2020BBChttps://www.bbc.com/future/article/20200518-why-lockdown-is-harming-the-amazon-rainforest

Appendix C

Figure A2. An example landscape in Southern Palawan where the forests are lost due to a landslide event and slash-and-burn areas. The latter is more situated in foot slopes of mountain areas. The image comes from Google Earth Pro and its terrain functionality.
Forests 12 01008 g0a2

References

  1. Canadell, J.G.; Raupach, M.R. Managing Forests for Climate Change Mitigation. Science 2008, 320, 1456–1457. [Google Scholar] [CrossRef] [Green Version]
  2. Brookhuis, B.; Hein, L. The value of the flood control service of tropical forests: A case study for Trinidad. For. Policy Econ. 2016, 62, 118–124. [Google Scholar] [CrossRef]
  3. Ravenel, R.M.; Granoff, I.M.; Magee, C.A. Illegal Logging in the Tropics: Strategies for Cutting Crime; CRC Press: Boca Raton, FL, USA, 2005; Volume 19. [Google Scholar]
  4. Glastra, R. Cut and Run: Illegal Logging and Timber Trade in the Tropics; Idrc: Ottawa, ON, USA, 2014. [Google Scholar]
  5. Pendrill, F.; Persson, U.M.; Godar, J.; Kastner, T.; Moran, D.; Schmidt, S.; Wood, R. Agricultural and forestry trade drives large share of tropical deforestation emissions. Glob. Environ. Chang. 2019, 56, 1–10. [Google Scholar] [CrossRef]
  6. Sy, V.D.; Herold, M.; Achard, F.; Avitabile, V.; Baccini, A.; Carter, S.; Clevers, J.G.P.W.; Lindquist, E.; Pereira, M.; Verchot, L. Tropical deforestation drivers and associated carbon emission factors derived from remote sensing data. Environ. Res. Lett. 2019, 14, 094022. [Google Scholar] [CrossRef] [Green Version]
  7. Tapia-Armijos, M.F.; Homeier, J.; Espinosa, C.I.; Leuschner, C.; de la Cruz, M. Deforestation and Forest Fragmentation in South Ecuador since the 1970s—Losing a Hotspot of Biodiversity. PLoS ONE 2015, 10, e0133701. [Google Scholar] [CrossRef] [Green Version]
  8. Hansen, M.C.; Wang, L.; Song, X.P.; Tyukavina, A.; Turubanova, S.; Potapov, P.V.; Stehman, S.V. The fate of tropical forest fragments. Sci. Adv. 2020, 6, eaax8574. [Google Scholar] [CrossRef] [PubMed] [Green Version]
  9. Guiang, E.S. Impacts and effectiveness of logging bans in natural forests: Philippines. Chapter 2001, 4, 103–136. [Google Scholar]
  10. Boquet, Y. Environmental Challenges in the Philippines. In Springer Geography; Springer International Publishing: Berlin/Heidelberg, Germany, 2017; pp. 779–829. [Google Scholar] [CrossRef]
  11. Apan, A.; Suarez, L.A.; Maraseni, T.; Castillo, J.A. The rate, extent and spatial predictors of forest loss (2000–2012) in the terrestrial protected areas of the Philippines. Appl. Geogr. 2017, 81, 32–42. [Google Scholar] [CrossRef]
  12. Estoque, R.C.; Murayama, Y.; Lasco, R.D.; Myint, S.W.; Pulhin, F.B.; Wang, C.; Ooba, M.; Hijioka, Y. Changes in the landscape pattern of the La Mesa Watershed—The last ecological frontier of Metro Manila, Philippines. For. Ecol. Manag. 2018, 430, 280–290. [Google Scholar] [CrossRef]
  13. Perez, G.J.; Comiso, J.C.; Aragones, L.V.; Merida, H.C.; Ong, P.S. Reforestation and Deforestation in Northern Luzon, Philippines: Critical Issues as Observed from Space. Forests 2020, 11, 1071. [Google Scholar] [CrossRef]
  14. Chowdhury, R.R. Driving forces of tropical deforestation: The role of remote sensing and spatial models. Singap. J. Trop. Geogr. 2006, 27, 82–101. [Google Scholar] [CrossRef]
  15. Lynch, J.; Maslin, M.; Balzter, H.; Sweeting, M. Choose satellites to monitor deforestation. Nature 2013, 496, 293–294. [Google Scholar] [CrossRef] [Green Version]
  16. Tanase, M.A.; Ismail, I.; Lowell, K.; Karyanto, O.; Santoro, M. Detecting and Quantifying Forest Change: The Potential of Existing C- and X-Band Radar Datasets. PLoS ONE 2015, 10, e0131079. [Google Scholar] [CrossRef] [PubMed]
  17. Reiche, J.; Hamunyela, E.; Verbesselt, J.; Hoekman, D.; Herold, M. Improving near-real time deforestation monitoring in tropical dry forests by combining dense Sentinel-1 time series with Landsat and ALOS-2 PALSAR-2. Remote Sens. Environ. 2018, 204, 147–161. [Google Scholar] [CrossRef]
  18. Hansen, M.C.; Potapov, P.V.; Moore, R.; Hancher, M.; Turubanova, S.A.; Tyukavina, A.; Thau, D.; Stehman, S.V.; Goetz, S.J.; Loveland, T.R.; et al. High-Resolution Global Maps of 21st-Century Forest Cover Change. Science 2013, 342, 850–853. [Google Scholar] [CrossRef] [Green Version]
  19. Vieilledent, G.; Grinand, C.; Rakotomalala, F.A.; Ranaivosoa, R.; Rakotoarijaona, J.R.; Allnutt, T.F.; Achard, F. Combining global tree cover loss data with historical national forest cover maps to look at six decades of deforestation and forest fragmentation in Madagascar. Biol. Conserv. 2018, 222, 189–197. [Google Scholar] [CrossRef]
  20. Hansen, M.C.; Krylov, A.; Tyukavina, A.; Potapov, P.V.; Turubanova, S.; Zutta, B.; Ifo, S.; Margono, B.; Stolle, F.; Moore, R. Humid tropical forest disturbance alerts using Landsat data. Environ. Res. Lett. 2016, 11, 034008. [Google Scholar] [CrossRef]
  21. Moffette, F.; Alix-Garcia, J.; Shea, K.; Pickens, A.H. The impact of near-real-time deforestation alerts across the tropics. Nat. Clim. Chang. 2021, 11, 172–178. [Google Scholar] [CrossRef]
  22. Reddy, C.S.; Pasha, S.V.; Jha, C.; Diwakar, P.; Dadhwal, V. Development of national database on long-term deforestation (1930–2014) in Bangladesh. Glob. Planet. Chang. 2016, 139, 173–182. [Google Scholar] [CrossRef]
  23. Harris, N.L.; Goldman, E.; Gabris, C.; Nordling, J.; Minnemeyer, S.; Ansari, S.; Lippmann, M.; Bennett, L.; Raad, M.; Hansen, M.; et al. Using spatial statistics to identify emerging hot spots of forest loss. Environ. Res. Lett. 2017, 12, 024012. [Google Scholar] [CrossRef]
  24. Gandhi, S.; Jones, T. Identifying Mangrove Deforestation Hotspots in South Asia, Southeast Asia and Asia-Pacific. Remote Sens. 2019, 11, 728. [Google Scholar] [CrossRef] [Green Version]
  25. Jardeleza, J.M.; Gotangco, C.K.; Guzman, M.A.L. Simulating National-scale Deforestation in the Philippines Using Land Cover Change Models. Philipp. J. Sci. 2019, 148, 597–608. [Google Scholar]
  26. Sanchez-Cuervo, A.M.; Aide, T.M. Identifying hotspots of deforestation and reforestation in Colombia (2001–2010): Implications for protected areas. Ecosphere 2013, 4, art143. [Google Scholar] [CrossRef]
  27. Watch, G.F. Global Forest Watch; World Resources Institute: Washington, DC, USA, 2002; Available online: http://www.globalforestwatch.org (accessed on 1 March 2021).
  28. van der Ploeg, J.; Masipiqueña, A.; van Weerd, M.; Persoon, G. Illegal logging in the Northern Sierra Madre Natural Park, the Philippines. Conserv. Soc. 2011, 9, 202. [Google Scholar] [CrossRef]
  29. Phil-WAVES. Philippines: WAVES Country Report 2016; Technical Report; The World Bank Group: Washington, DC, USA, 2016. [Google Scholar]
  30. Turubanova, S.; Potapov, P.V.; Tyukavina, A.; Hansen, M.C. Ongoing primary forest loss in Brazil, Democratic Republic of the Congo, and Indonesia. Environ. Res. Lett. 2018, 13, 074028. [Google Scholar] [CrossRef] [Green Version]
  31. Finer, M.; Novoa, S.; Weisse, M.J.; Petersen, R.; Mascaro, J.; Souto, T.; Stearns, F.; Martinez, R.G. Combating deforestation: From satellite to intervention. Science 2018, 360, 1303–1305. [Google Scholar] [CrossRef] [PubMed]
  32. Galiatsatos, N.; Donoghue, D.N.; Watt, P.; Bholanath, P.; Pickering, J.; Hansen, M.C.; Mahmood, A.R. An Assessment of Global Forest Change Datasets for National Forest Monitoring and Reporting. Remote Sens. 2020, 12, 1790. [Google Scholar] [CrossRef]
  33. Reiche, J.; Mullissa, A.; Slagter, B.; Gou, Y.; Tsendbazar, N.E.; Odongo-Braun, C.; Vollrath, A.; Weisse, M.J.; Stolle, F.; Pickens, A.; et al. Forest disturbance alerts for the Congo Basin using Sentinel-1. Environ. Res. Lett. 2021, 16, 024005. [Google Scholar] [CrossRef]
  34. UNFCCC. Part two: Action taken by the Conference of the Parties. Volume II. In Proceedings of the Conference of the Parties on its Seventh Session, Marrakesh, Morocco, 29 October–10 November 2001. [Google Scholar]
  35. Ord, J.K.; Getis, A. Local Spatial Autocorrelation Statistics: Distributional Issues and an Application. Geogr. Anal. 2010, 27, 286–306. [Google Scholar] [CrossRef]
  36. Milodowski, D.T.; Mitchard, E.T.A.; Williams, M. Forest loss maps from regional satellite monitoring systematically underestimate deforestation in two rapidly changing parts of the Amazon. Environ. Res. Lett. 2017, 12, 094003. [Google Scholar] [CrossRef] [Green Version]
  37. Bouvet, A.; Mermoz, S.; Ballère, M.; Koleck, T.; Toan, T.L. Use of the SAR Shadowing Effect for Deforestation Detection with Sentinel-1 Time Series. Remote Sens. 2018, 10, 1250. [Google Scholar] [CrossRef] [Green Version]
  38. Suarez, R.K.; Sajise, P.E. Deforestation, swidden agriculture and Philippine biodiversity. Philipp. Sci. Lett. 2010, 3, 91–99. [Google Scholar]
  39. Saavedra, S. Is Global Deforestation Under Lockdown? 2020. Available online: https://papers.ssrn.com/sol3/papers.cfm?abstract_id=3668029 (accessed on 1 March 2021).
  40. Etter, A.; McAlpine, C.; Phinn, S.; Pullar, D.; Possingham, H. Characterizing a tropical deforestation wave: A dynamic spatial analysis of a deforestation hotspot in the Colombian Amazon. Glob. Chang. Biol. 2006, 12, 1409–1420. [Google Scholar] [CrossRef]
  41. Dressler, W.; Pulhin, J. The shifting ground of swidden agriculture on Palawan Island, the Philippines. Agric. Hum. Values 2009, 27, 445–459. [Google Scholar] [CrossRef]
Figure 1. Study area map showing the Philippines as inset and the provincial boundaries of Palawan, Apayao, and several provinces within the Sierra Madre mountain range. The overview of the country’s primary forest in 2019 (derived from the method of [30]) and the state-declared protected areas are also shown.
Forests 12 01008 g001
Figure 2. Four main steps of the study.
Forests 12 01008 g002
Figure 3. Hotspot maps that consider the 2000–2020 deforestation events derived from the deforestation data. Both maps use 2000–2019 forest loss data. (a) map uses RADD alerts as the 2020 input, while (b) substitutes the former with GLAD alerts. The base map is the primary forest extent in 2019 used to mask the alert products and the protected areas.
Forests 12 01008 g003
Figure 4. Hotspots in protected areas (PAs) and outside PAs (non-PAs) per province for both hotspot maps using GLAD and RADD alerts in 2020.
Forests 12 01008 g004
Figure 5. The summary of the alert products for both RADD and GLAD products in 2020 and early 2021. (a) shows the cumulative deforested area at least every week, while (b) shows the monthly sum. Large gap in the accumulated deforestation is driven by the relatively high RADD alerts in the first few months.
Forests 12 01008 g005
Figure 6. Quarterly summary of the deforested areas in 2020 for pixels inside and outside the hotspots. (ac) pertain to those alerts inside new, consecutive and sporadic hotspots while (d) are those alerts outside hotspots (non-hotspots).
Forests 12 01008 g006
Figure 7. A sample hotspot development using the GLAD alerts in 2020 driven by slash-and-burn and overlapping several municipalities in Apayao province. The 1st and 2nd quarter hotspot maps are shown in (a,b) while (c,d) show the actual landscape in mid-2019 and mid-2020, respectively (images from Google Earth Pro).
Forests 12 01008 g007
Figure 8. Another sample hotspot development this time using RADD alerts in 2020 within Sierra Madre (Ilagan, Isabela). After three quarters in (a,b), two typhoons have passed through this land area: May (typhoon Ambo) and August (typhoon Helen). See (c,d) for before (2017) and after (July 2020) actual images of the landscape to emphasize the deforestation from landslides (images from Google Earth Pro).
Forests 12 01008 g008
Table 1. Deforestation datasets we used and their key details including their spatial and temporal properties, brief methodology, references and data download link.
EO ProductSpatial Resolution (m)Temporal CoverageFrequency of UpdateDescriptionReferenceAccess Link
GFC forest loss302001–20191–2 yearsUses a collection of Landsat 7 and 8 images and a supervised classification algorithm to detect possible forest cover loss when a previously tree cover (5 m tall) is disturbed by anthropogenic and natural factors[20]http://earthenginepartners.appspot.com/science-2013-global-forest (accessed on 1 March 2021)
GLAD alerts302020–20217 daysDeforestation alert in near-real time that uses pre-processed and quality-checked Landsat 7 and 8 bands and their vegetation indices to determine whether changes in new images are >50% probable in comparison with the previous three years[18]http://glad-forest-alert.appspot.com/ (accessed on 1 April 2021)
RADD alerts102020–20216–12 daysNear-real time deforestation alerts produced using a probability-based detection method applied to a time series of Sentinel 1 images in the humid tropics every 6–12 days[33]http://radd-alert.wur.nl; https://nrtwur.users.earthengine.app/view/raddalert (accessed on 1 April 2021)
Table 2. Hotspot classes and their description. The time step represents 2001–2020 years (2001–2019 = GFC loss data; 2020 = alert products). The x rows depict “statistical significance of deforestation” per year or simply those classified by EHA as a “hotspot”.
ClassDescriptionTime Step (Years)
1234567891011121314151617181920
New1-km hotspot bins that are statistically significant (>95%) only in 2020 x
Consecutive1-km hotspot bin that are statistically significant (>95%) only in recent years xxx
Sporadic1-km hotspot bins with discontinuity in statistical significance over the years (on-and-off hotspot)x xx xx x xx
Persistent1-km bins with statistical significance in 18 out of 20 yearsxxxxxxxxxx xxxxx xxx
IntensifyingSame with persistent but recent years have increasing deforestationx xxxxxxxxxxxxxxxxx
Non-hotspot1-km hotspot bin without statistical significance in the past 2 decades
Table 3. The number of hotspot classes and their % overlap in 2019 primary forests and protected areas (PAs) for both hotspot maps that use RADD and GLAD alerts.
Hotspot ClassCount% Inside Primary Forest% Inside PAs
GLADRADDGLADRADDGLADRADD
New571891001007240
Consecutive76580272732526
Sporadic1156125582832729
Total1978224679812729
Publisher’s Note: MDPI stays neutral with regard to jurisdictional claims in published maps and institutional affiliations.

