Article

Analysis of Imaging Internal Defects in Living Trees on Irregular Contours of Tree Trunks Using Ground-Penetrating Radar

1
School of Technology, Beijing Forestry University, Beijing 100083, China
2
Joint International Research Institute of Wood Nondestructive Testing and Evaluation, Beijing Forestry University, Beijing 100083, China
3
Beijing Summer Palace Management Office, Beijing 100091, China
4
China State Key Laboratory of Environmental Criteria and Risk Assessment, Chinese Research Academy of Environmental Sciences, Beijing 100012, China
*
Author to whom correspondence should be addressed.
Submission received: 11 June 2021 / Revised: 25 July 2021 / Accepted: 27 July 2021 / Published: 29 July 2021

Abstract

:
The outer contours of living trees are often considered as a standard circle during non-destructive testing (NDT) of internal defects using ground-penetrating radar (GPR). However, the detection of classical cross-sections (circular) lacks consideration of irregular contours, making it difficult to accurately locate the radar image of the target. In this paper, we propose a method based on the image affine transformation and the Riemann mapping principle to analyze the effect of irregular detection routes on the geometric characteristics of target reflection hyperbola. First, for the similar output phenomenon in the “hyperbola fitting”, geometric analysis and numerical simulation were performed. Then, the conversion of irregular trunk radar images and physical domain radar images was implemented using the method of image affine transformation and the Riemann mapping principle. Finally, the influence of irregular detection routes on the geometry of the target reflection curve was investigated in detail through numerical simulations and actual experiments. The numerical simulation and measurement results demonstrated that the method in this study could better reflect the imaging characteristics of the target reflection hyperbola under the irregular detection pattern. This method provides assistance to further study the defects of irregular living trees and prevents the misjudgment of targets as a result of hyperbolic distortion, resulting in a greater prospect of application.

1. Introduction

Living trees, which are precious forestry resources and valuable cultural heritage, are easily decayed and collapsed due to years of external aggression, causing serious casualties and irreversible cultural losses. To avoid damage to valuable trees, non-invasive methods are used to detect early defects, as they generally occur in the center of the wood and cannot be accurately monitored and measured from the outside [1]. At present, methods of non-destructive testing (NDT) are commonly used, such as electromagnetic wave detection [2], stress wave detection [3], infrared thermography [4], ultrasonic detection [5], microwave tomography [6,7], etc. Ground-penetrating radar (GPR), as an efficient, non-polluting, and safe NDT method, has great potential not only in the estimation of root parameters [8] but also in the health assessment of defects in the internal part of the tree trunk. The internal structure of the wood can be effectively assessed using GPR to detect the internal part of the tree trunk [9], achieving the preservation of historic trees and ancient timber structures [10]. Ježová et al. [11] investigated the properties of radar images of tree trunks using perimeter data as a geometric cross-section of the trunk and illustrated the total internal reflection (TIR) phenomenon. Wen et al. [12] proposed a method to locate the internal defects of living trees, combining the relative position with the point cloud data of the external contour of the trees, and designed software for the analysis of the internal structure of living trees based on radar waves. The majority of current studies consider trees as regular cylinders. However, the vast majority of trees in nature are irregular cylinders. To address this phenomenon, Giannakis et al. [13] proposed a scheme for the detection of internal targets by GPR along irregularly shaped closed curves. It was found that the radar reflection curve of the targets was not a typical hyperbolic curve but a very complex shape.
As tree radar detects along irregular outer contours, it can be seen as detecting on a rough interface. Researchers have studied the effect of the scan path on radar imaging of anomalies within layered media, including multi-target tracking of urban terrain [14] and underground pipelines [15], internal structure detection of landmines [16], archaeological investigations [17], etc. These studies have revealed that the reflected signal of the received target includes not only the target echoes [18] but also strong reflection on rough and uneven surfaces. Estimating the rough surface contour can eliminate clutter interference from the target, allowing more accurate target identification and imaging. Scattering from rough surfaces with laminar structures has been calculated using the method of Finite Difference Time Domain (FDTD) [19,20]. It was found that the shape of the echo of the upper surface was always the same as the contour of the rough surface, regardless of the change in roughness. The direct and backward scattering of a two-dimensional (2D) target under a rough surface was solved by the Buried Body Approach (BOA) [21]. Living trees are layered structures and include bark layers, sapwood layers, and heartwood layers, which can be considered as a rough interface. Therefore, the FDTD method can also be used to calculate the scattering from the rough surface of the living tree. For imaging internal defects of living trees with irregular contours in tree trunks using GPR, the influence of irregular external contours on the internal target reflection hyperbolic imaging also becomes a focus and can present significant difficulty. In recent years, image affine transformation technology has been successfully applied in the fields of medicine [22,23,24], agriculture [25], face recognition [26,27,28], remote sensing [29,30,31], radar detection [32,33], etc.; it has also been widely appreciated by forestry experts. Image affine transformation is a method to achieve image deformation by changing position, scale, angle, etc. In [28], Li proposed that 2D affine transformation can be expressed as a transformation of the original coordinates to the new coordinates; the original description is in [34]. The method of contour-based image affine transformation was proposed in [35,36]. The generalization of the Riemann mapping theorem has been profoundly influential [37]. The concept of angle-preserving transformations was introduced from mathematics by Sava [38] and Shragge [39] at Stanford University to transform physically undulating irregular surfaces into regular planes. The image of the irregularity of the physical undulation was obtained using the Riemann mapping theorem in reverse. Therefore, this study will combine these two methods to explore the effect of irregular detection paths of the radar images of target reflection curves.
This study discusses the phenomenon that using GPR to detect along the outer contours of irregular tree trunks can result in geometric distortion of the target reflection hyperbolic shape of defects in the interior of the trunk. First, the traditional hyperbolic imaging method was used to analyze in detail the reasons for hyperbolic distortion from both mathematical theory and geometric imaging. The effect of the irregular detection path on the hyperbolic geometry of the target was analyzed using numerical simulation of the target for the three non-horizontal interfaces. Then, the radar images of single or multiple targets under irregular detection paths (combinations of three detection boundaries) were investigated by image affine transformation techniques and Riemann mapping principles. The radar image of the irregular trunk and the radar image of the physical domain were obtained. Finally, the method was verified using standard specimen experiments and living tree experiments, providing evidence for further assessment of defects inside irregular living trees.

2. Theoretical Background

2.1. Imaging Principle on Target Reflection Curve Using GPR

GPR is an NDT technique commonly used for defect detection inside trees. The principle of the GPR system is based on the emission of nanosecond broadband signals towards the target research area. The electromagnetic wave (EM) propagates in different media until it appears as reflection and refraction phenomena, which is formed as a return signal. At present, most of the current studies on the internal defects of living trees have been based on the morphological characteristics of the target reflection hyperbola found in return signals. The traditional radar detection method regards the living tree as a regular cylinder. The radius is calculated from the measured circumference, and a circular contour is drawn to fit the actual trunk. The use of ground-penetrating radar to detect internal defects in living trees can be regarded as detection along the horizontal detection interface. The working principle of the radar and the target reflection pattern is shown in Figure 1. The transmitting antenna (T) transmits pulse waves, and the receiving antenna (R) receives reflected EM waves. The reflection curve of the target is hyperbolic [40] not only in the distance-depth images but also in the distance-time images. The distance-time image is a two-dimensional (2D) visualization mode of the GPR signal, also called a B-scan image. The hyperbolic equation [41,42] can be expressed as in Equation (1).
( t + 2 R v t 0 + 2 R v ) 2 ( ( x x 0 ) v 2 t 0 + R ) 2 = 1  
where t is two-way travel time, R is the radius of the target, v is the velocity of propagation and ( x 0 , t 0 ) are the coordinates of the target. Z = v / 2 , where Z is the apparent depth of the target reflection at position x displaced from the position of the target x 0 . Z 0 = v 0 2 , where Z 0 is the depth to the top of the target. Equation (1) is an equation of a hyperbola centered around ( x 0 , 2 R v ) .

2.2. Theoretical Basis of Hyperbolic Distortion

The contours of trees in nature are mostly irregular, and the traditional hyperbolic identification method in radar detection ignores the irregularity of the actual tree trunk contours. As it is known from the reflected images of internal defects detected by radar along irregular tree trunks, the relationship between the distance and time of the tree trunks is complex and highly dependent on the shape of the tree. Giannakis [13] studied and analyzed in detail the target reflection hyperbolas under the detection route of arbitrarily complex shapes. First, the coordinate transformation of the arbitrary detection interface (irregular detection interface) was discussed mathematically, and then the images of the arbitrary interface were simulated.

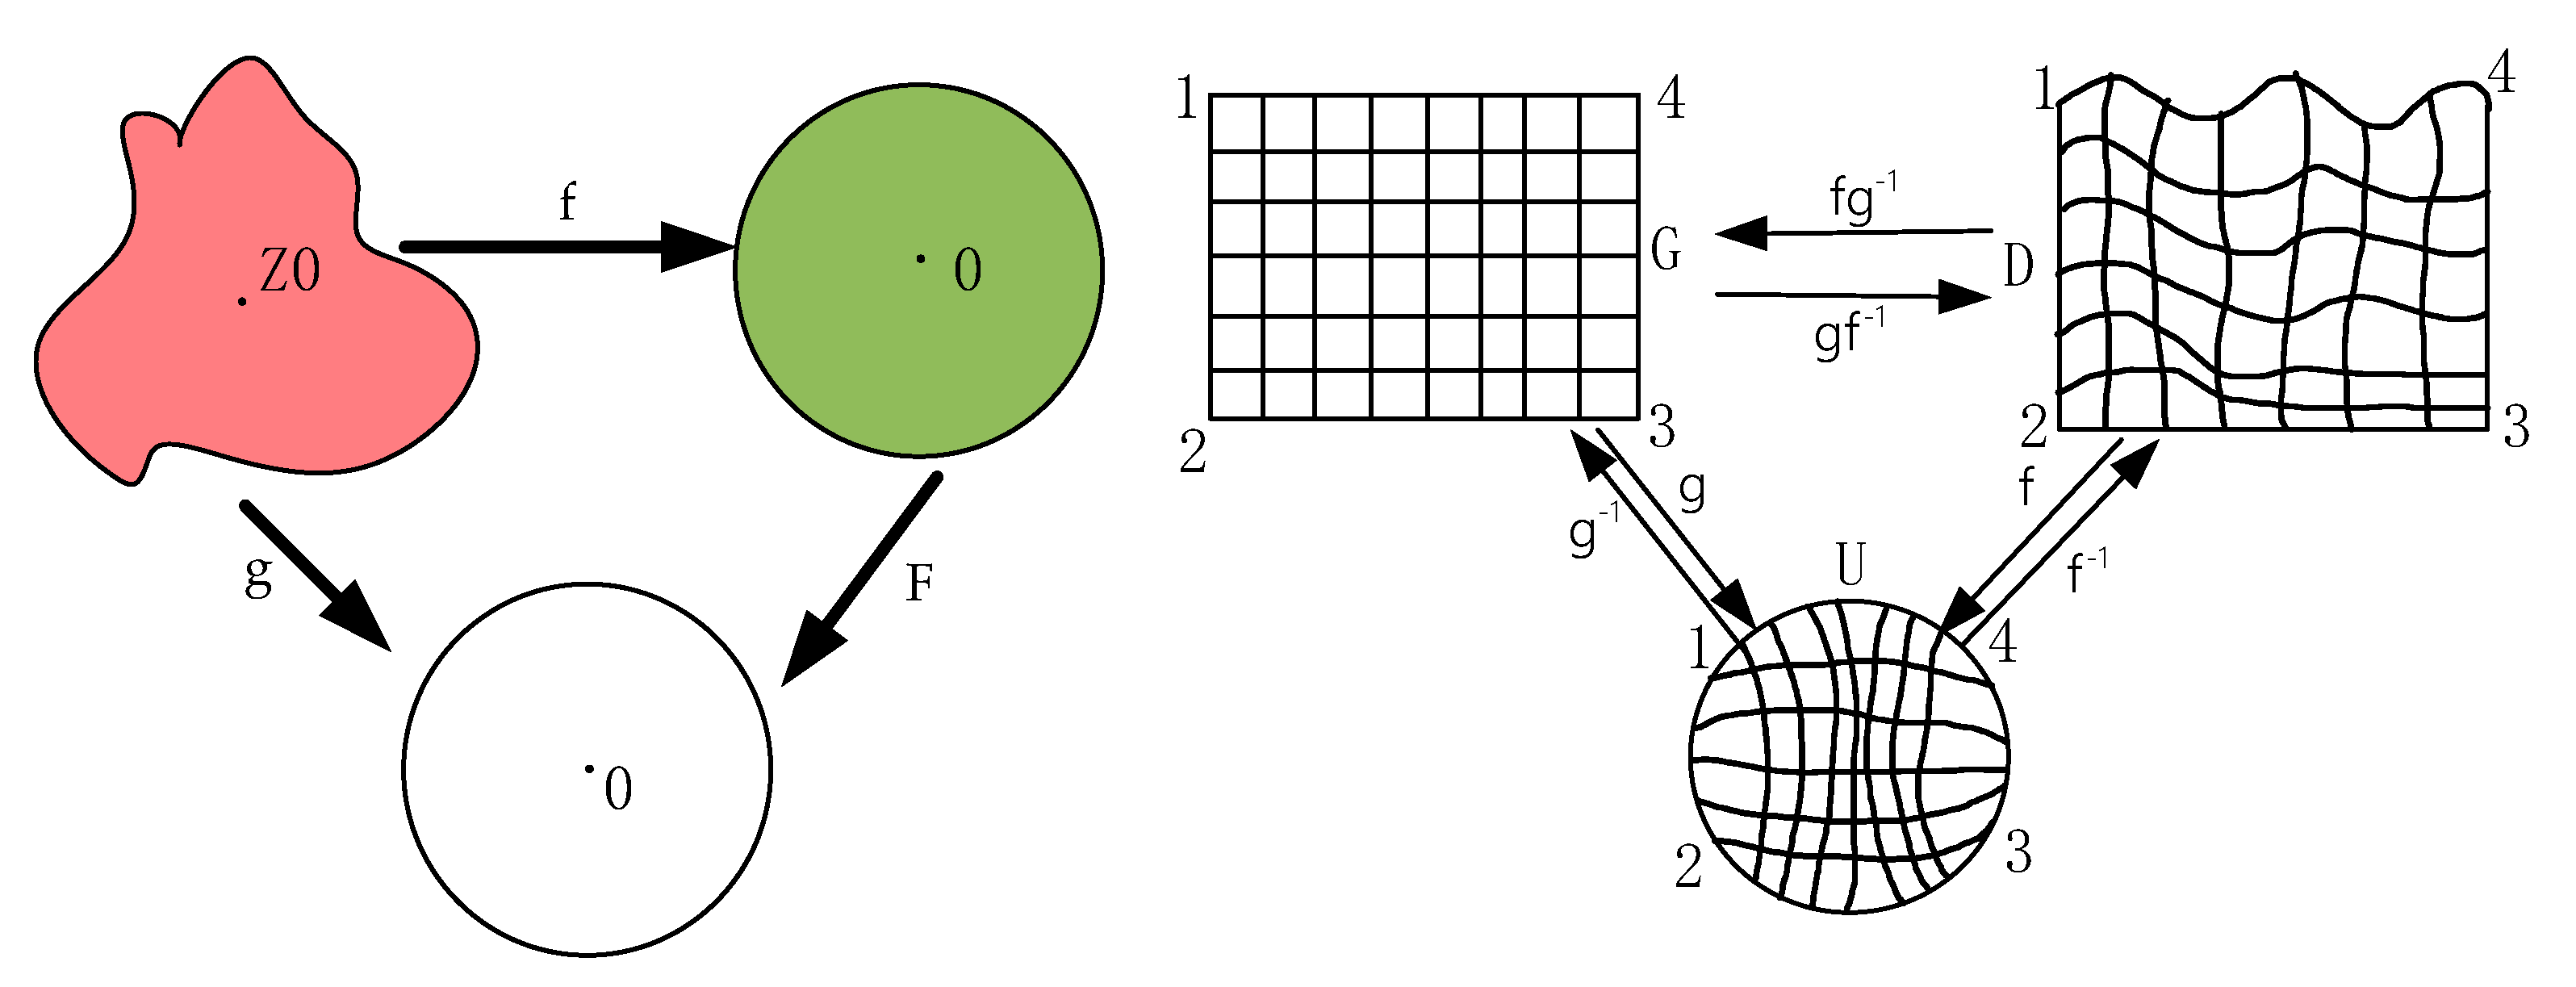
2.2.1. Transformation of Irregular Contours and Target Reflections into Coordinates

The coordinate transformation of the irregular detection interface is discussed based on the following steps. First, the x , y coordinates { x , y R n | x , y 0 } were obtained by arbitrary non-uniform discretization of the outer contour of the irregular trunk of arbitrary shape and stored in the vectors x R n and y R n [43,44]. The vector t = t 1 , t 2 , , t n   {t∈ R n |0 ≤ t i ≤ 1} was used to define the geometry of the outer contour of the irregular trunk. The variables of t increased linearly from zero to one in steps of 1 n , as shown in t = 0 , 1 / n , 2 / n , 1 . After that, the third-order polynomial functions P i ( t ) ,   Q i ( t ) [13] were obtained by mapping the vectors ( y , t ) and ( x , t ) , respectively, using the method of spline interpolation. The functions P i ( t ) , Q i ( t ) in Equations (2) and (3) are both polynomials of the third order.
P i ( t ) = A p , i t 3 + B p , i t 2 + C p , i t + D p , i , t [ t i , t i + 1 ]
Q i ( t ) = A q , i t 3 + B q , i t 2 + C q , i t + D q , i , t [ t i , t i + 1 ]
Thus, an arbitrarily complex shape was defined in a vector form as F = P ( t ) ,   Q ( t ) . The vector F was used to estimate the arc length of the irregular closed curve, as shown in Equation (3). The complex shape of the tree trunk was simulated using Equation (4).
S ( T ) = 0 T d F d t d t = 0 T ( d P ( t ) d t ) 2 + ( d Q ( t ) d t ) 2 d t
Equation (5) is the integration of Equation (4).
s ( N Δ t ) s ( ( N 1 ) Δ t ) + d P ( N Δ t ) , Q ( N Δ t ) d t Δ t
where Δ t = T N ; Equation (5) can efficiently calculate the value of s ( T ) .
Finally, a linear interpolation method was used to continuously map s ( T ) to the function T ( s ) , which approximated the value of the parameter T with respect to the length s [13]. Therefore, the position vector F = ( P ( T ( s ) ,   Q ( T ( S ) ) ) ) was highly correlated with the given distance s. The closed curve of the irregular outer contour of the tree trunk was converted to x , y coordinates by GPR. It was proposed in [13,45,46] that the detection interface could be extended to arbitrary shapes, as shown in Equation (6).
t ( s ) = ( F ( s ) x g , y g R ) C 0
where t is the time (in seconds) and F ( s ) = x S , y S is the positional vector (in meters) along the tree surface relative to the reference point. R is the radius of the target (meters), is the relative permittivity of the medium, C 0 is the speed of light ( C 0 3.10 8   m / s ) , and x g , y g are the coordinates of the center of the target.
After converting the irregular outer contour into x , y coordinates, a “hyperbola fitting” to the reflection of the target was required [13]. The relationship between the radius R and the relative permittivity can be expressed as Equation (7).
a r g m i n x g , y g , , R i = 1 Z ( t i F ( s i ) ( x g , y g ) c 0 + R c 0 ) 2
where ( s i ,   t i ) is a series of anomalously collected points of interest, Z is the number of observations, ( x g , y g ) is the center of the target, R is the radius of the target, and is the relative permittivity of the medium.
From Equation (7), it was observed that the radius R and the relative permittivity had a non-unique product, which suggested that similar outputs could occur for different ( R , ) . Thus, there might be non-uniqueness in the target reflection pattern [13].

2.2.2. Reflection Patterns of Targets under Irregular Detection Paths

The reflection pattern generated by GPR detecting an internal target along an irregular outer contour can no longer be approximated by a hyperbola. As seen in Figure 2, the relationship between s and t was complex and highly dependent on the shape of the tree, and the reflection pattern generated by the target might show multiple distortion peaks.
The geometric relationship between the target and the peripheral contour was converted into the distance relationship between the point and the irregular boundary. It was shown from the target reflection hyperbola that there might be more than one point with equal distance to the target when the radar detected along the irregular closed curve. The corresponding radar image showed the distortion of the hyperbola with multiple peaks, as shown in Figure 2b. Where two points reached the internal target at the same distance, the target reflection image might appear as a case of two equal peaks, two different peaks, or a combination of two similar hyperbolas. Similarly, where more than one point reached the internal target at the same distance, the reflection hyperbola with multiple peaks might appear in the B-scan image. In the B-scan radar image, if the number of targets was determined only by the number and shape of the reflected hyperbolas, it would lead to an incorrect determination of internal targets.
In summary, the reflection pattern produced by the target at arbitrarily complex detection interfaces was no longer a standard hyperbola, but a distorted hyperbola. To further investigate the influence of irregular detection paths on the imaging characteristics of the target reflection curve, this study proposed a method combining the image affine transformation and the Riemann mapping principle.

2.3. Principles and Methods for Detecting Irregular Tree Trunks Using GPR

Whatever the shape of the actual tree trunk, the use of GPR results in a rectangular domain image because of the limitations of radar imaging. In most studies, images of the rectangular domain were used as the basis for investigating the structural features (cavities and decay) in the internal part of the living tree. This approach ignores the influence of irregular outer contours on the reflection pattern of the internal structure. However, the image affine transformation technique can accomplish irregular deformation of the image, and the Riemann mapping theorem [47] can obtain the image in the irregular physical domain, as shown in Figure 3. It is advantageous to combine these two methods to study the radar reflection patterns of irregular living trees with internal defects under irregular detection paths.
The principle of detecting defects in the internal part of the irregular trunk based on these two methods is shown in Figure 4. As described in previous studies [1,12], GPR and light detection and ranging(LIDAR) were used to study irregular living trees in a circular pattern along the clockwise direction to obtain radar data and information on the irregular outer contour. It is important to note that the radar detection should be close to the bark for four heights (0.6 m, 0.9 m, 1.2 m, 1.5 m), and multiple detections should be made at the same height to ensure the continuity and accuracy of the data. Then, the irregular contour data were converted to x ,   y coordinates based on the records, and the irregular outer contour image was generated. The principle of detection in this study was the same as described above. However, for the purpose of obtaining radar images of actual irregular tree trunks, the image affine transformation technique and the Riemann mapping principle were also considered for application to the radar image processing of trees.
Taking the numerical model as an example, the radar-acquired data were represented as images only in the rectangular domain (Figure 4a), and the radar images in the circular domain (Figure 4c) were obtained after a coordinate transformation. The radar image of the irregular trunk (Figure 4d) was obtained by fusing the acquired radar data with the irregular outer contour by image affine transformation. It was found that the irregular outer contour causes distortion of the target reflection curve by comparing the target reflection curves in Figure 4c,d. To further investigate the influence of irregular outer contours on the target reflection curve, it was necessary to return (Figure 4a) to the physical domain (Figure 4b) through the Riemann mapping principle. The radar images of irregular trunks and the radar images in the physical domain could better represent the morphological characteristics of the target reflection patterns in irregular living standing trees. This provided the basis for further studies on the reflection of defects in the irregular living trees.
This method was also used to study the radar data collected from actual living trees. The radar data with a height of 0.9 m is chosen here as an example. By the same processing, the irregular contours (Figure 4e) were fused with the radar data at 0.9 m (Figure 4f) to obtain the radar image of the irregular trunk (Figure 4g). Then, the radar image of the irregular physical domain (Figure 4h) was obtained after processing by Riemann mapping. To investigate the influence of irregular peripheral contours on the geometry of the target reflection curve, numerical simulation experiments and actual test experiments were conducted in this study. The processing flow of numerical simulation and actual testing is shown in Figure 5.

3. Materials and Methods
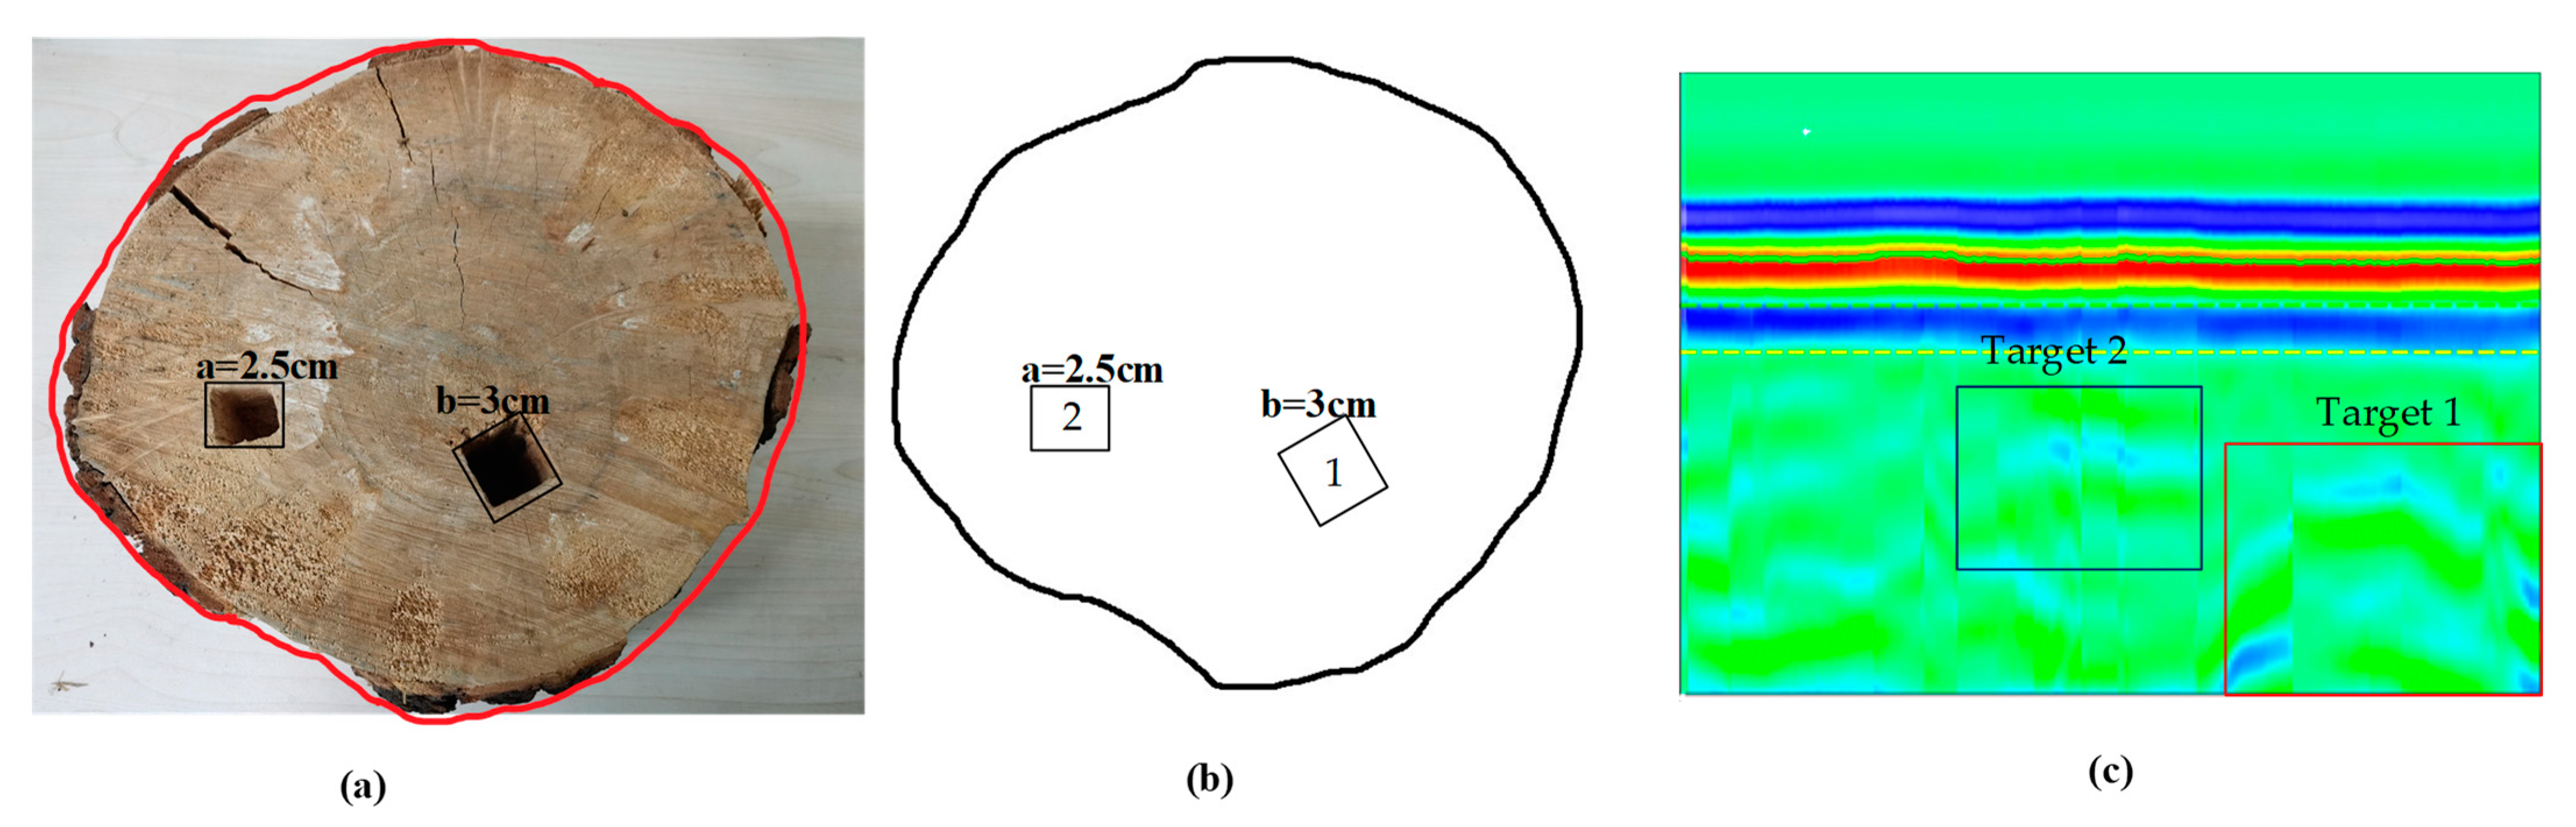
3.1. Materials

When using GPR to complete the detection of living trees, the irregular circular detection caused abnormally reflected images of internal targets, making accurate location difficult. To investigate the influence of irregular outer contours on the reflection patterns of internal defects, numerical simulation experiments, laboratory experiments, and field experiments were conducted in this study. Regarding the excitation, the EM waves of the 900 MHz signal of the GPR (SIR3000T, GSSI, Silicon Valley, CA, USA) were chosen. The maximum detection depth of the antenna is about 1 m [48]. A pulse signal was generated every 5 mm clockwise along the irregular trunk surface. The parameters in the numerical simulation experiments correspond to the actual parameters. In the laboratory experiment, a dead willow stump with an irregular outer profile was selected for testing at the NDT Center of Beijing Forestry University, China. The ambient temperature in the laboratory was 26 °C. The moisture content of the irregular stump was 50–70%, the diameter was 33 cm–35 cm, and the height was about 60 cm. Three measurements were performed on the samples to reduce errors and select radar data with better continuity. The location of the field experiment was the Summer Palace in Beijing, China, the best-preserved royal garden in existence, with more than 1600 ancient trees (willows, pines, cypresses, etc.). In this study, an ancient tree (40°0′24.3576″ N, 116°16′26.9688″ E) in the Summer Palace with an irregular outer contour was selected for nondestructive testing. The tree was approximately 100 years old, with a diameter at breast height of 1.38 m and an average circumference of 4.35 m in section. The outer contours of such trees are more complex than those of younger trees. It is worth noting that the moisture content, density, and frequency are different for different tree species in the actual environment. Radar wave propagation in different media is attenuated, which causes the image to become blurred and distorted. The wave velocity of radar waves is related to the permittivity of the trees, and the permittivity is related to the water content [49]. Therefore, the permittivity was used as the main factor to estimate the wood properties, and the gain was adjusted to offset the loss and attenuation of the signal.

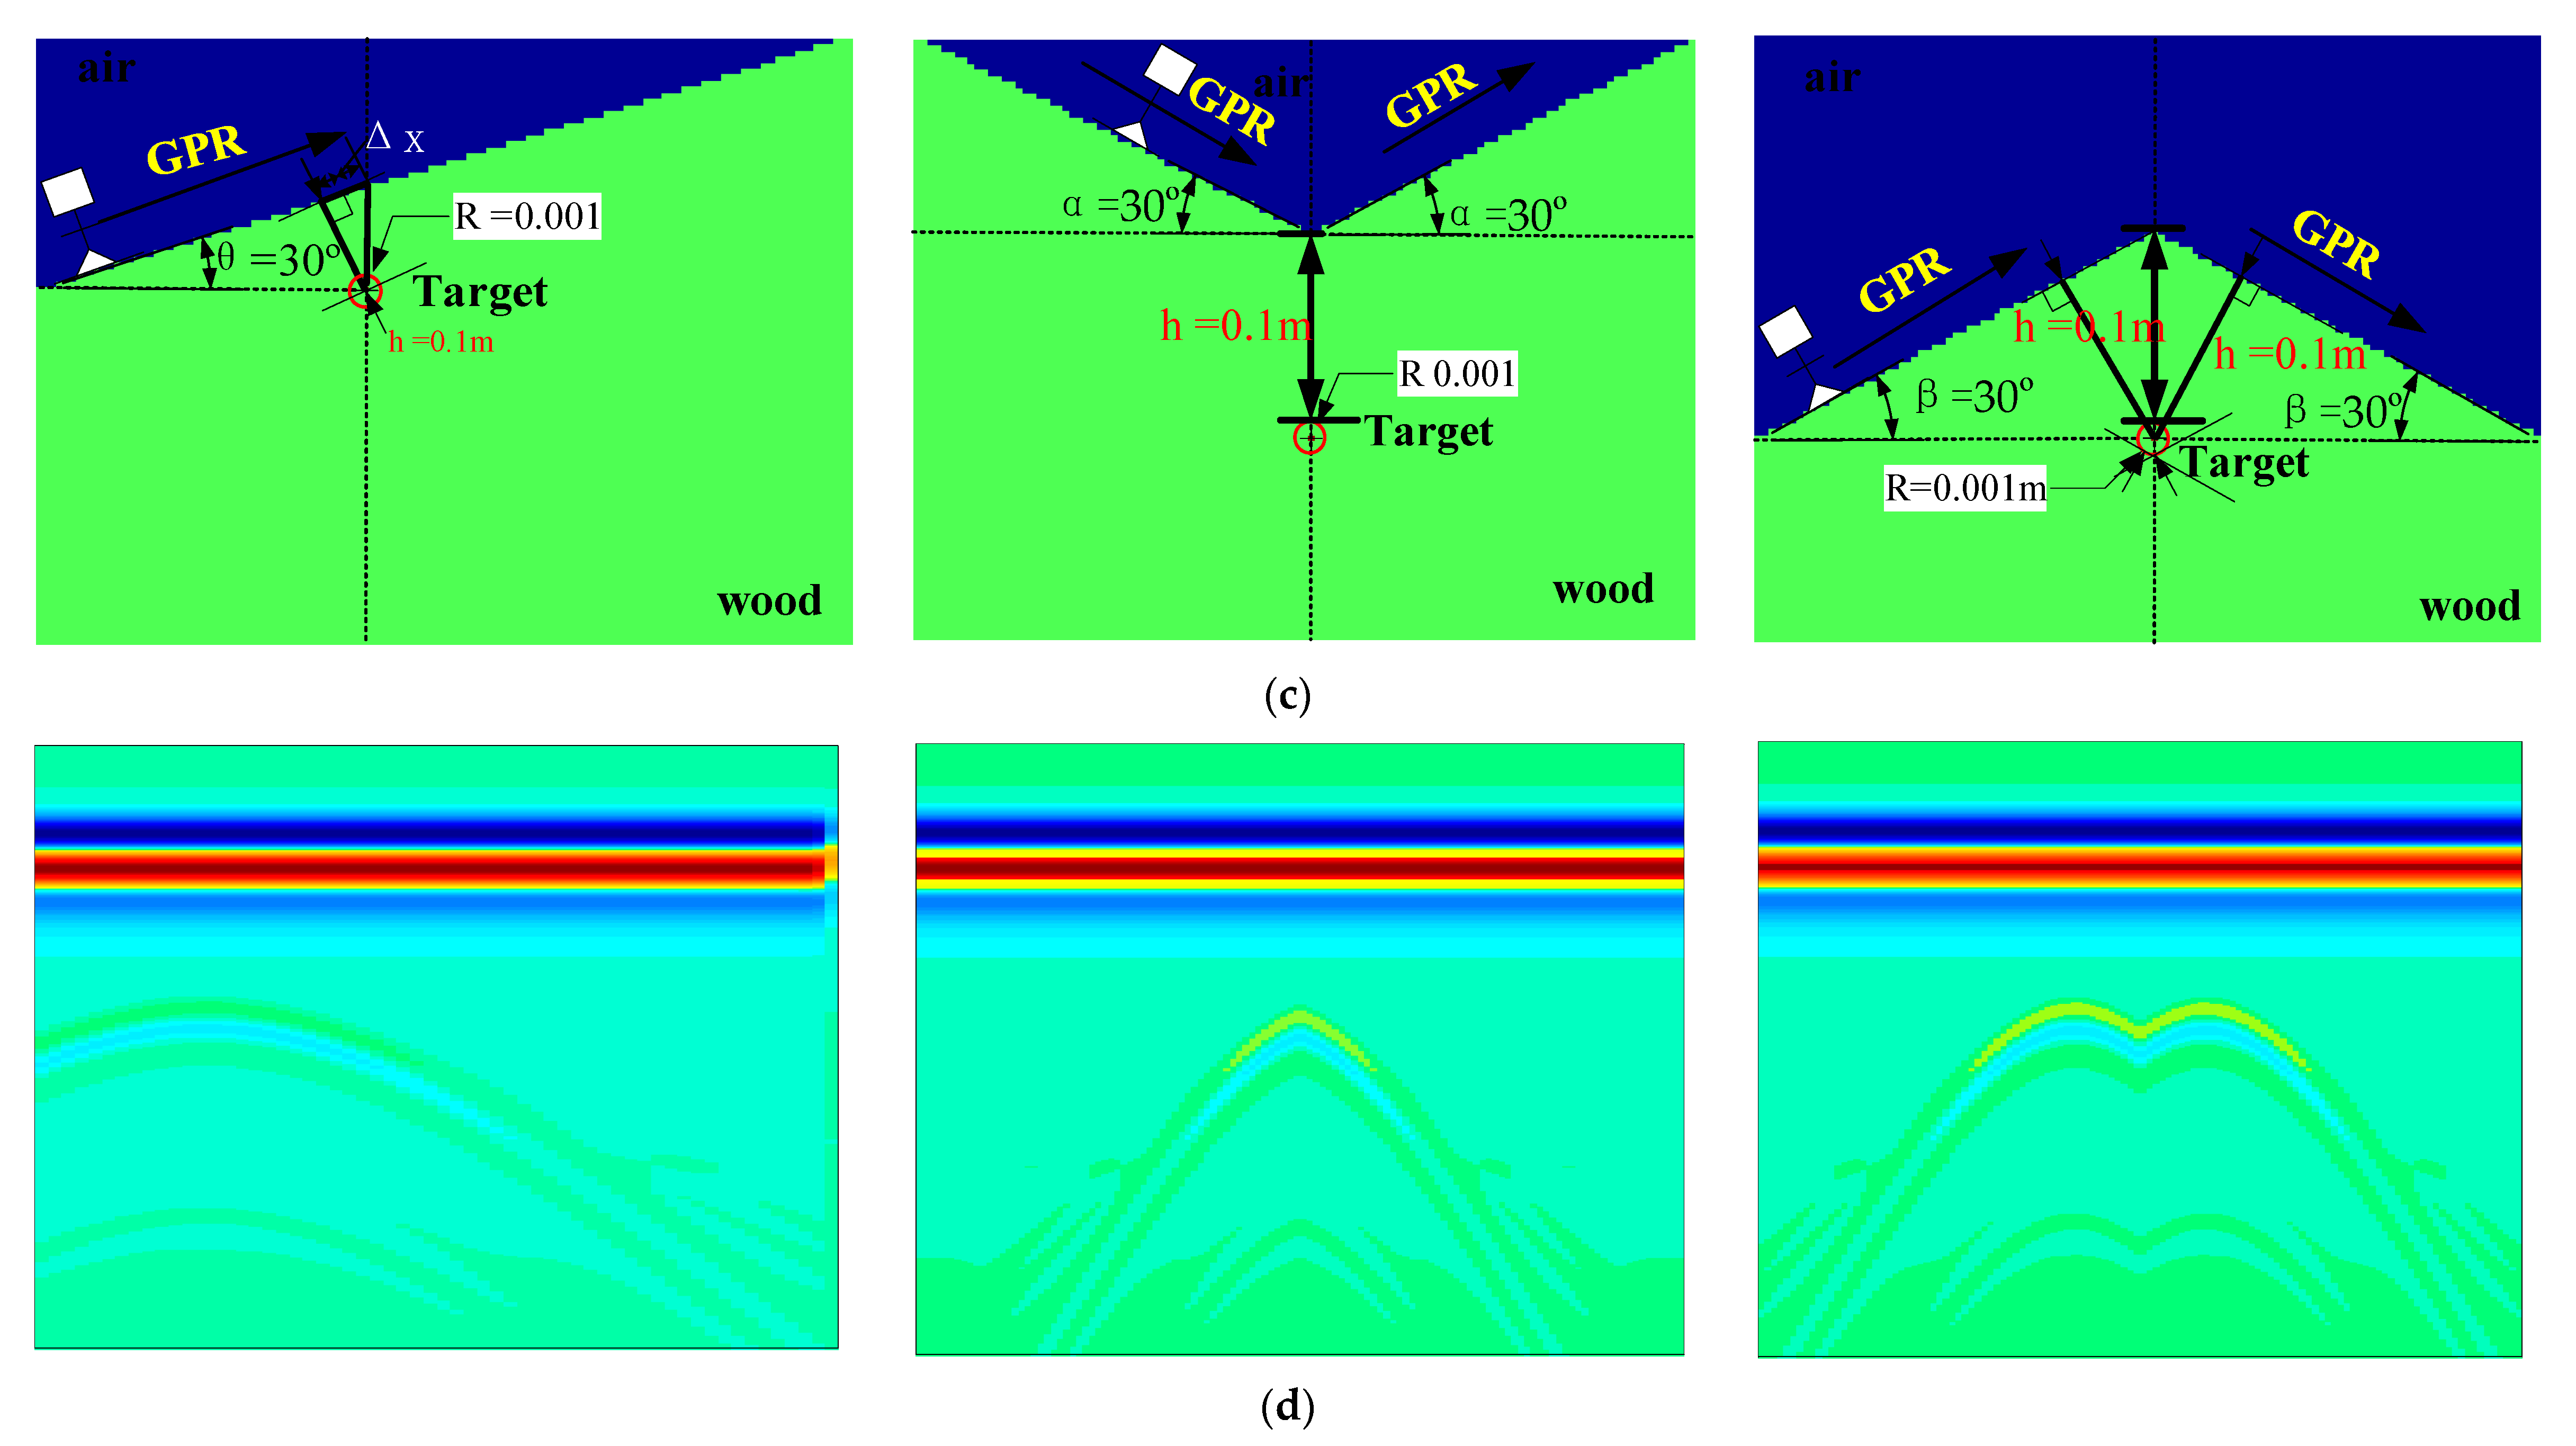
3.2. Numerical Simulation Tests on Targets with Non-Horizontal Interfaces

In the numerical simulation, the FDTD method was used to simulate the propagation of EM waves in media with different dielectric constants. The propagation of EM waves in the bark layer, sapwood layer, heartwood layer, and air layer of living trees with internal defects was simulated using the open-source software GprMax2.0 [12]. The numerical model and the reflection pattern of the target are shown in Figure 6. The reflection pattern of the target was a hyperbolic pattern. It is worth mentioning that the above numerical model of trees was characterized by a varying dielectric constant (see Table 1) to illustrate the layered structure of the tree. In the numerical simulations, the grid step was Δ = 5 mm, the time step was Δ = 6 ns and Δ = 12 ns, the number of data collection steps was 240, the antenna movement step was 0.005 m, the dielectric constant of the defect was 1.0, and the conductivity was 0.001.
For a better understanding of the images of circumferential data acquisition and to verify the effectiveness of the method, numerical simulations were performed for three different cases: (i) target imaging under the three non-horizontal boundaries (sloped, convex, and concave); (ii) single-target imaging under the regular and irregular detection interfaces; and (iii) multi-target imaging under the irregular detection interfaces.
With regard to the target imaging characteristics under the three special types of non-horizontal detection interfaces, this study considered the complex detection interface as a combination of multiple conventional horizontal detections. The imaging features and reflection patterns will be described in the simulation section of the three non-horizontal boundaries. It could be regarded as horizontal detection along the sloped interface when the radar detected along the sloped interface. The return signal was shown as the reflected image of the sloped interface. The detection interface could be considered as a combination of horizontal detection upward along the sloped interface and horizontal detection downward along the sloped interface when the radar detected along the convex interface. The detection interface could be considered as a combination of horizontal detection downward along the sloped interface and horizontal detection upward along the sloped interface when the radar detected along the concave interface. Thus, this study established a slope detection interface with a slope angle of 30 degrees by the simulation software, and the convex detection interface and concave detection interface were obtained by combining the slope detection interface. Then, the patterns of target reflection hyperbolas were simulated by GprMax2.0 software for the detection of GPR along three bark boundaries. The shortest distance between the target and the complex boundary was 0.1 m, and the radius of the target was 0.001 m.
As we know, the contours of living trees in nature are not a circle but rather an irregular closed curve. The irregular closed curve can be seen as a combination of the above three irregular detection boundaries. A two-layer trunk model was simulated, where the thickness of the air layer was 3 cm, the thickness of the bark layer was 5 cm, and the thickness of the sapwood layer was 52 cm, and the target was in the sapwood layer, with a radius of 0.02 m. The simulation and the initial detection position of measurements will be described in the section of radar imaging of a single target under an irregular detection path. The detection direction is counter-clockwise. In addition, there was more than one internal defect in the actual tree trunk. The forward simulation software was used to construct an irregular trunk model with a three-layer structure, in which the thickness of the air layer was 3 cm, the thickness of the bark layer was 2 cm, the thickness of the sapwood layer was 15 cm, the thickness of the heartwood layer was 40 cm, and both targets were in the sapwood layer, with a radius of 0.02 m. The detection interface and the target reflection curve will be marked in the section of radar imaging of multiple targets under an irregular detection path. The thickness of the layered structure is shown in Table 2.

3.3. Measurement Tests on an Irregular Tree Stump and Living Trees

To verify the feasibility of the two methods proposed in this study for radar imaging of internal defects in living trees along the irregular outer contours using GPR, not only were simulations performed on the three non-horizontal boundaries, but actual tests were also conducted on irregular stumps and living trees.
The real data presented in this work were collected from a dead irregular willow stump specimen. The section length of the stump was 1.175 m. Two square holes with side lengths of a = 2.5 cm and b = 3 cm were drilled to simulate defects spots within the cross-section of the tree trunk. The areas of the cavities were 6.25 cm2 and 9 cm2, respectively. The electrical conductivity of the cavity was 0 s/m, and the relative permittivity was 1. An integrated radar system in trunk mode with 900 MHz signals, manufactured by GSSI, was used for testing purposes. Measurements were collected every 0.005 m counter-clockwise, using a measuring wheel adapted to the antenna, with a sampling interval of t = 0.01566 ns along the trace, the number of traces set at 236, and the sample trace set at 512. Figure 7 shows the images of the investigated irregular trunks. It is worth mentioning that the outer contour cross-section of the irregular trunk was no longer a typical circle but an irregular shape, as shown in Figure 7b. It is worth noting that there were two target reflection curves in the B-scan image of a single 2D scan along the trunk, as shown in Figure 7c.
To verify the feasibility of the method proposed in this study in the conservation of ancient trees, a living tree detection experiment was conducted. The real data presented in this work were collected from an irregular living tree in the Summer Palace in Beijing, China (Number: L0001). The same radar equipment and procedures for the irregular stump measurements were used. The cross-section of five heights (0.35 m, 0.65 m, 0.95 m, 1.25 m, and 1.5 m) of each trunk was detected by the GPR system (Figure 8). The GPR data were collected at a constant clockwise speed from the north for multiple irregular tree trunks. The irregular outer contours were obtained from the marker positions and converted to x ,   y coordinates by non-uniform discretization. Finally, the collected data were fused with the irregular outer contour by the image affine technique to generate the actual irregular radar image. The Riemann mapping theorem was used to return to the irregular physical domain image. The internal structure and defects of the irregular trunk were used to investigate the influence of the irregular outer contour on the internal reflection pattern. This study processed the radar data with a height of 0.65 m. The cross-sectional circumference of the tree was 4.1 m, the sampling interval was t = 0.0411 ns along the trace, the number of traces was 820, and the sample trace was 512.

4. Results and Discussion

4.1. Simulation Results and Analysis of Three Non-Horizontal Interfaces

Figure 9 illustrates the reasons for the hyperbolic deformation under the different boundary conditions. We performed geometric and numerical simulations with three complex boundaries (sloped, convex, and concave) to obtain radar images of target reflections [15]. The geometric morphology analysis of the target reflection curve for the horizontal detection interface and complex detection boundary is shown in Figure 9a. The horizontal detection interface was removed. The morphological characteristics of the target reflection curve under the complex detection interface are shown in Figure 9b. The purple curve is the complex detection interface, and the black curve is the horizontal detection interface. The black double curve is the reflection curve of the target under the horizontal detection interface. The yellow curve is the target reflection curve of the radar moving downward along the sloped interface, and the green curve is the target reflection curve of the radar moving upward along the sloped interface. The red double curve is the target reflection curve at the complex detection interface. To further investigate the relationship between the irregular boundary and the target curve, a complex boundary model was established using the GprMax software, as shown in Figure 9c.
The geometric simulation results demonstrated that the irregular detection path affects the shape of the target reflection curve. In the sloped detection interface, the geometry of the target reflection curve was similar to that of the target reflection curve detected under the horizontal interface, but the position of the vertices of the hyperbolas was different. In the concave detection interface, the morphological structure of the red hyperbola was similar to that of the black hyperbola, obtained by horizontal detection, but the location of the vertices and the degree of opening and closing of the hyperbola were different. In the convex detection surface, the geometric features of the red curve showed that the target reflection curve had two distinct peaks—two vertices—at the convex detection surface. The red hyperbola had a different morphological structure and a different location of the vertices compared with the black hyperbola of the horizontal detection, but the degree of opening and closing of the hyperbolas was the same.
The numerical simulation results showed that the geometric features of the target reflection hyperbolas detected at the sloped interface were not significantly different from those of the target reflection curves detected at the horizontal interface and were the same as those of the geometric simulation. At the concave interface, the geometry of the target reflection hyperbola changed drastically; there was a significant difference compared with the target reflection curve at the horizontal detection interface, but it was consistent with the characteristics of the geometrically simulated hyperbola. At the convex interface, there was a hyperbola in the radar reflection image that was a combination of two interconnected hyperbolas, which was a distorted hyperbola with two distinct vertices. These two hyperbolas correspond to the similar outputs in the “hyperbola fitting” described above. However, these two interconnected hyperbolas might be regarded as one hyperbola, which causes great interference with subsequent target identification. The simulation results were basically consistent with the geometric simulation results.
In summary, the geometric features of the target reflection curve in the radar image might be distorted because of the irregularity of the detection boundary. The target reflection curve was no longer a typical hyperbolic structure but a very complex hyperbola.

4.2. Forward Simulation Results and Analysis of Targets on Irregular Detection Route

4.2.1. Radar Imaging of a Single Target under the Irregular Detection Route

Figure 10 shows the target reflection radar images of a single target in the regular two-layer trunk model and the irregular two-layer trunk model. The outer contour of the irregular model was set as the irregular outer contour of the living trees. The environment is known to be a non-uniform medium consisting of several layers with different EM properties. The propagation of EM waves in media with different dielectric constants results in different layered reflections in the B-Scan radar images, as shown in Figure 10b. The presence of the target was often identified as a hyperbolic feature located in the radar image, as shown in Figure 10b. The length of the investigated domain was 1.4 m, the width was 0.6 m, the starting position of the antenna was (0.0875, 0.5825), the position of the target was (0.485, 0.394), and the time window was 6 ns.
The numerical simulation results revealed that in the regular model there was obvious layering in the B-scan image and the target reflection curve appeared as a hyperbola. The initial position of the radar detection and the detection direction are shown in Figure 10. The layered reflections between different dielectric constants are shown as horizontal reflection curves, including the bark reflection curve and the sapwood reflection curve, in Figure 10b. After coordinate transformation to obtain the reflection pattern in the circular domain, it was found that the different layered reflections were still relatively regular, and the shape of the target reflection curve was also relatively regular.
In the irregular model, stronger reflections appeared near the surface of the trunk, and the target reflection curve appeared as a complex curve. After the image affine transformation, it was found that the detection interfaces with the actual irregular radar image changed, and the shape of the target reflection curves changed. Similar outputs might occur for the hyperbola fitting, as described in Equation (7). The morphology of the target reflection curve appeared as two outputs, resulting in a significant distortion of the target reflection curve. After the Riemann mapping principle, it was discovered that the irregular detection path caused distortion of the hyperbola. Actual irregular radar images and images in irregular physical domains show that irregular detection boundaries can influence the geometry of internal target reflection curves. The actual irregular radar images provide a more realistic and accurate characterization of the structure in the actual trunk. Images in the irregular physical domain can help to better understand the imaging characteristics of targets under irregular detection paths. It is worth noting that the geometry of the target reflection curve might be varied on the basis of the different detection paths. The target reflection curve was no longer a typical hyperbolic structure but a distorted hyperbola with multiple vertices. In summary, the radar image of a single target showed that the geometric characteristics of the target reflection curve were highly correlated with the irregular detection route.

4.2.2. Radar Imaging of Multiple Targets under the Irregular Detection Route

Most of the studies of the target were conducted on the basis of radar images in the rectangular domain, because of the limitations of radar images. To more accurately reflect the structural features inside the irregular trunk, it was necessary to convert to irregular radar images, such as the radar image of the irregular trunk (Figure 11b) and the physical domain image (Figure 11c). To avoid the singularity of imaging, a numerical simulation of multiple targets in the internal part of a multi-layer trunk was performed. The outer contour of the irregular model (Figure 11a) was set as the irregular outer contour of the living trees. Figure 11 shows the radar images of multiple targets in the three-layer trunk model. The length of the investigated domain was 1.4 m, the width was 0.6 m, the starting position of the antenna was (0.0875, 0.5825), the time window was 6 ns, and the position of the targets were (0.73, 0.505), and (0.39, 0.485).
The numerical simulation results of multiple targets under the multi-layer structure revealed that there were two independent reflection hyperbolas in the irregular radar images after the image affine transformation. They were the reflection patterns of the two targets in the irregular trunk model. It was observed that the target reflection curve had a similar hyperbolic pattern, but it was not a typical hyperbola. Some changes occurred in the morphological structure of the hyperbola. It is worth mentioning that this variation was changed with irregular detection boundaries. The propagation of EM waves in different dielectric constants caused a more pronounced reflection layer in the irregular radar image, as shown in the red curve in Figure 11b. Similarly, the layered reflections with different dielectric constants varied with the irregular detection boundary. The target reflection pattern was still found to vary with the irregular detection boundary in the radar images of the irregular physical domain. The radar images of the irregular trunk and the radar images in the physical domain were useful to better characterize the reflection curves of targets in the irregular trunk. This provided evidence for more effective and accurate localization of targets in irregular trunks. However, it is worth mentioning that the internal defects in irregular trunks not only occurred in the sapwood layer but also in the heartwood layer or at the interface of the layered media. The radius and shape of the defects might also be complex, and the reflection patterns for these complex cases need to be further discussed. In summary, the three-layer trunk model demonstrated that the irregular detection routes not only resulted in single-target reflection hyperbolic distortion but also affected the geometric properties of multi-target reflection hyperbolic curves under the layered structure.

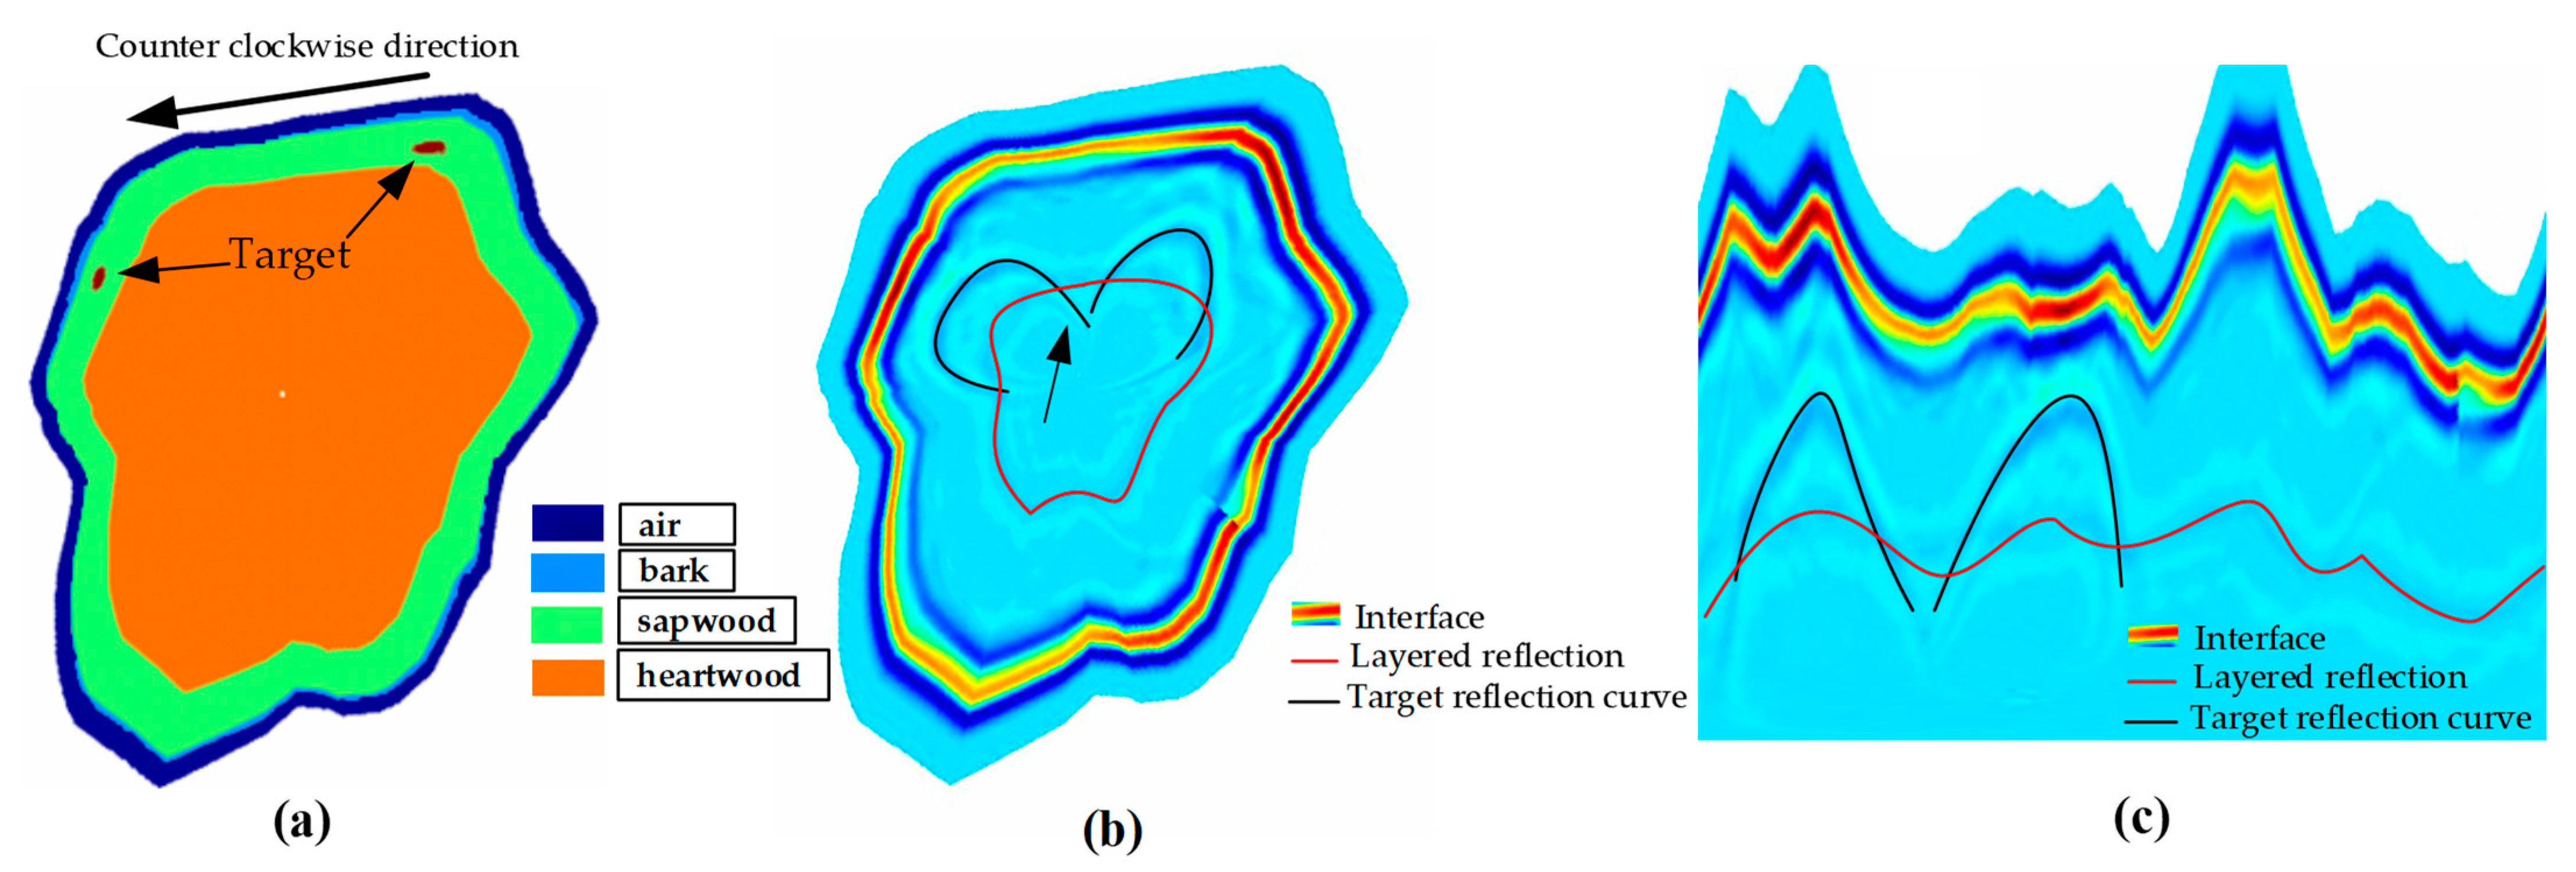
4.3. Radar Image Analysis of Irregular Tree Stumps and Living Trees

The same processing and transformation scheme used for data was applied to a dead irregular willow stump specimen (Figure 7) and an irregular standing timber scene (Figure 8). The purpose of the measured experiments was to investigate the influence of the actual irregular outer contour on the imaging of the target reflection pattern. The feasibility of the proposed method for radar imaging of the irregular tree trunk was also verified. Figure 12 shows the detection results of the radar along the outer contour of the irregular tree stump. The reflection patterns of the two square holes (Figure 7) in the irregular stump are shown as the red curve and the black curve in Figure 12. The red curve represents the reflection curve of the target with side length b = 3 cm in Figure 7b, and the black curve represents the reflection curve of the target with side length a = 2.5 cm in Figure 7b.
The results demonstrated that the image affine transformation method and the Riemann mapping method for irregular radar images are equally applicable in actual irregular tree stump detection. It is worth observing that there was a hyperbolic morphological difference in the target reflection curves in Figure 12a,b. The reflection curve of the target in Figure 12b varied with the irregular boundary, and the opening and closing degrees, vertex positions, and geometric forms of the hyperbolas also changed with the irregular boundary. It is notable that the black hyperbolic shape did not change significantly due to the relatively small variation of the irregular contours. The vertex position and the opening and closing of the hyperbola changed slightly. The red hyperbola shape changed relatively significantly with a relatively significant change in the irregular contour. The shape of the target reflection curve also varied with the irregular boundary in the physical domain. In summary, the radar detection results of irregular stumps indicated that the irregular detection route influenced the geometry of the target reflection curve.
To verify that the method proposed in this paper also applies to estimating the internal structure of standing trees, the five heights (0.35 m, 0.65 m, 0.95 m, 1.25 m, and 1.5 m) (Figure 8) of living trees were probed, and the height of 0.65 m was selected for imaging and analysis, as shown in Figure 13. The measured radar data could reflect the characteristics of the internal structure of the living tree (Figure 13). Although the measured radar data reflected the characteristics of the internal structure of the living tree in some aspects, it was necessary to return to the irregular images (Figure 13c,d) for a more accurate estimation of the internal structure.
The results revealed strong reflections occurring at the irregular detection boundary in the target reflection pattern and a complex structure inside the tree trunk. By comparing Figure 10e, Figure 11b and Figure 13c, it was found that the method proposed in this paper can better estimate the structural features inside the irregular living tree from both irregular radar images and radar images in the physical domain. However, it is worth noting that the number of internal defects in the actual irregular living trees was no longer one or two as in the numerical simulation, but consisted of many complex targets. The actual collected radar data were more complex, and the target reflection pattern was no longer a typical hyperbola. However, it was still possible to determine the study area of defects based on the variation of the outer contour in the irregular image of the living trees.
In summary, the method proposed in this study can be used not only for numerical simulation of targets under the irregular outer contour but also for irregular stump detection and living tree detection. The internal structure in the irregular trunk can be evaluated based on the irregular radar images.

5. Conclusions

The purpose of this study was to investigate the reasons and solutions for the change of the target reflection curve geometry due to the irregular detection route when detecting along the irregular peripheral profile of a living tree using GPR. The reasons and influencing factors of hyperbolic distortion were analyzed in detail from mathematical theories and geometric illustrations, and the compensation and correction of distorted hyperbolic curves were proposed using image affine transformation technology. This paper takes advantage of the Riemann mapping principle to recover the rectangular domain image to the physical domain (non-rectangular domain) so that the radar imaging is no longer limited to rectangular domain images. This may allow for more accurate reflection curves and realize the correction of distorted hyperbolas in the internal part of irregular trees. The conclusions are as follows:
(1)
The irregularity of the detection interface can cause changes in the opening and closing of the degree of the hyperbola, peak, and position of the hyperbola, resulting in distortion of the shape of the hyperbola. The distortion of the same target output non-unique hyperbola occurred in the target reflection pattern.
(2)
Irregular detection paths caused the shape of the target reflection curve to change with the irregular detection path.
(3)
Radar images of irregular physical domains can present a more visual representation of the reflections of actual trees.
(4)
Actual irregular radar images and radar images in the physical domain can be used to better represent the complex internal structure of irregular trunks. This provides evidence for more effective and accurate localization of targets in irregular trunks.
Future research will task itself with more complex numerical simulations and will examine the internal structure of living trees with different geometric defects and different health conditions. At the same time, further research will consider the combination of ultrasonic or stress waves to detect defects and compare them. Another factor that will also be considered is the application of the mature seismic migration technique [50,51,52,53,54,55] and terrain correction in trunk radar images, which will achieve accurate localization of targets in the internal part of irregular tree trunks and avoid misclassification of anomalous targets because of hyperbolic distortion.

Author Contributions

Conceptualization, F.X., X.Z., Z.W. and J.W.; methodology, F.X. and J.W.; software, F.X., X.Z., Z.W. and J.W.; validation, F.X. and J.W.; formal analysis, F.X.; investigation, F.X., X.Z., Z.W. and J.W.; resources, J.W., H.H. and J.Z.; data curation, F.X., X.Z., Z.W., J.W., H.H. and J.Z.; writing—original draft preparation, F.X.; writing—review and editing, J.W., C.G. and N.Y.; visualization, J.W.; supervision, J.W.; project administration, J.W.; funding acquisition, J.W. All authors have read and agreed to the published version of the manuscript.

Funding

This research was funded by the Fundamental Research Funds for the Central Universities (Grant No. 2021ZY73), the Beijing Municipal Natural Science Foundation (Grant No. 6202023), and the National Natural Science Foundation of China (Grant No. 32071679).

Data Availability Statement

The GPR data and the source codes of GPR data processing, algorithm, and data visualization are available from the authors upon request.

Acknowledgments

This study was supported by the Fundamental Research Funds for the Central Universities (Grant No. 2021ZY73), the Beijing Municipal Natural Science Foundation (Grant No. 6202023), and the National Natural Science Foundation of China (Grant No. 32071679).

Conflicts of Interest

The authors declare no conflict of interest.

References

  1. Weilin, L.; Jian, W.; Zhongliang, X.; Shengxia, X. Application of ground-penetrating radar for detecting internal anomalies in tree trunks with irregular contours. Sensors 2018, 18, 649. [Google Scholar]
  2. Qiu, Q.; Qin, R.; Lam, J.H.M.; Tang, A.M.C.; Leung, M.W.K.; Lau, D. An innovative tomographic technique integrated with acoustic-laser approach for detecting defects in tree trunk. Comput. Electron. Agric. 2019, 156, 129–137. [Google Scholar] [CrossRef]
  3. Lin, W.; Wu, J. Nondestructive testing of wood defects based on stress wave technology. Telkomnika Indones. J. Electr. Eng. 2013, 11, 6802–6807. [Google Scholar] [CrossRef]
  4. Sun, T.; Luo, J.; Wang, L. Research on detecting defects of square-edged timber of fir and ribbed birch by infrared thermal imager: A study on nondestructive testing of wood defects by infrared thermal imager. In Proceedings of the 2012 International Conference on Biobas Material Science and Engineering, Changsha, China, 21–23 October 2012; pp. 258–261. [Google Scholar] [CrossRef]
  5. Espinosa, L.; Prieto, F.; Brancheriau, L.; Lasaygues, P. Ultrasonic imaging of standing trees: Factors influencing the decay detection. In Proceedings of the 2019 XXII Symposium on Image, Signal Processing and Artificial Vision (STSIVA), Bucaramanga, Colombia, 24–26 April 2019; pp. 1–5. [Google Scholar] [CrossRef] [Green Version]
  6. Boero, F.; Fedeli, A.; Lanini, M.; Maffongelli, M.; Monleone, R.; Pastorino, M.; Randazzo, A.; Salvadè, A.; Sansalone, A. Microwave tomography for the inspection of wood materials: Imaging system and experimental results. IEEE Trans. Microw. Theory Tech. 2018, 66, 3497–3510. [Google Scholar] [CrossRef]
  7. Alani, A.M.; Soldovieri, F.; Catapano, I.; Giannakis, I.; Tosti, F. The use of ground penetrating radar and microwave tomography for the detection of decay and cavities in tree trunks. Remote Sens. 2019, 11, 2073. [Google Scholar] [CrossRef] [Green Version]
  8. Liang, H.; Fan, G.; Li, Y.; Zhao, Y. Theoretical development of plant root diameter estimation based on gprmax data and neural network modelling. Forests 2021, 12, 615. [Google Scholar] [CrossRef]
  9. Rodrigues, B.P.; Senalik, C.A.; Wu, X.; Wacker, J. Use of ground penetrating radar in the evaluation of wood structures: A review. Forests 2021, 12, 492. [Google Scholar] [CrossRef]
  10. Xu, P.; Guan, C.; Zhang, H.; Li, G.; Zhao, D.; Ross, R.J.; Shen, Y. Application of nondestructive testing technologies in preserving historic trees and ancient timber structures in china. Forests 2021, 12, 318. [Google Scholar] [CrossRef]
  11. Ježová, J.; Mertens, L.; Lambot, S. Ground-penetrating radar for observing tree trunks and other cylindrical objects. Constr. Build. Mater. 2016, 123, 214–225. [Google Scholar] [CrossRef]
  12. Wen, J.; Li, W.; Xiao, Z.; Zhang, J.; Han, H. Radar wave detection of standing trees internal defect. Trans. Chin. Soc. Agric. Mach. 2017, 48, 180–188. [Google Scholar]
  13. Giannakis, I.; Tosti, F.; Lantini, L.; Alani, A.M. Health monitoring of tree trunks using ground penetrating radar. IEEE Trans. Geosci. Remote Sens. 2019, 57, 8317–8326. [Google Scholar] [CrossRef]
  14. Zhou, M.; Chakraborty, B.; Zhang, J.J. Urban terrain multiple target tracking using probability hypothesis density particle filtering. In Proceedings of the 2011 Conference Record of the Forty Fifth Asilomar Conference on Signals, Systems and Computers (ASILOMAR), Pacific Grove, CA, USA, 6–9 November 2011; pp. 331–335. [Google Scholar] [CrossRef]
  15. Sun, W.; Xu, Q.; Zhang, H.; Yao, Z. Research on detection and visualization of underground pipelines. In Proceedings of the 2012 2nd International Conference on Remote Sensing, Environment and Transportation Engineering, Nanjing, China, 1–3 June 2012; pp. 1–4. [Google Scholar] [CrossRef]
  16. Lombardi, F.; Griffiths, H.D.; Balleri, A. Landmine internal structure detection from ground penetrating radar images. In Proceedings of the 2018 IEEE Radar Conference (RadarConf18), Oklahoma City, OK, USA, 23–27 April 2018; pp. 1201–1206. [Google Scholar] [CrossRef] [Green Version]
  17. Sciotti, M.; Colone, F.; Pastina, D.; Bucciarelli, T. Gpr for archaeological investigations: Real performance assessment for different surface and subsurface conditions. In Proceedings of the 2003 IEEE International Geoscience and Remote Sensing Symposium (IGARSS 2003) (IEEE Cat. No.03CH37477), Toulouse, France, 21–25 July 2003; Volume 2264, pp. 2266–2268. [Google Scholar] [CrossRef]
  18. Tivive, F.H.C.; Bouzerdoum, A.; Abeynayake, C. Gpr target detection by joint sparse and low-rank matrix decomposition. IEEE Trans. Geosci. Remote Sens. 2019, 57, 2583–2595. [Google Scholar] [CrossRef] [Green Version]
  19. Liu, Y.; Guo, L. A time-delay calibration method for profile estimation of two-layered rough surfaces. IEEE Access 2019, 7, 101575–101582. [Google Scholar] [CrossRef]
  20. Liu, Y.; Guo, L.-X. B-scan wave outline analysis in numerical modeling of ground-penetrating radar response from layered rough interfaces. Microw. Opt. Technol. Lett. 2019, 61, 832–837. [Google Scholar] [CrossRef]
  21. Gurbuz, T.U.; Aslanyurek, B.; Karabulut, E.P.; Akduman, I. An efficient nonlinear imaging approach for dielectric objects buried under a rough surface. IEEE Trans. Geosci. Remote Sens. 2014, 52, 3013–3022. [Google Scholar] [CrossRef]
  22. Tang, K.; Li, Z.; Tian, L.; Wang, L.; Zhu, Y. Admir–affine and deformable medical image registration for drug-addicted brain images. IEEE Access 2020, 8, 70960–70968. [Google Scholar] [CrossRef]
  23. Lv, Y.; Chen, X.; Shu, C.; Han, H. Robust global optimized affine registration method for microscopic images of biological tissue. In Proceedings of the ICASSP 2020—2020 IEEE International Conference on Acoustics, Speech and Signal Processing (ICASSP), Barcelona, Spain, 4–8 May 2020; pp. 1070–1074. [Google Scholar] [CrossRef]
  24. Gu, D.; Liu, G.; Tian, J.; Zhan, Q. Two-stage unsupervised learning method for affine and deformable medical image registration. In Proceedings of the 2019 IEEE International Conference on Image Processing (ICIP), Taipei, Taiwan, 22–25 September 2019; pp. 1332–1336. [Google Scholar] [CrossRef]
  25. Zhang, Y.; Xiao, Y.; Zhuang, Z.; Xu, K.; He, Y. Data fusion of multispectral and depth image for rape plant based on wavelet decomposition. Trans. Chin. Soc. Agric. Eng. 2016, 32, 143–150. [Google Scholar] [CrossRef]
  26. Wang, S.; Yi, X.; Chen, Y. Piecewise affine warp based frontal face synthesizing and application on face recognition. In Proceedings of the 2017 29th Chinese Control and Decision Conference (CCDC), Chongqing, China, 28–30 May 2017; pp. 3098–3102. [Google Scholar]
  27. Myers, A.J.; Megherbi, D.B. An efficient computational intelligence technique for affine-transformation-invariant image face detection, tracking, and recognition in a video stream. In Proceedings of the 2014 IEEE International Conference on Computational Intelligence and Virtual Environments for Measurement Systems and Applications (CIVEMSA), Ottawa, ON, Canada, 5–7 May 2014; pp. 88–93. [Google Scholar] [CrossRef]
  28. Li, X.; Xu, Y.; Lv, Q.; Dou, Y. Affine-transformation parameters regression for face alignment. IEEE Signal Process. Lett. 2016, 23, 55–59. [Google Scholar] [CrossRef]
  29. Song, Z.; Zhou, S.; Guan, J. A novel image registration algorithm for remote sensing under affine transformation. IEEE Trans. Geosci. Remote Sens. 2014, 52, 4895–4912. [Google Scholar] [CrossRef]
  30. Kuriakose, E.; Viswan, A. Remote sensing image matching using sift and affine transformation. Int. J. Comput. Appl. 2013, 80, 22–27. [Google Scholar] [CrossRef]
  31. Jianqing, Z.; Zuxun, Z. New mathematical model based on affine transformation for remote sensing image with high resolution. Geo-Spat. Inf. Sci. 2003, 6, 49–53. [Google Scholar] [CrossRef] [Green Version]
  32. Zhang, B.; Wang, C.; Zhang, H.; Wu, F.; Chen, J. Rigorously geometric correction for air-borne sar images based on affine transformation. In Proceedings of the 2016 IEEE International Geoscience and Remote Sensing Symposium (IGARSS), Beijing, China, 10–15 July 2016; pp. 1182–1185. [Google Scholar] [CrossRef]
  33. Sun, X.; Yu, Q.; Zhang, Y.; Hua, S. Automatic multiband SAR image registration using sparse-based despeckling and affine scale invariant transfrom. In Proceedings of the 2014 12th International Conference on Signal Processing (ICSP), Hangzhou, China, 19–23 October 2014; pp. 1090–1093. [Google Scholar] [CrossRef]
  34. Noble, B.; Daniel, J.W. Applied Linear Algebra; Prentice-Hall: Upper Saddle River, NJ, USA, 1988. [Google Scholar]
  35. Chen, P.; Wang, J. Image deformation based on contour. J. Comput. Inf. Syst. 2014, 10, 8637–8643. [Google Scholar]
  36. Yu, C.; Chen, X.; Yin, L.; Shu, C.; Zhao, L.; Han, H. Image deformation based on contour using moving integral least squares. IET Image Process. 2018, 13, 152–160. [Google Scholar] [CrossRef]
  37. Krantz, S.G. (Ed.) The Riemann Mapping Theorem and Its Generalizations. In Geometric Function Theory; Birkhäuser Boston: Cambridge, MA, USA, 2006. [Google Scholar]
  38. Sava, P.C. Migration and Velocity Analysis by Wavefield Extrapolation. Ph.D. Thesis, Stanford University, Stanford, CA, USA, October 2004. [Google Scholar]
  39. Shragge, J.; Sava, P. Wave-equation migration from topography. Seg. Tech. Program Expand. Abstr. 2005, 24, 1842–1845. [Google Scholar] [CrossRef] [Green Version]
  40. Alnuaimy, W.; Huang, Y.; Eriksen, A.; Nguyen, V.T. Automatic detection of hyperbolic signatures in ground-penetrating radar data. In Proceedings of the SPIE 4491, Subsurface and Surface Sensing Technologies and Applications III, San Diego, CA, USA, 27 November 2001. [Google Scholar]
  41. Shihab, S.; Al-Nuaimy, W. Radius estimation for cylindrical objects detected by ground penetrating radar. Subsurf. Sens. Technol. Appl. 2005, 6, 151–166. [Google Scholar] [CrossRef]
  42. Chen, H.; Cohn, A.G. Probabilistic robust hyperbola mixture model for interpreting ground penetrating radar data. In Proceedings of the International Joint Conference on Neural Networks (IJCNN 2010), Barcelona, Spain, 18–23 July 2010. [Google Scholar]
  43. Sharpe, R.J.; Thorne, R.W. Numerical method for extracting an arc length parameterization from parametric curves. Comput. Aided Des. 1982, 14, 79–81. [Google Scholar] [CrossRef]
  44. Guenter, B.; Parent, R. Computing the arc length of parametric curves. IEEE Comput. Graph. Appl. 1990, 10, 72–78. [Google Scholar] [CrossRef]
  45. Ježová, J.; Harou, J.; Lambot, S. Reflection waveforms occurring in bistatic radar testing of columns and tree trunks. Constr. Build. Mater. 2018, 174, 388–400. [Google Scholar] [CrossRef]
  46. Bonomo, N.; Bullo, D.; Villela, A.; Osella, A. Ground-penetrating radar investigation of the cylindrical pedestal of a monument. J. Appl. Geophys. 2015, 113, 1–13. [Google Scholar] [CrossRef]
  47. Segal, S.L. (Ed.) Chapter i conformal mapping and riemann mapping theorem. In Nine Introductions in Complex Analysis; North-Holland Mathematics Studies; North-Holland Publishing: Amsterdam, The Netherlands, 1981; Volume 53, pp. 1–52. [Google Scholar] [CrossRef]
  48. Cox, K.D.; Scherm, H.; Serman, N. Ground-penetrating radar to detect and quantify residual root fragments following peach orchard clearing. HortTechnology 2005, 15, 600. [Google Scholar] [CrossRef]
  49. Lv, J. Research on the Wood Internal Defects Detection Method Based on the Radar Wave. Master’s Thesis, Beijing Forestry University, Beijing, China, 2015. [Google Scholar]
  50. Alani, A.M.; Giannakis, I.; Zou, L.; Lantini, L.; Tosti, F. Reverse-time migration for evaluating the internal structure of tree-trunks using ground-penetrating radar. NDT E Int. 2020, 115, 102294. [Google Scholar] [CrossRef]
  51. Bradford, J.H. Reverse-time migration from rugged topography to image ground-penetrating radar data in complex environments. Engineering 2018, 4, 661–666. [Google Scholar] [CrossRef]
  52. Jung, H.; Kang, W.; Kim, K. Multilayer stolt migration algorithm for subsurface target imaging in oblique layers. IEEE J. Sel. Top. Appl. Earth Obs. Remote Sens. 2017, 10, 4295–4303. [Google Scholar] [CrossRef]
  53. Feng, X.; Sato, M.; Liu, C.; Zhang, Y. Profiling the rough surface by migration. IEEE Geosci. Remote Sens. Lett. 2009, 6, 258–262. [Google Scholar] [CrossRef]
  54. Yang, Z.; Yang, X.; Wang, B.; Liu, Q.; Zeng, T. Improved f-k migration based on interpolation method for gpr imaging. In Proceedings of the 2019 6th Asia-Pacific Conference on Synthetic Aperture Radar (APSAR), Xiamen, China, 26–29 November 2019; pp. 1–6. [Google Scholar] [CrossRef]
  55. Özdemir, C.; Demirci, Ş.; Yiğit, E.; Yilmaz, B. A review on migration methods in b-scan ground penetrating radar imaging. Math. Probl. Eng. 2014, 2014, 280738. [Google Scholar] [CrossRef] [Green Version]
Figure 1. The GPR geometric model and the reflection of the target.
Forests 12 01012 g001
Figure 2. Target reflection patterns detected along irregular closed curves using GPR. (a) Target model with irregular closed curves; (b) distorted hyperbolas of target reflections. The black irregular closed curve is the irregular detection curve, the red circle is the internal target with a radius of 0.02 m, the yellow circle is the initial position of the radar detection, and the black arrows show the two points that reach the position of the internal target at an equal distance.
Forests 12 01012 g002
Figure 3. Riemann mapping theorem.
Forests 12 01012 g003
Figure 4. Radar detection of irregular tree trunks. On the left side of the trunk is a simulation based on the Riemann mapping theorem. (a) Numerical simulation of 2D targets in the normative domain; (b) numerical simulation of the 2D targets in the physical domain; (c) simulation results of the targets in the circular domain; (d) simulation results of the target under the irregular boundary. On the right side of the trunk is a simulation of the image affine technique: (e) outer contour at 0.9 m; (f) radar data at 0.9 m; (g) irregular radar image at 0.9 m; (h) physical domain radar image at 0.9 m.
Forests 12 01012 g004
Figure 5. Processing flowchart. The left side shows the processing steps for the numerical simulation results and the right side shows the processing steps for the measured data.
Forests 12 01012 g005
Figure 6. Forward simulation of structural parameters: (a) layered structure of the trunk; (b) radar image of the target.
Forests 12 01012 g006
Figure 7. Investigation of irregular willow tree stump. (a) Image of the irregular stump; the red curve is the irregular detection route. (b) Outer contour and defects of the irregular stump. (c) Radar reflection image of the irregular stump; the rectangular box is the reflection curve of the target.
Forests 12 01012 g007
Figure 8. The investigated tree at the Summer Palace, Beijing, China. (a) Actual detection of irregular trunks. (b) Different heights of irregular tree trunks.
Forests 12 01012 g008
Figure 9. Geometric analysis and forward simulation experiments of target reflection curves under three types of complex boundaries. (a) Target reflection curves at the horizontal and the complex boundaries; (b) target reflection curve for complex boundary detection; (c) simulation models under the three complex boundaries; (d) reflected radar image of the target (B-scan).
Forests 12 01012 g009aForests 12 01012 g009b
Figure 10. Forward simulation of a single target with different detection boundaries. (a) Regular trunk model; (b) reflection pattern of the regular model; (c) radar image in the circular domain; (d) irregular trunk model; (e) radar image of the actual trunk after the image affine transformation; (f) radar images in the physical domain.
Forests 12 01012 g010
Figure 11. Forward simulation of multiple targets with irregular detection. (a) Irregular trunk model with multiple targets; (b) radar image of the irregular trunk after the image affine transformation; (c) radar images in the irregular physical domain.
Forests 12 01012 g011
Figure 12. Radar images of the irregular tree stump. (a) Radar image in the circular domain; (b) radar image of the irregular tree trunk; (c) radar image features in the physical domain.
Forests 12 01012 g012
Figure 13. Radar images of the living tree. (a) Black curve is the contour of the irregular tree trunk at h = 0.65 m; (b) radar data measured at h = 0.65 m; (c) actual irregular radar image at h = 0.65 m; (d) radar images in the physical domain.
Forests 12 01012 g013
Table 1. Property parameters of chosen media in configuration.
LayerPermittivityConductivityGrid StepExcitation SourceMobile Step
ε r δ / s · m 1 (mm)(mm)
air layer1.005Ricker5
bark layer5.00.001
sapwood layer11.00.001
heartwood layer13.00.001
Table 2. The parameter information of the tree layer.
Tree Section ComponentTwo-Layer Trunk (cm)Three-Layer Trunk (cm)
air layer33
bark layer52
sapwood layer5215
heartwood layer040
Publisher’s Note: MDPI stays neutral with regard to jurisdictional claims in published maps and institutional affiliations.

