
The Temporal and Spatial Evolution of Ecosystem Service Synergy/Trade-Offs Based on Ecological Units
by
Teng Niu
1, 
Jiaxin Yu
2,
Depeng Yue
1,*,
Linzhe Yang
1,
Xueqing Mao
1,
Yahui Hu
1 and
Qianqian Long
1 1
Beijing Key Laboratory for Precision Forestry, Beijing Forestry University, Beijing 100083, China
2
Shijiazhuang Forestry Bureau Office, Shijiazhuang 050051, China
*
Author to whom correspondence should be addressed.
Forests 2021, 12(8), 992; https://0-doi-org.brum.beds.ac.uk/10.3390/f12080992
Submission received: 7 June 2021
/
Revised: 7 July 2021
/
Accepted: 20 July 2021
/
Published: 26 July 2021
(This article belongs to the Special Issue Forest Management, Conflict and Social-Ecological Systems in a Changing World)
Abstract
:“Two ecological barriers and three shelters” (TEBTS), which has the effect of relieving ecological pressure, is the national ecological security pattern in China. Calculating the value of TEBTS ecosystem services, clarifying the synergy/trade-off relationships between ecosystem services, and maximizing the value of regional ecosystem services are of great significance for maintaining the security of the ecological civilization. At present, the research on ecosystem service synergy/trade-off has become the frontier field of ecology and related disciplines at home and abroad, and many research results have been obtained. However, there is still room and significance for continuing research to think about the synergy/trade-off relationship of ecosystems from the perspective of temporal and spatial heterogeneity: clarifying the spatial scope and spatial transmission characteristics of ecosystem service synergy/trade-off; exploring the trend of ecosystem service synergy/trade-off, and simulating the dynamic characteristics of natural factors affecting ecosystem services; and analyzing the characteristics of different spatial attributes that lead to the synergy/trade-off of ecosystem services. In this study, the Songhua River Basin (SRB), where the NFB is located, is used as the research area, the ecosystem services are simulated through the ecosystem assessment model, ecological unit (EU) is constructed as a research carrier, which is used to define the spatial scope of ecosystem services, and the influence of spatial characteristics and attribute characteristics on the change trend of the ecosystem service synergy/trade-off relationship is analyzed. The research found that water retention, soil conservation, and biodiversity did not change much from 2000 to 2015, and these ecosystem services have a greater value in the NFZ. The amount of carbon sequestration increased rapidly from 2010 to 2015. Crop production showed an increasing trend year by year. As the main grain production area, the Songnen Plain provides the main crop production function, which is greatly affected by humans. In the spatial characteristic, water retention, soil sequestration, and biodiversity present a very significant synergistic relationship, which is manifested in the obvious high-value aggregation characteristics in the NFZ, and crop production and the other four types of ecosystem services are in a trade-off relationship. At the time scale, the four types of ecosystem services, including water retention, soil conservation, biodiversity, and carbon sequestration, are synergistic, and crop production and water retention are synergistic. The vegetation types exhibiting a synergy/trade-off relationship are mainly broad-leaved forests, and the soil types are mainly luvisols and phaeozems. These EUs are mainly distributed in the NFZ and have spatial topological characteristics: the area and circumference of these EUs are smaller, the radius of gyration is also significantly smaller than that of other EUs, and the shape is more regular. By focusing on the spatial aggregation characteristics and changing trends of the ecosystem service synergy/trade-off and clarifying the influencing factors of the ecosystem service synergy/trade-off, the ecosystem services can be integrated, and the ecosystem can be optimized. Thus, the value of regional ecosystem services can be maximized, and a certain data foundation and theoretical support can be provided for major projects, such as ecological restoration and ecological environment governance, which is of great significance for improving the pattern of ecological security.
1. Introduction
With the increase in population and rapid development of the social economy, the current ecological environment in China is becoming more and more severe. The pressure of human society on resources and the environment is increasing, which increasingly threatens the ecological security of the country and its regions [1]. In order to relieve the ecological pressure, a national barrier plan was proposed based on the main functional zoning [2]. A national ecological security strategic pattern, with “Two ecological barriers and three shelters” (TEBTS) as the mainstay, came into being [3]. The TEBTS ecological security strategic pattern is an important part of the “three strategic patterns” and an important guarantee pattern of the urbanization pattern strategy and the agricultural strategic pattern. The TEBTS ecological security strategic pattern is to build TEBTS and important river systems as the framework, with other national key ecological function areas as important support, and national development prohibited areas as an important component of the ecological security strategic pattern. TEBTS is an important part of building a national ecological security strategic pattern in the construction of ecological civilization, and a national ecological security pattern has been established. Providing ecosystem services is an important manifestation of the ecological security pattern. TEBTS is key to regional ecological security, and the ecosystem plays an important role in the region [4]. Therefore, a well-structured ecosystem is obviously the main body and the first element of an ecological barrier [5,6,7,8]. Each barrier zone of the TEBTS has a principal ecosystem service. Due to the different needs of human beings, the ecosystem services provided by the barrier zone have a variety of extended features. In recent years, the research on the calculation of ecosystem services has tended toward diversification, and its quantitative evaluation methods are summarized into three categories: the physical measurement method, the energy method, and the value measurement method. Specific models for calculating specific ecosystem services include the water balance equation, general soil loss equation, WEPP model, SWAT model, InVEST model, ARIES model, etc. Among them, the trade-off and synergy between multiple ecosystem services has always been an important topic for mainstream scholars. Due to the diversity of ecosystem service types, the imbalance of spatial distribution, and the selectivity of human use, the relationships between ecosystem services have undergone dynamic changes, which are manifested in the form of trade-offs and synergy between mutual gains. Ecosystem services have intertwined and complex nonlinear relationships which are superimposed on the different preferences of humans concerning the choice of ecosystem services [9]. Changes in ecosystem pattern-process-function services lead to a synergy/trade-off between ecosystem services [10,11,12]. In practical applications, methods such as mathematical statistics, spatial mapping, scenario simulation, multiobjective decision making, and service liquidity analysis are generally used to carry out research on the synergy/trade-off between different service types at the time and space scales.
In recent years, conducting the synergy/trade-off analysis of ecosystem services and understanding the relationships between ecosystem services has become an important basis for ecological management decision making and regulation, and it is applied to agriculture, fishery production [13,14], forest management, marine space planning, energy management, etc. [15,16,17,18]. However, the synergy/trade-off of ecosystem services has a relatively complex temporal and spatial scale, and the difficulty lies in how to characterize the interaction between the structure, process, function, and service changes of ecosystems at different scales and their influencing factors. Scholars have also carried out a lot of research on this. Chan et al. found through GIS spatial analysis that there is only a weak correlation between the priority areas for biodiversity conservation and the six ecosystem service supply areas in the California Central Coast Ecological Zone [19]. Egoh et al. used graphs to characterize the supply of five ecosystem services in South Africa (surface water supply, water flow regulation, soil accumulation, soil retention, and carbon storage) and then assessed the relationship between them [20]. Raudsepp Hearne et al. conducted the spatial mapping and cluster analysis of 12 types of ecosystem services, identified 6 types of ecosystem service clusters, and finally identified the types and regions of synergy and trade-offs between different services [21]. Based on the production possibility boundary method, Chen et al. conducted a quantitative analysis on the relationship between ecosystem services in the Weihe River Basin. The study showed that there is a trade-off relationship between water retention and carbon sequestration and between water retention and biodiversity, and there is synergy between carbon sequestration and biodiversity [22]. Through partial correlation analysis, Sun et al. explored the trade-off and synergy between the ecosystem services in Yan’an. They found that there is a trade-off relationship between soil conservation and crop production and between water retention and NPP, and there is a synergistic relationship between NPP and soil conservation and between NPP and water retention [23].
However, most scholars have not conducted outstanding research on the spatial heterogeneity of ecosystem service synergy/trade-offs. From a spatial perspective, the response to changes in ecosystem services is based on irregular geographic units. Clarifying the spatial boundaries and spatial characteristics of ecosystem services is an important research direction for the integration of ecosystem services and geography. Geographical units are patches with spatial characteristics based on landscape types.
The ecosystem service evaluation models currently applied are all based on grid units in space, which cannot fully express the spatial heterogeneity of terrain, vegetation, and soil. In a complex geographic environment, it cannot integrate topography and other factors into the study of ecosystem services. The synergy/trade-off analysis of ecosystem services should not be based on a regular grid unit as a carrier, but should be a geographical unit with independent characteristics. Regardless of their size or shape, it should be considered whether the geographic features in the geographic unit are consistent. The grids with consistent geographic features are summarized as a geographic unit, and each geographic unit has a unique spatial structure and topological relationship. Only by using this geographic unit for analysis can we better evaluate the ecosystem service synergy/trade-off relationship as a whole. Therefore, it is urgent to establish a method based on the onsite geomorphology to evaluate the synergy/trade-off relationship of ecosystem services. An ecological unit (EU) is a spatial patch delineated based on factors such as hydrology, land cover, vegetation types, and soil types. EUs can reflect the spatial changes of ecosystem service elements and can describe the impact of changes in underlying surface features on ecosystem services [24,25]. EUs are land surface complexes with the same terrain distribution, vegetation types, and soil conditions. They are also geographic units that integrate the spatial heterogeneity of elements such as terrain, soil, and land use patterns. EUs include a unique water outlet, which can effectively reflect the law of water movement in the basin. In EUs, the movement of water and sediment will be directed to the only water outlet. The water retention function and the soil conservation function can be reflected by EUs. Meanwhile, since the ecological unit is constructed with unique topography, vegetation, soil, and land features, ecosystem services, such as carbon sequestration and biodiversity, are also unique. At the spatial scale, EUs are used as carriers for studying the synergy/trade-off relationship of ecosystem services and express the aggregation characteristics of ecosystem services. At the time scale, the influence of the spatial characteristics of EUs on the synergy/trade-off of ecosystem services needs to be further studied, and the theory of landscape pattern needs to be applied to the analysis of the structure of EUs. The landscape pattern is a feature of the spatial pattern, that is, the spatial arrangement and combination of landscape elements of different sizes and shapes. It includes the type, number, and spatial distribution and configuration of the constituent units, which are a concrete manifestation of spatial heterogeneity. The pattern index constructed using the theory of landscape pattern can effectively reflect the spatial information of EUs. EUs can evaluate the characteristics of the spatial structure, combining the attributes of the EUs themselves and discussing the influence of the characteristics of the EU on the ecosystem service synergy/trade-off relationship in a certain period of time. Therefore, the use of ecological units in the study of ecosystem service synergy/tradeoffs has theoretical and practical foundations.
This study takes the SRB as the research area, calculating the value of ecosystem services in 2000, 2005, 2010, and 2015, respectively, constructing EUs and using EUs as carriers to conduct synergy/trade-off spatiotemporal analysis, and at the spatial scale, using bivariate local autocorrelation to determine the ecosystem service synergy/trade-off relationship and clarify the clustering characteristics of ecosystem services. Through correlation analysis, the study distinguishes the synergy/trade-off relationship of ecological service functions at the time scale with significant characteristics. At the same time, it explores the relationship between the attribute characteristics and spatial characteristics in the ecological unit and the synergy/trade-off of ecosystem services.
2. Study Area
The SRB (Figure 1) covers an area of 546,000 km2, which belongs to the three provinces and autonomous regions of Inner Mongolia, Jilin, and Heilongjiang, of which 61% are mountainous areas, 15% are hills, and 24% are plains. The Sanjiang and Songnen Plains are in the east and west of the river basin, the land is fertile, and the grassland is continuous. The SRB has an obvious continental monsoon climate, with hot and rainy summers and cold and dry winters, and the four seasons have obvious differences [26]. There are obvious spatial differences in the average precipitation in the basin over many years. The rainfall in the mountainous areas in the southeast is between 700 and 900 mm, while the western region is relatively dry, with an annual rainfall of only about 400 mm. The average annual runoff of the SRB over many years reached 76.2 billion m3. The annual average runoff depth of the basin over many years is 134.3 mm, and the spatial distribution characteristics are basically consistent with the annual precipitation. In the highest mountain area, it can reach about 500 mm, while in the Songnen Plain, it is only 20–30 mm. In the SRB, there are eleven principal types of soils, including luvisols, phaeozems, and chernozems. The vegetation types in the SRB are mainly divided into three categories: forests in mountains and hilly areas and grasslands and crops in the Northeast Plain. Due to the relationship between the latitude and climate, the Great Khingan and Lesser Khingan Mountains have coniferous forests in the sub-frigid zone, and there are cold and temperate coniferous and broad-leaved forests in the Changbai Mountains. In the northwest of the Songnen Plain, forest surrounds the steppe [27,28].
3. Data and Methodology
3.1. Data
The boundaries of the SRB and the NFZ are provided by the “National Scale Ecosystem Service Evaluation and Analysis Model System”. The Digital Elevation Model (DEM) is obtained from the Geospatial Data Cloud (http://www.gscloud.cn/ accessed on 25 September 2020). The data sources required by the ecosystem service assessment model are shown in Table 1.
3.2. Approaches
This study (Figure 2) calculates water retention based on the theory of water balance, uses the RUSLE model to calculate soil conservation, uses the CASA model to calculate carbon sequestration, calculates biodiversity based on indicators such as the biological abundance index, and calculates the crop production based on the grain yield in the statistical year-book. It calculates ecosystem services in 2000, 2005, 2010, and 2015, respectively. EUs are delineated by terrain, vegetation type, and soil type, and EUs are used as research carriers. At the spatial scale, spatial autocorrelation expresses the ecosystem service synergy/trade-off relationship. The synergy relationship is embodied in ecosystem service high–high aggregation and low–low aggregation, and the trade-off relationship is embodied as high–low aggregation. Ecosystem services at the time scale are calculated by a unit-by-unit analysis method, and the impact of attribute characteristics and spatial topological characteristics on ecosystem service synergy/trade-off is analyzed.
3.2.1. Ecosystem Service Assessment Method
Water Retention Estimation
The improved water balance theory is used to evaluate the ecosystem service of water retention [29]. The theory believes that water retention is precipitation minus evapotranspiration (including canopy transpiration, canopy evaporation, and soil evaporation) and storm runoff. The whole process begins with atmospheric precipitation, after which part of the precipitation is intercepted by the canopy, and the other part penetrates the canopy and enters the soil [30,31].
The water retention amount () is calculated according to the water balance equation, namely:
In the formula, is the precipitation, is the sum of the transpiration and evaporation (including transpiration T, canopy intercepted evaporation , soil evaporation , and snow sublimation ), and is the surface runoff.
Soil Conservation Estimation
The soil conservation service function evaluation is based on the RUSLE model [32,33,34]. It is assumed that the soil conservation amount is the difference between the potential soil erosion amount and the actual soil erosion amount, that is, the difference between the actual soil erosion amount in the maximum soil erosion amount area without vegetation cover. The potential soil erosion is the amount of soil erosion determined by natural factors, such as climate, soil, topography, etc., that is, the state of soil erosion under the assumption that there is no vegetation protection. The actual soil erosion is the amount of soil erosion determined by factors such as climate, soil, topography, vegetation, etc., that is, the state of soil erosion under the existing vegetation coverage [35,36,37].
The difference between potential soil erosion and actual soil erosion is used to characterize the soil conservation function of the ecosystem. Considering the spatial and temporal scale, model complexity, and data availability, the amount of soil erosion is estimated using the Universal Soil Loss Equation (RUSLE). The model form is as follows:
Actual soil erosion:
Potential soil erosion:
Soil conservation amount:
In the formula, is the actual amount of soil erosion per unit area, and the unit is t/ha; is the potential soil erosion amount per unit area, and the unit is t/ha; is the amount of soil conservation per unit area, and the unit is t/ha; is the rainfall erosivity factor, expressed by the multi-year average annual rainfall erosivity index; is the soil erodibility factor, expressed as the amount of soil loss per unit area formed by the unit rainfall erosivity in the standard plot; is the slope length factor (dimensionless); is the slope factor (dimensionless); and is the vegetation cover factor (dimensionless).
Carbon Sequestration Estimation
In the carbon sequestration estimation, 1 kg of carbon is considered to be equivalent to 2.2 kg of organic matter. The carbon sequestration of the ecosystem can be obtained from the total amount of vegetation
In the formula, represents the fixed amount of per unit area of an ecosystem (g/m2), and represents the annual vegetation NPP per unit area of the ecosystem (g/m2).
There are many models for NPP estimation [38], and the prototype CASA model was proposed by Monteith. Later, Potter and Field et al. improved Monteith’s model. Due to its simple structure, and because the parameters can be obtained through remote sensing, the CASA model is widely used in NPP estimation at global and regional scales.
Biodiversity Estimation
Biodiversity is calculated by a comprehensive calculation of the biological abundance index, vegetation coverage, and number of rare and endangered animals and plants, expressed by the formula:
In the formula, is the biodiversity maintenance function index, dimensionless; is the biological abundance index, dimensionless, which is used to assign values according to the land use type; is the vegetation coverage, %; and is the richness of rare and endangered biological species, dimensionless.
Crop Production Estimation
The crop production in the statistical yearbook is used to establish a statistical relationship between geographical environment parameters in order to realize the spatialization of crop production. Statistics show that the annual precipitation, annual average temperature, and topographical undulations of the grain yield levels are significantly correlated, and the confidence level has passed the 0.05 test. Thus, the statistical model is established as follows:
where is the simulated crop production, t/ha; is the annual precipitation, mm; is the average annual temperature (°C); and is the topographic undulation (m).
3.2.2. Construction of Ecological Units
The results of the calculation of the ecosystem services are presented in the form of raster data. However, in reality, due to multiple factors, such as spatial differences and irregular land use types, the division of the ecosystem services must not be of a regular shape, like a grid. Therefore, we need to find a brand-new unit division method, transform the data presentation method, and make the delineated unit more suitable for the actual situation of the research area.
EUs are based on hydrological response units (HRUs); HRUs were originally defined as the basic units of simulation in the SWAT model [39]. HRUs conform to the fitness index method and are used to construct an adaptive index threshold system which can better delineate the ecosystem service zoning through hydrological analysis on the basis of DEM. The construction of HRUs is based on the hydrological analysis function in the ARCGIS software, and its theoretical basis is the D8 single flow algorithm [40]. However, the HRU divided by DEM can only represent one characteristic of terrain in space. There are also multiple types of land in the same unit, and the ecosystem services provided by them are also different. Therefore, the data on the soil type and vegetation type are used to divide the HRUs again, and the small patches of the boundary are merged to obtain the final EUs. The soil, vegetation, and watershed divisions of each ecological unit are different and have a certain uniqueness. The EUs constructed from this can better distinguish the boundaries of geographic units and reflect the mutual relationship between the ecosystem services.
3.2.3. Ecosystem Service Synergy/Trade-Off Time and Space Analysis Method
Synergy/Trade-Off Analysis Method of Ecosystem Services in Space
After determining that EUs will be used as carriers for defining radiation, we need to find a way to quantitatively and qualitatively study the synergy/trade-off of the ecosystem services in space. Spatial autocorrelation can be applied to express the aggregation characteristics of variables in space in this study [41,42]. Spatial autocorrelation refers to the potential interdependence between observation data of some variables in the same distribution area [43]. Statistically, through correlation analysis, whether there is a correlation between the changes of two phenomena can be detected. This is the same attribute variable of different observation objects, which is called autocorrelation. The parameters describing spatial autocorrelation include global autocorrelation and local autocorrelation. This study mainly uses bivariate local autocorrelation to express the synergy/trade-off of the ecosystem services in space.
Local spatial autocorrelation is a correlation index that uses the average value of adjacent positions to measure the degree of correlation between a position variable and other variables [44]. The calculation formula is as follows:
In the formula, is the attribute value in the cell, is the attribute value in the cell, and is the weight matrix representing the topological relationship of the space elements; is the number of EUs adjacent to the EU .
The bivariate local autocorrelation is defined as:
In the formula, ; ; is the value of the ecosystem service of the space unit ; is the value of the ecosystem service of the space unit q; and are the values of ecosystem services and , respectively; and and are the variances of ecosystem services and , respectively.
Time-Scale Ecosystem Service Synergy/Trade-Off Analysis Method
The synergy/trade-off of the ecosystem services at the time scale is based on the change of ecological service functions every five years. Through correlation analysis, the synergy/trade-off relationship between the ecosystem services in different time series is calculated.
Using the unit-by-unit analysis method, the correlation coefficient between the two sets of long-term series of ecosystem services is calculated, and the positive and negative correlations are used to judge the synergy/trade-off between the two ecosystem services [38]. The correlation coefficient calculation formula is as follows:
According to the null hypothesis test of the correlation coefficient, the test is used to evaluate the significance of the relationship between the ecosystem services at a time scale. The test formula is as follows:
In the formula, is the corresponding partial correlation coefficient, and is the number of observation samples. When , i.e., , the null hypothesis is rejected, and the correlation result is significant. When , i.e., , the null hypothesis is rejected, the correlation result is extremely significant.
The synergy/trade-off relationship of the ecosystem services iat the time scale is affected by many factors in the natural environment. The natural attribute characteristics of EUs, such as vegetation type and soil type, are correlated with the ecosystem service synergy/trade-off relationship, and the influence of natural attribute characteristics on the evolution of the ecosystem service synergy/trade-off is analyzed. Meanwhile, by the constructing pattern index, the relationship between the spatial characteristics of EUs and the synergy/trade-off of the ecosystem services at time scales is clarified. Based on the theory of landscape pattern and the use of EUs as carriers, the pattern index is applied to the study of the correlation between the spatial characteristics of the EU and the synergy/trade-off of the ecosystem services.
The Fragstats software is used to calculate the pattern index [45,46,47,48]. The software has three different research scales: the landscape scale, type scale, and patch scale. It is more appropriate to use the patch scale to study the pattern characteristics of geographic units. Therefore, this study selects the AREA, PERIM, GYRATE, PARA, SHAPE, and other indices (Table 2) to evaluate the pattern characteristics at the patch scale in order to explore the impact of the EU pattern characteristics on the trade-off/synergy of the ecosystem services.
4. Results
4.1. The Spatial Distribution and Change Characteristics of Ecosystem Services
The calculation results of water retention in 2000, 2005, 2010, and 2015 are compared (Figure 3). In the entire study area, the spatial differentiation of the water retention is more obvious, and it can be found that the water retention is greatly affected by land types in all years. In the past two decades, the water retention in the three regions of the Great Khingan Mountains, Lesser Khingan Mountains, and Changbai Mountains was relatively high. Among them, the water retention capacity at the southern foot of Changbai Mountain is the strongest, and the water retention capacity can reach 400 mm. The water retention in the east of the Lesser Khingan Mountains and other areas surrounding Changbai Mountain is about 150 mm. The water retention of the Great Khingan Mountains is generally about 100 mm. These three areas are covered by large areas of vegetation, which are dominated by larch, but they also contain a variety of trees and shrubs. The diversification of plants is conducive to the maintenance and improvement of the soil environment, and the developed root system and a good soil environment are conducive to the maintenance of soil moisture. During each rainfall, a large amount of water is fixed in the soil by plants, and the canopy interception of dense trees and shrubs can effectively absorb part of the rainfall. Therefore, forest land can conserve a huge amount of water and play an important role in water retention. The water retention of the Songnen Plain in the middle of the study area is lower than 50 mm. The Songnen Plain is mainly a farming area. As a large area of farmland is adjacent to Songhua River and Nen River, this area requires a huge amount of water due to the intensive planting of crops. The local residents generally drill wells around the farmland for irrigation, and the huge annual water demand results in the lowest water retention in the study area in the large-scale farmland distribution area. The amount of water retention in 2000 was between 0–678.73 mm; the amount of water retention in 2005 was between 0–622.42 mm; the amount of water retention in 2010 was between 0–651.46 mm; and the amount of water retention in 2015 was between 0–685.02 mm. Over time, the overall change is small. However, from 2005 to 2015, the water retention in the Great Khingan Mountains increased slightly. Based on the above results, it can be concluded that in a short period of time, the amount of water retention will not fluctuate too much, but some areas, such as the Great Khingan Mountains, will show a certain growth trend.
The calculation results of soil conservation in 2000, 2005, 2010, and 2015 are compared (Figure 4). The spatial distribution characteristics of the soil conservation ecosystem services are similar to those of the water conservation ecosystem services. The three regions of the Great Khingan Mountains, Lesser Khingan Mountains, and Changbai Mountain in the northeast forest belt have higher values for soil conservation. The western side of the Lesser Khingan Mountains and Changbai Mountain shows a strong soil conservation ability. The amount of soil conservation in the Great Khingan Mountains is slightly lower than that of the other NFZ regions. Both the water retention and soil conservation in the study area are affected by the water and soil conservation function of the NFZ. A large area of arbor and shrub forest has the function of conserving water and soil at the same time. The Songnen Plain, like the middle and lower reaches of the Nenjiang River Basin and the Songhua River Secondary Basin, is a typical farming area, and the amount of soil conservation approaches zero. In 2000, the amount of soil conservation was between 0–2231.22 t/ha; in 2005, the amount of soil conservation was between 0–2335.92 t/ha; in 2010, the amount of soil conservation was between 0–2393.42 t/ha; and in 2015, the amount of soil conservation was between 0–2796.35 t/ha. Comparing the soil conservation capacity of the four years, the soil conservation capacity continued to increase from 2000 to 2015. There was a sudden increase in the soil conservation capacity in 2015, but the soil conservation capacity in the Greater Khingan Mountains area decreased. Based on the above results, it can be concluded that the soil retention capacity will show a slow growth trend. However, in certain areas, such as the Great Khingan Mountains, affected by factors such as vegetation, topography, and climate, the amount of soil conservation will fluctuate to a certain extent.
The calculation results of carbon sequestration in 2000, 2005, 2010, and 2015 are compared (Figure 5). In the entire study area, the amount of carbon sequestration varies relatively smoothly in space, and the amount of carbon sequestration provided by the forest land is greater than the amount of carbon sequestration provided by the cultivated land. The amount of carbon sequestration in the NFZ is greater than that in other regions. From the analysis of the change characteristics of carbon sequestration in the past two decades, the amount of carbon sequestration in 2000 was between 117.80 and 1570.02 g/m2; the amount of carbon sequestration in 2005 was between 119.39 and 1711.16 g/m2; the amount of carbon sequestration in 2010 was between 129.60 and 1806.73 g/m2; and the amount of carbon sequestration in 2015 was between 142.70 and 1650.73 g/m2. From 2000 to 2010, the maximum amount of carbon sequestration continued to increase, reaching 1806.73 g/m2 in 2010. Carbon sequestration services gather at the southern foot of Changbai Mountain, where the amount of carbon sequestration in this area increases at a rate of more than 100 g/m2 every five years. The amount of carbon sequestration in the other regions showed a fluctuating trend. Among them, the amount of carbon sequestration in the Great Khingan Mountains and the Songnen Plain firstly increased and then decreased during the ten years from 2000 to 2010, while the amount of carbon sequestration in the Lesser Khingan Mountains increased slowly. In 2015, the maximum amount of carbon sequestration dropped to 1650.73 g/m2. Except for the southern foot of Changbai Mountain, the amount of carbon sequestration in the other regions has shown an upward trend. Based on the above results, it can be concluded that the overall ecosystem services of carbon sequestration show an upward trend, but in individual years, the amount of carbon sequestration will fluctuate within a small range. Meanwhile, the amount of carbon sequestration at the southern foot of Changbai Mountain increased rapidly in the previous ten years and stabilized in a relatively high range in 2015.
The calculation results of biodiversity in 2000, 2005, 2010, and 2015 are compared (Figure 6). In the entire study area, the spatial differences in biodiversity are obvious, and biodiversity is greatly affected by land types in all years. In the past two decades, the biodiversity of the forest land in the Great Khingan Mountains, Lesser Khingan Mountains, and Changbai Mountain is far greater than that of the other land types. In 2000, 2005, 2010, and 2015, the value range of biodiversity is between 0–100. The biodiversity of the north-east forest belt has basically remained unchanged, and only some areas of the Songnen Plain show slight fluctuations. These areas are all areas with a small biodiversity base, and they cannot have a significant effect on the overall biodiversity. Based on the above results, it can be concluded that the biodiversity is relatively stable and does not frequently show huge changes. The forest land is more stable than the other land types, and the biodiversity of the forest land is much greater than that of the other land types.
The calculation results of crop production in 2000, 2005, 2010, and 2015 are compared (Figure 7). The spatial difference of regionalization in the study area is obvious. The areas with higher grain yields are mainly distributed in plain areas, such as the Songnen Plain and the lower Songhua River, among which the eastern side of the Songnen Plain is the highest. In the forest areas of the Great Khingan Mountains, Lesser Khingan Mountains, and Changbai Mountains, the crop production is almost 0. The crop production in 2000 was between 0 and 608.78 t/km2; the crop production in 2005 was between 0 and 634.62 t/km2; the crop production in 2010 was between 0 and 723.09 t/km2; and the crop production in 2015 was between 0 and 783.63 t/km2. A comparison of the crop production in the four years shows an upward trend year by year, and the crop production has continued to increase over the past two decades. The growth of crop production from 2000 to 2005 was relatively slow, and the g crop production from 2005 to 2015 showed rapid growth. Based on the above results, it can be concluded that the ecosystem service of crop production is relatively stable, and the increase of arable land and the update of farming technology have effectively increased the crop production, which is greatly affected by human factors.
4.2. Ecosystem Service Spatial Evaluation Carrier
According to the hydrological analysis using the ARCGIS software, based on DEM, 362 EUs are divided. However, the EUs are only divided according to the topography and rivers in the study area, and the spatial division of ecosystem services is also affected by vegetation and soil types. Therefore, the EUs based on the topography and rivers are combined with the soil vegetation types and soil types for secondary division. Finally, 2208 EUs are obtained. EUs are evaluation units with unique spatial location information and soil vegetation types. They are of great significance as carriers for presenting the synergy/trade-off relationship of ecosystem services in space. This is because the calculation results of ecosystem services are raster data, and in reality, ecosystem services are not bounded by a fixed grid unit size. EUs are more realistic response units, which are constructed based on actual conditions. Each EU has unique soil types, vegetation coverage, topographic slope characteristics, boundary characteristics, and spatial topological relationships. Therefore, it is highly scientific and feasible to use ecological units as carriers for ecosystem service synergy/trade-off analysis.
The EUs of the study area are shown in Figure 8 and Figure 9, presenting the spatial distribution characteristics of the EUs according to the vegetation and soil types. The distribution of forests in the study area is the most concentrated. Among them, there are 671 EUs representing broadleaf forests, 149 EUs representing coniferous forests, and 40 EUs representing coniferous and broadleaf mixed forests. The forests are mainly distributed in the Great Khingan Mountains, Lesser Khingan Mountains, and Changbai Mountains. This combined area accounts for about 40% of the entire study area. The farmland is mainly distributed in the Songnen Plain. There is also a small part of farmland in the lower reaches of Songhua River. There are 829 EUs, and the area is similar to that of forest land. There are 339 EUs of grassland and meadows, which are scattered and interspersed between woodland and farmland and have no clustering characteristics. There are 72 EUs of shrubs, which are mainly distributed in the marginal areas of the Great Khingan Mountains and Changbai Mountains. There are 88 swamp EUs, which are concentrated among the forests of the Great Khingan Mountains. There are eleven types of soil in the SRZ, including chernozems, phaeozems, and luvisols. Among them, there are six types of chernozems, luvisols, phaeozems, cambisol, gleysols, and arenosols. The area of chernozems and phaeozems constitutes close to half of the study area. There are 1004 EUs, which are mainly distributed in the Songnen Plain and are suitable for farmland cultivation. There are 829 luvisols EUs, which are mainly distributed in the forest areas of the Great Khingan Mountains and Changbai Mountains. Cambisol, gleysols, and arenosols are scattered, but the area of a single patch is larger. Cambisol and gleysols are mainly distributed in forest land, while arenosols are interspersed in black soil fields.
4.3. Ecosystem Service Synergy/Trade-Off Relationship within the Spatial Area
The synergy/trade-off relationship between water retention and soil conservation in spatial from 2000 to 2015 is shown in Figure 10 and Table S1. Water retention and soil conservation are in a synergistic relationship on the whole. The synergy is mainly concentrated in four areas: the Songnen Plain, Changbai Mountain, the western side of the Lesser Khingan Mountains, and near the outlet of Songhua River. The Songnen Plain is the largest synergy gathering area, and its core area embodies an extremely significant synergy and shows a very significant synergistic relationship. This area is mainly a farming area, and the soil types are chernozems and phaeozems. The fringe area of the Songnen Plain is dominated by grassland and shrubs, which are shown to be in a significant synergistic relationship. However, the Songnen Plain has poor water retention and soil conservation capabilities. While it reflects a large area of synergy, the value of the overall ecosystem services is not large. The synergistic situation in the lower part of Songhua River is similar to that of the Songnen Plain, and the area is small. Both the western side of the Lesser Khingan Mountains and Changbai Mountain show a significant synergistic relationship between water retention and soil conservation. The Changbai Mountain shows a particularly significant synergistic relationship. The area is dominated by broadleaf forests. The soil types are luvisols and cambisol. A large-scale forest coverage effectively ensures that the water retention and soil conservation are maintained at a high level, reflecting synergy with a high aggregation. There are few EUs that reflect the trade-off relationship between water retention and soil conservation, and they are mainly distributed in the Songnen Plain marshes and some areas of meadows. The synergy/trade-off relationship between water retention and soil conservation in 2000, 2005, 2010, and 2015 is compared. The results in 2000, 2005, and 2010 show relatively consistent characteristics. Only in 2005, the synergistic relationship in the marginal area of the Songnen Plain fluctuated slightly. The stability and aggregation characteristics of the synergistic relationship in the NFZ were higher than those in the Songnen Plain. In 2015, compared with other years, the EUs with trade-off characteristics increased on a large scale. The water retention and soil conservation of the Songnen Plain were lower. Compared with the forest area, the stability of the cooperative relationship in the farming area was poor.
The synergy/trade-off relationship between water retention and biodiversity in spatial from 2000 to 2015 is shown in Figure 11 and Table S1. Water retention and biodiversity are in a synergistic relationship on the whole. The synergy is mainly concentrated in four areas: the northwestern part of the Great Khingan Mountains, the fringe area of the Songnen Plain, the eastern side of the Lesser Khingan Mountains, and the Changbai Mountains. The Great Khingan Mountains, Lesser Khingan Mountains, and Changbai Mountains are the components of the northeastern forest belt. The large-scale forest coverage has a high biodiversity level, and the water conservation of the northeast forest belt is maintained at a high level. Therefore, the water retention and biodiversity in the NFZ show a significant synergistic relationship. The Songnen Plain’s farming areas have a poor biodiversity, and the water retention is much lower than that in the NFZ. Therefore, in the fringe area of the Songnen Plain, there are large areas of low-value gathering areas. In this area, the water retention and biodiversity present a significant synergistic relationship. The years 2000, 2005, and 2010 showed more consistent characteristics. In 2015, there was a very significant trade-off relationship in the northwestern part of the Greater Khingan Mountains. This indicates that there is a limit threshold for the synergy between water retention and biodiversity. When a certain ecosystem service exceeds the threshold, the synergy between the water conservation and biodiversity will immediately be reversed and become a trade-off relationship. Meanwhile, in 2015, a large number of EUs with trade-offs occurred at the edge of the Songnen Plain. In the cultivated land with a low water retention and biodiversity, the stability of the synergy and trade-off relationship between the ecosystem services is also poor.
The synergy/trade-off relationship between the water retention and carbon sequestration at the spatial scale from 2000 to 2015 is shown in Figure 12 and Table S1. In 2000, the water retention and carbon sequestration showed a significant synergistic relationship in the core area of Changbai Mountain. The area was dominated by broadleaf forests and coniferous forests, and both the water retention and carbon sequestration reached high levels. While the meadows and arable land in the marginal area of Changbai Mountain increased, the water retention was greatly reduced, but the amount of carbon sequestration was maintained at a relatively high range in the arable land. Therefore, the marginal area of Changbai Mountain presents a trade-off relationship between water retention and carbon sequestration. There is a large area of significant synergy in the core area of the Songnen Plain, but there is a partial trade-off area on the western side. The grasslands and shrubs have a certain water retention capacity, but the amount of carbon sequestration is low. Therefore, it is embodied in the trade-off relationship between the water retention and carbon sequestration. In 2005, the significant synergy area of Changbai Mountain was reduced to the southern part of Changbai Mountain, the synergy area and trade-off area of the Songnen Plain were also reduced, and part of the synergy/trade-off area appeared in the northwest of the Great Khingan Mountains. In 2010, the two core areas of synergy/trade-off between the Songnen Plain and the southern foot of Changbai Mountain were still retained, and the synergy/trade-off area in the northwest of the Greater Khingan Mountains disappeared. Between 2000 and 2010, the core area of the Songnen Plain and the southern foot of Changbai Mountain were stable and significant synergistic areas. Meanwhile, some EUs at the edges of the two areas exhibit a trade-off relationship between water retention and carbon sequestration. In 2015, the Songnen Plain’s synergy/trade-off area was reduced, and only the southern foot of Changbai Mountain remained a large-scale synergy/trade-off area. Comparing the changes over the past two decades, the synergy/trade-off area of water retention and carbon sequestration has gradually shrunk and finally converged on the southern side of Changbai Mountain, showing an extremely significant synergistic relationship between water retention and carbon sequestration.
The synergy/trade-off relationship between soil conservation and biodiversity in the spatial characteristic from 2000 to 2015 is shown in Figure 13 and Table S1. The overall relationship between soil conservation and biodiversity is synergistic, and there has been little change over the past two decades. The northwestern part of the Great Khingan Mountains, parts of the Lesser Khingan Mountains, and Changbai Mountain show significant synergistic relationships. The northern and eastern marginal areas of the Songnen Plain also show a synergistic relationship, but the ecosystem service value is low.
The synergy/trade-off relationship between soil conservation and carbon sequestration in the spatial characteristic from 2000 to 2015 is shown in Figure 14 and Table S1. The synergy/trade-off relationship between soil conservation and carbon sequestration is similar to the evolution of the distribution characteristics of the synergy/trade-off relationship between water retention and carbon sequestration. In the past two decades, the southern foot of Changbai Mountain has always been a very significant synergy zone. The synergy of the Songnen Plain, as a low-value synergy zone with a low soil conservation and carbon sequestration, has gradually weakened. The marginal area of the two synergistic core areas is partially expressed as an EU indicating a trade-off relationship.
The synergy/trade-off relationship between biodiversity and carbon sequestration at the spatial scale from 2000 to 2015 is shown in Figure 15 and Table S1. In 2000, the biodiversity and carbon sequestration showed a significant synergistic relationship in the Songnen Plain. Meanwhile, there is a very significant synergy in the core area of Changbai Mountain. When the amount of carbon sequestration and biodiversity are maintained at a high/low level, the two show a significant synergy. At the western edge of Changbai Mountain, the biodiversity and carbon sequestration show a trade-off relationship. In 2005, the synergistic area of the Songnen Plain and Changbai Mountain was reduced. Part of the synergy/trade-off area appears in the northwest of the Great Khingan Mountains, and this area mainly shows a trade-off relationship. The synergy/trade-off relationship between biodiversity and carbon sequestration in 2010 is similar to that in 2000, but the synergistic area of Changbai Mountain has decreased. Compared with previous years, the synergy/trade-off relationship in 2015 had undergone major changes. The synergistic area of the Songnen Plain has been drastically reduced. Meanwhile, a large number of trade-off areas have been generated on the western side of Changbai Mountain, and the EUs showing a trade-off relationship have rapidly increased.
The synergy/trade-off relationship between crop production and water retention in the spatial characteristic from 2000 to 2015 is shown in Figure 16 and Table S1. Overall, there is a trade-off relationship between crop production and water retention between 2000 and 2010. The trade-off relationship is mainly distributed in four regions: the northern and eastern parts of the Songnen Plain, the lower Songhua River, the southern area of Changbai Mountain, and the eastern part of the Lesser Khingan Mountains. The Songnen Plain and the lower reaches of Songhua River are dominated by arable land, and the soil types are mainly phaeozems and chernozems. The characteristics of the trade-off between crop production and water retention in this area show that the crop production has a high-value accumulation and the water retention is low, with the two reflecting a trade-off relationship. The trade-off areas of Changbai Mountain and the Lesser Khingan Mountains are dominated by coniferous forests and broadleaf forests, and the soil types are luvisols, cambisols, and gleysols. The characteristics of the trade-off between crop production and water retention in this area are characterized by a low crop production and high water retention, and the two reflect a trade-off relationship. Changbai Mountain is dominated by broadleaf forests, showing a very significant trade-off relationship, while the coniferous forests and broadleaf forests in the eastern part of the Lesser Khingan Mountains are mixed, showing a relatively significant trade-off relationship. In 2015, the synergy/trade-off relationship between crop production and water retention had undergone major changes. The Songnen Plain area does not show any synergy/trade-off relationship. The northern part of the Great Khingan Mountains presents a significant synergistic relationship. The vegetation types are more complex, including coniferous forests, broadleaf forests, meadows, and swamps. The soil types are mainly luvisols. The synergistic feature is manifested in the low water retention and crop production. The southern part of Changbai Mountain presents a very significant synergistic relationship. The water retention in this area is relatively high, but the crop production is low. The western side of the area is a crop planting area, showing a partially synergistic relationship.
The synergy/trade-off relationship between crop production and soil conservation at the spatial scale from 2000 to 2015 is shown in Figure 17 and Table S1. The trade-off/synergy relationship in the past two decades is similar, and overall, there is a trade-off relationship between crop production and soil conservation. The trade-off relationship is mainly distributed in four regions: the Songnen Plain, the lower Songhua River, the eastern part of the Lesser Khingan Mountains, and Changbai Mountain. The Songnen Plain is the largest trade-off area. This area is dominated by crops, and the soil types are phaeozems and chernozems. The trade-off feature is embodied in the high crop production and low soil conservation. The trade-off characteristics of the lower Songhua River area are similar to those of the Songnen Plain. The trade-off area of the Lesser Khingan Mountains and Changbai Mountains is dominated by broadleaf forests and mixed forests. The soil types are luvisols and cambisols. The trade-off is characterized by a higher soil conservation and lower crop production. Some EUs in the core area of the Songnen Plain show a synergistic relationship. This area is mainly composed of meadows and swamps, and the crop production is low. Therefore, there is a synergistic relationship with soil conservation.
The synergy/trade-off relationship between crop production and biodiversity at the spatial scale from 2000 to 2015 is shown in Figure 18 and Table S1. The trade-off/synergy relationship in the past two decades is similar, and overall, there is a trade-off relationship between crop production and biodiversity. The trade-off relationship is mainly distributed in five regions: the Songnen Plain, the lower Songhua River, the western part of the Great Khingan Mountains, the eastern part of the Lesser Khingan Mountains, and Changbai Mountain. The eastern part of the Songnen Plain and the lower Songhua River have similar trade-off characteristics. The trade-off characteristics of the crop production and biodiversity in this area are characterized by a high value accumulation of crop production and low biodiversity, showing a trade-off relationship. The Great Khingan Mountains, Lesser Khingan Mountains, and Changbai Mountains also show a significant trade-off relationship. The vegetation types are mainly broadleaf forests, coniferous forests, and mixed forests, and the soil types are mainly luvisols. The trade-off is characterized by a high biodiversity and low crop production. There are still sporadic EUs in the Great Khingan Mountains and the Songnen Plain, showing a synergistic relationship. This area is mainly composed of meadows and shrubs, and the crop production is low. Therefore, there is a synergistic relationship with biodiversity.
The synergy/trade-off relationship between crop production and carbon sequestration in the spatial charactaristic from 2000 to 2015 is shown in Figure 19 and Table S1. In 2000, crop production and carbon sequestration showed a very significant trade-off relationship in the core area of Changbai Mountain, which is dominated by broadleaf forests and coniferous forests. The characteristic of the trade-off is that the crop production is low, and the amount of carbon sequestration reaches a higher level. The meadows and arable land in the marginal area of Changbai Mountain have increased, and the crop production has increased significantly. The amount of carbon sequestration in the arable land has also remained within a relatively high range. Therefore, the marginal area of Changbai Mountain shows a synergistic relationship between crop production and carbon sequestration. There are some significant trade-off areas in the core area of the Songnen Plain, but there are some synergistic areas on the western side of the Songnen Plain, and the crop production and the amount of carbon sequestration both show low levels. In 2005, the significant trade-off area of Changbai Mountain was reduced to the southern part of Changbai Mountain, and the synergy/trade-off area of the Songnen Plain was also reduced. In the northwestern part of the Great Khingan Mountains, a synergistic area appears. This area is dominated by coniferous forests, broadleaf forests, and swamps, and the soil type is luvisols. The synergistic feature is reflected within the low range of crop production and carbon sequestration in this area. In 2010, the two core areas of the Songnen Plain and the southern foot of Changbai Mountain were still retained, and the synergistic area in the northwest of the Great Khingan Mountains disappeared. From 2000 to 2010, the southern foot of Changbai Mountain was very stable as a significant trade-off area, and some EUs at the edge showed a synergistic relationship between crop production and carbon sequestration. Meanwhile, the synergy/trade-off area between the western part of the Songnen Plain and the southern part of the Great Khingan Mountains is also relatively stable. In 2015, the Songnen Plain’s synergy/trade-off area was greatly reduced, and only the southern foot of Changbai Mountain remained a large-scale synergy/trade-off area. Comparing the changes over the past two decades, the synergy/trade-off area between crop production and carbon sequestration has gradually shrunk and finally gathered on the southern side of Changbai Mountain, showing a significant trade-off relationship between crop production and carbon sequestration.
4.4. Ecological Service Function Time-Scale Synergy/Trade-Off Relationship
The synergy/trade-off relationship between water retention and soil conservation at the time scale from 2000 to 2015 is shown in Figure 20 and Table S2. The regions with a synergy/trade-off relationship are distributed in the Great Khingan Mountains, Lesser Khingan Mountains, and Changbai Mountain. The water retention and soil conservation are mainly synergistic. The 111 EUs present a significant synergistic relationship. The vegetation types are mainly shrubs and coniferous forests, as well as some meadows, shrubs, and planted crops. The soil types are mainly luvisols and phaeozems. The synergistic EUs are distributed more evenly in the NFZ. Relatively speaking, there are only 34 EUs showing a trade-off relationship, which are mainly distributed in the Lesser Khingan Mountains and Changbai Mountains. The soil types are mainly luvisols, and coniferous forests and broadleaf forests are the main vegetation types. The synergy/trade-off relationship between water retention and biodiversity at the time scale from 2000 to 2015 is shown in Figure 20 and Table S2. There are more EUs that are synergistic than trade-off EUs. Among them, there are some synergistic EUs in the Songnen Plain. In addition, the Northern Great Khingan Mountains, the eastern side of the Lesser Khingan Mountains, and the Changbai Mountains are intersected with synergy and trade-off regions. The synergistic EUs are mainly broadleaf forests, coniferous forests, and planted crops, and the soil types are mainly luvisols and phaeozems. The distribution of EUs showing a trade-off relationship is relatively scattered, but they are all contained in the NFZ. The vegetation types are mainly broadleaf forests, and the soil types include luvisols and phaeozems. The synergy/trade-off relationship between water retention and carbon sequestration at the time scale from 2000 to 2015 is shown in Figure 20 and Table S2. The areas in the study area showing the synergy/trade-off relationship are mainly distributed in the northern part of the Great Khingan Mountains, the western part of the Lesser Khingan Mountains, and the northern part of Changbai Mountain, with the most concentrated distribution in the north of Changbai Mountain. This area is a mixed area of planted crops and broadleaf forest. The altitude is not high, and the amount of water retention and carbon sequestration show a steady increase. On the whole, there are far more EUs showing a synergistic relationship than trade-off EUs, and 81 EUs showing a synergistic relationship are mainly distributed in the northern part of Changbai Mountain. This area is mainly constituted by broadleaf forests and planted crops, and the soil type is mainly luvisols. The synergy/trade-off relationship between soil conservation and biodiversity at the time scale from 2000 to 2015 is shown in Figure 20 and Table S2. EUs showing a synergy/trade-off relationship are mainly distributed in the NFZ. Among them, 84 EUs showed a significant synergistic relationship. Except for the NFZ, some farmland EUs in the Songnen Plain showed a synergistic relationship. The 45 EUs present a significant trade-off relationship, and the distribution is relatively scattered, with mainly broadleaf forests and coniferous forests, and the main soil type is luvisols. The synergy/trade-off relationship between soil conservation and carbon sequestration at the time scale from 2000 to 2015 is shown in Figure 20 and Table S2. EUs showing a synergy/trade-off relationship are gathered in the northern part of Changbai Mountain. There are more synergy EUs than trade-off EUs. The 69 synergy EUs are mainly broadleaf forests, and the soil types are mainly luvisols and phaeozems. There are 39 EUs showing a trade-off relationship, with mainly broadleaf forests and luvisols and phaeozems as the main soil types. The synergy/trade-off relationship between biodiversity and carbon sequestration at the time scale from 2000 to 2015 is shown in Figure 20 and Table S2. The biodiversity and carbon sequestration show a clear synergistic relationship at the time scale. Especially in the Songnen Plain, 474 EUs show a synergistic relationship, and planted crops and grassland meadows are the main vegetation types, indicating that biodiversity and carbon sequestration in the Songnen Plain both show a slow upward trend. The synergy/trade-off relationship between crop production and water retention at the time scale from 2000 to 2015 is shown in Figure 20 and Table S2. The crop production and water retention are embodied in a relatively scattered synergy/trade-off relationship on the time scale. Among them, the synergistic relationship is mainly distributed in the Great Khingan Mountains and Changbai Mountains. The vegetation types are mainly planted crops, broadleaf forests, and grasslands, and the soil types include chernozems and other types. The synergy feature is reflected in the increasing trend of the water retention and crop production. There are three trade-off ecological units in the Songnen Plain, and the trade-off relationship is reflected in the decrease in water retention and the increase in crop production. The synergy/trade-off relationship between the three types of ecosystem services of crop production and soil conservation, biodiversity, and carbon sequestration at the time scale from 2000 to 2015 is shown in the Figure 20 and Table S2. There is almost no synergy/trade-off relationship.
4.5. Ecosystem Service Time-Scale Synergy/Trade-Off Spatial Topological Characteristics
Since EUs have unique spatial location characteristics, the pattern index is used to explore the relationship between ecosystem service synergy/trade-off and EU spatial location characteristics. The pattern index can describe the edge index characteristics and shape characteristics of the EUs. The AREA, PERIM, GYRATE, PARA, SHAPE, FRAC, CIRCLE, and CONTIG of all ecological units are calculated (Table 3). The values are compared with the corresponding parameters of the EUs that present a synergy/trade-off relationship. The comparison results are shown in the table . Compared with the average value, the AREA and PERIM of the EUs of the water retention and soil conservation synergy area show little difference, but the GYRATE is smaller than the overall average value. The AREA of the trade-off area and the GYRATE are both smaller than the overall average, and the PARA is slightly larger than the average. On the whole, the GYRATE of the EUs in the synergy/trade-off area of water retention and soil conservation is smaller than the average value, and the PARA is slightly larger than the average value. The AREA, PERIM, and GYRATE of the EUs in the synergistic area of water retention and biodiversity are smaller than the overall average, and the SHAPE and FRAC are also smaller than the average. This shows that the collaboration area is relatively regular, and the EUs are small. The GYRATE and the CIRCLE of the trade-off EUs are smaller than the average value, which indicates that the trade-off EUs are relatively round and smaller than the average. On the whole, the GYRATE of the EUs in the synergy/trade-off of water retention and biodiversity is smaller than the average value. The GYRATE, PERIM, SHAPE, and CIRCLE of the EUs in the synergistic area of water retention and carbon sequestration were less than the average value. The PERIM, GYRATE, SHAPE, and CIRCLE of the trade-off EUs are smaller than the average value, indicating that the trade-off area is more regular, and the EUs are smaller. On the whole, the EUs in the synergy/trade-off area of water retention and carbon sequestration are relatively regular, and the EUs are small. The GYRATE and PERIM of the EUs in the synergy/trade-off of soil conservation and biodiversity are smaller than the overall average, indicating that the EUs in the region are small. The AREA, PERIM, and GYRATE of the EUs in the synergistic zone of soil conservation and carbon sequestration are all smaller than the overall average, indicating that the synergy zone is small. On the whole, the synergistic relationship between soil conservation and carbon sequestration and the pattern index is more obvious. The EUs in the synergistic area of biodiversity and carbon sequestration are similar to the overall average. The trade-off is that the area of the regional ecological unit is larger than the overall average, and the PERIM, SHAPE, and CIRCLE are smaller than the average, indicating that the EUs are larger and more regular. The EUs in the synergistic area of crop production and water retention are similar to the overall average. There are too few synergy/trade-off areas between crop production and the other three types of ecosystem services to show a certain degree of regularity. In summary, the synergy/trade-off relationship of ecosystem services has a certain correlation with the spatial characteristics of the EUs. The AREA and PERIM of the EU showing the synergy/trade-off relationship are small, and the GYRATE is also significantly smaller than other EUs. Moreover, the shape of the EUs in these areas is more regular. The EU shape in the water retention and biodiversity synergy/trade-off area and soil conservation and carbon sequestration synergy/trade-off area is the most regular. The average EU area in the water retention and soil conservation synergy/trade-off area and the soil conservation and biodiversity synergy/trade-off area is the smallest.
5. Discussion
The Songhua River basin in the study area mainly includes four large areas: the Great Khingan Mountains, Lesser Khingan Mountains, Songnen Plain, and Changbai Mountain, among which the Great Khingan Mountains, Lesser Khingan Mountains, and Changbai Mountain together constitute the NFZ in the National Ecological Barrier Zone. The distribution of the five types of ecosystem services, including water retention, soil conservation, biodiversity, carbon sequestration, and crop production, was significantly different between 2000 and 2015. Comparing the change characteristics of ecosystem services from 2000 to 2015, water conservation will not fluctuate much in the short term, but some areas, such as the Greater Xing’an Mountains, will show a certain growth trend: soil conservation shows a trend of slow growth, but in certain areas, such as the Greater Khingan Mountains, affected by factors such as vegetation, topography, and climate, the amount of soil conservation will fluctuate to a certain extent; carbon sequestration show an upward trend as a whole, but in individual years, the amount of carbon fixation and oxygen release will fluctuate in a small range; biodiversity is relatively stable; and crop production is relatively stable, and the increase in arable land and the upgrading of farming technology have effectively increased grain production, which is greatly affected by human factors. The NFZ is dominated by broadleaf forests, coniferous forests, and mixed forests. A variety of broadleaf, coniferous, and shrub vegetation is widely distributed in this area. The diversification of plants is conducive to the maintenance and improvement of a soil environment, and a developed root system and good soil environment are conducive to the maintenance of soil moisture. During each rainfall, a large amount of water is fixed in the soil by plants, and the canopy interception of dense trees and shrubs can effectively absorb part of the precipitation. Therefore, forest land can conserve a huge amount of water, and at the same time has a high amount of soil conservation [49,50]. The amount of carbon sequestration is affected by NPP. Biodiversity is defined by the complexity of the species in the system. The NFZ is a primitive large-scale natural forest with high vegetation coverage and diverse types. Therefore, biodiversity and carbon sequestration are also maintained in a relatively high range [51,52,53,54]. The Songnen Plain, as the alluvial plain of Songhua River and Nenjiang River, is the main food production area in the northeast. There is a lot of cultivated land, mainly planted crops, and the soil type is chernozems, which is suitable for crop growth [55]. In this area, the crop production is relatively high, while the other four types of ecosystem services are relatively low.
The synergy/trade-off relationship of ecosystem services at the spatial scale is shown in Figure 21. Water retention has a strong correlation with the other four types of ecosystem services. Among them, water retention and crop production are in a trade-off relationship, and water retention and the other three types of ecosystem services are in a synergistic relationship. Yin believes that the synergy between water retention and soil conservation is an important synergy in the TEBTS of the National Barrier Zone in his research on the synergy/trade-off of ecosystem services in the National Barrier Zone [56]. Soil conservation is similar to water retention. It has a strong correlation with the other four types of ecosystem services. Among them, soil conservation and crop production are in a trade-off relationship, and the other three types of ecosystem services are in a synergistic relationship. Biodiversity is not highly related to carbon sequestration and is highly related to the other three types of ecosystem services. Biodiversity and crop production are in a trade-off relationship, and there is a synergistic relationship with the other three types of ecosystem services. Carbon sequestration is not highly correlated with the other ecosystem services. They are in a trade-off relationship with crop production, and they are in a synergistic relationship with the other three types of ecosystem services. Crop production and the other four types of ecosystem services all present a trade-off relationship. In his research on the synergy/trade-off of ecosystem services in Northeast China, Qi also found that the three types of ecosystem services, including crop production and water retention, are in a trade-off relationship, and water retention and soil conservation are in a significant synergistic relationship [57]. At the time scale, the synergy/trade-off relationship among the four types of ecosystem services, including water retention, soil conservation, biodiversity, and carbon sequestration, is mainly synergistic. The synergy/trade-off areas are mainly distributed in the NFZ, but the EUs showing a significant synergy/trade-off relationship are relatively scattered [58]. The EUs showing a synergistic relationship are mainly broadleaf forests, and the soil type is luvisols. Meanwhile, the ecosystem service synergy/trade-off relationship has a certain correlation with the spatial characteristics. The EUs with a synergy/trade-off relationship are smaller in the AREA and PERIM, and the GYRATE is also significantly smaller than that of the other EUs. Moreover, the shape of the EUs in this area is more regular. Compared with the other EUs, the boundary between this type of EU and the surrounding EUs is smaller and stable. Over a certain period of time, the probability of ecological energy interaction is reduced, so that the ecosystem services maintain a stable change trend and finally show a significant synergy/trade-off relationship. This shows that the four types of ecosystem services—water retention, soil conservation, biodiversity, and carbon sequestration—have a greater probability of showing a synergy/trade-off relationship under the conditions of these attributes and spatial characteristics [59,60]. Crop production and water retention are mainly synergistic at the time scale [56], and the synergy feature is reflected in the increase in water retention and crop production year by year. The synergy/trade-off relationship between crop production and water retention does not show any correlation with the spatial characteristics of EUs.
However, this study still has some limits, which are as follows. When analyzing the synergy/trade-off relationship between EU attributes and spatial characteristics for ecosystem services, only natural attributes, such as vegetation types and soil types, are considered, and other factors affecting ecosystem services are not considered. In recent years, human activities have had an increasing impact on ecosystem service synergy/trade-off relationships. In particular, countries in key ecological regions have formulated relevant ecological restoration or ecological optimization policies, which will seriously affect ecosystem service synergy/trade-off relationships. Therefore, the next step is to consider more natural and social attributes and incorporate them into the spatial database of synergy/trade-off analysis. EUs are carriers in the study of the time-scale ecosystem service synergy/trade-off relationship. Within a certain period of time, EUs may have small-scale changes. The use of unified EUs is beneficial to the research itself, but they may have slight differences from the actual situation. In addition, the results show that the impact of ecosystem services is not limited to EUs, as the change of a certain ecosystem service may cause the response of other ecosystem services within a certain range. Ecosystem services not only have internal effects, but also external benefits. When the “source” and “sink” of ecosystem services are not uniform in space, the phenomenon of ecosystem service flow occurs. Therefore, we will consider this phenomenon in further research exploring the relationship between different ecosystem services inside and outside EUs by simulating the ecosystem service flow.
This research explores the synergy/trade-off relationship of ecosystem services at the spatial and time scales by constructing EUs. The essence of ecosystem service synergy/trade-offs in the spatial characteristic is to express the spatial aggregation characteristics of ecosystem services, and the essence of time-scale ecosystem service synergy/trade-offs is to express the relationship between the current and future use of ecosystem services. Focusing on the relationship between ecosystem service synergy/trade-offs and attribute and spatial characteristics, the impact of attribute characteristics and spatial characteristics on ecosystem service synergy/trade-offs can be qualitatively analyzed. The influencing factors of ecosystem service synergy/trade-offs can be clarified, incorporating key areas with different ecosystem services into the ecosystem, integrating ecosystem services, and using this as a basis to optimize the ecosystem in order to maximize the value of regional ecosystem services [11,54]. The NFZ in this study has a higher water retention, soil conservation, and other regulating and supporting functions. Each barrier zone in the TEBTS has a primary ecosystem service, and the synergy/trade-off between the primary ecosystem service and the secondary ecosystem service is coordinated. This is of great significance for improving the overall benefits of ecosystem services, ensuring the sustainable supply of ecosystem services, and realizing the “win–win” of human society and ecosystems [11]. Meanwhile, exploring the synergy/trade-off relationship of ecosystem services at spatial and time scales will provide a certain data basis and theoretical support for major projects, such as ecological restoration and ecological environment governance, which is of great significance for the improvement of the ecological security pattern [56].
6. Conclusions
Comparing the ecosystem services from 2000 to 2015, the water retention is between 0 and 700 mm, showing the characteristics of fluctuations. The water retention of the Lesser Khingan Mountains and Changbai Mountains is relatively large. The amount of soil conservation is between 0 and 2800 t/ha. The soil conservation reached its maximum in 2015, and the ecosystem services of soil conservation are higher in the northeastern forest zone. The amount of carbon sequestration is between 100–1900 g/m2. The amount of carbon sequestration in the northeastern forest zone is greater than that in other regions, but the spatial changes are relatively gentle, and the spatial difference is not obvious. From 2010 to 2015, the amount of carbon sequestration increased rapidly. The biodiversity is between 0–100, with obvious spatial differences. The forest areas, such as the Great Khingan Mountains, have much more biodiversity than other areas. The biodiversity is relatively stable, with almost no change in the past two decades. The crop production is between 0–800 t/km2, showing an increasing trend year by year. As the main crop production area, the Songnen Plain provides the main crop production function, which is greatly affected by humans. The ecological units are used as the research carriers, and 2208 ecological units are delineated based on the topography, vegetation type, and soil type. The ecological units include eight types of vegetation, such as broadleaf forests, and eleven types of soil, such as luvisols. Not only can ecological units better define the spatial scope of ecosystem services, but they also have spatial topological characteristics and attribute characteristics. Based on this, the influence of spatial characteristics and attribute characteristics on the change trend of ecosystem service synergy/trade-off relationships is analyzed.
At the spatial scale, the four types of ecosystem services—water retention, soil conservation, biodiversity, and carbon sequestration—present a synergistic relationship. Among them, the synergistic relationships between water retention and soil conservation, between water retention and biodiversity, and between soil conservation and biodiversity are the most significant. Crop production and the other four types of ecosystem services all present a trade-off relationship in space. Among them, crop production and water retention and crop production and biodiversity present a very significant trade-off relationship, crop production and soil conservation present a trade-off relationship, and there is no significant relationship between crop production and carbon sequestration. At the time scale, there is a synergistic relationship among the four types of ecosystem services: water retention, soil conservation, biodiversity, and carbon sequestration. Crop production and water retention present a synergistic relationship, but there is no significant synergy/trade-off relationship with the other three types of ecosystem services. The vegetation types showing a synergy/trade-off relationship are mainly broadleaf forests, with some coniferous forests and crops. The soil types are dominated by luvisols and phaeozems. The ecological units showing a synergy/trade-off relationship are mainly distributed in the northeastern forest zone and have certain spatial topological characteristics: the EU showing a synergy/trade-off relationship is smaller in the AREA and PERIM, the GYRATE is also significantly smaller than that of the other EUs, and the shape of the EUs are more regular.
In this study, we focused on the spatial aggregation characteristics and change trends of ecosystem service synergy/trade-offs and clarified the influencing factors of ecosystem service synergy/trade-offs by analyzing the influence of various characteristics on the change trends. Based on this, we integrated ecosystem services, optimized the ecosystem, maximized the value of regional ecosystem services, and provided a data foundation and theoretical support for improving the ecological security pattern.
The application prospects of this research are prominently reflected: based on the ecological unit, the spatial boundary of ecosystem services is clarified, and the spatial characteristics and attribute characteristics of ecosystem services are analyzed; and simulating the dynamic characteristics of natural factors affecting ecosystem services and analyzing the characteristics of different spatial attributes leads to the synergy/trade-off of ecosystem services. In summary, this study makes the research on ecosystem service synergy/trade-off more diversified. The research carrier is upgraded from a regular grid to an ecological unit that expresses spatial and attribute characteristics. At the same time, the relationship between spatial characteristics and attribute characteristics and the synergy/trade-off of ecosystem services has been established, which lays the foundation for studying the mechanism of ecosystem services’ synergy/trade-off response.
Supplementary Materials
The following are available online at https://0-www-mdpi-com.brum.beds.ac.uk/article/10.3390/f12080992/s1, Table S1. Space-scale ecosystem service synergy/trade-off. Table S2. Time-scale ecosystem service synergy/trade-off.
Author Contributions
Conceptualization, T.N. and J.Y.; methodology, T.N.; software, T.N.; validation, T.N. and D.Y.; formal analysis, L.Y.; investigation, Q.L.; resources, X.M.; data curation, Q.L.; writing—original draft preparation, Y.H.; writing—review and editing, T.N.; visualization, T.N.; supervision, D.Y.; project administration, D.Y.; funding acquisition, D.Y. All authors have read and agreed to the published version of the manuscript.
Funding
This research is supported by the National Key Research and Development Program of China (2016YFC0507303).
Acknowledgments
Thank you for the data support provided by the research group “National Scale Ecosystem Service Evaluation and Analysis Model System”. The authors also thank the reviewers for their valuable suggestions that helped to improve the quality of the manuscript.
Conflicts of Interest
The authors declare no conflict of interest.
References
- Qin, X.N.; Lu, X.L.; Wu, C.Y. The knowledge mapping of domestic ecological security research: Bibliometric analysis based on citespace. Acta Ecol. Sin. 2014, 34, 3693–3703. [Google Scholar]
- Wang, Y.; Pan, J.H. Building ecological security patterns based on ecosystem services value reconstruction in an arid inland basin: A case study in Ganzhou District, NW China. J. Clean. Prod. 2019, 241, 118337. [Google Scholar] [CrossRef]
- Wang, X.F.; Lesi, M.C.; Zhang, M.M. Ecosystem pattern change and its influencing factors of “two barriers and three belts”. Chin. J. Ecol. 2019, 38, 2138–2148. [Google Scholar]
- Wang, Y.; Li, X.M.; Zhang, F.; Wang, W.W.; Xiao, R.B. Effects of rapid urbanization on ecological functional vulnerability of the land system in Wuhan, China: A flow and stock perspective. J. Clean. Prod. 2019, 119284. [Google Scholar] [CrossRef]
- Agetsuma, N. Ecological function losses caused by monotonous land use induce crop raiding by wildlife on the island of Yakushima, southern Japan. Ecol. Res. 2007, 22, 390–402. [Google Scholar] [CrossRef]
- Du, L.J.; Wang, X.R.; Liu, Y. Ecological compensate standard accounting of soil and water conservation. J. Hydraul. Eng. 2010, 41, 1346–1352. [Google Scholar]
- Prober, S.M.; Thiele, K.R.; Lunt, I.D.; Koen, T.B. Restoring Ecological Function in Temperate Grassy Woodlands: Manipu-lating Soil Nutrients, Exotic Annuals and Native Perennial Grasses through Carbon Supplements and Spring Burns. J. Appl. Ecol. 2005, 42, 1073–1085. [Google Scholar] [CrossRef]
- Yao, E.M.; Xiao, Y.; Ouyang, Z.Y.; Zheng, H. Spatial characteristics of soil conservation service and its impact factors in Hainan Island. Acta Ecol. Sin. 2013, 33, 83–92. [Google Scholar]
- Bennett, E.M.; Peterson, G.D.; Gordon, L.J. Understanding relationships among multiple ecosystem services. Ecol. Lett. 2009, 12, 1394–1404. [Google Scholar] [CrossRef] [PubMed]
- Li, S.; Wang, J.; Zhu, W.; Zhang, J.; Liu, Y.; Gao, Y.; Li, Y. Research framework of ecosystem services geography from spatial and regional perspectives. Acta Geogr. Sin. 2014, 69, 1628–1639. [Google Scholar]
- Dai, E.; Wang, X.; Zhu, J.; Gao, J. Progress and Perspective on Ecosystem Services Trade-offs. Prog. Geogr. 2015, 30, 1250–1259. [Google Scholar]
- Fu, B.; Yu, D. Trade-off analyses and synthetic integrated method of multiple ecosystem services. Resour. Sci. 2016, 38, 1–9. [Google Scholar]
- Zhao, W.; Liu, Y.; Feng, Q.; Wang, Y.; Yang, S. Ecosystem services for coupled human and environment systems. Prog. Geogr. 2018, 37, 139–151. [Google Scholar]
- Lautenbach, S.; Volk, M.; Whittaker, G.; Seppelt, R. Optimization-based trade-off analysis of biodiesel crop production for managing an agricultural catchment. Environ. Model. Softw. 2013, 48, 98–112. [Google Scholar] [CrossRef]
- Oken, K.L.; Essington, T.E. Evaluating the effect of a selective piscivore fishery on rockfish recovery within marine pro-tected areas. ICES J. Mar. Sci. 2016, 73, 2267–2277. [Google Scholar] [CrossRef] [Green Version]
- Vauhkonen, J.; Ruotsalainen, R. Assessing the provisioning of ecosystem services in a Scandinavian boreal forest: Suitability and tradeoff analyses on grid-based wall-to-wall forest inventory data. For. Ecol. Manag. 2017, 389, 272–284. [Google Scholar] [CrossRef] [Green Version]
- White, C.; Halpern, B.C.; Kappel, C.V. Ecosystem service tradeoff analysis reveals the value of marine spatial planning for multiple ocean uses. Proc. Natl. Acad. Sci. USA 2012, 109, 4696–4701. [Google Scholar] [CrossRef] [PubMed] [Green Version]
- Gissi, E.; Gaglio, M.; Reho, M. Sustainable energy potential from biomass through ecosystem services trade-off analysis: The case of the Province of Rovigo (Northern Italy). Ecosyst. Serv. 2016, 18, 1–19. [Google Scholar] [CrossRef]
- Chan, K.M.A.; Shaw, M.R.; Cameron, D.R.; Underwood, E.C.; Daily, G.C. Conservation planning for ecosystem services. PLoS Biol. 2006, 4, 2138–2152. [Google Scholar] [CrossRef] [PubMed] [Green Version]
- Egoh, B.; Reyers, B.; Rouget, M.; Bode, M.; Richardson, D.M. Spatial congruence between biodiversity and ecosystem services in South Africa. Biol. Conserv. 2009, 142, 553–562. [Google Scholar] [CrossRef]
- Raudsepp-Hearne, C.; Peterson, G.D.; Bennett, E.M. Ecosystem service bundles for analyzing tradeoffs and services via functional traits. Biodivers. Conserv. 2010, 19, 2873–2893. [Google Scholar]
- Chen, D.; Li, J.; Yang, X.; Liu, Y. Trade-offs and optimization among ecosystem services in the Weihe River basin. Acta Ecol. Sin. 2018, 38, 3260–3271. [Google Scholar]
- Sun, Y.; Ren, Z.; Zhao, S.; Zhang, J. Spatial and temporal changing analysis of synergy and trade-off between ecosystem services in valley basins of Shaanxi Province. Acta Geogr. Sin. 2017, 72, 104–109. [Google Scholar]
- Ning, J.; Liu, G.; Liu, Q.; Xie, C. Spatial discretization of hydrological response units and improved SWAT model. Adv. Water Sci. 2012, 23, 14–20. [Google Scholar]
- Khan, U.; Tuteja, N.K.; Sharma, A. Delineating hydrologic response units in large upland catchments and its evaluation using soil moisture simulations. Environ. Model. Softw. 2013, 46, 142–154. [Google Scholar] [CrossRef]
- Miao, C.; Yang, L.; Liu, B.; Gao, Y.; Li, S.L. Streamflow changes and its influencing factors in the mainstream of the Songhua River Basin, Northeast China over the past 50 years. Environ. Earth Sci. 2010, 63, 489–499. [Google Scholar] [CrossRef]
- Yang, Y.H.; Yan, B.; Shen, W. Assessment of point and nonpoint sources pollution in Songhua River Basin, Northeast China by using revised water quality model. Chin. Geogr. Sci. 2010, 20, 30–36. [Google Scholar] [CrossRef]
- Li, Y.; Xu, L.Y.; Li, S. Water Quality Analysis of the Songhua River Basin Using Multivariate Techniques. J. Water Res. Prot. 2009, 1, 110–121. [Google Scholar] [CrossRef] [Green Version]
- Gong, S.; Xiao, Y.; Zheng, H.; Xiao, Y.; Ouyang, Y. Spatial patterns of ecosystem water conservation in China and its impact factors analysis. Acta Ecol. Sin. 2017, 37, 2455–2462. [Google Scholar]
- Wang, Z.; Zhang, K.; Xue, X.; Hong, Z.; Hong, Y.; Gourley, J. Water balance-based actual evapotranspiration reconstruction from ground and satellite observations over the conterminous United States. Water Resour. Res. 2015, 51, 6485–6499. [Google Scholar]
- Shima, N.; Hossein, A.; Ali, N. Simulation of water balance equation components using SWAT model in Samalqan Water-shed (Iran). Arab. J. Geosci. 2020, 13, 1–15. [Google Scholar]
- Ranzi, R.; Le, T.H.; Rulli, M.C. A RUSLE approach to model suspended sediment load in the Lo river (Vietnam): Effects of reservoirs and land use changes. J. Hydrol. 2012, 422, 17–29. [Google Scholar] [CrossRef]
- Wu, L.; Yan, L. Impact of road on soil erosion risk pattern based on RUSLE and GIS: A case study of Hangjinqu highway, Zhuji section. Acta Ecol. Sin. 2014, 34, 5659–5669. [Google Scholar]
- Chen, S.; Yang, X.; Xiao, L.; Cai, H. Study of Soil Erosion in the Southern Hillside Area of China Based on RUSLE Model. Resour. Sci. 2014, 36, 1288–1297. [Google Scholar]
- Hazem, A.; Juliet, S. Mapping the soil loss in Marqya basin: Syria using RUSLE model in GIS and RS techniques. Environ. Earth Sci. 2017, 76, 1–10. [Google Scholar]
- Yang, X. Deriving RUSLE cover factor from time-series fractional vegetation cover for hillslope erosion modelling in New South Wales. Soil Res. 2014, 52, 253–261. [Google Scholar] [CrossRef]
- Onori, F.; Bonis, P.; Grauso, S. Soil erosion prediction at the basin scale using the revised universal soil loss equation (RUSLE) in a catchment of Sicily (southern Italy). Environ. Geol. 2006, 50, 1129–1140. [Google Scholar] [CrossRef]
- Li, L.; Wu, D.; Wang, F.; Liu, Y.; Liu, Y.; Qian, L. Prediction and tradeoff analysis of ecosystem service value in the rapidly urbanizing Foshan City of China: A case study. Acta Ecol. Sin. 2020, 40, 9023–9036. [Google Scholar]
- Jayakrishnan, R.; Srinivasan, R.; Santhi, C.; Arnold, J.G. Advances in the Application of the SWAT Model for Water Resources Management. Hydrol. Process. 2005, 19, 749–762. [Google Scholar] [CrossRef]
- Yan, Z.; Ming, Y.; Roeder, E.; Hicks, R.W.; Yang, J.Z. Estimating Ammonium and Nitrate Load from Septic Systems to Sur-face Water Bodies within ArcGIS Environments. J. Hydrol. 2015, 532, 177–192. [Google Scholar]
- Koenig, W.D. Spatial autocorrelation of ecological phenomena. Trends Ecol. Evol. 1999, 14, 22–26. [Google Scholar] [CrossRef]
- Zhang, L.J.; Ma, Z.H.; Luo, G. An Evaluation of Spatial Autocorrelation and Heterogeneity in the Residuals of Six Regres-sion Models. For. Sci. 2009, 55, 533–548. [Google Scholar]
- Goodchild, M.F. First Law of Geography. Int. Ency. Hum. Geogr. 2009, 81, 179–182. [Google Scholar]
- Zhu, P.; Liu, X.; Zheng, Y.; Wang, S.; Huang, L. Tadeoffs and synergies of ecosystem services in key ecological function zones in northern China. Acta Ecol. Sin. 2020, 40, 8694–8706. [Google Scholar]
- Zhang, Y.; Cai, X.; Yang, C.; Song, X.; Li, Y.; Li, E.; Wang, X. Driving force analysis of landscape pattern changes in Honghu Wetland Nature Reserve in recent 40 years. J. Lake Sci. 2019, 31, 171–182. [Google Scholar]
- Li, J.; Zhou, Z. Landscape pattern and hydrological processes in Yanhe River basin of China. Acta Geogr. Sin. 2014, 69, 933–944. [Google Scholar]
- Zhang, Z.; Chen, S.; Wan, L.; Wan, L.; Cao, J.; Zhang, Q.; Yang, C. The effects of landscape pattern evolution on runoff and sediment based on SWAT model. Environ. Earth Sci. 2021, 80, 1–12. [Google Scholar] [CrossRef]
- Zhang, M.; Wang, J.; Li, S.; Feng, D.; Cao, E. Dynamic changes in landscape pattern in a large-scale opencast coal mine area from 1986 to 2015: A complex network approach. Catena 2020, 194, 10483. [Google Scholar] [CrossRef]
- Qi, D. Study on Evaluation of Forest Ecogical Ecosystem Services of Daxing-anling and Xiaoxing-anling Based on Ecological Location Coefficient. Master’s Thesis, Northeast Forestry University, Harbin, China, 2014. [Google Scholar]
- Xu, H.; Man, X.; Sheng, H. Water Conservation Function of Different Types of Larix gmelini Forests in Da Hinggan Mountains. Res. Soil Water Conserv. 2011, 18, 92–96. [Google Scholar]
- Diao, Q.; Meng, K.; Zhang, W.; Meng, X. Study on typical artificial forest carbon fixation and oxygen release in Xiao Hing-gan Mountains. For. Invest. Des. 2013, 2, 26–28. [Google Scholar]
- Wang, X. Study on Forest Ecosystem Services of Daxing-anling Forest in Inner Mongolia. Master’s Thesis, Inner Mongolia Agricultural University, Hohhot, China, 2014. [Google Scholar]
- Liu, L. Study on the Plant Biodiversity and Ecosystem Service Functions Evaluation of Forest Ecosystem In Xiaoxingan Mountains. Ph.D. Thesis, Northeast Forestry University, Harbin, China, 2014. [Google Scholar]
- Li, G.; Zhao, W.; Wei, Y.; Fang, X.; Gao, B.; Dai, L. Evaluation on the influence of natural forest protection program on forest ecosystem service function in changbai mountain. Acta Ecol. Sin. 2015, 35, 984–992. [Google Scholar]
- Sui, H.; Song, G.; Zhang, H. Identification of production-living-ecological space at Keshan County level in main grain pro-ducing areas in northern Songnen Plain, China. Trans. Chin. Soc. Agric. Eng. 2010, 36, 264–271, 323. [Google Scholar]
- Yin, L.; Wang, X.; Zhang, K.; Xiao, F.; Cheng, C.; Zhang, X. Trade-offs and synergy between ecosystem services in National Barrier Zone. Geogr. Res. 2019, 38, 2162–2172. [Google Scholar]
- Qi, N.; Zhao, J.; Yang, Y.; Gou, R.; Chen, J.; Zhao, P.; Li, W. Quantifying ecosystem service trade-offs and synergies in Northeast China based on ecosystem service bundles. Acta Ecol. Sin. 2020, 40, 2827–2837. [Google Scholar]
- Han, M.; Dong, X.; Guan, H.; Zhang, Q. Effects of Soil Properties on Ecological Functions in Different Succession Stages of Natural Larix gmelinii Forest in Daxing’an Mountains. J. Northeast. For. Univ. 2019, 47, 50–54, 89. [Google Scholar]
- Yang, S. The Effect of Vegetation Restoration on Ecosystem Services Trade-off and Synergy in the Typical Watershed of the Loess Plateau of China. Ph.D. Thesis, Xi’an University of Technology, Xi’an, China, 2020. [Google Scholar]
- Li, L.; Wu, D.; Liu, Y. Hotspots and Trends of the Researches for Land Use and Ecosystem Service—Based on CiteSpace. Res. Soil Water Consev. 2020, 7, 396–404. [Google Scholar]
Figure 1.
Location of the study area.

Figure 2.
The research framework of the ecosystem services synergy/trade-off.

Figure 3.
Distribution map of water retention.

Figure 4.
Distribution map of soil conservation.

Figure 5.
Distribution map of carbon sequestration.

Figure 6.
Distribution map of biodiversity.

Figure 7.
Distribution map of crop production.

Figure 8.
Distribution map of vegetation types.

Figure 9.
Distribution map of soil types.

Figure 10.
The synergy/trade-off relationship between water retention and soil conservation.

Figure 11.
The synergy/trade-off relationship between water retention and biodiversity.

Figure 12.
The synergy/trade-off relationship between water retention and carbon sequestration.

Figure 13.
The synergy/trade-off relationship between soil conservation and biodiversity.

Figure 14.
The synergy/trade-off relationship between soil conservation and carbon sequestration.

Figure 15.
The synergy/trade-off relationship between carbon sequestration and biodiversity.

Figure 16.
The synergy/trade-off relationship between water retention and crop production.

Figure 17.
The synergy/trade-off relationship between crop production and soil conservation.

Figure 18.
The synergy/trade-off relationship between crop production and biodiversity.

Figure 19.
The synergy/trade-off relationship between crop production and carbon sequestration.

Figure 20.
Time-scale ecosystem service synergy/trade-off.

Figure 21.
Ecosystem service synergy/trade-off change trend.


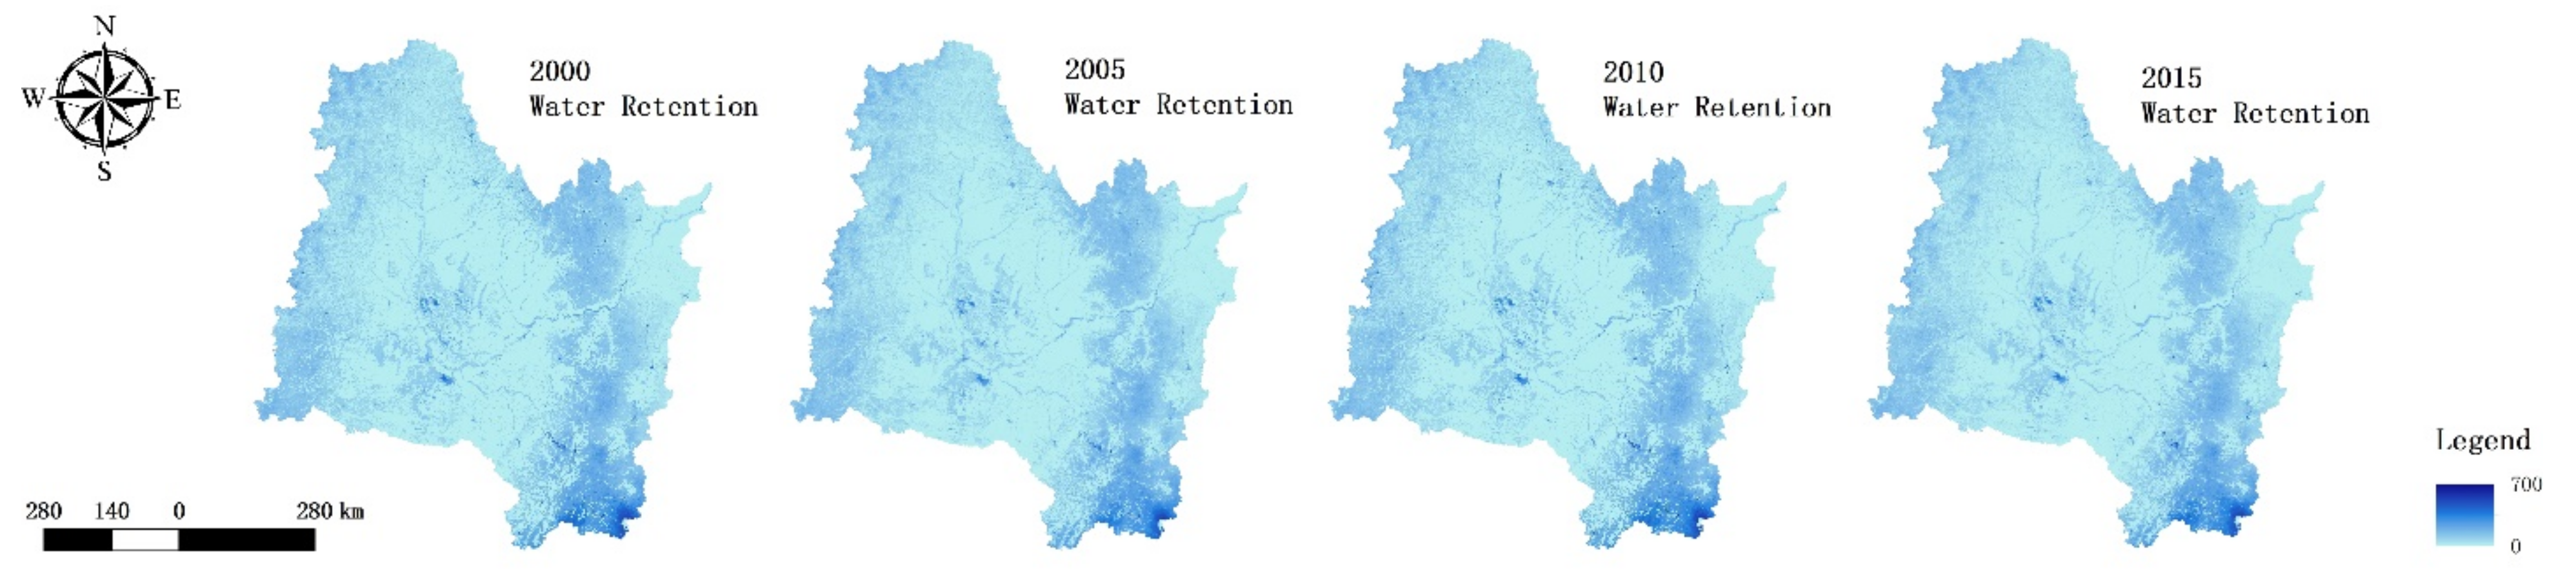
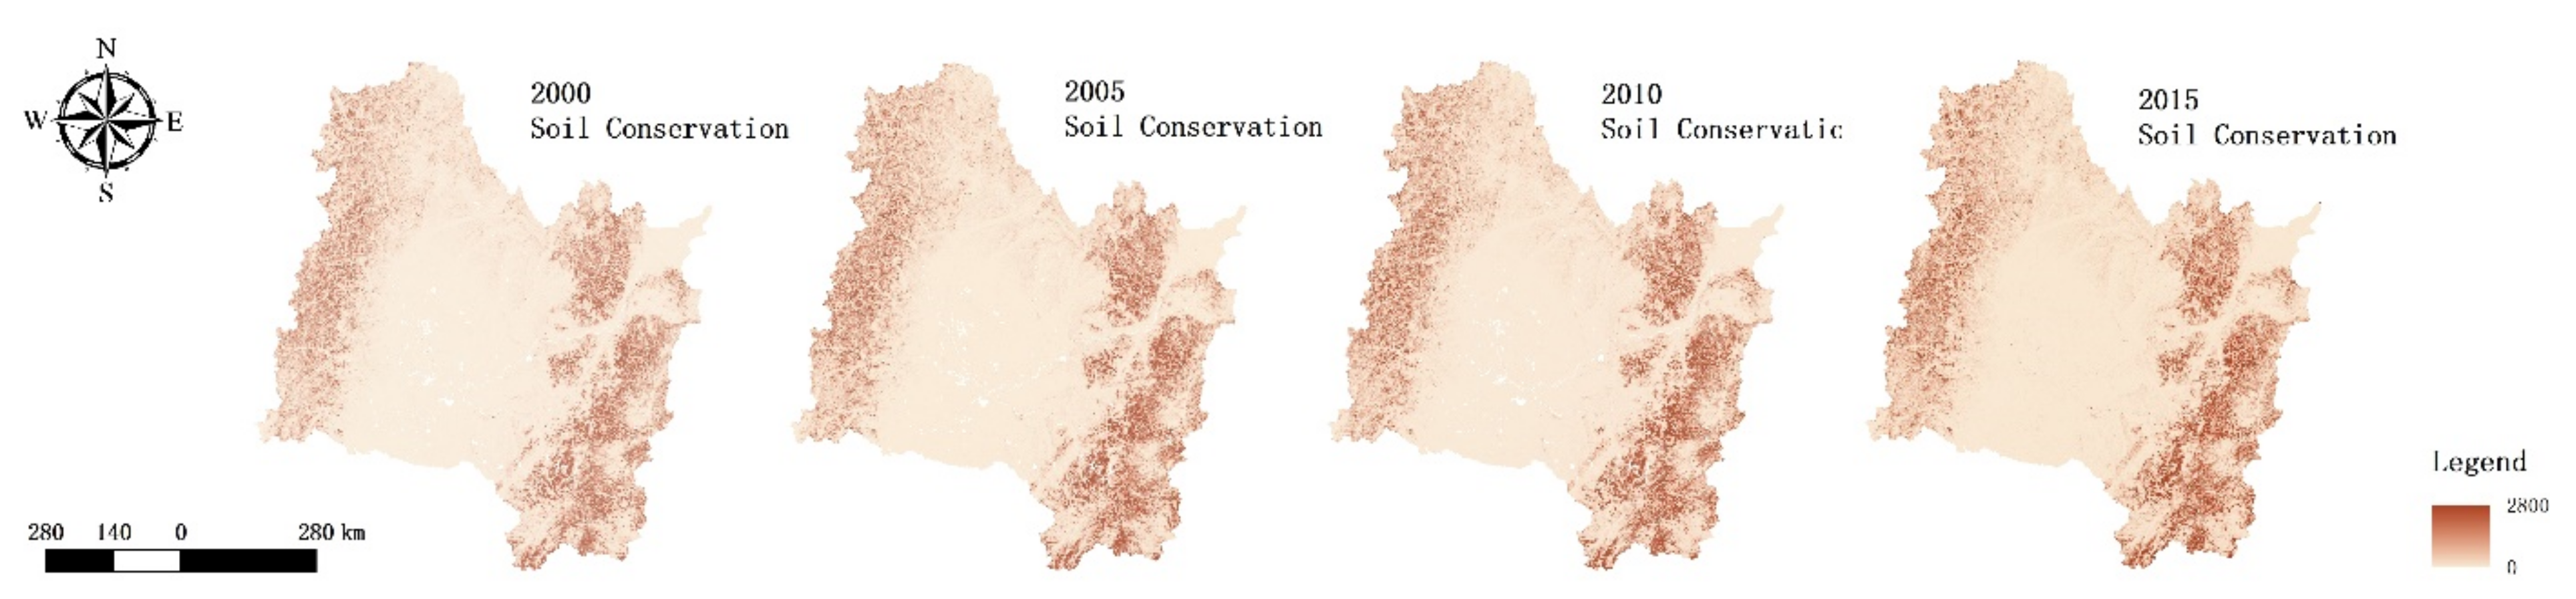
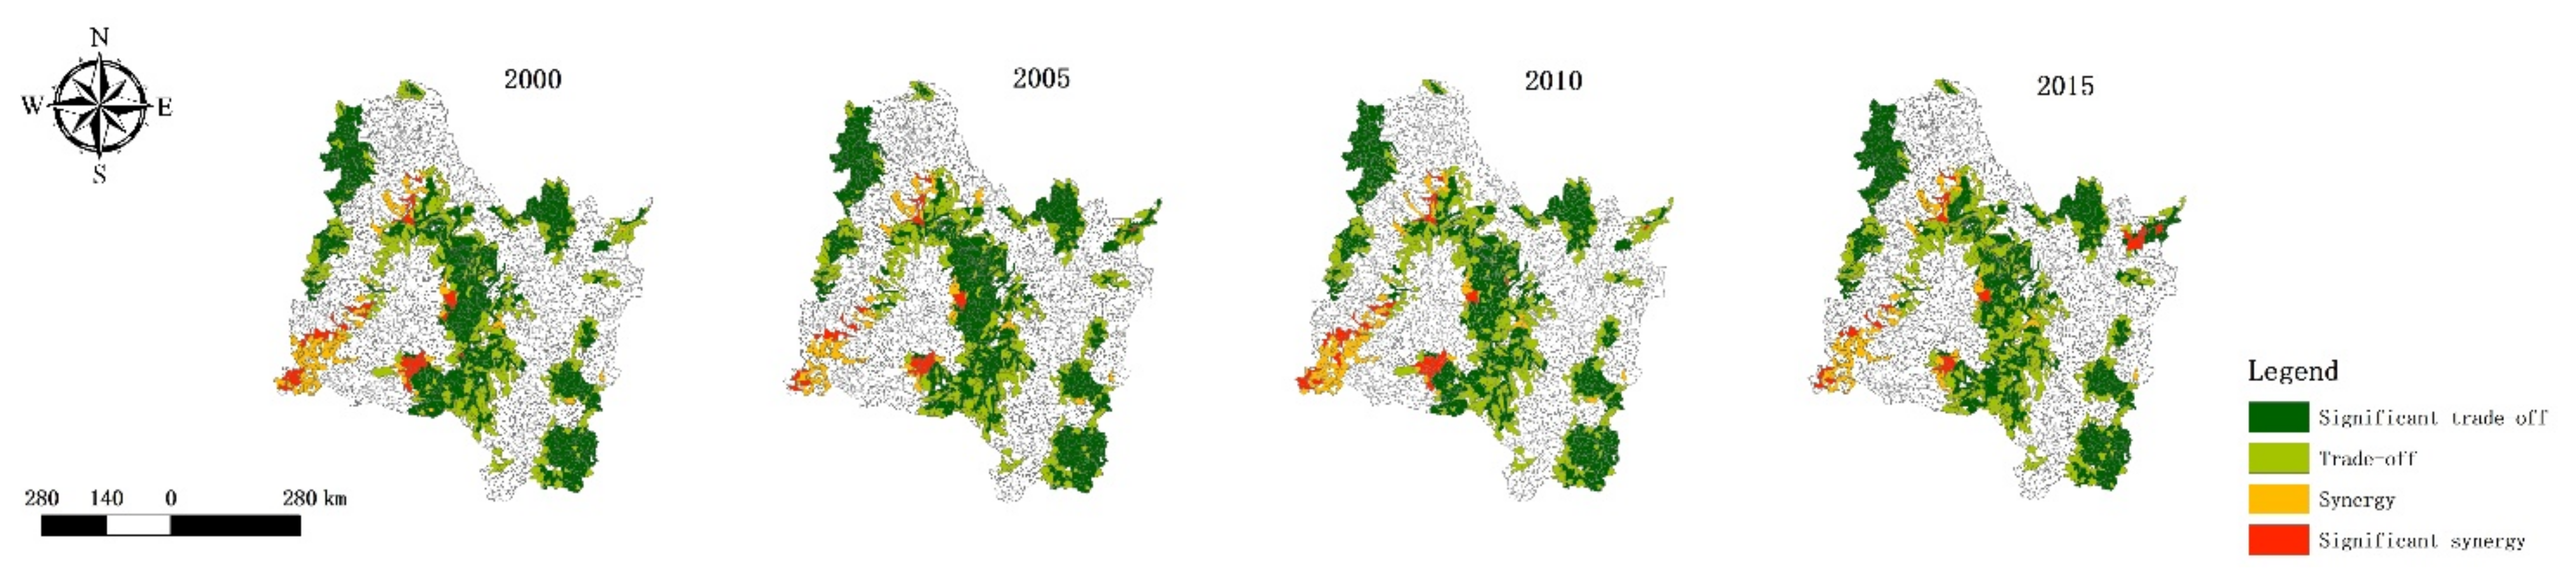
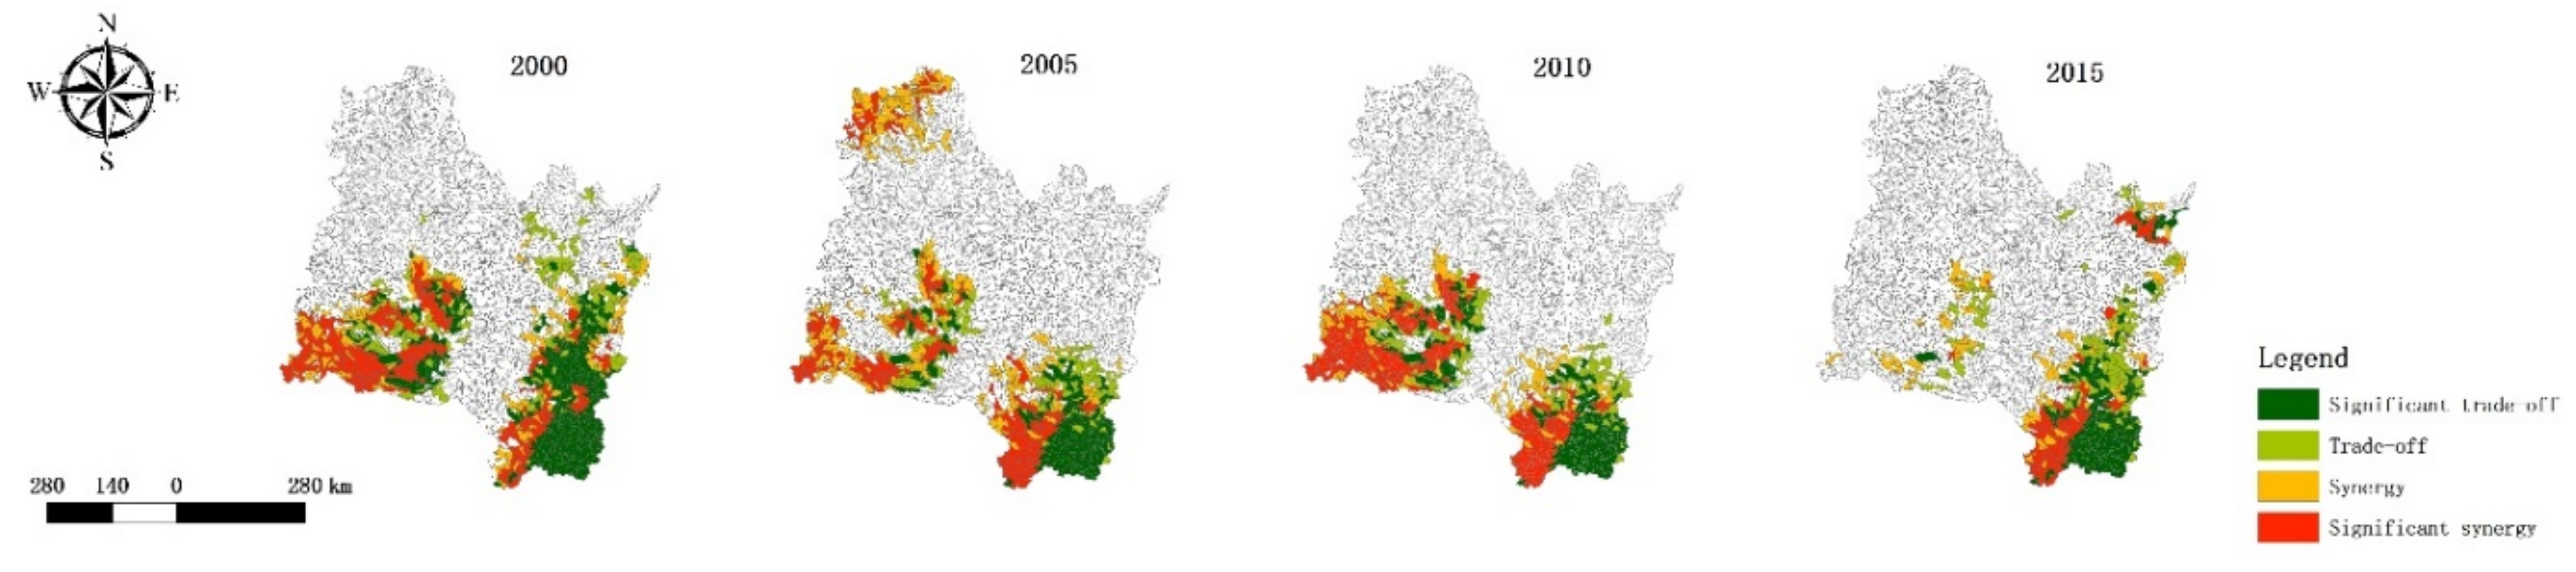
Table 1.
The data sources required by the ecosystem service assessment model.
| Ecosystem Services | Required Data | Data Sources |
|---|---|---|
| Water retention | Precipitation | Obtained by interpolation of national meteorological station data downloaded from China Meteorological Data Network (http://data.cma.cn/, accessed on 15 September 2020) |
| Actual evapotranspiration | From Institute of Mountain Hazards and Environment, Chinese Academy of Sciences | |
| Runoff | From Institute of Mountain Hazards and Environment, Chinese Academy of Sciences | |
| Soil conservation | Slope length | Use ArcGIS software to process DEM data acquisition |
| Slope | Use ArcGIS software to process DEM data acquisition | |
| Normalized Difference Vegetation Index | Obtained by Landsat image band calculation | |
| Carbon sequestration | Average monthly precipitation | From China Meteorological Data Network (http://data.cma.cn/, accessed on 15 September 2020) |
| Monthly average temperature | From China Meteorological Data Network (http://data.cma.cn/, accessed on 15 September 2020) | |
| Sun radiation | From China Meteorological Data Network (http://data.cma.cn/, accessed on 15 September 2020) | |
| Vegetation distribution | From Institute of Mountain Hazards and Environment, Chinese Academy of Sciences | |
| Soil distribution | From Institute of Mountain Hazards and Environment, Chinese Academy of Sciences | |
| Normalized Difference Vegetation Index | Obtained by Landsat image band calculation | |
| Biodiversity | Richness of rare and endangered biological species | From Institute of Mountain Hazards and Environment, Chinese Academy of Sciences |
| Biological abundance index | From Institute of Mountain Hazards and Environment, Chinese Academy of Sciences | |
| Normalized Difference Vegetation Index | Obtained by Landsat image band calculation | |
| Crop production | The per unit area yield of grain | From the National County Statistical Yearbook |
| Climate data | From China Meteorological Data Network (http://data.cma.cn/, accessed on 15 September 2020) | |
| Slope | Use ArcGIS software to process DEM data acquisition |
Table 2.
Pattern index and its description.
| Pattern Index | Full Name of the Index |
|---|---|
| AREA | Patch Area |
| PERIM | Patch Perimeter |
| GYRATE | Radius of Gyration |
| PARA | Perimeter-Area Ratio |
| SHAPE | Shape Index |
| FRAC | Fractal Dimension Index |
| CIRCLE | Related Circumscribing Circle |
| CONTIG | Contiguity Index |
Table 3.
Ecosystem service synergy/trade-off pattern index comparison.
| COUNT | AREA | PERIM | GYRATE | PARA | SHAPE | FRAC | CIRCLE | CONTIG | ||
|---|---|---|---|---|---|---|---|---|---|---|
| Total | 2208 | 255,370,298 | 130,851.9 | 7507.06 | 5.6874 | 2.0827 | 1.0745 | 0.6471 | 0.9596 | |
| water retention–soil conservation | synergy | 111 | 227,606,158 | 124,243.2 | 7056.58 | 5.8289 | 2.0697 | 1.0736 | 0.6426 | 0.9585 |
| trade-off | 34 | 212,045,203 | 125,661.8 | 6945.61 | 6.1833 | 2.1407 | 1.0769 | 0.6303 | 0.9561 | |
| water retention–biodiversity | synergy | 89 | 204,312,638 | 108,196.6 | 6571.52 | 5.8172 | 1.9289 | 1.0683 | 0.6444 | 0.9586 |
| trade-off | 42 | 245,070,447 | 123,869 | 6899.67 | 5.7379 | 2.0327 | 1.0727 | 0.624 | 0.9591 | |
| water retention–carbon sequestration | synergy | 81 | 230,595,903 | 116,722.2 | 6775.22 | 5.5866 | 1.9632 | 1.0695 | 0.6179 | 0.9601 |
| trade-off | 33 | 216,095,991 | 112,666.7 | 6559.17 | 5.6238 | 1.9488 | 1.0684 | 0.6028 | 0.9598 | |
| soil conservation–biodiversity | synergy | 84 | 207,093,522 | 109,208.3 | 6568.3 | 5.8307 | 1.9354 | 1.0686 | 0.6381 | 0.9584 |
| trade-off | 45 | 238,067,177 | 122,533.3 | 6909.94 | 5.8283 | 2.0357 | 1.0731 | 0.6322 | 0.9585 | |
| soil conservation–carbon sequestration | synergy | 69 | 223,924,708 | 112,413 | 6682.68 | 5.5319 | 1.9147 | 1.0669 | 0.6076 | 0.9606 |
| trade-off | 39 | 252,722,988 | 123,435.9 | 7109.12 | 5.262 | 1.9641 | 1.0694 | 0.6245 | 0.9624 | |
| biodiversity–carbon sequestration | synergy | 474 | 251,662,399 | 130,127.6 | 7476.96 | 5.8463 | 2.099 | 1.075 | 0.6571 | 0.9584 |
| trade-off | 31 | 276,115,852 | 126,177.4 | 7261.26 | 5.0286 | 1.9083 | 1.0659 | 0.6139 | 0.9641 | |
| crop production–water retention | synergy | 77 | 240,889,394 | 127,935.1 | 7353.74 | 5.7928 | 2.0886 | 1.0748 | 0.6607 | 0.9588 |
| trade-off | 3 | 357,468,795 | 149,666.7 | 8482.68 | 4.2188 | 1.9696 | 1.0687 | 0.6133 | 0.9701 | |
| crop production–soil conservation | synergy | 2 | 230,590,587 | 146,000 | 8757.33 | 6.266 | 2.3735 | 1.0892 | 0.7343 | 0.9552 |
| trade-off | 1 | 276,198,068 | 153,500 | 8160.01 | 5.549 | 2.291 | 1.086 | 0.7508 | 0.9606 | |
| crop production–biodiversity | synergy | 0 | 0 | 0 | 0 | 0 | 0 | 0 | 0 | 0 |
| trade-off | 1 | 128,654,449 | 86,000 | 6267.28 | 6.6764 | 1.8901 | 1.0684 | 0.7508 | 0.9525 | |
| crop production–carbon sequestration | synergy | 0 | 0 | 0 | 0 | 0 | 0 | 0 | 0 | 0 |
| trade-off | 0 | 0 | 0 | 0 | 0 | 0 | 0 | 0 | 0 | |
Publisher’s Note: MDPI stays neutral with regard to jurisdictional claims in published maps and institutional affiliations. |
© 2021 by the authors. Licensee MDPI, Basel, Switzerland. This article is an open access article distributed under the terms and conditions of the Creative Commons Attribution (CC BY) license (https://creativecommons.org/licenses/by/4.0/).
Share and Cite
MDPI and ACS Style
Niu, T.; Yu, J.; Yue, D.; Yang, L.; Mao, X.; Hu, Y.; Long, Q. The Temporal and Spatial Evolution of Ecosystem Service Synergy/Trade-Offs Based on Ecological Units. Forests 2021, 12, 992. https://0-doi-org.brum.beds.ac.uk/10.3390/f12080992
AMA Style
Niu T, Yu J, Yue D, Yang L, Mao X, Hu Y, Long Q. The Temporal and Spatial Evolution of Ecosystem Service Synergy/Trade-Offs Based on Ecological Units. Forests. 2021; 12(8):992. https://0-doi-org.brum.beds.ac.uk/10.3390/f12080992
Chicago/Turabian StyleNiu, Teng, Jiaxin Yu, Depeng Yue, Linzhe Yang, Xueqing Mao, Yahui Hu, and Qianqian Long. 2021. "The Temporal and Spatial Evolution of Ecosystem Service Synergy/Trade-Offs Based on Ecological Units" Forests 12, no. 8: 992. https://0-doi-org.brum.beds.ac.uk/10.3390/f12080992
Note that from the first issue of 2016, this journal uses article numbers instead of page numbers. See further details here.