
Expression Patterns and Gene Analysis of the Cellulose Synthase Gene Superfamily in Eucalyptus grandis


China Eucalypt Research Centre, Chinese Academy of Forestry, 30 Mid Renmin Dadao, Zhanjiang 524022, China
*
Author to whom correspondence should be addressed.
Forests 2021, 12(9), 1254; https://0-doi-org.brum.beds.ac.uk/10.3390/f12091254
Submission received: 12 August 2021
/
Revised: 1 September 2021
/
Accepted: 14 September 2021
/
Published: 15 September 2021
(This article belongs to the Section Genetics and Molecular Biology)
Abstract
:Cellulose is the world’s most abundant renewable energy resource, and a variety of cellulose synthase genes are involved in the biosynthesis of cellulose. In the process of cellulose synthesis, all cellulose synthases are interrelated and act synergistically. In this study, we analyzed the contents of cellulose, hemicellulose, and lignin in the different parts and tissues of E. grandis. The results showed that the cellulose content had greater differences among three different heights. On this basis, we carried out the transcriptome-wide profiling of gene expression patterns using RNA sequencing. A total of 2066 differentially expressed genes were identified for three pairwise comparisons between three different heights, most of which were related to the programmed photosynthetic membrane and photosystem. A total of 100 transcripts of CSs (58 CesA and 42 Csl) were obtained from transcriptome libraries. The expression pattern of these genes indicated that different CS genes had a wide range of expression profiles. A phylogenetic analysis of 135 reference CS genes showed that the CSs of E. grandis were clustered into six major groups (CesA1-9, CslA, CslB/H, CslD, CslE, and CslG). Based on the weighted gene co-expression network analysis, a dual-directional regulation mechanism between Csl and CesA proteins in the cellulose biosynthesis was identified. The gene expression profile analysis, using qRT-PCR in different tissues of E. grandis, demonstrated that the CSs were highly expressed in xylem, and CesAs had a higher relative expression than Csls. The analysis of sequence similarity combined with the expression pattern indicated that the CesA1, 3, and 6 transcripts were associated with the biosynthesis of the secondary cell wall, and CesA4, 5, and 7 transcripts were more likely to associate with the biosynthesis of the primary cell wall. Finally, the qRT-PCR analysis confirmed the expression of 11 selected CSs in three different parts of E. grandis.
1. Introduction
The plant cell wall is a cellular structure surrounding the outside of the plant protoplasm. It plays an important role in plant protection and morphogenesis, supplies water and nutrients, and maintains the interaction between the plant and the environment. It is also closely related to plant cell differentiation, growth, and development. The main components of the cell wall are cellulose, hemicellulose, pectin, and lignin; among which, cellulose and lignin are major components in forest wood and non-food biomass. Therefore, the cell wall is considered as an important renewable plant biomass resource on earth. Cellulose is an important structural substance in cell walls and is the most abundant polysaccharide polymer in plants [1]. It plays a central role in plant development, and its biosynthesis is one of the most important biochemical processes in plant biology [2]. Nature produces approximately 1.8 × 10¹¹ tons of cellulose every year [3], which is one of the most abundant biological macromolecules and an important renewable resource on earth [4]. Moreover, it is a fibrous material and bioenergy source consumed by human beings. Wood from forest trees, modified to have more cellulose or hemicelluloses, could be a major feedstock for fuel ethanol. Xylan and glucomannan are the two major hemicelluloses in the wood of angiosperms [5].
Cellulose is synthesized by plasma membrane-localized cellulose synthase complexes [6]. Cellulose consists of linear chains of β-1,4-linked glucose units, which are synthesized by the cellulose synthase complex (CSC) [7]. A large number of studies have shown that the biosynthesis of plant cellulose is a complex process, completed by CSC, and consists of plant cellulose synthases (CSs) and other enzymes [2,8]. In higher plants, CSCs contain multiple non-redundant cellulose synthase A (CesA) proteins that serve as CSC catalytic subunits [9,10]. These complexes are assembled into hexameric rosettes in intracellular compartments, and secreted to the plasma membrane [6]. The synthesis of cellulose is coordinated by a strict and complex transcriptional regulatory system. While CesAs are known to synthesize cellulose, it is also clear that similar processive glycosyltransferases may synthesize additional plant cell wall polymers. Among the numerous genes involved in cellulose synthesis, each gene has its specific role and function, and different genes in the same family must be expressed at different times and locations [11]. The Arabidopsis genome encodes 10 CesA genes (CesA1~10); among which, CesA1, CesA3, and CesA6-like (CesA2, CesA5, CesA6, and CesA9) genes have been associated with the CesA complexes that are active during primary wall formation, while CesA4, CesA7, and CesA8 have been reported to be part of the CesA complex that is responsible for cellulose synthesis in the secondary cell wall [12]. The role of CesA10 remains unclear.
The CSC is comprised of functionally distinct CesA proteins, which are responsible for synthesizing cellulose, as well as additional accessory proteins. Moreover, cellulose synthase-like (Csl) proteins mediate in the biosynthesis of hemicellulose that constitutes the plant cell walls [13,14]. CesA and Csl proteins belong to a CS superfamily within the glycosyltransferase (GT) family 2 [4], and are involved in cellulose and hemicellulose biosynthesis [15]. It has been demonstrated that the superfamily, Csl, is responsible for the synthesis of several polysaccharides of the plant cell walls, and includes the subfamilies CslA-H, CslJ, and CslM, each of which consists of multiple genes. Many studies have shown that not all Csl subfamilies are present in higher plant groups. The CslB and CslG subfamilies are found only in dicotyledons and gymnosperms, whereas the CslF and CslH groups are found only in monocotyledons [16,17]. Different gene family members are involved in cellulose synthesis in different tissues, organs, or layers of cell walls. The number of CesA genes varies between plant species [18]. Understanding how they regulate, and how their regulatory networks affect plant growth and differentiation, will help clarify the molecular mechanism that is controlling plant growth and development. This can be understood using modern genetic engineering methods to establish the theoretical and technical systems for modifying the content and structure of cellulose, to breed fast-growing forest tree species for high-quality biomass production, and to promote the efficient utilization of cell wall biomass.
Eucalyptus species and interspecific hybrids include some of the most widely planted hardwood trees in the world; many of which are rapid producers of wood fiber and cellulose [19,20]. Eucalyptus grandis W. Hill ex Maiden is an evergreen tree species that can be used as fuel wood for artificial afforestation in tropical and subtropical areas, and it is the largest Eucalyptus tree in cultivated areas. Its straight, pink heartwood wood texture makes it suitable for the fine working board, flooring, and various decorative purposes, as a high-quality pulp and wood-based board raw material. E. grandis is the second model tree for whole-genome sequencing, with a genome size of 691.43 MB [21,22]. It is an ideal material for forest molecular biology research. Therefore, studying the wood quality of E. grandis provides the preferred material for the genetic improvement of Eucalyptus timber, which would be conducive to the rational use of forest resources to promote the sustainable development of the domestic wood processing industry. Ranik et al. [23] cloned six EgCesA genes from E. grandis and found two distinct groups of expressed EgCesAs in Eucalyptus that were involved in either primary or secondary cell wall biosynthesis. EgCesA1 to 3 were abundant in tissues that were enriched with cells laying down secondary cell walls, and EgCesA4 to 5 were linked with the synthesis of the primary cell wall. Similarly, Lu et al. [24] cloned and characterized three genes from E. grandis. They found that EgraCesA1 to 3 were specifically expressed in the xylem cells of Eucalyptus that were undergoing secondary cell wall biosynthesis. Sundari and Dasgupta [8] identified three EtCesA genes from E. tereticornis, and revealed high levels of expression in the developing secondary xylem tissues. An increase in the number of CS genes in Eucalyptus was found, indicating that the cellulose synthase families of Eucalyptus are more complex. This study demonstrated that there were significant differences in the cellulose contents of three different heights of E. grandis grown for six years. Based on transcriptome data of immature xylem at three different height levels, a bioinformatic analysis of 56 transcripts of CesA genes and 44 transcripts of Csl genes was performed, and the physicochemical properties of the encoded proteins were predicted. The expression patterns of six CesA transcripts and five Csl transcripts were analyzed using qRT-PCR to provide an important molecular basis for the analysis of the molecular mechanism in E. grandis.
2. Materials and Methods
2.1. Collection of Plant Materials
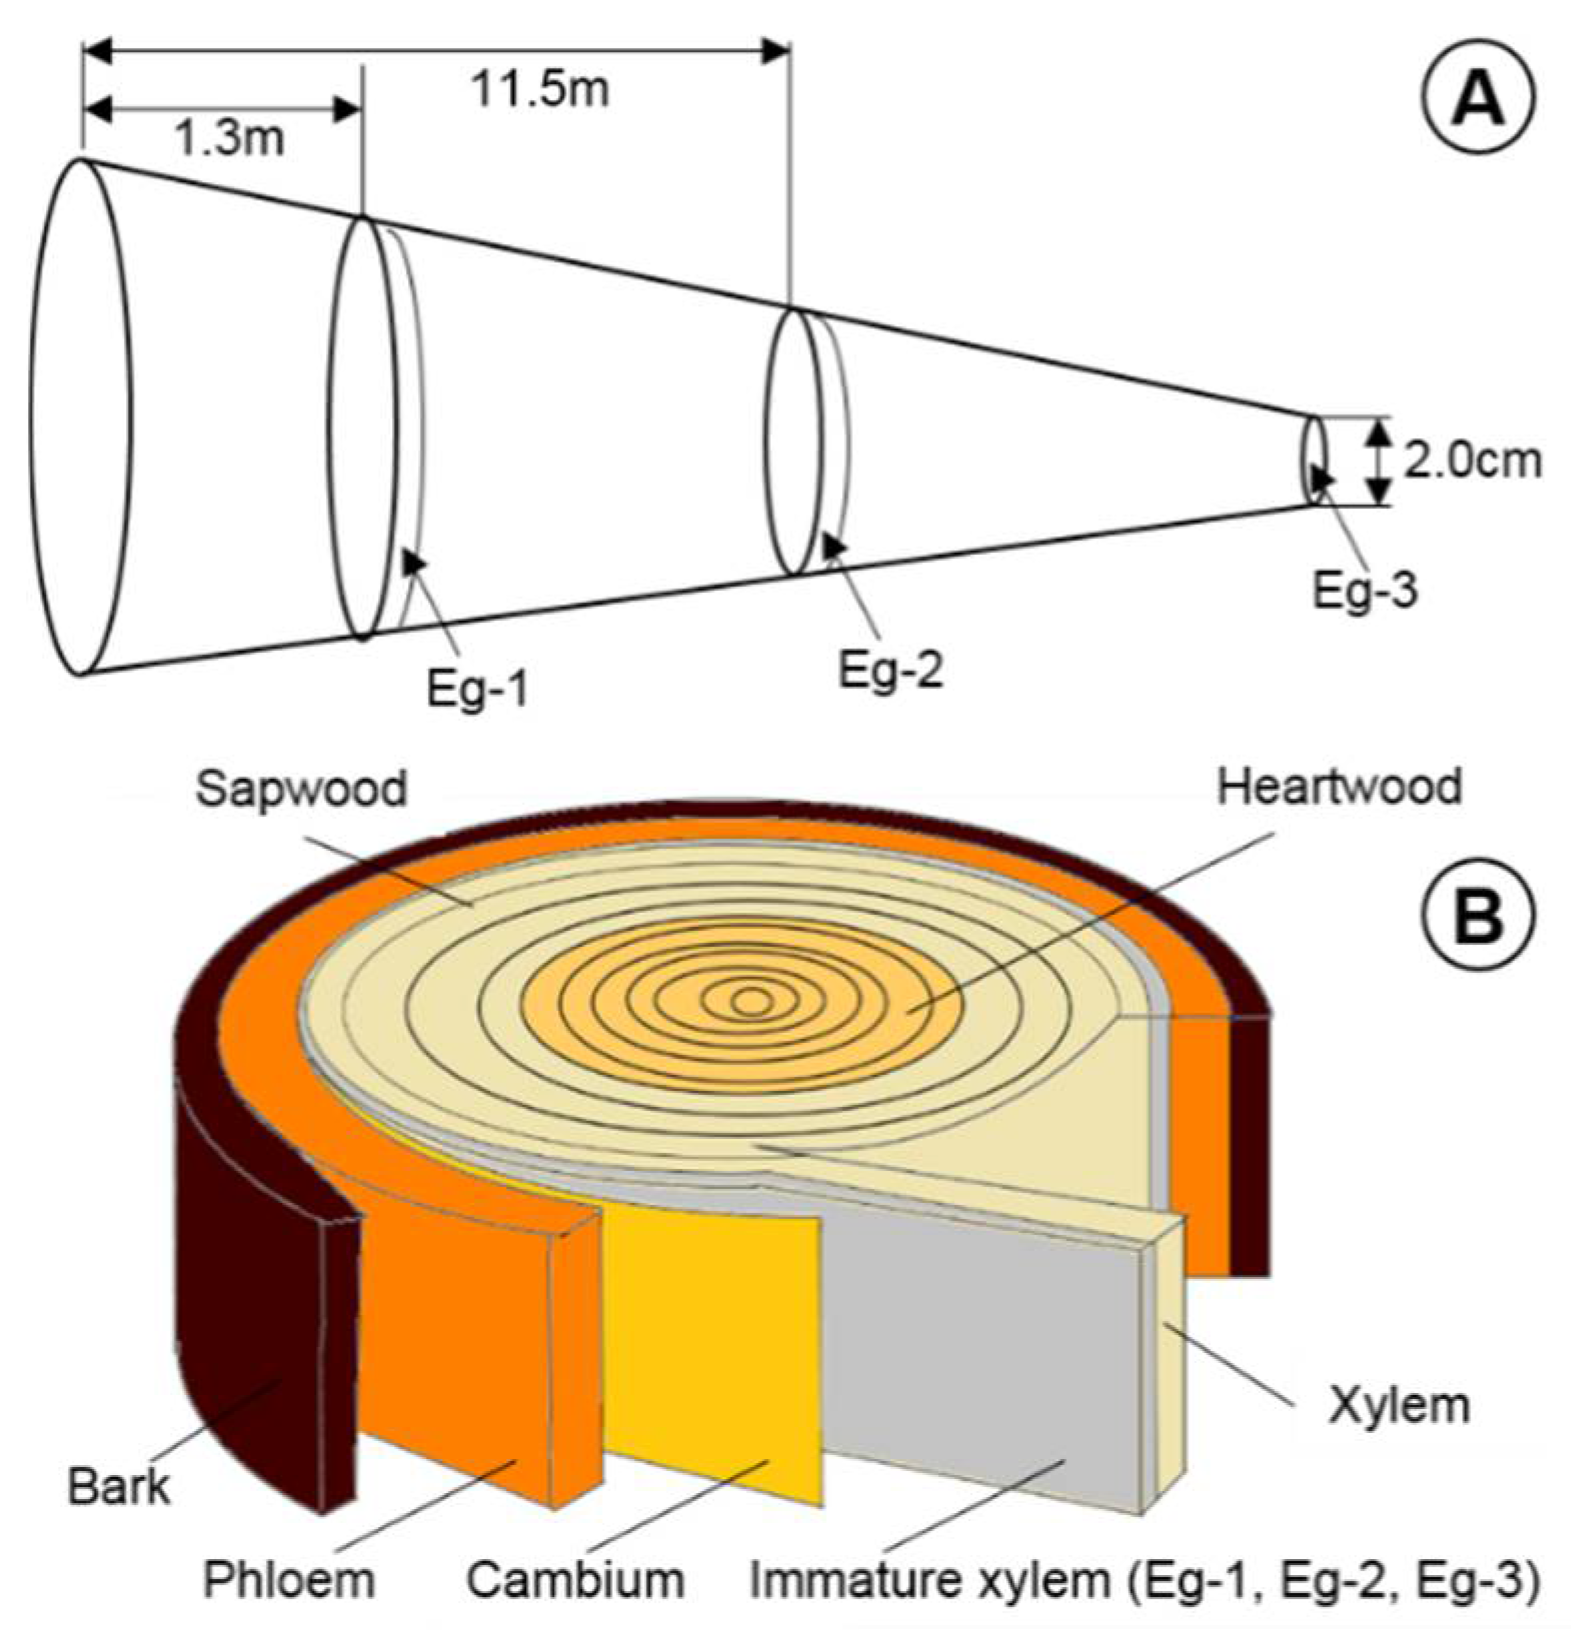
Tissue samples were harvested from 6-year-old E. grandis clonal trees, which were kindly provided by the Sichuan Academy of Forestry Sciences. The field trial was carried out at 28°51′29″ N, 104°45′12″ E, at an altitude of 382 m, with a local atmospheric pressure of 976.0 hPa. The soil pH is neutral or slightly acidic, with an annual average temperature of 17.90 °C, annual rainfall of 1169.60 mm, annual height growth of 3.5 m, and an annual diameter growth at breast height of 3.0 cm in this experimental forest. The tissues, including immature xylem (outer 1–2 mm cambium layer, covering the stem, comprising xylem mother cells, and developing xylem tissue) in the different trunk parts of E. grandis (Eg-1, diameter at breast height; Eg-2, 11.5 m; Eg-3, 2 cm in diameter at treetop) (Figure 1), xylem (XY; 3–5 mm deep planing, following the removal of the immature xylem layer, encompassing xylem cells during advanced maturity stage), phloem (PH; 1–2 mm layer from the inner surface of the bark, containing the vascular cambium, and developing phloem cells), heartwood (HW, the innermost layer and darker part of a woody stem), and the sapwood (SW, the peripheral layer of the secondary xylem of trees), were collected on 26 April 2019. In addition to the stem tissues, we sampled unfolded young leaves (YL), mature leaves (ML), and root (RO, immature xylem from the taproot reaching the 10 cm underground layer). The sample information is presented in Table S1. Tissues harvested were immediately frozen in liquid nitrogen.
2.2. Measurement of Wood Properties
Three wood property traits were measured for three individual trees of E. grandis, in different positions and tissues. These traits included the contents of hemicellulose, α-cellulose, lignin, and holocellulose. In the present experiment, a double antibody sandwich ELISA method was used for the measurement of the contents of cellulose, hemicellulose, lignin, and holocellulose using the plant cellulose, hemicellulose, lignin, and holocellulose ELISA Kits (Jining Shiye, Shanghai, China), respectively. Firstly, the powdered tissue samples were added to a certain amount of phosphate buffer saline (PBS) and the supernatant was retained after centrifugation. The purified hemicellulose, α-cellulose, lignin, and holocellulose antibodies were used to coat microtiter plates, Afterwards, hemicellulose, α-cellulose, lignin, and holocellulose were added. The primary antibodies were incubated with the HRP-labeled secondary antibodies. The antibody–antigen–enzyme–antibody complex was formed. After washing the plates, TMB substrate solution was added. The TMB substrate was turned blue by an HRP enzyme-catalyzed reaction. The reaction was terminated by the addition of a sulfuric acid solution, and the color change was measured spectrophotometrically, at a wavelength of 450 nm. The concentrations of hemicellulose, α-cellulose, lignin, and holocellulose in the samples were determined by comparing the OD of the samples with the standard curves. Finally, the data were examined by analysis of variance and subjected to Duncan’s multiple range test, using the SPSS Statistics V20.0 software package.
2.3. Illumina Sequencing and Mapping
The RNA was separately isolated from three different parts of E. grandis using an RNAprep pure Plant Kit (TIANGEN, Beijing, China). The RNA integrity number (RIN) for all samples (analyzed using the Agilent 2100 Bioanalyzer) was greater than 9.0. A total of 150 bp paired-end reads were generated by the Illumina HiSeqTM 4000. The removed rRNA reads from each sample were then mapped to a reference genome (E. grandis: GCF_000612305.1) using TopHat2 (version 2.0.3.12). The gene expression level was normalized using the Fragments Per Kilobase of transcript per Million mapped reads (FPKM) method. The sequence data reported in this study were archived at the NCBI Sequence Read Archive (SRA) (http://0-www-ncbi-nlm-nih-gov.brum.beds.ac.uk/sra; 28 October 2020) with the accession number SRP288969.
2.4. Differential Gene Expression and Functional Analysis
To identify the differentially expressed genes (DEGs) in three parts of E. grandis, we performed pairwise comparisons (Eg-1 vs. Eg-2, Eg-1 vs. Eg-3, and Eg-2 vs. Eg-3) using the edgeR 3.10 package (http://www.r-project.org/; 20 December 2019). The genes with a fold change of ≥2 and a false discovery rate (FDR) of <0.05 were identified as significant DEGs. DEGs were then subjected to the enrichment analyses of GO functions and KEGG pathways.
2.5. Clustering Analysis and Construction of Gene Co-Expression Networks
The DEGs were clustered using the Short Time-series Expression Miner software (STEM) version 1.3.12, and the clustered profiles with p-values of ≤ 0.05 were considered as significantly expressed. Pearson’s correlation coefficient and P-value were calculated based on 100 CSs transcripts, and the network diagram was drawn. The resulting network was visualized using Cytoscape 3.8.0.
2.6. Screening and Bioinformatics Analysis of the Cellulose Synthase Gene Superfamily
Based on the Nr and SwissProt annotation results, combined with the reference genome sequence of E. grandis, all transcripts of cellulose synthase were screened. The NCBI (ORF Finder) online program (https://0-www-ncbi-nlm-nih-gov.brum.beds.ac.uk/orf finder; 2 June 2020) was used to determine the open reading frames (ORFs) of all transcripts. The NCBI Conserved Domains tool online series (https://0-www-ncbi-nlm-nih-gov.brum.beds.ac.uk/Structure/cdd/wrpsb.cgi 2 June 2020) was used to predict the conserved regions and the basic protein domains. The ProtScale (http://www.web.expasy.org/protscale 2 June 2020) and TMHMM (http://www.cbs.dtu.dk/services/TMHMM/ 2 June 2020) were used for the analysis of molecular weight and theoretical isoelectric points of proteins, and the analysis of transmembrane protein structure, respectively. The Gene Structure Display Server (GSDS, http://gsds.cbi.pku.edu.cn/ 2 June 2020) was employed to identify the structures of transcripts of CSs. A total of 10 CesA and 25 Csl amino acid sequences of Arabidopsis were selected for the phylogenetic tree analysis. The phylogenetic tree was constructed by the PAUP 4.10 software using the maximum parsimony (MP) method with 1000 bootstrap replications. All the amino acid sequences used for phylogenetic tree construction were downloaded from the NCBI databases and aligned via the MUSCLE method.
2.7. Quantitative Real-Time PCR
A qRT-PCR approach was used to verify the reliability of RNA-seq analyses. A total of 6 and 5 transcripts of CesA and Csl were selected, respectively, for the qRT-PCR analysis. Primer pairs were designed using Primer 6.0. The qRT-PCR was performed using the iQ SYBR Green Supermix (TaKaRa Bio, China) according to the manufacturer’s instructions. The Actin gene (XM_010029396.2) was used as an internal reference standard, and the relative gene expression levels were calculated using the 2−ΔΔCt method [25]. All experiments were performed using 3 biological and 3 technical replicates. All the primers used in this study are listed in Table S2.
3. Results
3.1. The Variations in Wood Properties
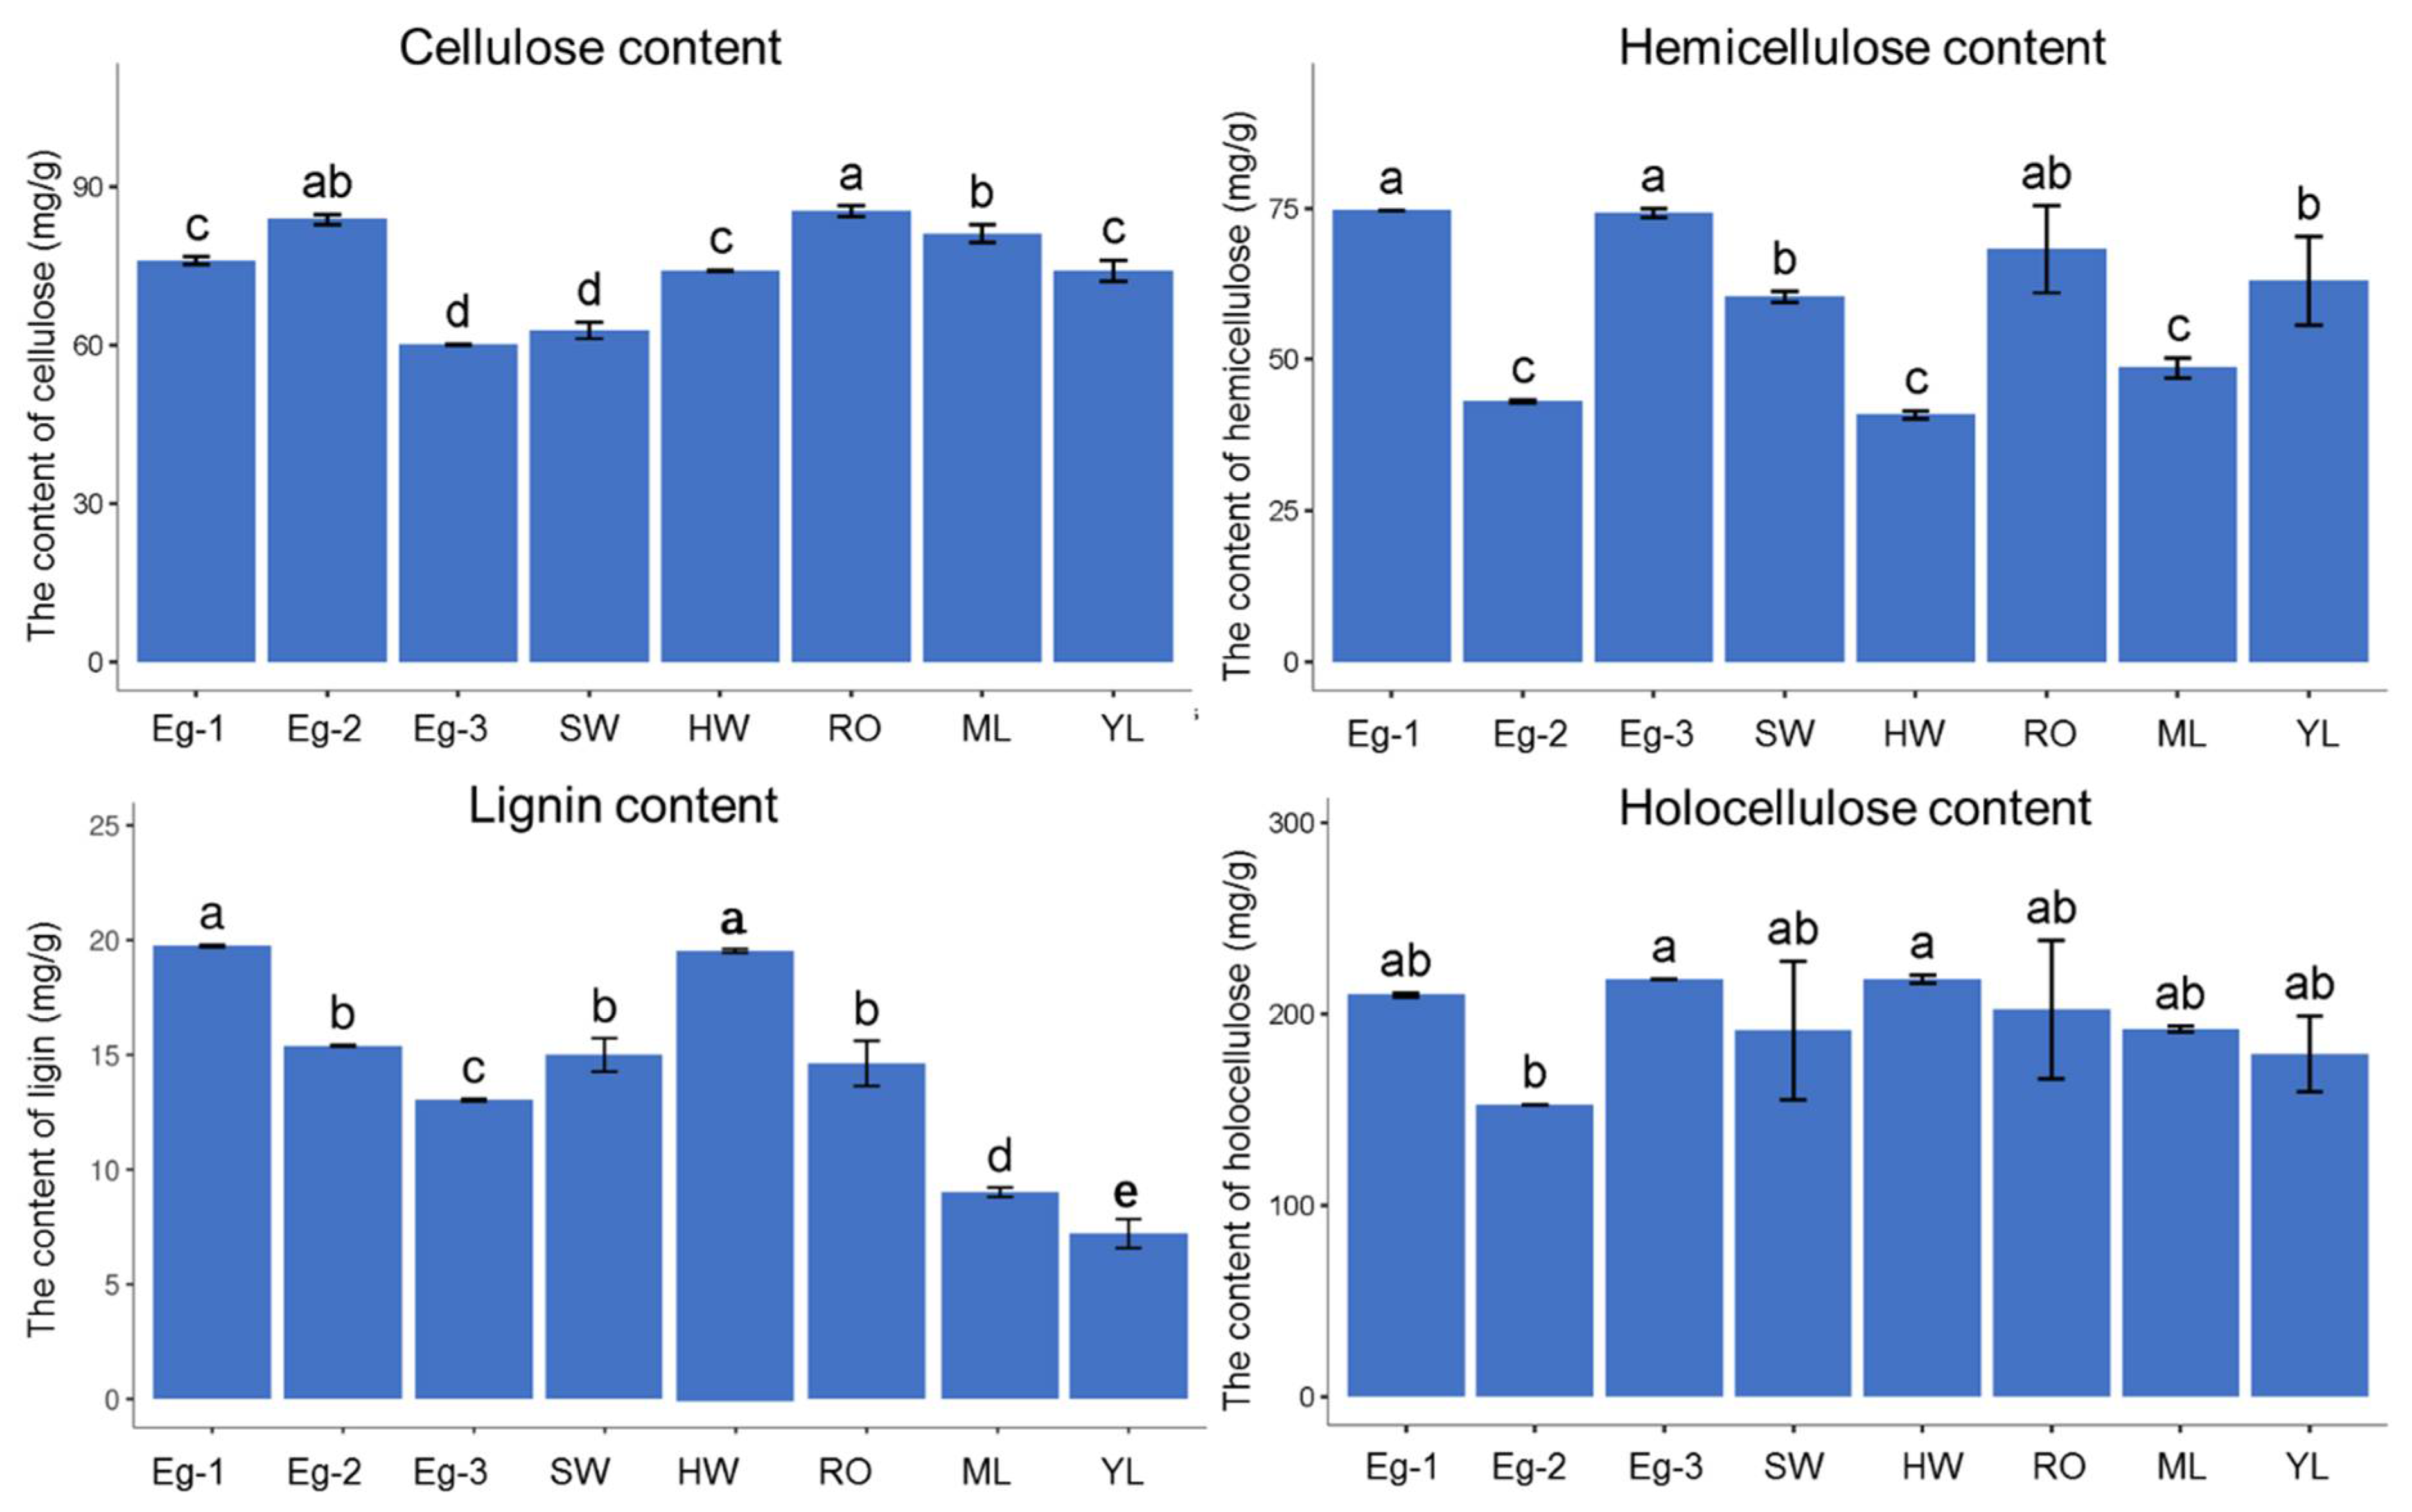
The results regarding the three wood quality indices of the different tissues of E. grandis (Figure 2) showed that the cellulose contents were the highest in the root (85.36 mg/g), Eg-2 (83.86 mg/g), and mature leaves (71.11 mg/g), while Eg-3 was the lowest (60.19 mg/g). The cellulose contents at the three different height levels of the tree were significantly different. The hemicellulose contents were the highest (74.61 and 74.17 mg/g) in Eg-1 and Eg-3, respectively, with no significant differences, while the lowest values (43.01, 40.88, and 48.59 mg/g) were obtained in Eg-2, heartwood, and mature leaves, respectively. The lignin content decreased gradually with the tree height growth, and was significantly different between the three different parts. The lignin content was the highest in Eg-1 (19.76 mg/g), followed by heartwood (19.64 mg/g), while the lowest (13.02 mg/g) was recorded in young leaves (7.21 mg/g). It can be concluded that the higher the maturity of the samples, the higher the lignin content would be. This result is consistent with a previous study that found that lignin concentrations increased with the growth of wheat and maize [26]. Similarly, the holocellulose contents were the highest (218.21 mg/g) in Eg-3 and heartwood, and the lowest value (152.44 mg/g) was recorded in Eg-2. It can be concluded that the cellulose and lignin contents of trees at different height levels were significantly different. Compared to the heartwood, sapwood, young leaves, mature leaves, and roots, the range of variation in the cellulose content at the three different height levels of E. grandis trees was larger.
3.2. Transcriptome Sequencing
3.2.1. Transcriptome Sequencing and Alignment to the Reference Genome
To reveal the potential molecular mechanisms of the variation in cellulose content, the immature xylem of E. grandis trees at three different heights were used for the high-throughput RNA-seq approach. A total of 0.71 billion high-quality reads were generated; of which, 63.51~70.09% were successfully mapped to the E. grandis reference genome, which consisted of 106.40 Gb of cDNA sequences. The average GC-content and the average Q30 were 46.72% and 98.50%, respectively (see Table S3). According to the comparison results from TopHat 2 (2.1.1) [27], nine transcriptional libraries were reconstructed using the Cufflinks 2.2.1 software [27], and 57,480 transcripts were obtained; among which, 43,761 (76.13%) and 13,719 (23.87%) were known and novel genes, respectively.
3.2.2. Analysis of Differentially Expressed Genes
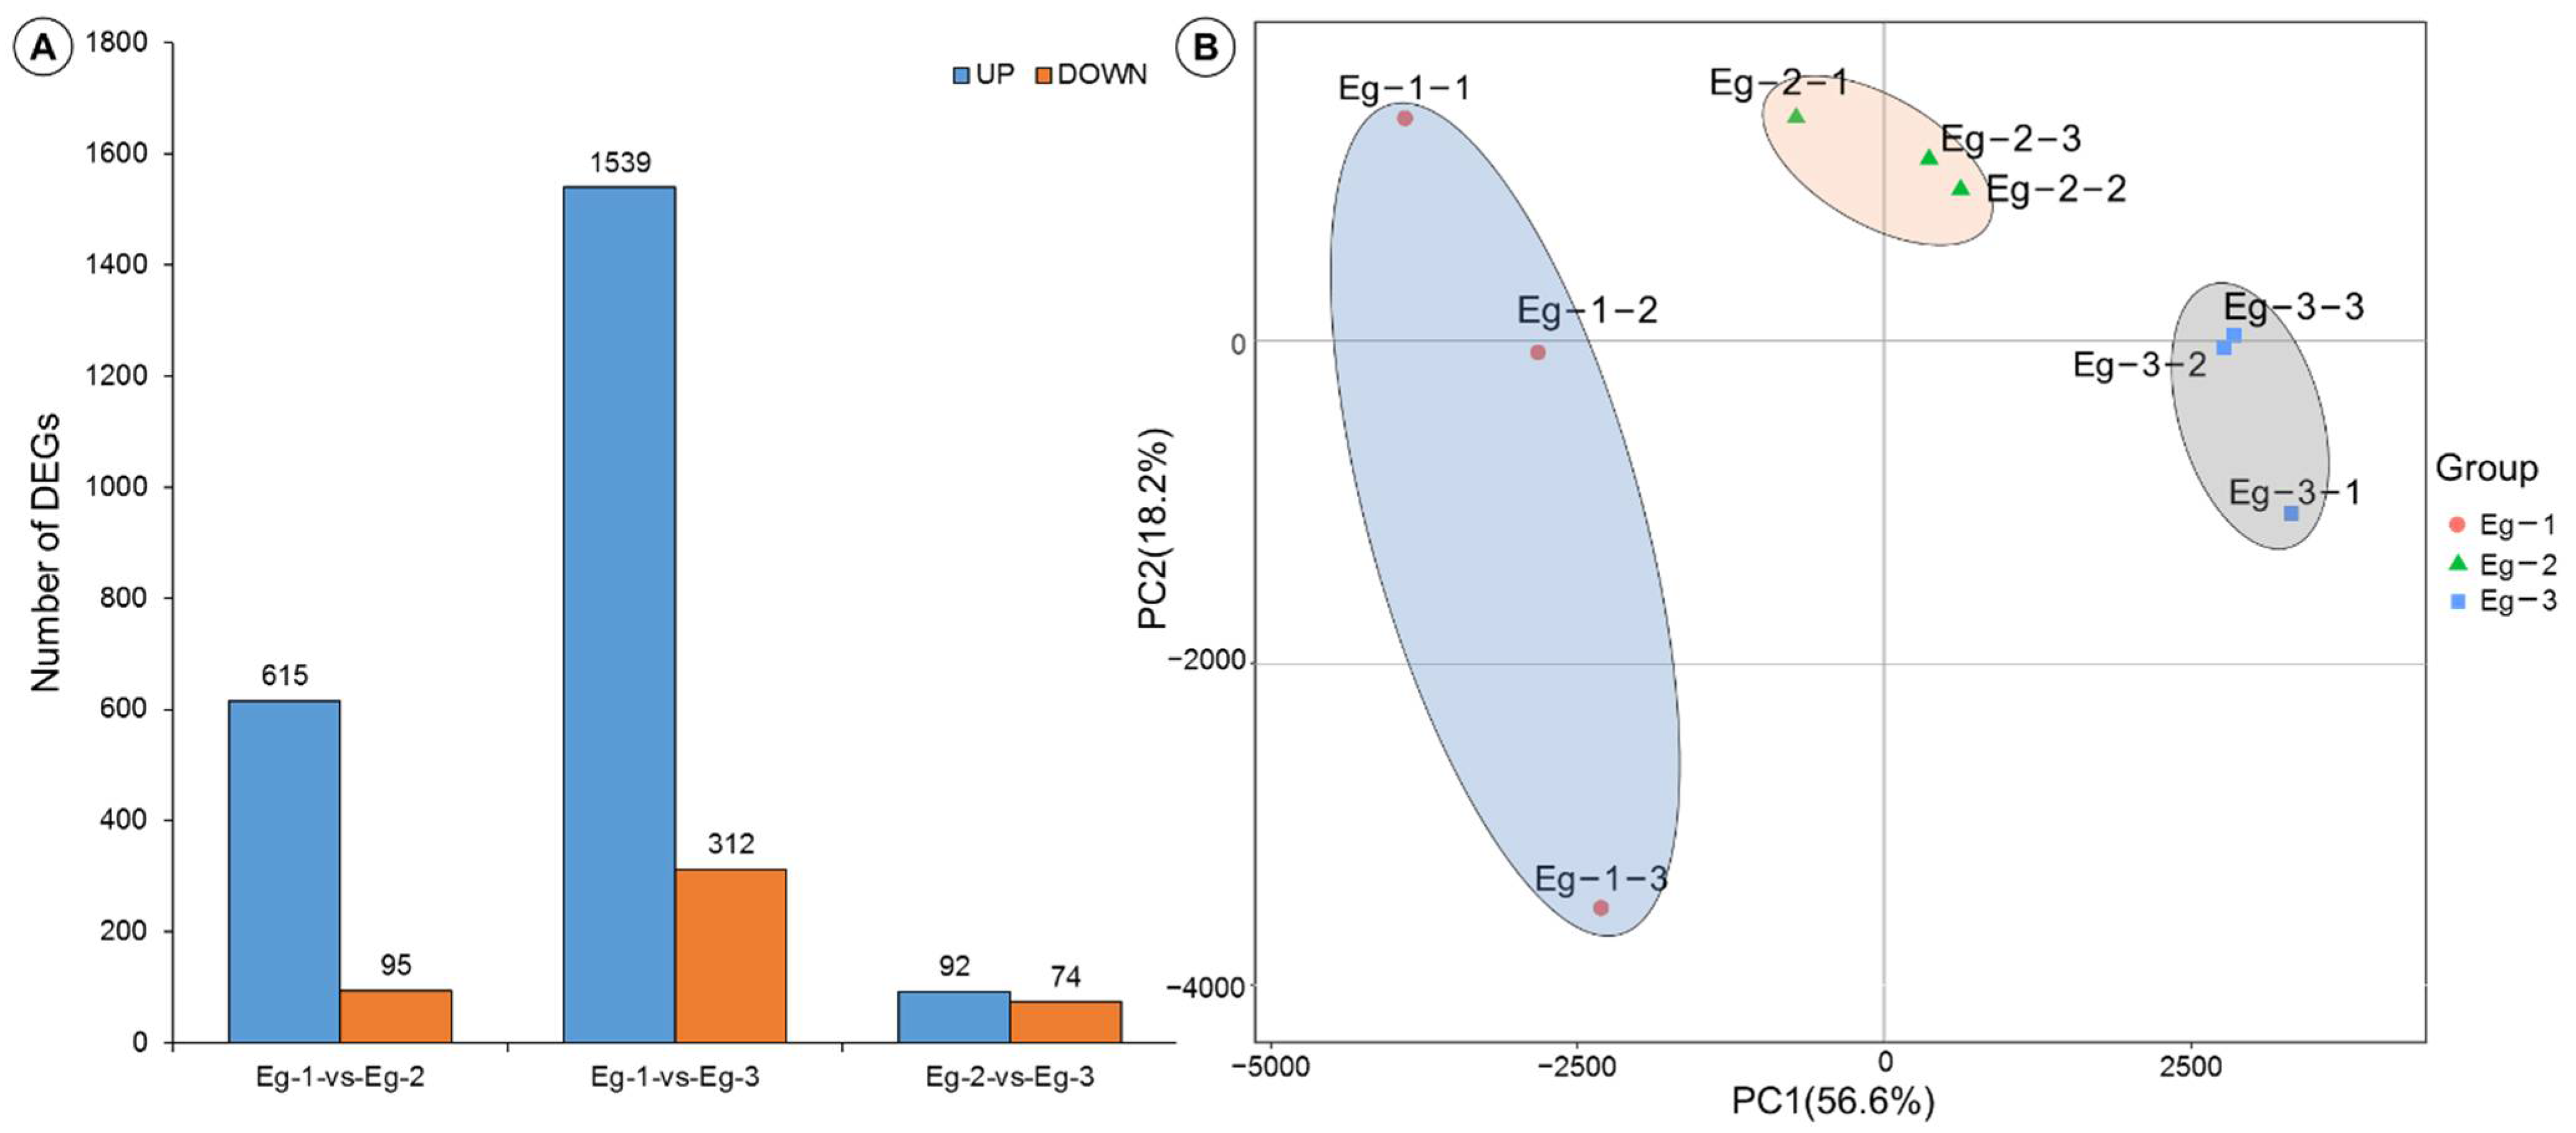
To identify the global transcriptional changes at different height levels, we performed a pairwise comparison with three comparable groups. A total of 2,066 DEGs were identified. The largest DEG set was identified in “Eg-1 vs. Eg-3”, including a total of 1851 DEGs; among which, 1539 and 312 were up- and down-regulated, respectively (Figure 3A), indicating the difference between Eg-1 and Eg-3. In contrast, the smallest DEG set was identified in “Eg-2 vs. Eg-3”, including a total of 166 DEGs, consisting of 92 upregulated and 74 downregulated genes, suggesting that there is a smaller difference between Eg-2 and Eg-3.
The principal component analysis (PCA) plot of the whole dataset revealed that the different samples were in sequential order [28]. The results showed that three different height levels of E. grandis were divided into three clusters, and the biological replicates were projected closely. Eg-2 and Eg-3 were closer than Eg-1, which indicates that Eg-2 and Eg-3 had a smaller difference. Moreover, the difference was even larger between Eg-1 and Eg-3 (Figure 3B).
3.2.3. Functional Annotation of DEGs
To further explore the biological function of DEGs, GO enrichment analysis was performed. The GO terms of DEGs were classified into three major categories, including 61 cellular component terms, 165 molecular function terms, and 670 biological progress terms (see Table S4). The most enriched terms were cellular process, metabolic process, and catalytic activity (see Figure S1). In the cellular component process category, the subcategory of the extracellular region (GO:0005576) was significantly enriched in Eg-1 vs. Eg-2 DEGs. The photosynthetic membrane (GO:0034357) and photosystem (GO:0009521) had the most significantly enriched DEGs in Eg-1 vs. Eg-3, and DEGs were upregulated in Eg-3 in the two subcategories. In the molecular function category, the subcategories of transferase activity (GO:0016740), transferring phosphorus-containing groups (GO:0016772), and phosphotransferase activity, with an alcohol group as the acceptor (GO:0016773), were specifically enriched in Eg-1 vs. Eg-2 and Eg-1 vs. Eg-3 DEGs. The DEGs in Eg-2 vs. Eg-3 were significantly enriched in the subcategories of oxidoreductase activity (GO:0016491) and demethylase activity (GO:0032451). In the biological process category, DEGs in Eg-1 vs. Eg-2 and Eg-1 vs. Eg-3 were mainly significantly enriched in terms of immune system process (GO:0002376), regulation of cell death (GO:0010941), phosphorylation (GO:0016310), regulation of programmed cell death (GO:0043067), and response to the endogenous stimulus (GO:0009719). A total of 10 subcategories were significantly enriched in Eg-2 vs. Eg-3 DEGs, which were different to Eg-1 vs. Eg-2 and Eg-1 vs. Eg-3.
The DEGs were subjected to enrichment analysis of the KEGG pathways. KEGG pathway-based analysis helps identify the biological pathways associated with genes. The significant KEGG pathways for DEGs in class A were classified into six major categories (see Table S5). The most abundant groups of class A were metabolism, as well as the processing of genetic information and environmental information. The KEGG pathways for DEGs in class B were classified into 20 categories. The most abundant groups of class B were carbohydrate metabolism, energy metabolism, and environmental adaptation (see Figure S2). The pathways of photosynthesis-antenna proteins (ko00196) and plant–pathogen interaction (ko04626) were significantly enriched in Eg-1 vs. Eg-2 and Eg-1 vs. Eg-3 DEGs, respectively. In addition, the DEGs in Eg-1 vs. Eg-3 were also most significantly enriched in photosynthesis (ko00195) and plant hormone signal transduction (ko04075). The DEGs in Eg-2 vs. Eg-3 DEGs were significantly enriched in the pathway of taurine and hypotaurine metabolism (ko00430).
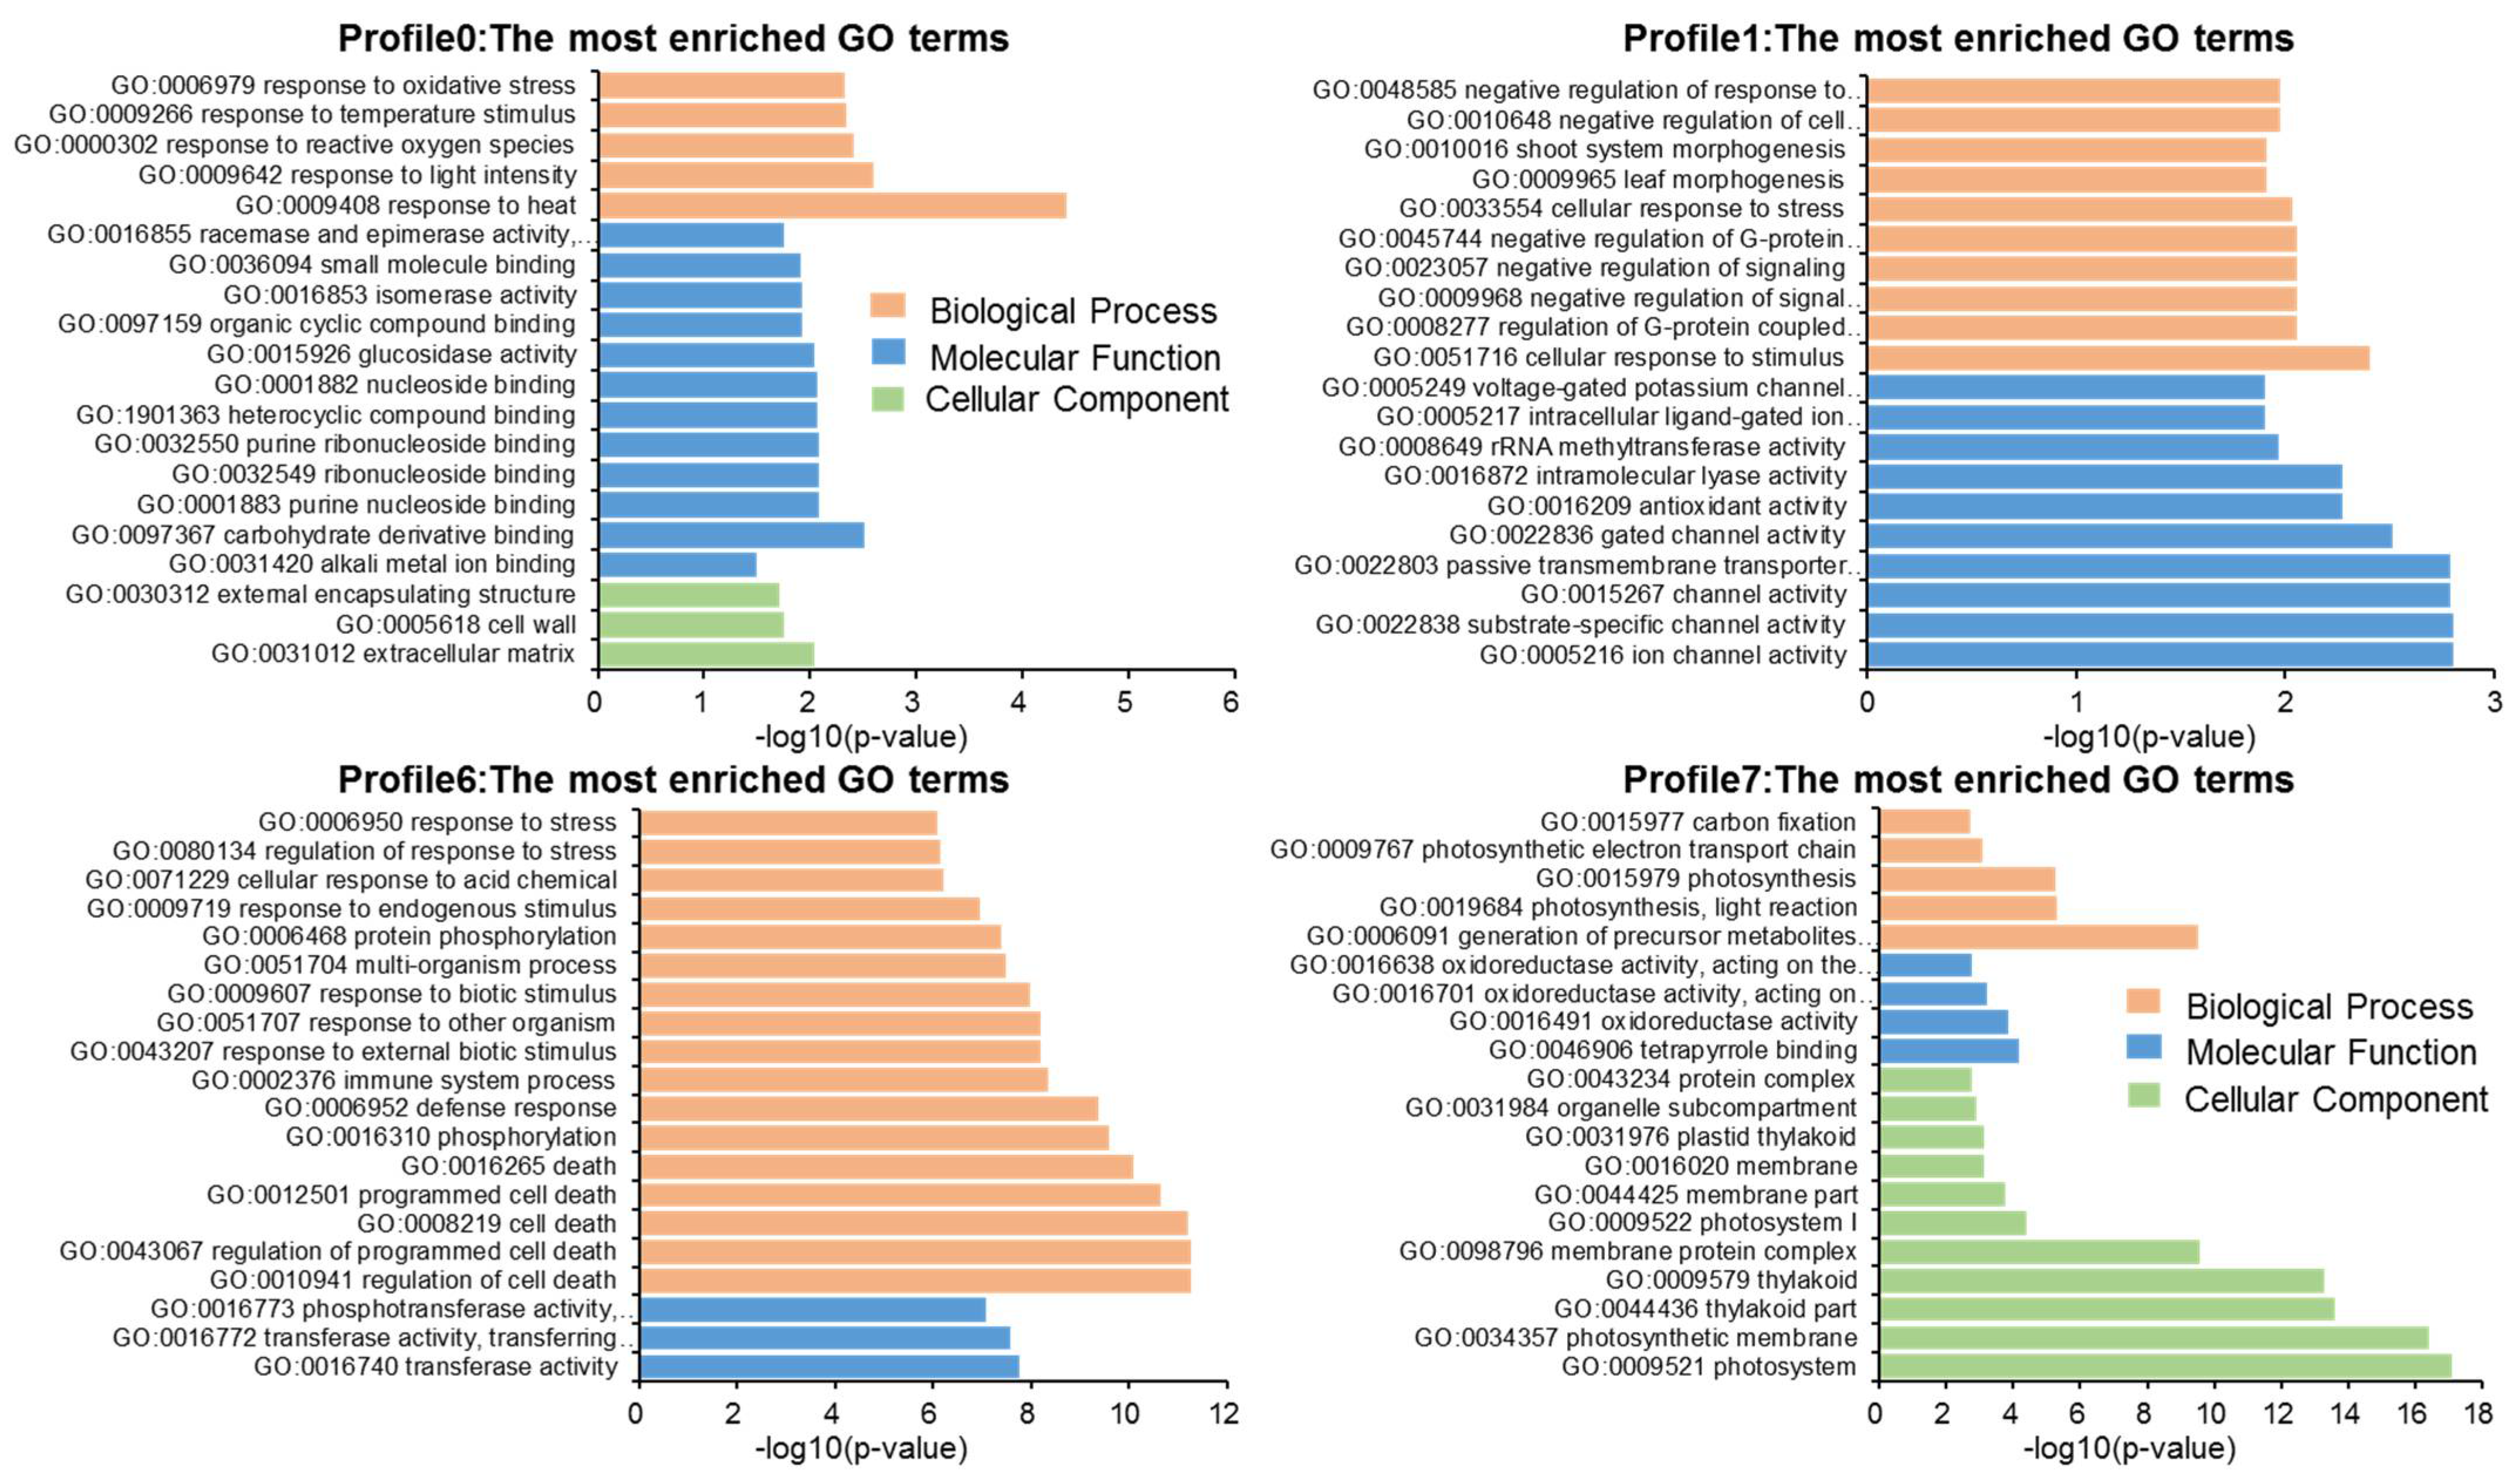
3.2.4. K-means Cluster Analysis
To further explore the functional diversity of DEGs from the three parts of the tree, we performed a K-means clustering analysis and grouped two 066 DEGs into eight clusters (Figure S3 and Table S6). Four clusters (0, 1, 6, and 7) were significantly different, while the other four (2, 3, 4, and 5) showed no significant difference. Among these clusters, cluster 6 showed a high expression level in Eg-2 and Eg-3. Conversely, cluster 1 showed a low expression level in Eg-2 and Eg-3. The expression level of cluster 0 decreased with the tree height growth, and the expression level of cluster 7 showed an opposite trend. Cluster 6 and 7 included 1208 genes (58.50%) and 308 genes (14.90%), respectively. Among these profiles, it is particularly noteworthy that the top 20 GO enrichment terms of cluster 6 were associated with the regulation of cell death (GO:0010941), regulation of programmed cell death (GO:0043067), cell death (GO:0008219), programmed cell death (GO:0012501), and death (GO:0016265). Meanwhile, the DEGs in profile 7 were mainly involved in photosynthesis, such as photosystem (GO:0009521), photosystem I (GO:0009522), photosynthetic membrane (GO:0034357), photosynthesis, light reaction (GO:0019684), photosynthesis (GO:0015979), photosynthetic electron transport chain (GO:0009767), etc. (Figure 4). Among the 2,066 DEGs, three transcripts of CesA and two transcripts of Csl were included. The NM_001302719.1 (the transcript of CesA5 in cluster 0) showed a high expression level in Eg-1. TCONS_00081278 (the transcript of CslE6 in cluster 5) showed a slightly higher expression level in Eg-2, and XM_010056952.2 (the transcript of CslD2 in cluster 6) was downregulated in Eg-1. The transcripts of CesA7 (XM_010048758.2) and CesA8 (XM_010058963.2) in cluster 7 showed significant upregulation in Eg-3. These results indicate that different genes in the same family would likely have different expression levels.
3.3. The Expression Patterns of CesA and Csl Genes
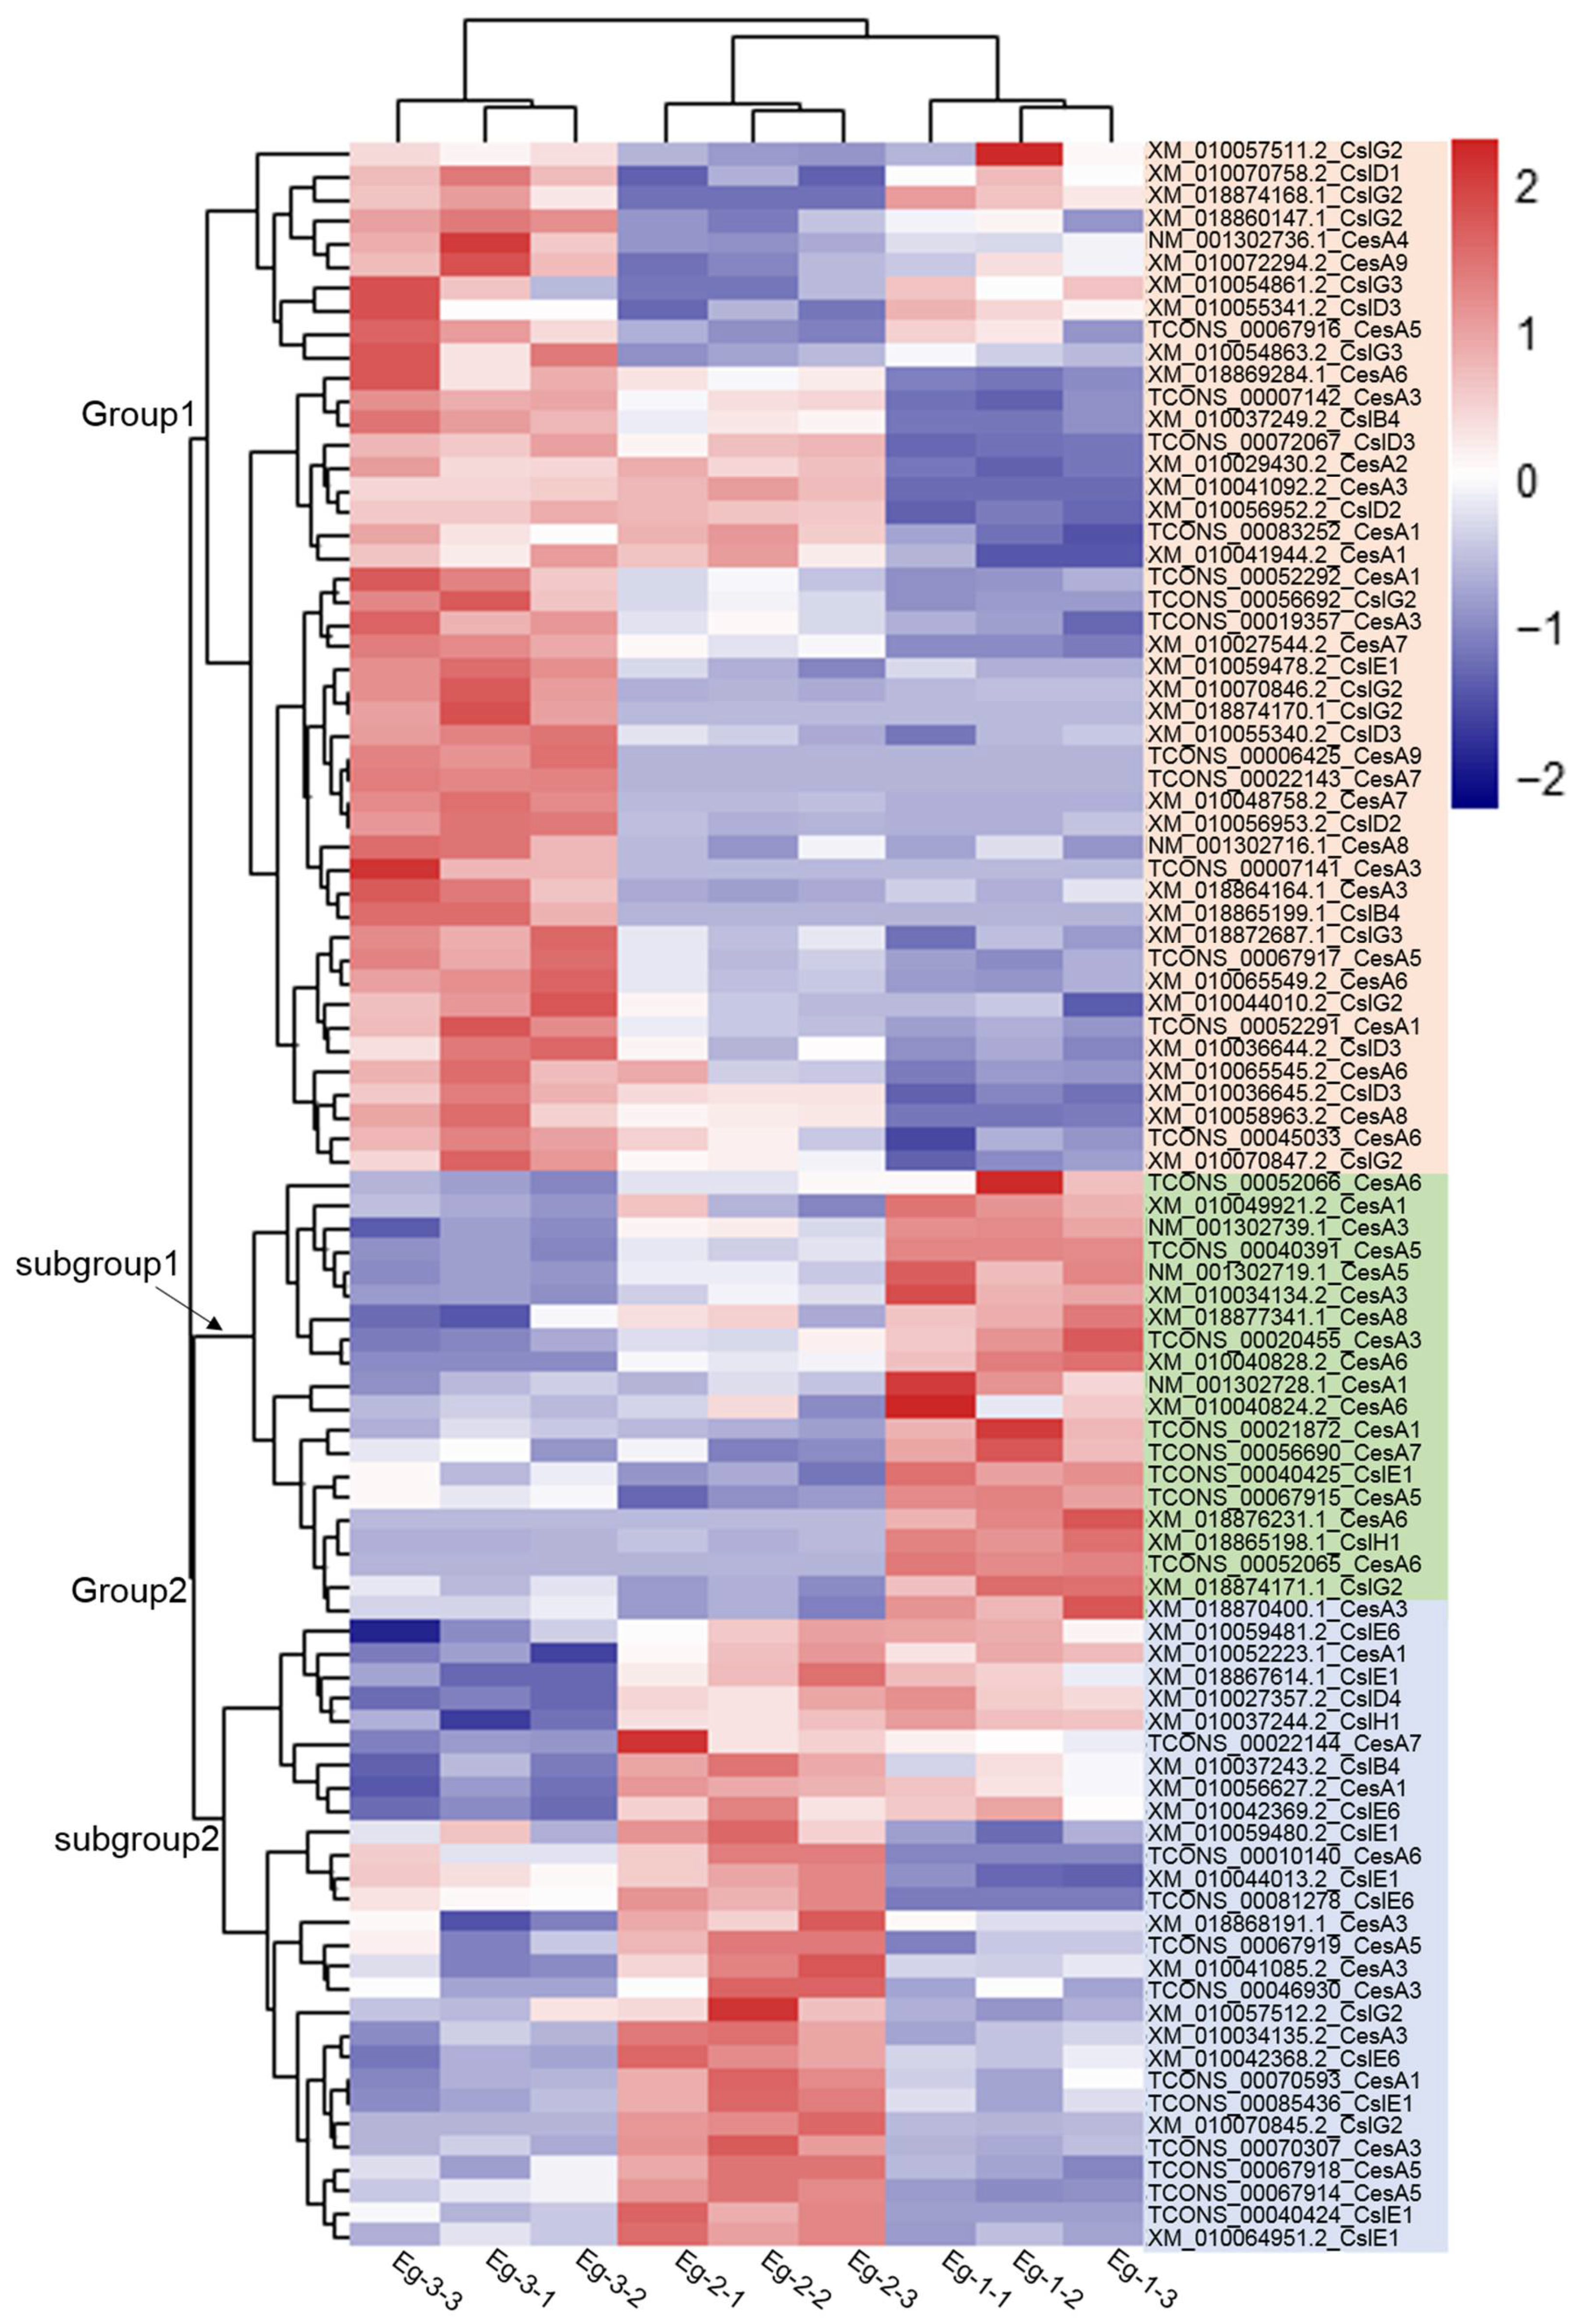
To further analyze the cellulose synthase and cellulose synthase-like protein genes of E. grandis, 58 CesA transcripts and 42 Csl transcripts were obtained from the transcriptome libraries established at three different height levels of E. grandis. The FRKM values of 56 CesA genes and 44 Csl genes at three different height levels were analyzed using heatmap clustering (Figure 5). A total of 100 transcripts were clustered into two groups. Group 1 included 46 transcripts; among which, 25 were CesAs and 21 were Csls. The expression levels of the 46 transcripts in Group 1 were higher in Eg-3. Furthermore, the transcripts of CesA4 (NM_001302736.1), CesA8 (NM_001302716.1), and CesA7 (XM_010048758.2) had the highest expression levels in Eg-3. The expression of EgCesA4 in E. grandis was linked with primary cell wall biosynthesis [23], and the immature xylem at the treetop underwent primary growth. In Arabidopsis, CesA4, CesA7, and CesA8 were co-expressed and associated with the same function [12]. Therefore, it is suggested that the immature xylem at the treetop (Eg-3) of E. grandis was in the active stage of primary cell wall formation. Among 21 transcripts of Csl genes, CslG, CslD, CslB, and CslE had 10, 8, 2, and 1 transcripts, respectively. The transcript of CslG (XM_010070846.2) and the transcript of CslD (TCONS_00072067, XM_010056952.2) had higher expression levels.
There were 48 transcripts in Group 2, divided into two subgroups; including 19 transcripts in subgroup 1 (17 transcripts of the CesA and two transcripts of the Csl). According to the FPKM values, the transcript of CesA3 (TCONS_20455) had the highest expression level in Eg-1, followed by another transcript of CesA3 (NM_001302739.1), and the transcript of CesA1 (NM_001302728.1). Ranik et al. [23] and Lu et al. [24] suggested that EgCesA1 to 3 were specifically expressed in tissues undergoing secondary cell walls biosynthesis. It can be concluded that the secondary cell walls of the immature xylem at the diameter at the breast height (DBH) of 6-year-old E. grandis were synthesized in large quantities.
Subgroup 2 in Group 2 had a total of 29 transcripts; among which, 15 were CesA genes, mainly composed of CesA1 and CesA3. A total of 14 transcripts of Csl genes were mainly composed of 10 transcripts of CslE genes and one transcript of each CslB, CslD, CslG, and CslH. Based on the variation trend of FPKM, the transcript of CesA3 (TCONS_00070307) and the transcripts of CslE (XM_010042369.2, XM_010059480.2, and TCONS_00040424) had slightly higher expression levels at Eg-2.
3.4. Bioinformatics Analysis of CS
The ORF length of 58 CesA genes ranged from 186 to 3294 bp, and the number of amino acids ranged from 61 to 1097 aa. The relative molecular weights ranged from 6.90 to 123.63 KDa, and the theoretical isoelectric indexes ranged from 4.58 to 9.15. The instability coefficient and the aliphatic indexes ranged from 13.11 to 63.52, and 68.99 to 131.97, respectively. Among 58 CesA transcripts, 16 and 42 transcripts were hydrophobic and hydrophilic proteins, respectively (Table S7).
The ORF length of 42 transcripts of Csl genes ranged from 324 to 3417 bp, and the number of amino acids ranged from 107 to 1138 aa. The relative molecular weights ranged from 11.62 to 127.55 KDa, and the theoretical isoelectric points ranged from 5.49 to 9.59. The instability coefficient and the aliphatic coefficient ranged from 31.18 to 49.40, and 69.10 to 136.64, respectively. Among 42 Csl transcripts, 18 and 24 transcripts were hydrophobic and hydrophilic proteins, respectively (Table S7).
CS proteins exhibit a conserved domain architecture, consisting of an extended N-terminal domain that contains a zinc finger motif, eight transmembrane domains, and a large central catalytic domain containing the conserved amino acid signatures of the processive family two glycosyltransferases [13]. Gene Structure Display Server was used to analyze the characteristics of the gene structures of 100 CesA and Csl gene transcripts in E. grandis (Figure S4 and Table S7). The results showed that 58 transcripts of CesA consisted of 1~8 transmembrane domains; among which, 21 transcripts had eight transmembrane domains, two were at the N-terminal, and six were at the C-terminal. Then, 12 transcripts had six transmembrane domains at the C-terminal. The N-terminal of 25 and seven transcripts contained at least one conserved zinc finger domain, and two zinc finger domains, respectively. The zinc finger domain has four conserved cysteine residues in series, which can bind to DNA, and may be related to the interactions between various subunits of CesA protein [29]. At the same time, there were three closely related Asp residues (D1, D2, and D3) in 18 transcripts, and 35 transcripts contained a D, D, D, conserved QxxRW motif, which has been proposed to define the nucleotide sugar-binding domain, and the catalytic site of these enzymes [30].
The structure of Csl proteins was near consistent with that of CesA, and these proteins contained the strongly conserved catalytic active motifs, DDD and QxxRW, although all the Csl protein families lacked in the zinc finger domain (such as the CslD family, which contained proteins that were similar to the CesAs in size), explaining that Csl proteins may not need to form CSC to complete cell wall polysaccharide synthesis [5].
3.5. Phylogenetic Analysis of CS Proteins
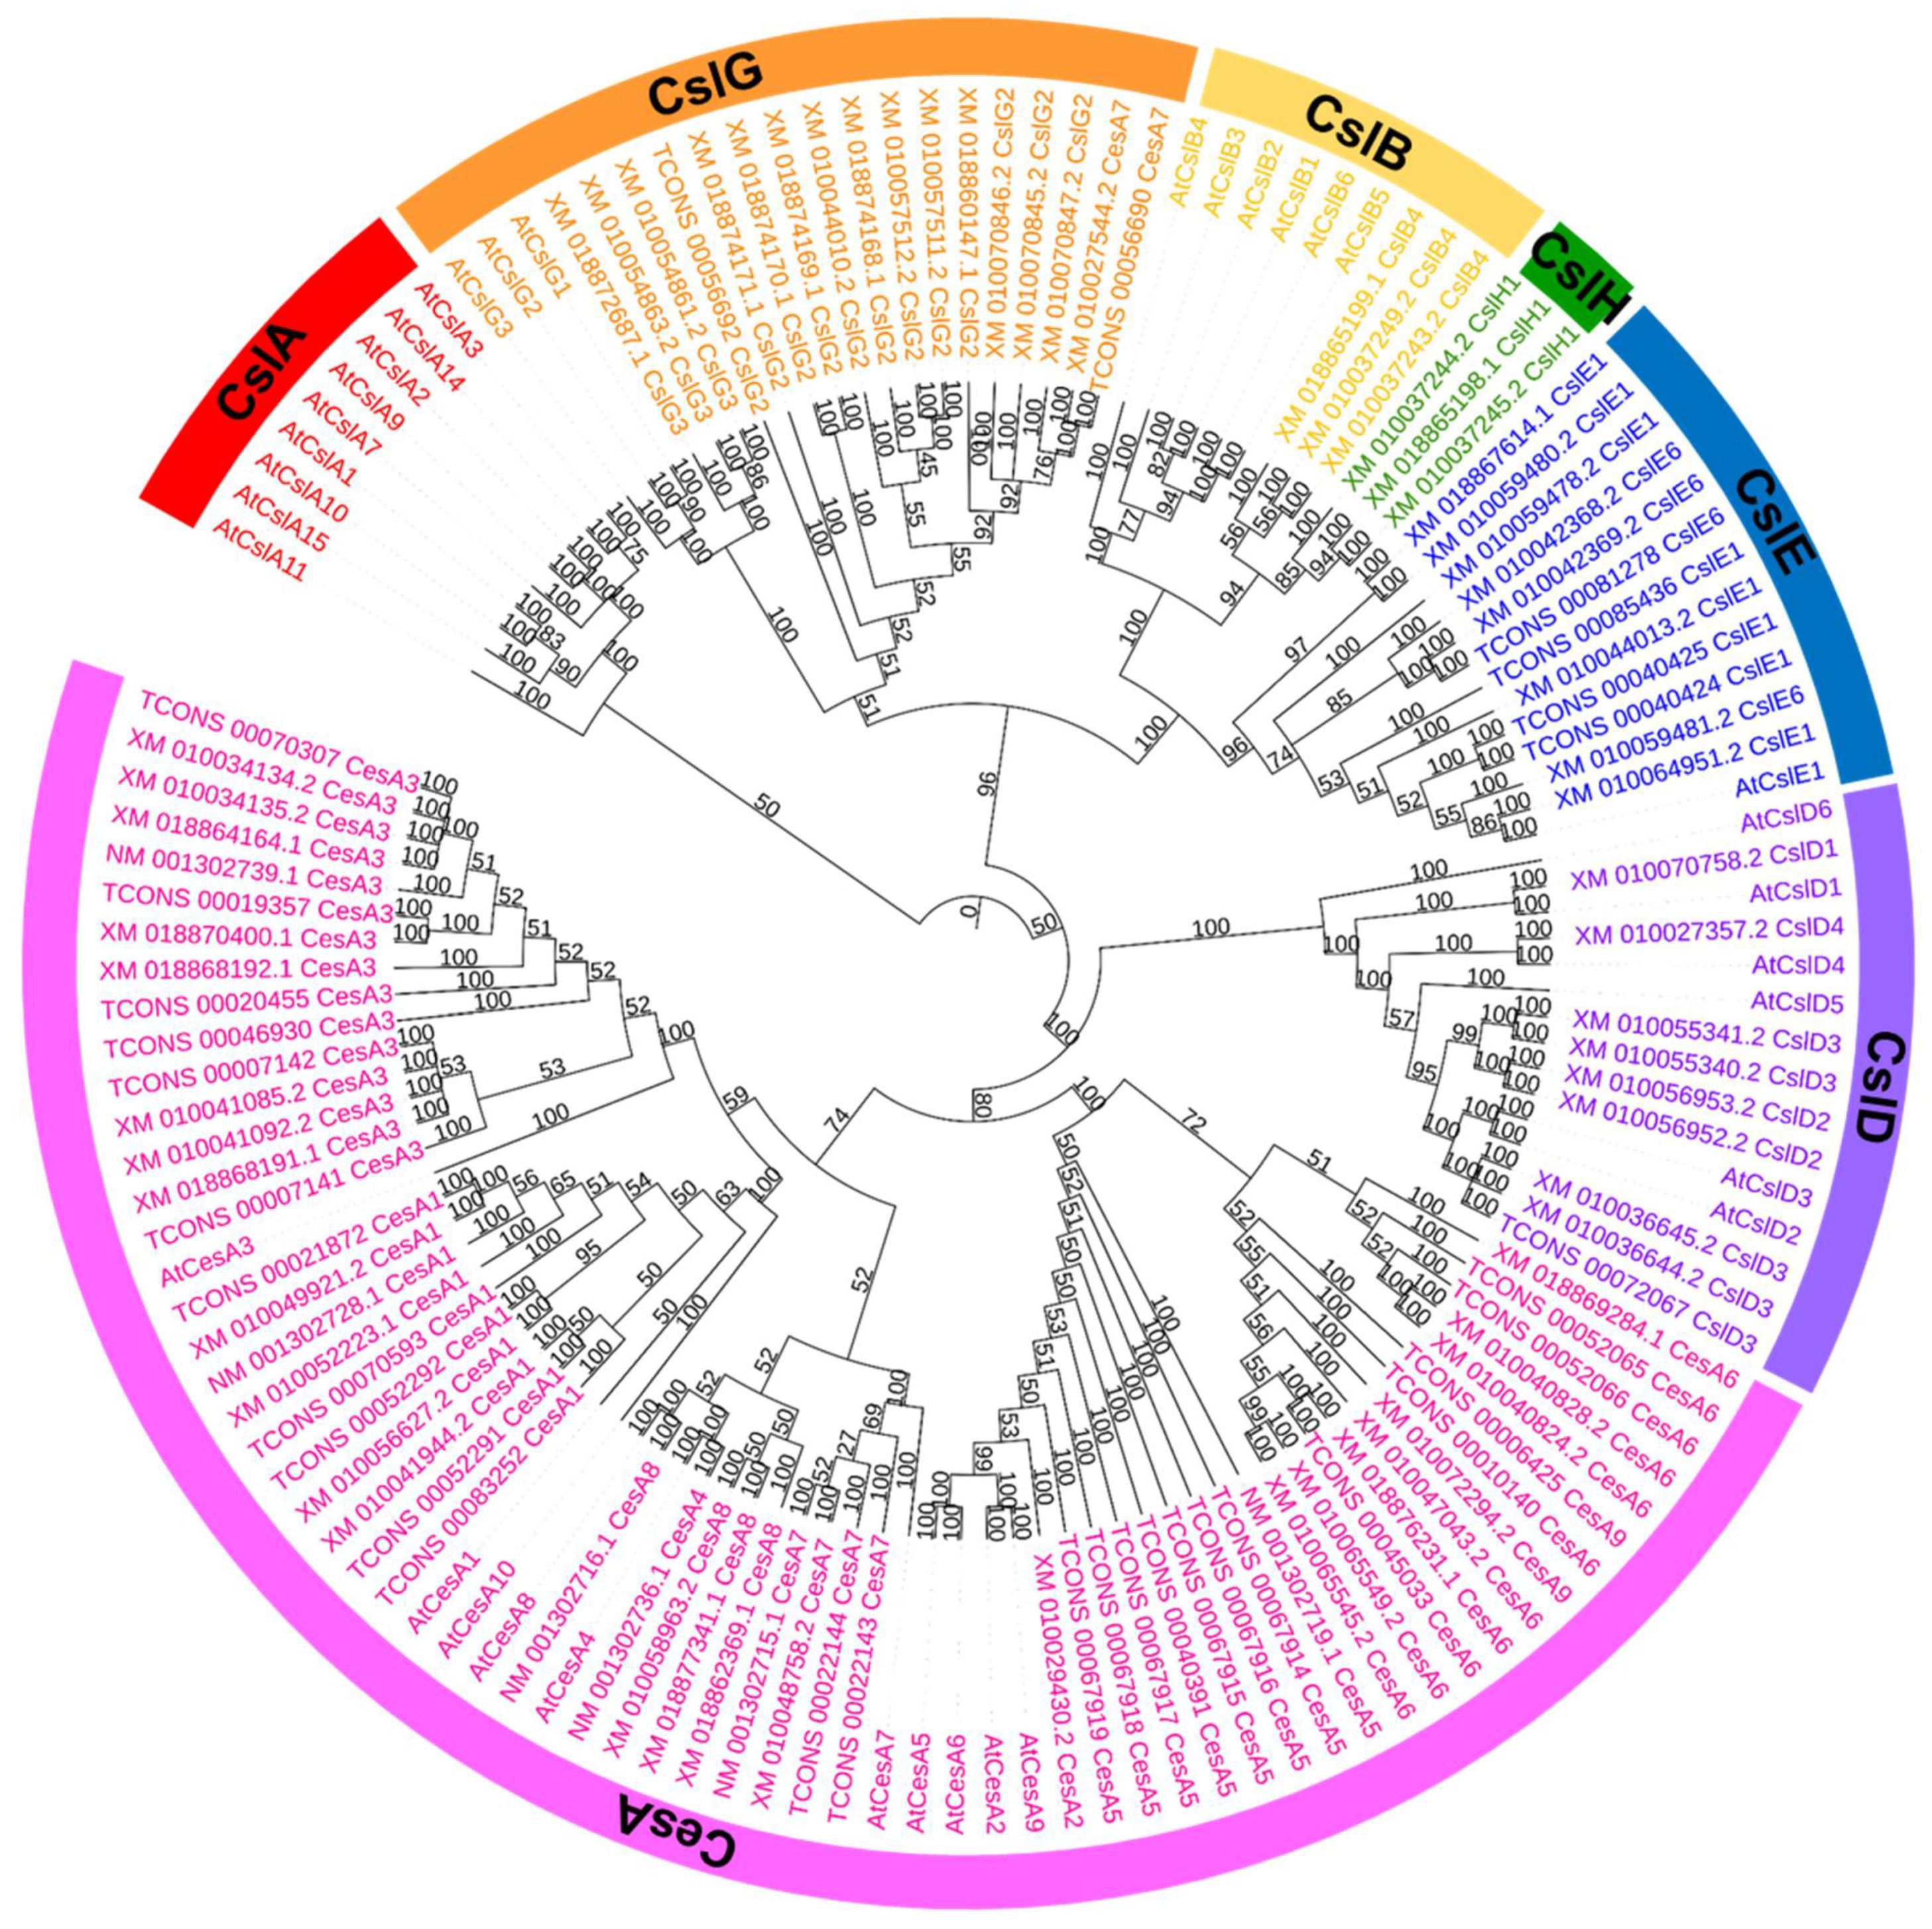
The amino acid sequences of 10 CesA and 25 Csl proteins of Arabidopsis, and 100 amino acid sequences of the CesA and Csl proteins of E. grandis were selected to construct phylogenetic trees using the MP method (Figure 6). The value of the consistency index (CI), using the maximum parsimony method, was 0.502, and the retention index (RI) was 0.853. The MP phylogenetic tree clearly grouped 135 amino acid sequences into two distinct groups. The cluster analysis showed that the CesA1-9 group formed CslD; this finding was consistent with that of earlier reports, suggesting a common origin and conserved domains for both families (approximately 45% identical at the amino acid level) [15,31,32,33]. The phylogenetic analysis of Csl genes with Arabidopsis Csls clustered them into five subfamilies, including CslA (zero genes), CslB/H (three genes of CslB and three genes of CslH), CslD (nine genes), CslE (12 genes), and CslG (15 genes). There are several conserved domains in the Csl gene family, and the sequences of these conserved domains determine the specific function of the enzyme, indicating that they are evolutionarily closely related to each other [34]. Richmond et al. [31] found that the CslB, CslG, and CslE gene families in A. thaliana were conserved, suggesting that they might have evolved from the same gene. As seen in Figure 6, CslB, CslE, and CslG lineages could be, genetically, the most closely related. The CslB and CslH lineages were clustered together, indicating that those two subfamilies were paralogous genes. This result is consistent with the findings presented by Little et al. [35], who identified that CslH is the monocot-specific sister clade to CslB, and that it contains many paralogs.
Zhang et al. [36] analyzed the sequences of the plant cellulose synthase gene family and found that the S11 sites of CesA6 and CesA2/5/9, as well as their sequences at both ends, were relatively conservative; this finding was consistent with the result showing that AtCesA2, 5, 6, and 9 were clustered into a small group, as seen in Figure 6. The CesA4, 7 and 8 gene families were clustered into a subgroup in the CesA subfamily. The genetic distance between CesA4 and CesA8 was closer than CesA7, which may be due to the fact that the CesA4, CesA7, and CesA8 gene families are nonredundant and CesA7 has the highest degree of class specificity [37,38]. The three gene families participate in secondary cell wall biosynthesis in Arabidopsis [39].
3.6. Gene Co-Expression Network
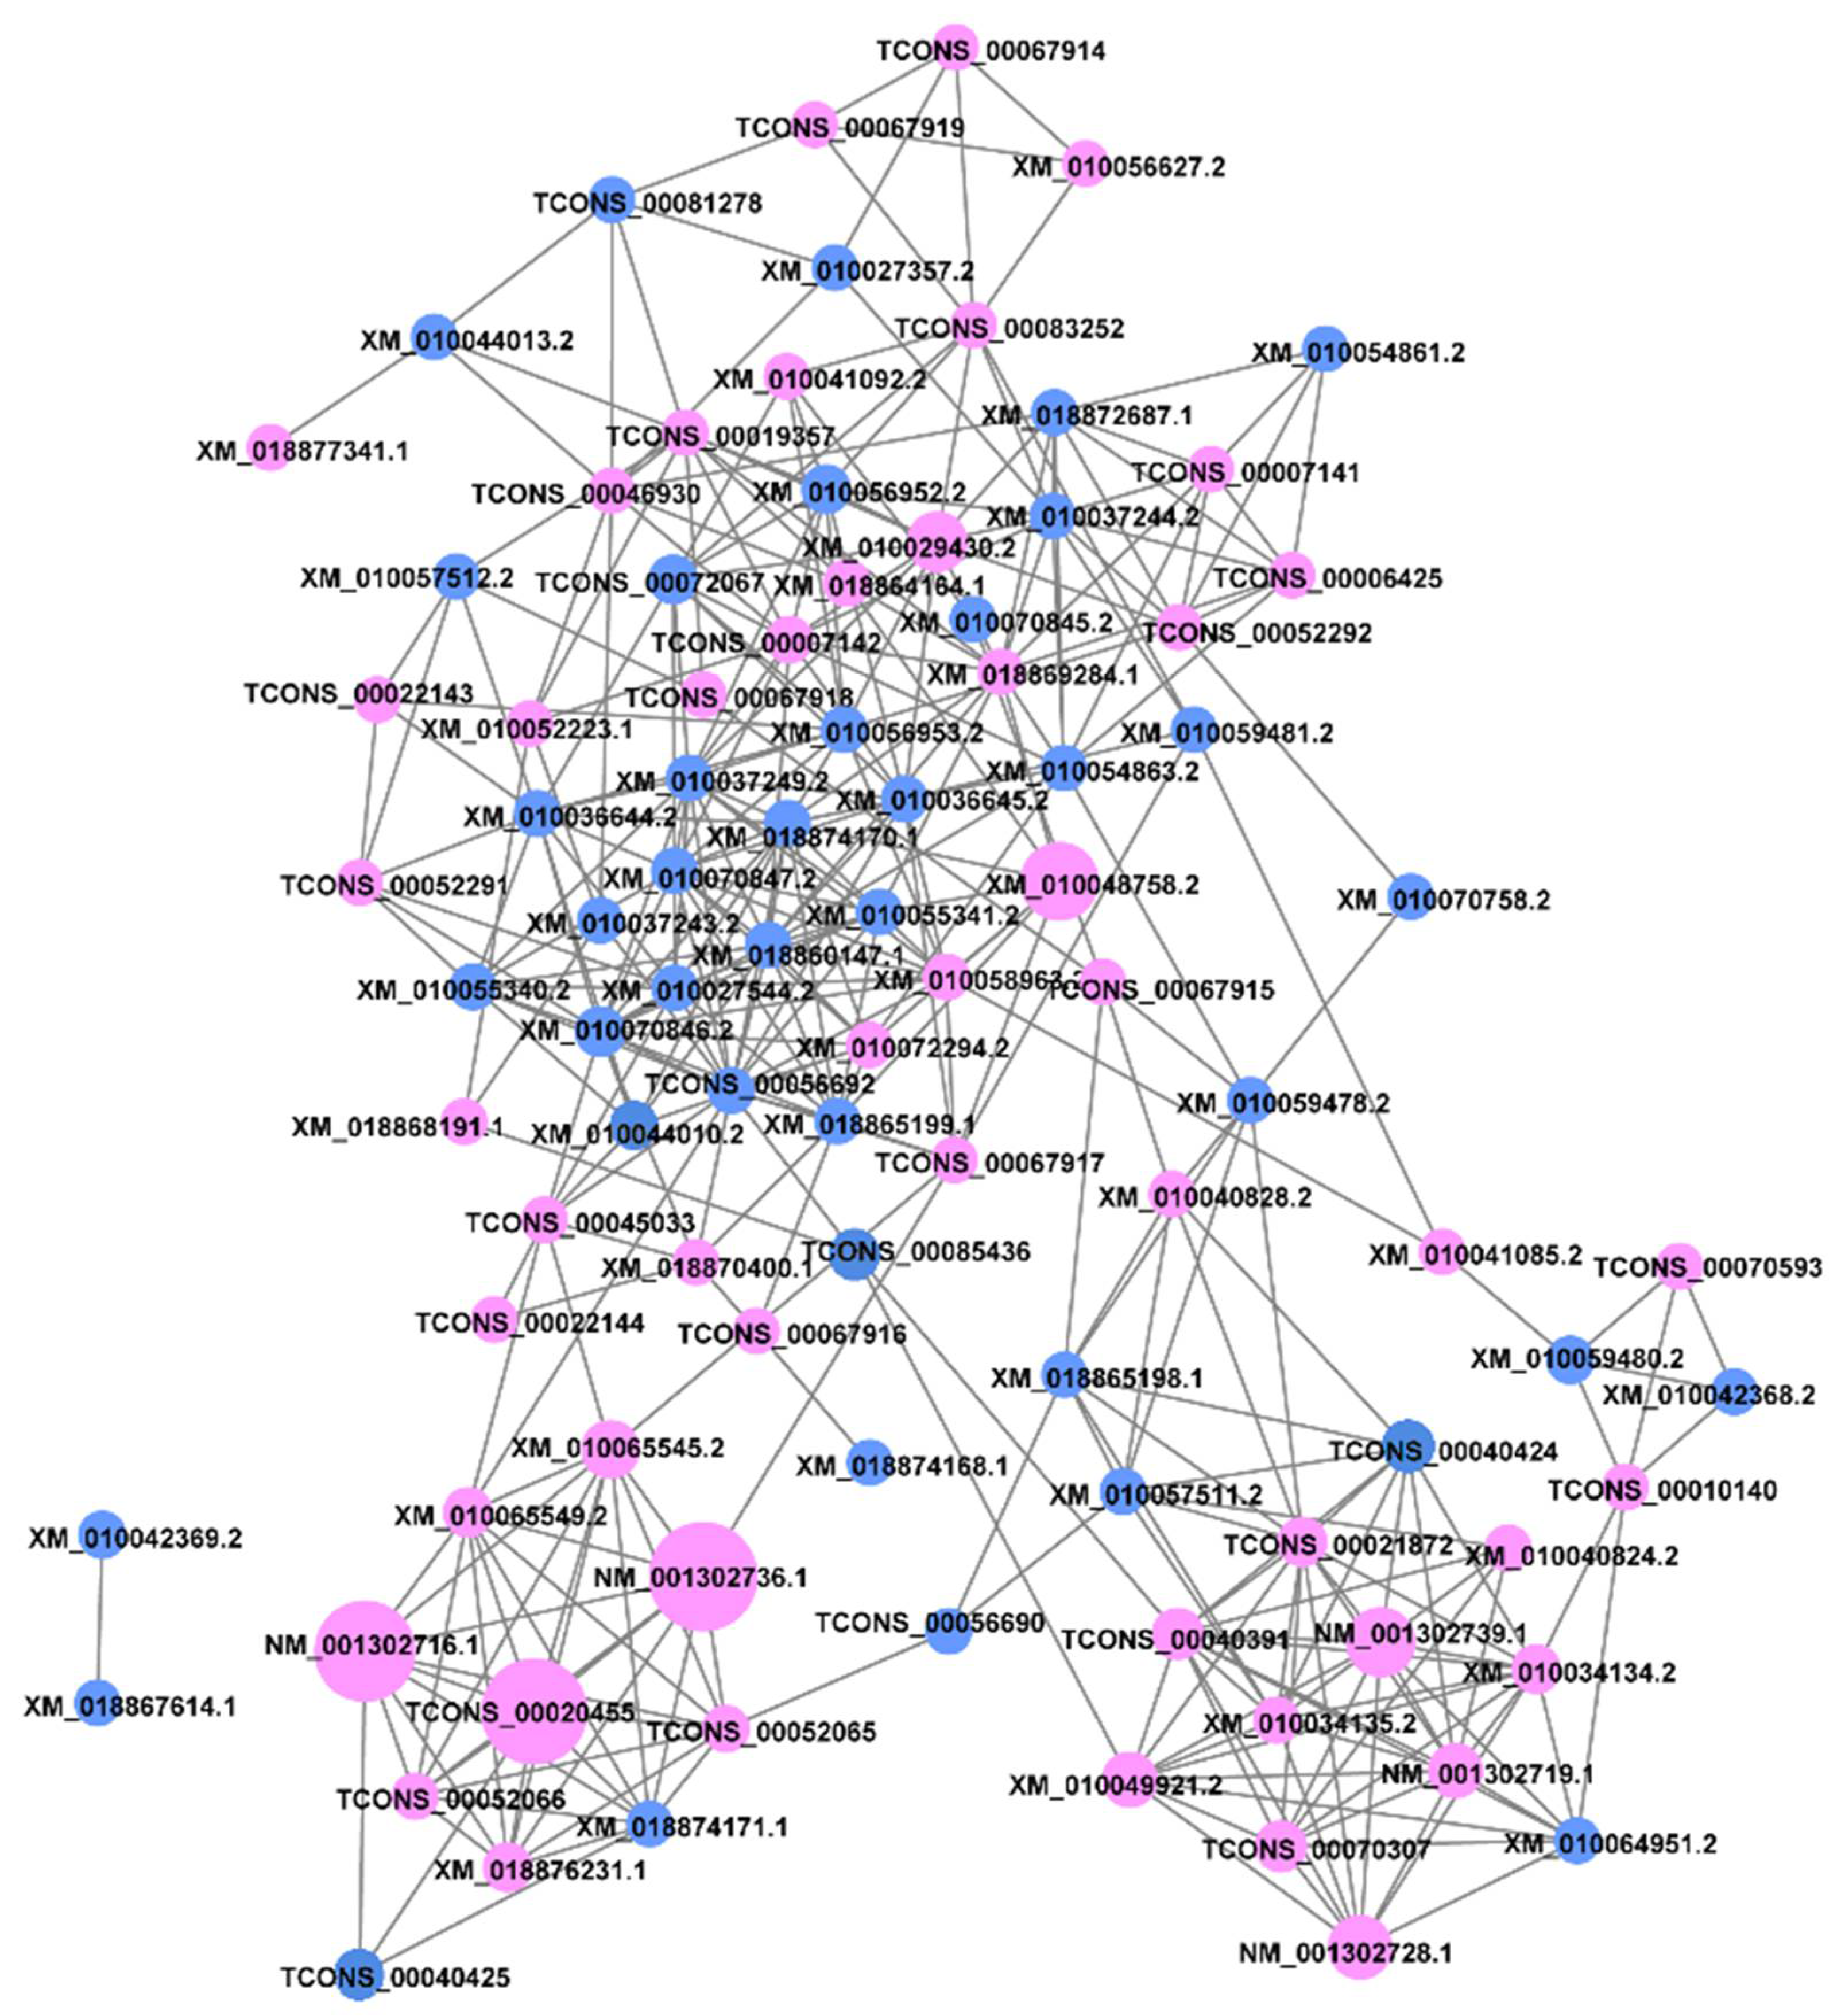
The CesA formed different triplexes for the synthesis of primary and secondary cell walls. To explore which CesA or Csl genes work together in E. grandis, we studied their co-expression (Figure 7). The co-expression network analysis revealed that NM_001302736.1 (CesA4), TCONS_0020455 (CesA3), NM_001302716.1 (CesA8), XM_010048758.2 (CesA7), and NM_001302739.1 (CesA3) had the highest FPKMs values of the genes in all samples. Based on the results of Pearson’s correlation coefficient (see Table S8), the correlation coefficient among the transcripts of CesA8 (NM_001302716.1), CesA4 (NM_001302736.1), and CesA6 (XM_010065545.2, XM_010065549.2) were greater than 0.80, and they were co-expressed. Similarly, the transcripts of CesA6 (TCONS_00052065, TCONS_00052066) and CesA3 (TCONS_00020455) were co-expressed. Moreover, the transcripts of CesA1 (NM_001302728.1, XM_010049921.2), CesA3 (XM_010034134.2, NM_001302739.1), and CesA5 (NM_001302719.1, TCONS_00040391) were co-expressed.
The co-expression analysis of Csls in E. grandis showed that the FPKMs values of all the Csl genes were relatively low. The co-expression analysis of the CslB subfamily revealed that the transcript of CslB4 (XM_010037249.2) was co-expressed with 12 transcripts of CslDs and CslGs. Secondly, the transcript of CslG2 (XM_010070847.2) was co-expressed with eight transcripts of CslBs and CslDs. Particularly, the co-expression network of CslGs showed that 44 transcripts of CesAs and CslGs were co-expressed, and the transcripts of CslEs were co-expressed with 37 transcripts of CesAs.
3.7. Expression Profiling of CesA and Csl in Different Parts and Tissues of E. grandis
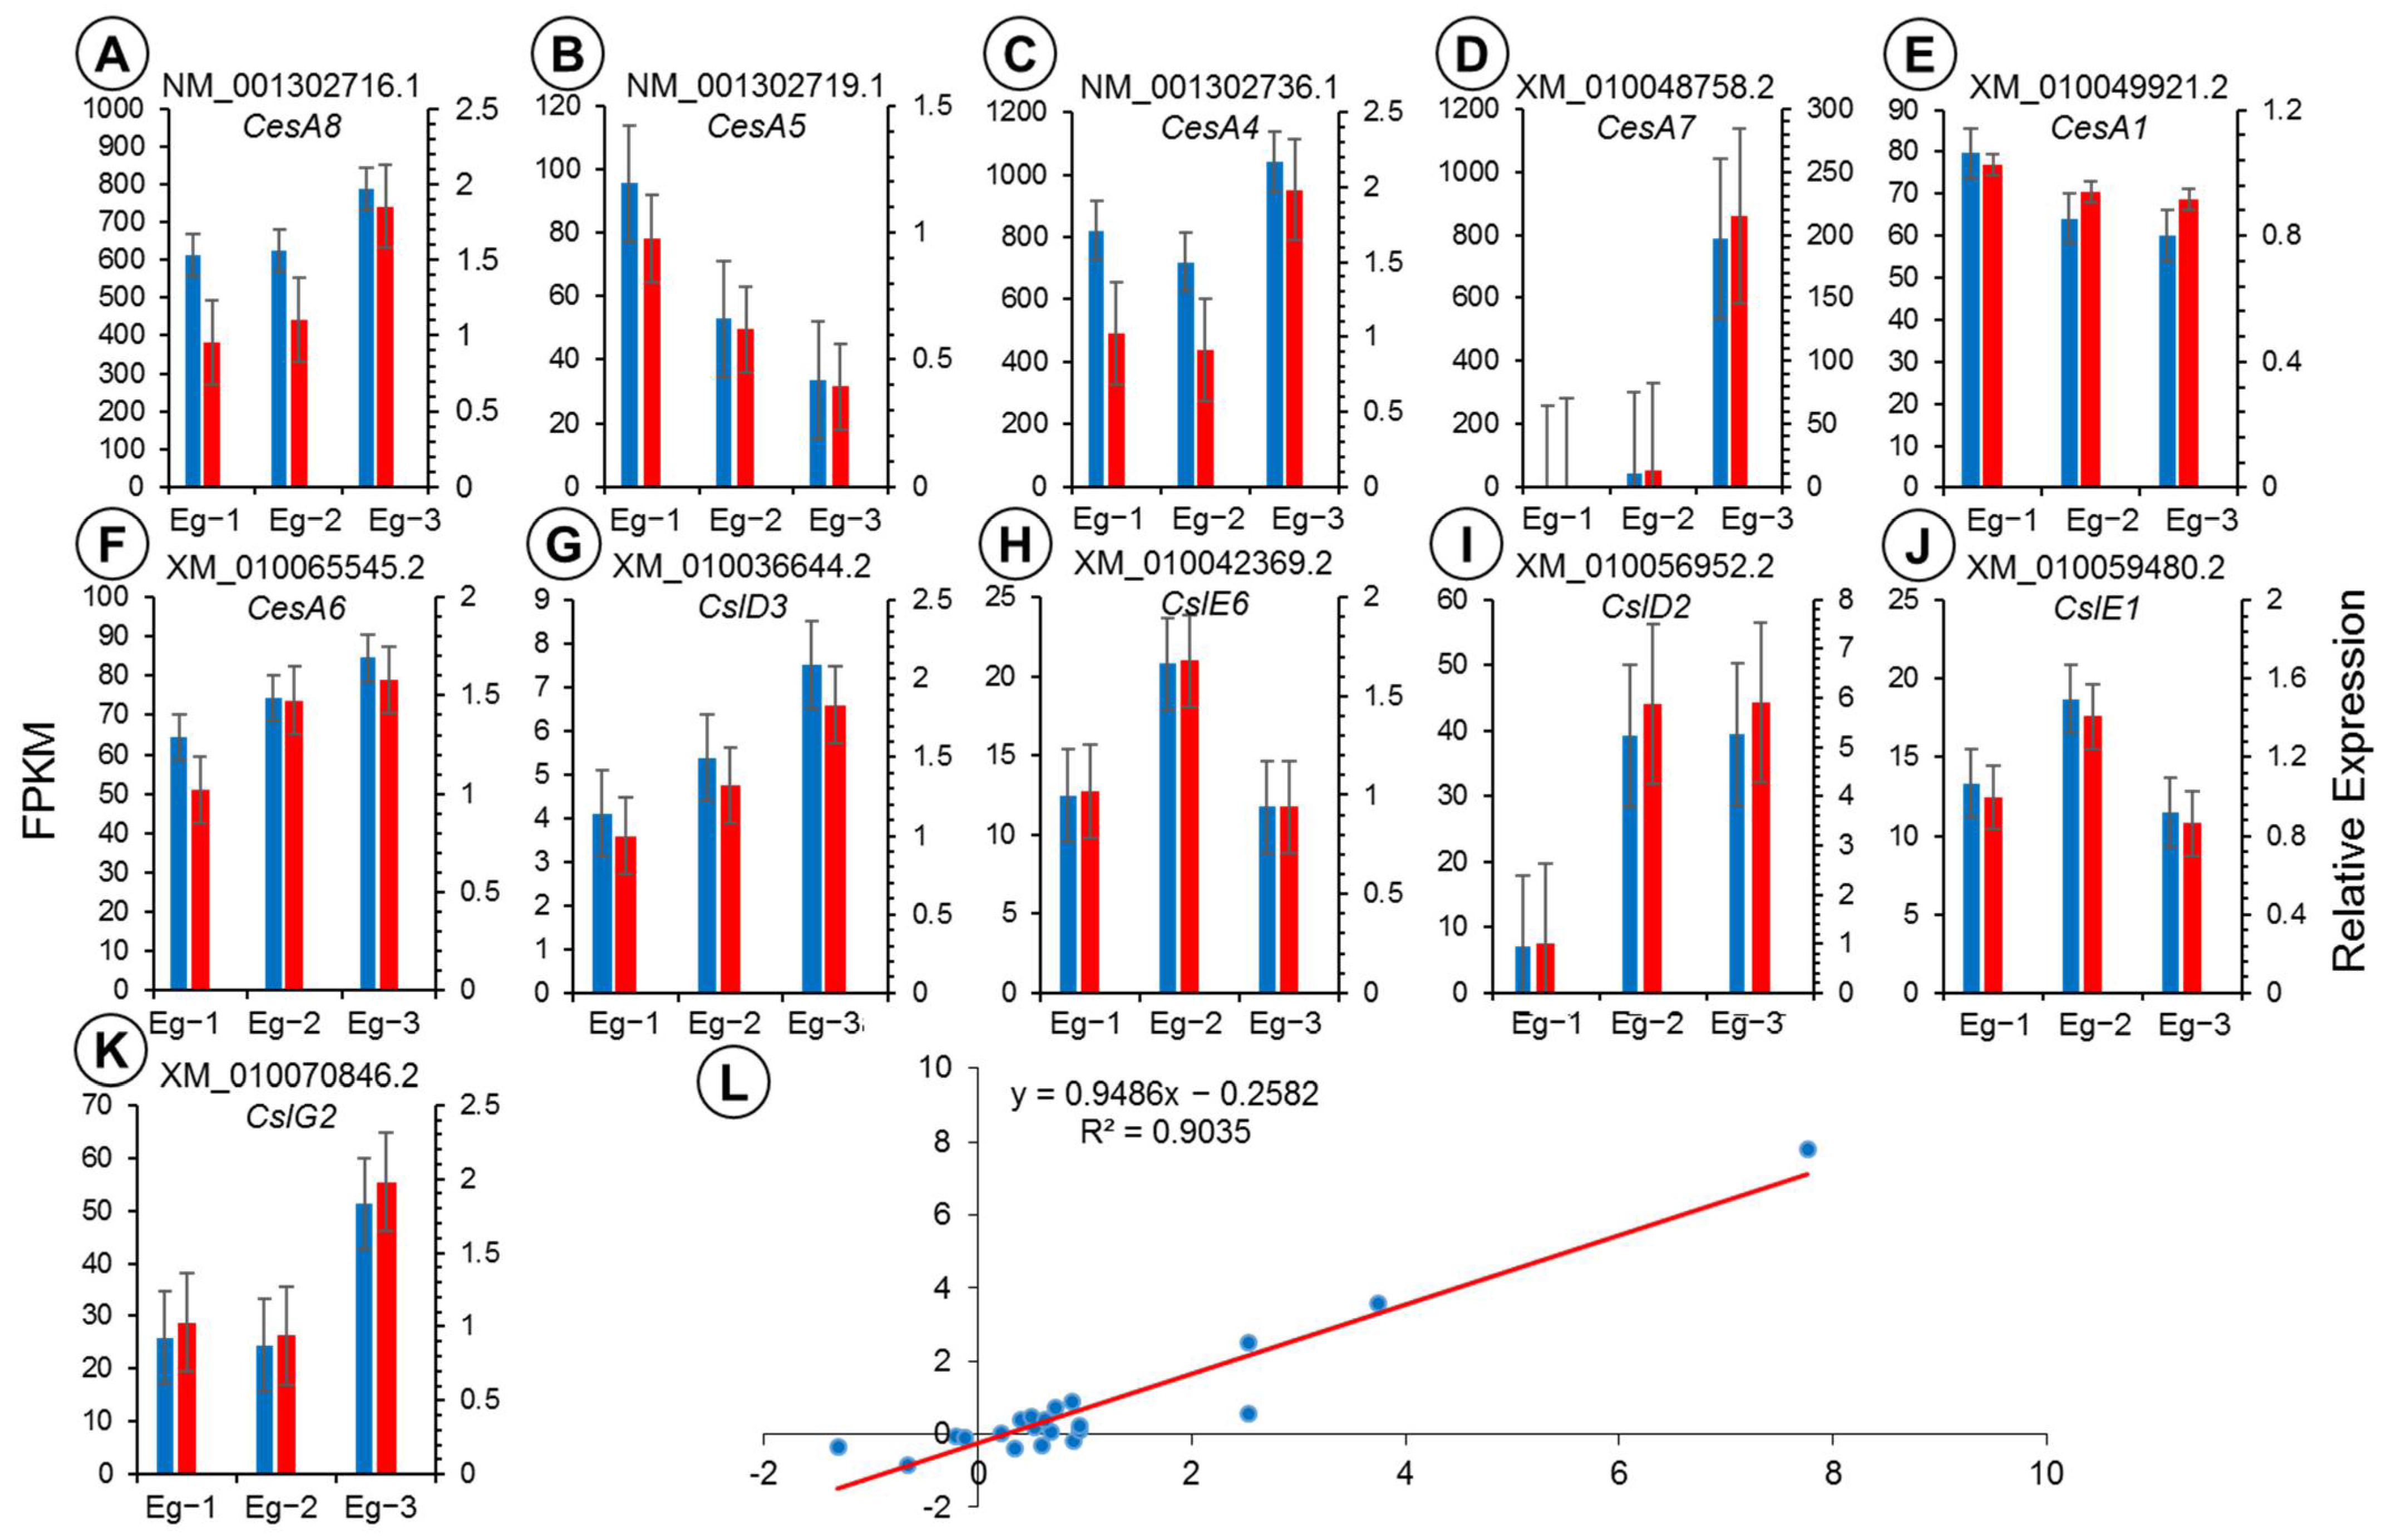
Based on the FPKM values and annotation results, the results regarding the relative expression of six transcripts of CesA and five transcripts of Csl, in the three different parts of E. grandis, were confirmed using qRT-PCR. The results for the relative expression of 11 transcripts were consistent with the RNA-seq data (Figure 8A–K). The expression pattern indicated that the RNA-seq provided reliable means to analyze and measure gene expression in the different tissues and parts of E. grandis. Meanwhile, a highly significant correlation (R2 = 0.9035) (see Figure 8L) was found between the RNA-seq data and the qRT-PCR results for 11 genes, suggesting that the RNA-seq data are reliable and reflect the expression levels of transcripts.
Based on the patterns of expression of the individual transcripts, there were differences in the FPKM values of an expression in various parts of E. grandis. Both the RNA-seq and RT-qPCR results revealed that CesA1 (XM_010049921.2) and CesA5 (XM_001302719.1) were upregulated in Eg-1, although CesA4 (XM_001302736.1), CesA6 (XM_010065545.2), CesA7 (XM_010048758.2), and CesA8 (XM_001302716.1) had higher expression levels in Eg-3. Similarly, according to the results of the RNA-seq and qRT-PCR, the analysis of expression pattern demonstrated that the transcripts of CslD3 and CslG2, and the transcripts of CslE1 and CslE6, were upregulated in Eg-3 and Eg-2, respectively. Particularly, the transcript of CslD2 demonstrated higher expression levels in both Eg-2 and Eg-3.
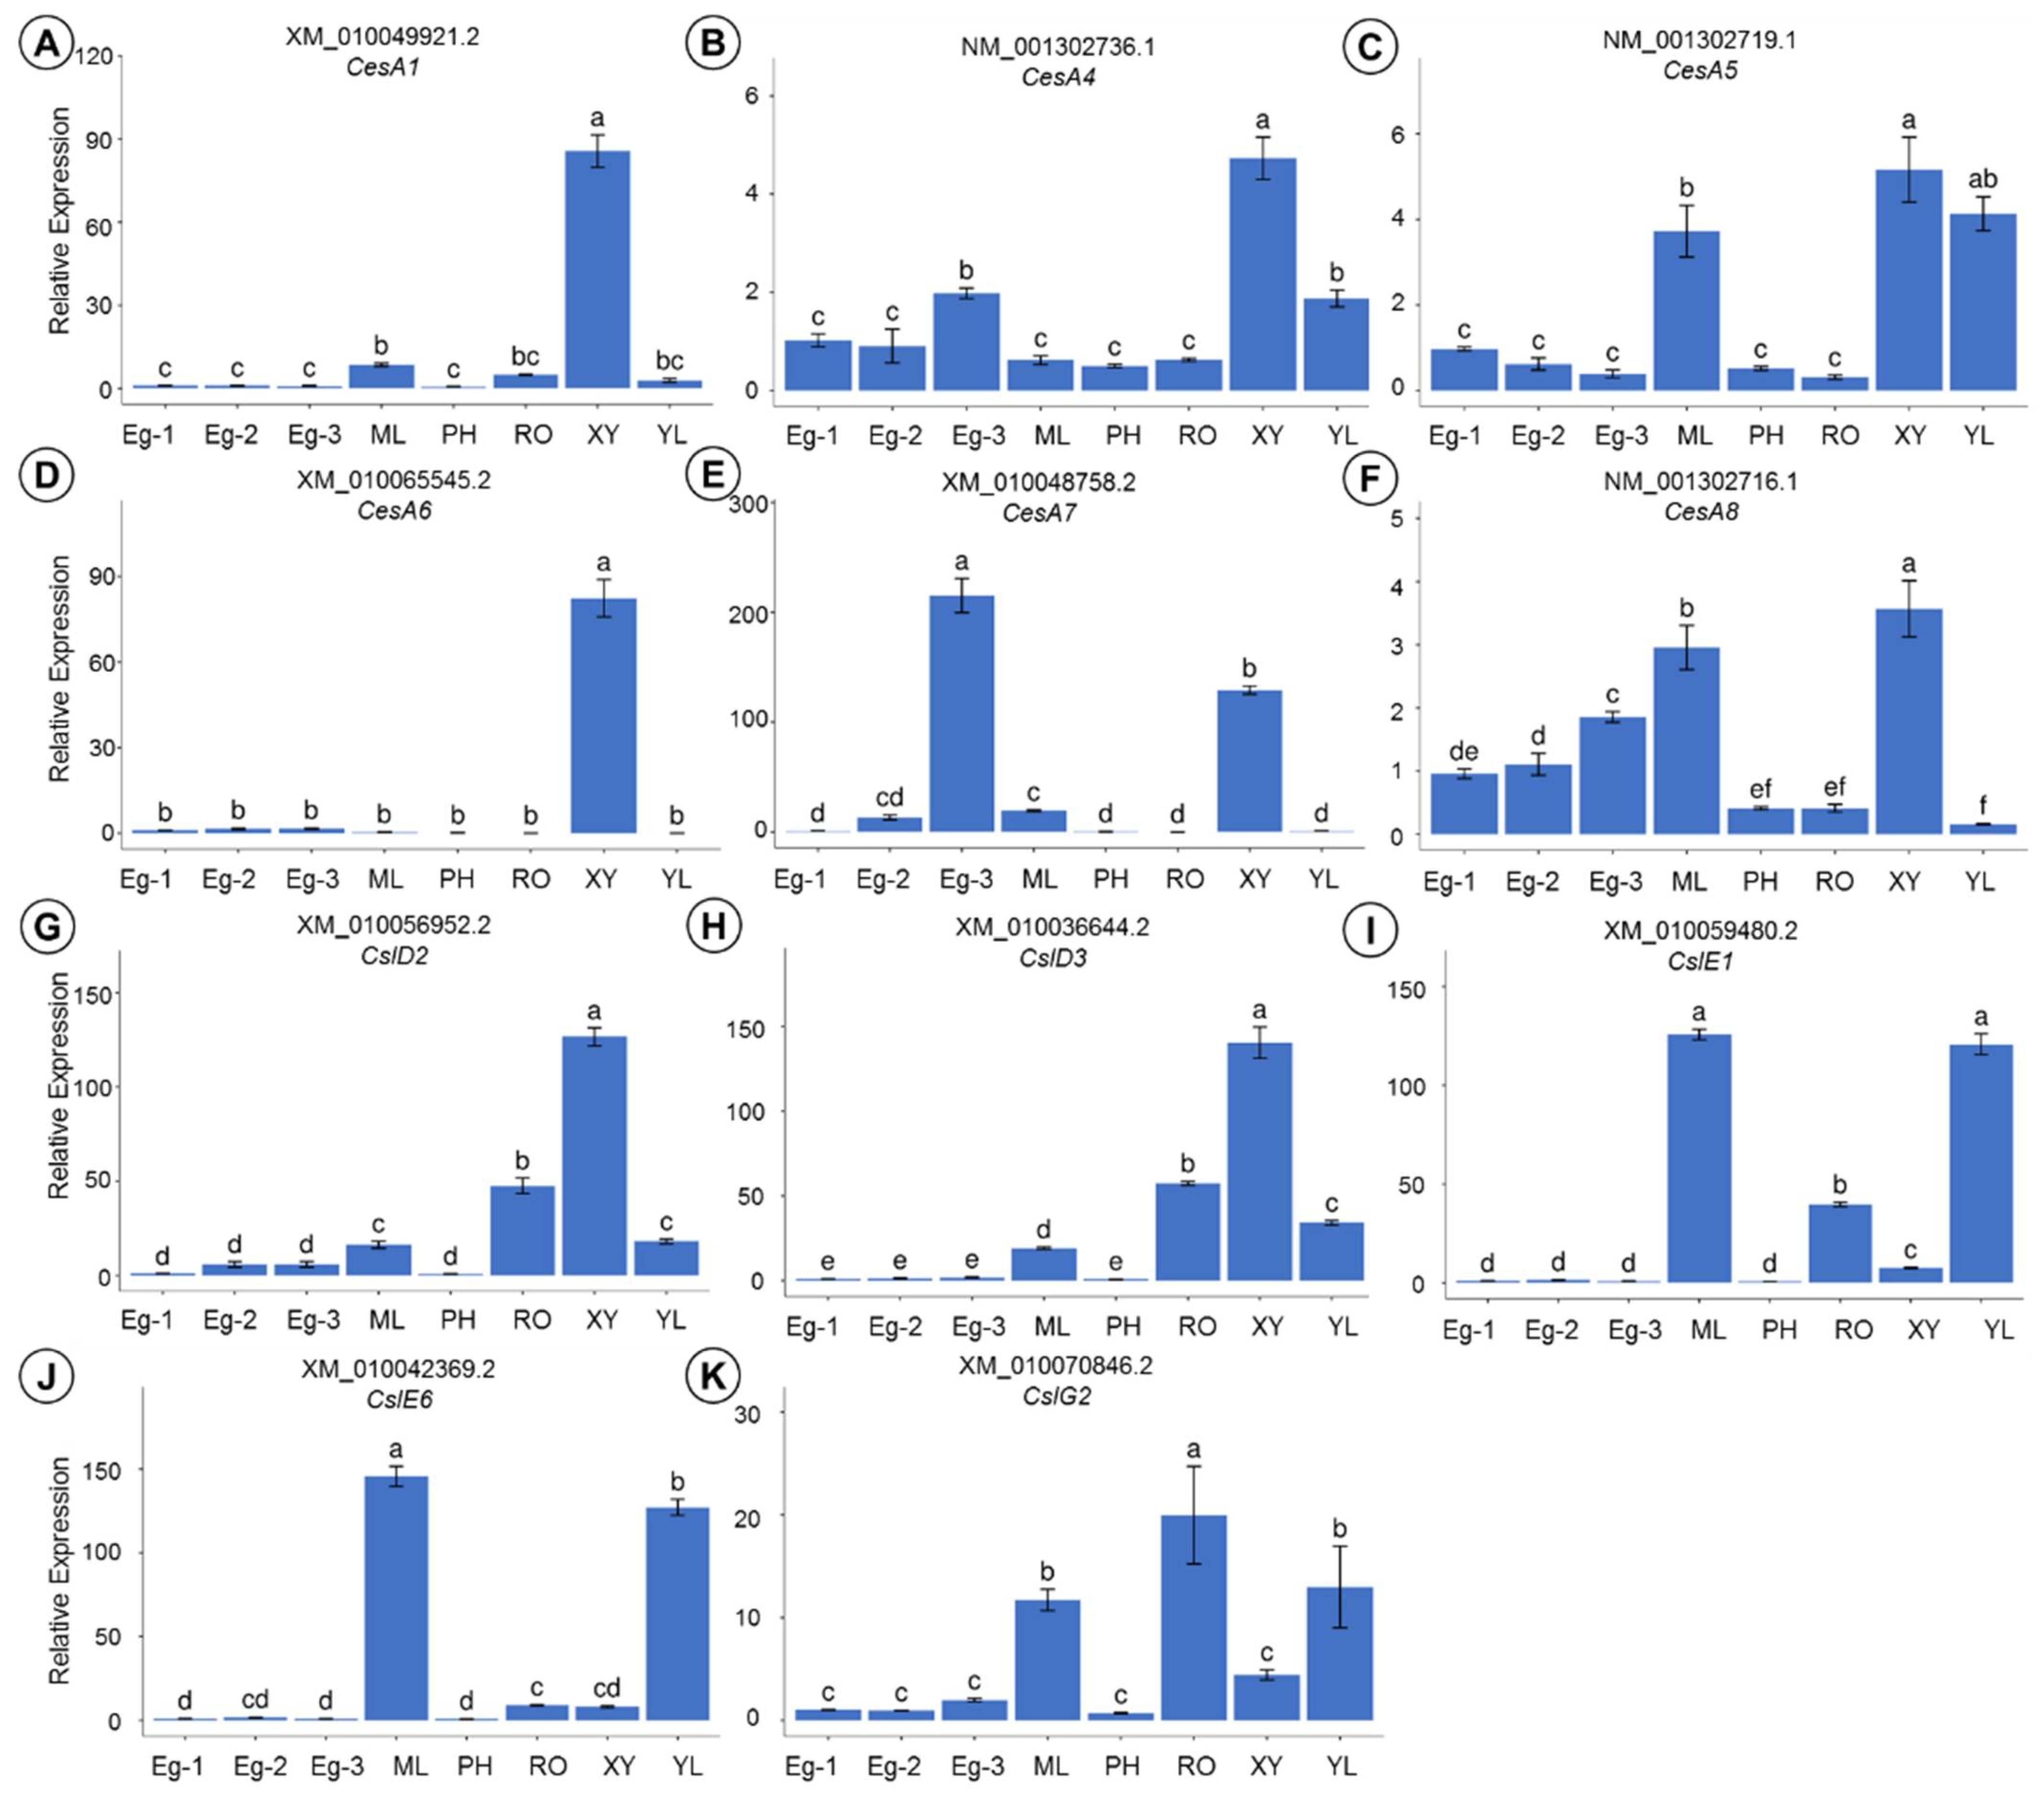
The expression levels of 11 candidate genes were determined using qRT-PCR, in eight woody and herbaceous tissues of E. grandis. Individual candidate genes were differentially expressed in the different tissues and parts (Figure 9A–K). Specifically, XM_010048758.2 (the transcript of CesA7; Figure 9E) had the highest expression level in the treetop of the trunk (Eg-3), which was 1.67 times higher in Eg-3 than in xylem, in comparison to 11.14 times higher in mature leaves (ML), and 16.09 times higher in Eg-2. Similarly, the expression level in the transcript of CesA1 (XM_010049921.2; Figure 9A) was upregulated in the Eg-3, which was 29.39 times higher in Eg-3 than it was in the young leaves (YL), 17.30 times higher in the root (RO), and 10.07 times higher in the mature leaves (ML). Furthermore, the expression pattern of the CesA6 transcript (XM_010065524.2; Figure 9D) was predominant in the xylem tissue, in comparison to a 52.15-fold increase in Eg-3. The expression profiles of NM_001302716.1, NM_001302719.1, and NM_001302736.1 (transcripts of CesA8, CesA5, and CesA4; Figure 9F,C and B, respectively) were also upregulated in xylem, which were 1.21, 1.39, and 7.63 times higher in xylem than they were in the mature leaves (ML). Among them, the CesA5 transcript (NM_001302719.1; Figure 9C) was expressed 2.52 times higher in xylem than it was in the young leaves (YL), and CesA8 (Figure 9F) was weakly expressed in all of the tissues analyzed. These observations indicate that all of these candidate CesA genes were abundant in the woody tissue-xylem (XY) of E. grandis, although they were expressed at considerably lower levels in the phloem (PH) and Eg-1.
In contrast to the transcripts of CesA, five transcripts of Csl were expressed at higher levels in two woody tissues (xylem and root) and two herbaceous tissues (mature and young leaves), although they were expressed at fairly low levels in Eg-1, Eg-2, Eg-3, and phloem. Among all the parts, the highest expression levels of the transcripts of CslD2 (XM_010056952.2; Figure 9G) and CslD3 (XM_010036644.2; Figure 9H) were recorded in the xylem. The transcripts of CslE1 (XM_010059480.2; Figure 9I) and CslE6 (XM_010042369.2; Figure 9J) had the highest expression levels in mature leaves, followed by young leaves. The transcript of CslG2 (XM_010070846.2; Figure 9K) had the highest expression level in the root.
In all three different parts of E. grandis, the levels of gene expression (except for the CesA7 transcript; XM_010048758.2) were extremely low. In two herbaceous tissues (mature and young leaves), the expression levels of the transcripts of Csl were generally higher than those of the transcripts of CesA. Similarly, the transcripts of Csl had higher expression levels in the root than the transcripts of CesA.
4. Discussion
Approximately 80% of woody biomass consists primarily of cellulose and hemicellulose, followed by lignin, which accounts for the remaining 20% [21,40]. Eucalyptus is the world’s most widely planted hardwood tree. Its strong diversity, adaptability, and growth have made Eucalyptus a global renewable resource of fiber and energy [21]. Wood chemical compositions (α-cellulose, holocellulose, hemicellulose, and lignin), contents, and other important traits for these trees make them usable as crop species for lumber or biofuels feedstocks [41]. The variations in wood properties likely depend on variations in the genes that are involved in xylogenesis [42,43], thus making these traits amenable to the candidate gene approach. Few functional studies on forest trees have identified the genes directly affecting wood quality [44], largely due to their long generation intervals, large size, and lack of mutant libraries for reverse genetics [45,46]. The CSs in plants are a superfamily belonging to type-2 glycosyltransferases [33]. Through cellulose and hemicellulose synthesis, plant CSs participate in the biogenesis of the cell wall [15,47,48].
E. grandis is rich in cellulose and hemicellulose, which are good raw materials for paper production. The content of cellulose is the highest in the middle of the trunk (11.5 m, Eg-2), and it is significantly different from Eg-1 and Eg-3. The differentially expressed genes involved in cellulose synthesis at three different height levels were analyzed using high-throughput transcriptome sequencing. The synthesis of cellulose and hemicellulose is a highly complex biological process involving multiple enzymes, including CesA, Csl, etc. In this study, there were a total of 2066 differentially expressed genes at three different height levels, with the largest number (1851) located between Eg-1 and Eg-3.
Based on the comparison of the expression patterns, only a small number of DEGs (166) were identified between Eg-2 and Eg-3, indicating their close relationship. The DEGs in Eg-2 vs. Eg-3 were not significantly enriched in any of the subcategories of the cellular component process category. The remarkable GO terms were the DEGs between Eg-1 vs. Eg-3 and Eg-1 vs. Eg-2, related to the subcategories of the photosynthetic membrane (GO:0034357) and photosystem (GO:0009521). Correspondingly, KEGG pathway enrichment analysis showed that the DEGs between Eg-1 and Eg-3 were significantly enriched in photosynthesis-antenna proteins (ko00196) and photosynthesis (ko00195), which can explain the photosynthetic efficiency between the two different parts of E. grandis. The DEGs between Eg-1 and Eg-2 mainly participated in the metabolic and cellular processes, explaining the differences in anisotropic growth between two parts of E. grandis. Cell death is transcriptionally regulated as an integral part of an overall xylem maturation, including secondary cell wall formation [49]. Specifically, the DEGs in clusters 6 and 7 of the K-means clustering analysis were downregulated in Eg-1. The DEGs in cluster 6 were significantly enriched in terms related to cell death, indicating the secondary cell wall formation in Eg-2 and Eg-3. The FPKM value of the DEGs increased with the height of the trunk in cluster 7, and they were significantly enriched in the subcategories related to photosynthesis, showing rapid growth in Eg-3.
To deepen our understanding of Eucalyptus CS distribution, we performed a transcriptome analysis and found 100 transcripts of CS that are responsible for cellulose and hemicellulose synthesis. We then explored their roles in different parts and tissues of Eucalyptus using RNA-seq and qRT-PCR. In our study, we focused on the expression patterns and gene analysis of the CesA and Csl genes, based on the RNA-seq data of the commercially important hardwood species, E. grandis. Phenotypic differences are often caused by the differential expression of genes [28]. The range of variation in cellulose content was greater at the different height levels of E. grandis trees, and reached a significance level. The highest and lowest contents of cellulose were observed at a height level of 11.5 m (Eg-2) and the treetop (Eg-3), respectively, which shows that the genes that are involved in the cellulose biosynthesis demonstrated an upregulated expression in Eg-2 and a downregulated expression in Eg-3.
The existing gene structures could aid in identifying the conserved intervals, which, in turn, clarifies the evolution, divergence, and conservation of functions within a gene family [50]. This study revealed that most of the CSs in E. grandis had the same gene structures (QxxRW motif, DxD, TMD, and ZFD) in the same phase, strongly suggesting their conservation. There were certain differences in the lengths of transcripts of CSs, which might have resulted from chromosomal fusion and/or rearrangement, leading to the variability in intron sizes within, and between, each CS subfamily [51]. Particularly, the length of the sequence of each gene member of the Csl subgroup was significantly different, which may be caused by variable splicing events in transcriptome sequencing data. Multiple sequence alignment and the MP phylogenetic trees revealed six CS groups (CesA, CslA, CslB/H, CslD, CslE, and CslG), which further supports the results uncovered in previous studies related to other plants [15,31,45,52,53,54]. The close evolutionary relationships of the CesA and CslD were consistent with Little et al. [35], who confirmed that the CesA and CslD lineages have a closer evolutionary relationship.
The cell wall composition and cell wall-related gene expression varied widely among the different parts, tissues, and cell types of the plant [47,55,56,57]. In this study, digital expression analysis revealed that 58 transcripts of CesA and 42 transcripts of Csl were differentially expressed in multiple tissues and parts of E. grandis (Figure 9). Based on the FPKM of 100 transcripts of CSs, transcripts of CesA4, 7, and 8 (NM_001302736.1, XM_010048758.2, and NM_001302716.1, respectively) had the highest expression levels. CesA4 was confirmed to be upregulated in tissues that were rich in the rapidly dividing cells undergoing primary wall synthesis in E. grandis [23]. The transcript of CesA7 (XM_010048758.2) was abundant in Eg-3 and xylem, although it was weakly expressed in new leaves, Eg-1, roots, and phloem. In particular, the expression profile of CesA7 (XM_010048758.2) in Eg-3, xylem, mature leaves, and Eg-2 was the highest among all of the transcripts that were assayed in all of the samples. Accordingly, the changing trend of the expression pattern of XM_010048758.2 coincided with that of the cellulose content, and its expression profile was correlated with that of the cellulose biosynthesis in E. grandis.
We found that the CesA1 and CesA6 transcripts (XM_010049921.2 and XM_010065545.2) were abundant in the tissues that were enriched with the cells laying down secondary cell walls (e.g., xylem), but were weakly expressed in the tissues undergoing primary growth (e.g., young leaves). Additionally, the transcripts of CesA3 (TCONS_70307 and NM_001302739.1) were also expressed at higher levels in Eg-1. Based on the sequence similarity of 100 CSs, the transcripts of CesA1, 3, and 6 were more similar, strongly indicating that these genes are coregulated and often expressed in the tissues and parts undergoing secondary cell wall biosynthesis. The expression patterns of NM_001302736.1 (transcript of CesA4) and NM_001302719.1 (transcript of CesA5) were upregulated in the tissues that were rich in rapidly dividing cells undergoing primary wall biosynthesis (e.g., young leaves), suggesting that the genes also encode a cellulose synthase that is involved in the synthesis of the primary cell wall. These results were broadly in line with the results of Eucalyptus, which expressed two contrasting groups of apparently coregulated CesAs involved in either primary or secondary cell wall biosynthesis [23].
The expression levels of the Csl transcripts were significantly lower in three parts of E. grandis and phloem (Figure 9). However, the expression of Csl genes in the root was the highest for all of the 11 assayed transcripts. The high expression level might have been related to the high hemicellulose content in the roots (Figure 2). Conversely, transcripts of CslE (XM_010059480.2 and XM_010042369.2) were expressed higher in Eg-2 than Eg-1 and Eg-3, indicating that the two transcripts would constrain the biosynthesis of hemicellulose. CslD genes were possibly involved in cell wall biosynthesis in growing tip cells [52], the two transcripts of CslD (XM_010056952.2 and XM_010036644.2) were highly expressed in xylem and apical shoot meristem. It can be inferred that these two tree parts synthesized a β-glucan, which is possibly noncrystalline, with a single chain of cellulose.
The qRT-PCR analysis of 11 CSs further confirmed the RNA-seq results of E. grandis. CesAs were expressed at greater levels in xylem and mature leaves, with higher cellulose content in the different parts and tissues of E. grandis. Similarly, Csls were expressed at higher levels in xylem, mature and young leaves, and roots, indicating the higher hemicellulose content in all of the tissues of E. grandis.
The comparative co-expression analysis aids in understanding which members of the gene family interact [15,58]. Many genes that are co-expressed with the CesA genes involved in primary and secondary wall formation affect cellulose production [59]. The transcriptional association and coordination of each member of the CS gene family were performed, and different triplexes were formed during the biosynthesis of the primary and secondary cell walls. A high degree of promiscuity was observed for CesA–CesA interactions in our study. These results are consistent with those obtained by Hill et al. [1], who observed a high degree of promiscuity for CesA–CesA interactions and the heterogeneous composition of CSC. To explore which CesAs and Csls showed transcriptional coordination during cell wall biosynthesis in soybean, we compared the gene modules of 100 transcripts of CSs. Interestingly, it was found that the transcripts of CesA1 and CesA3 were mainly co-expressed with those of CslB, CslD, CslE, and CslG, suggesting the coordination and transcriptional association of these members. Park et al. [60] demonstrated that a chimeric CslD3 protein with the catalytic domain of CesA6 was capable of rescuing root hair growth phenotypes in CslD3 mutants, implying that CslDs also made cellulose or cellulose-like products between CslD and CesA proteins in domain swap experiments. The study carried out by Gu et al. [61] on the interactions between CslD3 and CesAs showed that CslD5 might produce a polysaccharide scaffold that could later be used for cellulose synthesis by CesAs. The sequence analysis, expression pattern, and co-expression results in the Csl and CesA proteins demonstrated that there was a dual-directional regulation mechanism between the Csl and CesA proteins in the cellulose biosynthesis.
5. Conclusions
In summary, we found 58 transcripts of CesA1-9 and 42 transcripts of CslB, CslD, CslE, CslG, and CslH expressed in E. grandis that were involved in either primary or secondary cell wall biosynthesis. A gene expression analysis of these transcripts suggested certain relationships between the expression of CSs and the contents of cellulose and hemicellulose, although different genes had different expression patterns, and they were co-expressed. Based on the analysis of sequence similarity, combined with the expression patterns, the CesA1, 3, and 6 transcripts, and the transcripts of CesA4, 7, and 8 were found to be associated with the synthesis of the secondary and primary cell walls, respectively. The analysis of homologous protein sequences showed that the similarity of sequences was associated with their functions. We also found that there were some relationships between Csl and CesA proteins. However, further research is required to understand how these proteins interact with each other in cellulose biosynthesis.
Supplementary Materials
The following are available online at https://0-www-mdpi-com.brum.beds.ac.uk/article/10.3390/f12091254/s1: Figure S1. Histogram of Gene Ontology (GO) assignments for DEGs among the three groups; Figure S2. Histogram of Kyoto Encyclopedia of Genes and Genomes (KEGG) annotation for the DEGs among the three groups; Figure S3. K-means clustering of DEGs; Figure S4. Gene structure analysis of 100 transcripts of CS in the three different parts of E. grandis; Table S1. The information of samples; Table S2. Details of the primers for the 6 CesA genes and 5 Csl genes; Table S3. RNA sequencing analysis metrics. Transcriptome analyses were performed in different parts of the E. grandis trunk using an Illumina HiSeq 4000 system; Table S4. GO enrichment analysis of all DEGs; Table S5. KEGG pathway enrichment analysis of all DEGs; Table S6. All CS genes involved in each of the 8 expression profiles; Table S7. Bioinformation about the 100 transcripts of CSs in E. grandis; Table S8. Pearson’s correlation coefficient of 100 CSs.
Author Contributions
All authors contributed to the study’s conception and design. Material preparation, data collection, and analysis were performed by G.L., Z.W., X.S. and Y.X. The first draft of the manuscript was written by G.L. and all authors commented on previous versions of the manuscript. All authors have read and agreed to the published version of the manuscript.
Funding
This study was financially supported by the Fundamental Research Funds of CAF under Grant Agreement No. CAFYBB2017ZX001-5 and CAFYBB2019MA006.
Data Availability Statement
All supplemental data have been made freely available; specific data repository information are specified within the manuscript. The data of RNA sequencing were deposited at Sequence Read Archive (SRA) (http://0-www-ncbi-nlm-nih-gov.brum.beds.ac.uk/sra; 28 October 2020) with accession number SRP288969 in National Center for Biotechnology Information (NCBI).
Conflicts of Interest
The authors declare no conflict of interest.
References
- Hill, J.; Hammudi, M.B.; Tien, M.; Liu, Y.; You, S.; Taylor-Teeples, M.; Li, W.L.; Schuetz, M.; Brady, S.M.; Douglas, C.J. The Arabidopsis Cellulose Synthase Complex: A Proposed Hexamer of CESA Trimers in an Equimolar Stoichiometry. Plant Cell 2014, 26, 4834–4842. [Google Scholar] [CrossRef] [Green Version]
- Bessueille, L.; Bulone, V. A survey of cellulose biosynthesis in higher plants. Plant Biotechnol. 2008, 25, 315–322. [Google Scholar] [CrossRef] [Green Version]
- Cheng, X.; Hao, H.Q.; Peng, L. Recent progresses on cellulose synthesis in cell wall of plants. J. Trop. Subtrop. Bot. 2011, 19, 283–290. [Google Scholar]
- Delmer, D.P. Cellulose Biosynthesis: Exciting Times for A Difficult Field of Study. Annu. Rev. Plant Biol. 1999, 50, 245–276. [Google Scholar] [CrossRef]
- Suzuki, S.; Li, L.; Sun, Y.H.; Chiang, V.L. The cellulose synthase gene superfamily and biochemical functions of xylem-specific cellulose synthase-like genes in Populus trichocarpa. Plant Physiol. 2006, 142, 1233–1245. [Google Scholar] [CrossRef] [Green Version]
- McFarlane, H.; Döring, A.; Persson, S. The Cell Biology of Cellulose Synthesis. Annu. Rev. Plant Biol. 2014, 65, 69–94. [Google Scholar] [CrossRef]
- Turner, S.; Kumar, M. Cellulose synthase complex organization and cellulose microfibril structure. Philos. Trans. R. Soc. A Math. Phys. Eng. Sci. 2017, 376, 20170048. [Google Scholar] [CrossRef] [Green Version]
- Sundari, B.K.R.; Dasgupta, M.G. Isolation of developing secondary xylem specific cellulose synthase genes and their ex-pression profiles during hormone signalling in Eucalyptus tereticornis. J. Genet. 2014, 93, 403. [Google Scholar] [CrossRef] [PubMed]
- Purushotham, P.; Cho, S.H.; Díaz-Moreno, S.M.; Kumar, M.; Nixon, B.T.; Bulone, V.; Zimmer, J. A single heterologously expressed plant cellulose synthase isoform is sufficient for cellulose microfibril formation in vitro. Proc. Natl. Acad. Sci. USA 2016, 113, 11360–11365. [Google Scholar] [CrossRef] [PubMed] [Green Version]
- Cho, S.H.; Purushotham, P.; Fang, C.; Maranas, C.; Díaz-Moreno, S.M.; Bulone, V.; Zimmer, J.; Kumar, M.; Nixon, B.T. Synthesis and Self-Assembly of Cellulose Microfibrils from Reconstituted Cellulose Synthase. Plant Physiol. 2017, 175, 146–156. [Google Scholar] [CrossRef] [PubMed] [Green Version]
- Gao, Y.; Chen, G.; Chen, X.; Xie, L. Regulation of Cellulose Biosynthesis in Plant Cell Wall. Biotechnol. Bull. 2014, 1, 1–7. [Google Scholar]
- Carroll, A.; Mansoori, N.; Li, S.; Lei, L.; Vernhettes, S.; Visser, R.G.; Somerville, C.; Gu, Y.; Trindade, L.M. Complexes with Mixed Primary and Secondary Cellulose Synthases Are Functional in Arabidopsis Plants. Plant Physiol. 2012, 160, 726–737. [Google Scholar] [CrossRef] [PubMed] [Green Version]
- Speicher, T.L.; Li, P.Z.; Wallace, I.S. Phosphoregulation of the Plant Cellulose Synthase Complex and Cellulose Synthase-Like Proteins. Plants 2018, 7, 52. [Google Scholar] [CrossRef] [PubMed] [Green Version]
- Yin, Y.; Huang, J.; Xu, Y. The cellulose synthase superfamily in fully sequenced plants and algae. BMC Plant Biol. 2009, 9, 99. [Google Scholar] [CrossRef] [Green Version]
- Nawaz, M.A.; Rehman, H.M.; Baloch, F.S.; Ijaz, B.; Ali, M.A.; Khan, I.A.; Lee, J.D.; Chung, G.; Yang, S.H. Genome and transcriptome-wide analyses of cellulose synthase gene superfamily in soybean. J. Plant Physiol. 2017, 215, 163–175. [Google Scholar] [CrossRef] [PubMed]
- Kaur, S.; Dhugga, K.S.; Beech, R.; Singh, J. Genome-wide analysis of the cellulose synthase-like (Csl) gene family in bread wheat (Triticum aestivum L.). BMC Plant Biol. 2017, 17, 193. [Google Scholar] [CrossRef] [PubMed] [Green Version]
- Marcotuli, I.; Colasuonno, P.; Blanco, A.; Gadaleta, A.; Ilaria, M.; Pasqualina, C.; Antonio, B.; Agata, G. Expression analysis of cellulose synthase-like genes in durum wheat. Sci. Rep. 2018, 8, 15675. [Google Scholar] [CrossRef]
- Popper, Z.A.; Michel, G.; Hervé, C.; Domozych, D.S.; Willats, W.G.; Tuohy, M.G.; Kloareg, B.; Stengel, D.B. Evolution and Diversity of Plant Cell Walls: From Algae to Flowering Plants. Annu. Rev. Plant Biol. 2011, 62, 567–590. [Google Scholar] [CrossRef] [Green Version]
- Ap Paiva, J.; Prat, E.; Vautrin, S.; Santos, M.D.; San-Clemente, H.; Brommonschenkel, S.; Fonseca, P.G.; Grattapaglia, D.; Song, X.; Ammiraju, J.S.; et al. Advancing Eucalyptus genomics: Identification and sequencing of lignin biosynthesis genes from deep-coverage BAC libraries. BMC Genom. 2011, 12, 137. [Google Scholar] [CrossRef] [PubMed] [Green Version]
- Carocha, V.; Soler, M.; Hefer, C.; Cassan Wang, H.; Fevereiro, P.; Myburg, A.A.; Paiva, J.A.; Grima Pettenati, J. Genome-wide analysis of the lignin toolbox of Eucalyptus grandis. New Phytol. 2015, 206, 1297–1313. [Google Scholar] [CrossRef] [PubMed] [Green Version]
- Myburg, A.A.; Grattapaglia, D.; Tuskan, G.; Hellsten, U.; Hayes, R.; Grimwood, J.; Jenkins, J.; Lindquist, E.; Tice, H.; Bauer, D.; et al. The genome of Eucalyptus grandis. Nat. Cell Biol. 2014, 510, 356–362. [Google Scholar] [CrossRef] [PubMed] [Green Version]
- Li, X.D.; Hu, B.; Qiu, Z.; Fan, C.; Yan, H.; Zeng, B. Gene cloning and expression analysis of BRI1 in Eucalyptus grandis. J. Trop. Subtrop. Bot. 2019, 27, 684–692. [Google Scholar]
- Ranik, M.; Myburg, A.A. Six new cellulose synthase genes from Eucalyptus are associated with primary and secondary cell wall biosynthesis. Tree Physiol. 2006, 26, 545. [Google Scholar] [CrossRef] [Green Version]
- Lu, S.; Li, L.; Yi, X.; Joshi, C.P.; Chiang, V.L. Differential expression of three eucalyptus secondary cell wall-related cellulose synthase genes in response to tension stress. J. Exp. Bot. 2008, 59, 681. [Google Scholar] [CrossRef] [PubMed] [Green Version]
- Livak, K.J.; Schmittgen, T.D. Analysis of relative gene expression data using real-time quantitative PCR and the 2−ΔΔCT Method. Methods 2001, 25, 402–408. [Google Scholar] [CrossRef]
- Abiven, S.; Heim, A.; Schmidt, M.W.I. Lignin content and chemical characteristics in maize and wheat vary between plant organs and growth stages: Consequences for assessing lignin dynamics in soil. Plant Soil 2011, 343, 369–378. [Google Scholar] [CrossRef] [Green Version]
- Trapnell, C.; Roberts, A.; Goff, L.; Pertea, G.; Kim, D.; Kelley, D.R.; Pimentel, H.; Salzberg, S.L.; Rinn, J.L.; Pachter, L. Differential gene and transcript expression analysis of RNA-seq experiments with TopHat and Cufflinks. Nat. Protoc. 2012, 7, 562–578. [Google Scholar] [CrossRef] [Green Version]
- Zhang, L.; Liu, B.; Zhang, J.; Hu, J. Insights of Molecular Mechanism of Xylem Development in Five Black Poplar Cultivars. Front. Plant Sci. 2020, 11, 620. [Google Scholar] [CrossRef]
- Chen, S.; Ehrhardt, D.W.; Somerville, C.R. Mutations of cellulose synthase (CesA1) phosphorylation sites modulate anisotropic cell expansion and bidirectional mobility of cellulose synthase. Proc. Natl. Acad. Sci. USA 2010, 107, 17188–17193. [Google Scholar] [CrossRef] [Green Version]
- Harpaz-Saad, S.; McFarlane, H.E.; Xu, S.; Divi, U.K.; Forward, B.; Western, T.L.; Kieber, J.J. Cellulose synthesis via the FEI2 RLK/SOS5 pathway and CELLULOSE SYNTHASE 5 is required for the structure of seed coat mucilage in Arabidopsis. Plant J. 2011, 68, 941–953. [Google Scholar] [CrossRef]
- Richmond, T.A.; Somerville, C.R. The Cellulose Synthase Superfamily. Plant Physiol. 2000, 124, 495–498. [Google Scholar] [CrossRef] [PubMed] [Green Version]
- Ermawar, R.A.; Collins, H.M.; Byrt, C.S.; Henderson, M.; O’Donovan, L.A.; Shirley, N.J.; Schwerdt, J.G.; Lahnstein, J.; Fincher, G.B.; Burton, R.A. Genetics and physiology of cell wall polysaccharides in the model C4 grass, Setaria viridis spp. BMC Plant Biol. 2015, 15, 236. [Google Scholar] [CrossRef] [Green Version]
- Chen, H.; Persson, S.; Grebe, M.; McFarlane, H.E. Cellulose synthesis during cell plate assembly. Physiol. Plant. 2018, 164, 17–26. [Google Scholar] [CrossRef]
- Tian, A.; Xu, L.; Tao, G.; Yu, H.; Su, L.; Cao, J. Cellulose synthase in higher plants. Chin. J. Cell Biol. 2017, 39, 356–363. [Google Scholar]
- Little, A.; Schwerdt, J.G.; Shirley, N.J.; Khor, S.F.; Neumann, K.; O’Donovan, L.A.; Lahnstein, J.; Collins, H.M.; Henderson, M.; Fincher, G.B.; et al. Revised phylogeny of the cellulose synthase gene superfamily: Insights into cell wall evolution. Plant Physiol. 2018, 177, 1124. [Google Scholar] [CrossRef] [Green Version]
- Zhang, L.; Liu, X.; Wang, X.; Li, J.; Chen, S. Comparative and phylogenetic analysis of crop plant cellulose synthases. J. Northwest Univ. 2018, 33, 167–173. [Google Scholar]
- Kumar, M.; Atanassov, I.; Turner, S.R. Functional Analysis of Cellulose Synthase (CESA) Protein Class Specificity. Plant Physiol. 2016, 173, 970–983. [Google Scholar] [CrossRef] [Green Version]
- Polko, J.K.; Kieber, J.J. The regulation of cellulose biosynthesis in plants. Plant Cell 2019, 31, 282–296. [Google Scholar] [CrossRef]
- Mizrachi, E.; Mansfield, S.; Myburg, A.A. Cellulose factories: Advancing bioenergy production from forest trees. New Phytol. 2011, 194, 54–62. [Google Scholar] [CrossRef] [Green Version]
- Atanassov, I.; Pittman, J.; Turner, S. Elucidating the Mechanisms of Assembly and Subunit Interaction of the Cellulose Synthase Complex of Arabidopsis Secondary Cell Walls. J. Biol. Chem. 2009, 284, 3833–3841. [Google Scholar] [CrossRef] [PubMed] [Green Version]
- Du, Q.; Xu, B.; Pan, W.; Gong, C.; Wang, Q.; Tian, J.; Li, B.; Zhang, D. Allelic Variation in a Cellulose Synthase Gene (PtoCesA4) Associated with Growth and Wood Properties in Populus tomentosa. G3 Genes Genomes Genet. 2013, 3, 2069–2084. [Google Scholar] [CrossRef] [Green Version]
- Neale, D.B.; Savolainen, O. Association genetics of complex traits in conifers. Trends Plant Sci. 2004, 9, 325–330. [Google Scholar] [CrossRef]
- Li, X.; Wu, H.X.; Dillon, S.K.; Southerton, S.G. Generation and analysis of expressed sequence tags from six developing xylem libraries in Pinus radiata D. Don. BMC Genom. 2009, 10, 41. [Google Scholar] [CrossRef] [Green Version]
- Spokevicius, A.V.; Southerton, S.G.; Macmillan, C.P.; Qiu, D.; Gan, S.; Tibbits, J.F.; Moran, G.F.; Bossinger, G. β-tubulin affects cellulose microfibril orientation in plant secondary fibre cell walls. Plant J. 2007, 51, 717–726. [Google Scholar] [CrossRef]
- Gonzalez-Martinez, S.C.; Huber, D.; Ersoz, E.; Davis, J.M.; Neale, D.B.; Gonz, S.C. Association genetics in Pinus taeda L. II. Carbon isotope discrimination. Heredity 2008, 101, 19–26. [Google Scholar] [CrossRef]
- Zhang, D.; Du, Q.; Xu, B.; Zhang, Z.; Li, B. The actin multigene family in Populus: Organization, expression and phylogenetic analysis. Mol. Genet. Genom. 2010, 284, 105–119. [Google Scholar] [CrossRef] [PubMed]
- Rai, K.M.; Thu, S.W.; Balasubramanian, V.K.; Cobos, C.J.; Disasa, T.; Mendu, V. Identification, characterization, and expression analysis of cell wall related genes in Sorghum bicolor (L.) Moench, a food, fodder, and biofuel crop. Front. Plant Sci. 2016, 7, 1287. [Google Scholar] [CrossRef] [Green Version]
- Kumar, M.; Turner, S. Plant cellulose synthesis: CESA proteins crossing kingdoms. Phytochemistry 2015, 112, 91–99. [Google Scholar] [CrossRef]
- Bollhöner, B.; Prestele, J.; Tuominen, H. Xylem cell death: Emerging understanding of regulation and function. J. Exp. Bot. 2012, 63, 1081–1094. [Google Scholar] [CrossRef] [PubMed]
- Betts, M.J.; Guigó, R.; Agarwal, P.; Russell, R.B. Exon structure conservation despite low sequence similarity: A relic of dramatic events in evolution? EMBO J. 2001, 20, 5354–5360. [Google Scholar] [CrossRef] [PubMed] [Green Version]
- Xu, G.; Guo, C.; Shan, H.; Kong, H. Divergence of duplicate genes in exon-intron structure. Proc. Natl. Acad. Sci. USA 2012, 109, 1187–1192. [Google Scholar] [CrossRef] [PubMed] [Green Version]
- Mutwil, M.; Klie, S.; Tohge, T.; Giorgi, F.; Wilkins, O.; Campbell, M.; Fernie, A.R.; Usadel, B.; Nikoloski, Z.; Persson, S. PlaNet: Combined Sequence and Expression Comparisons across Plant Networks Derived from Seven Species. Plant Cell 2011, 23, 895–910. [Google Scholar] [CrossRef] [Green Version]
- Ruprecht, C.; Mutwil, M.; Saxe, F.; Eder, M.; Nikoloski, Z.; Persson, S. Large-scale co-expression approach to dissect secondary cell wall formation across plant species. Front. Plant Sci. 2011, 2, 23. [Google Scholar] [CrossRef] [PubMed] [Green Version]
- Yuan, H.; Guo, W.; Zhao, L.; Yu, Y.; Wu, J.; Zhang, L.; Cheng, L.; Zhao, D.; Wu, G.; Guan, F. Bioinformatics and expression analysis of the cellulose synthase supergene family in flax. Sci. Agric. Sin. 2016, 49, 4656–4668. [Google Scholar]
- Dhugga, K.S. Plant Golgi cell wall synthesis: From genes to enzyme activities. Proc. Natl. Acad. Sci. USA 2005, 102, 1815–1816. [Google Scholar] [CrossRef] [Green Version]
- Hamann, T.; Osborne, E.; Youngs, H.L.; Misson, J.; Nussaume, L.; Somerville, C. Global expression analysis of CESA and CSL genes in Arabidopsis. Cellulose 2004, 11, 279–286. [Google Scholar] [CrossRef] [Green Version]
- Dhugga, K.S.; Barreiro, R.; Whitten, B.; Stecca, K.; Hazebroek, J.; Randhawa, G.S.; Dolan, M.; Kinney, A.J.; Tomes, D.; Nichols, S. Guar seed ß-mannan synthase is a member of the cellulose synthase super gene family. Science 2004, 303, 363–366. [Google Scholar] [CrossRef]
- Mutwil, M.; Ruprecht, C.; Giorgi, F.; Bringmann, M.; Usadel, B.; Persson, S. Transcriptional Wiring of Cell Wall-Related Genes in Arabidopsis. Mol. Plant 2009, 2, 1015–1024. [Google Scholar] [CrossRef] [PubMed] [Green Version]
- Endler, A.; Persson, S. Cellulose Synthases and Synthesis in Arabidopsis. Mol. Plant 2011, 4, 199–211. [Google Scholar] [CrossRef] [Green Version]
- Park, S.; Szumlanski, A.L.; Gu, F.; Guo, F.; Nielsen, E. A role for CslD3 during cell-wall synthesis in apical plasma mem-branes of tip-growing root-hair cells. Nat. Cell Biol. 2011, 13, 973–980. [Google Scholar] [CrossRef]
- Gu, F.; Bringmann, M.; Combs, J.R.; Yang, J.; Bergmann, D.C.; Nielsen, E. The Arabidopsis CSLD5 functions in cell plate formation in a cell cycle dependent manner. Plant Cell 2016, 28, 1722–1737. [Google Scholar] [CrossRef] [PubMed] [Green Version]
Figure 1.
Sample collection method. (A) Sampling diagram of trunk parts of E. grandis. Eg-1 represents immature xylem from diameter at breast height; Eg-2 represents immature xylem from 11.5 m height of trunk; Eg-3 represents immature xylem from 2 cm in diameter at treetop. (B) Sampling diagram of tissues of E. grandis. Immature xylem represents outer 1~2 mm cambium layer and the xylem represents the outer 3~5 mm deep planing, following the removal of the immature xylem layer. Phloem represents a 1~2 mm layer from the inner surface of the bark.

Figure 2.
The results of four wood quality indexes of E. grandis in different tissues and at different heights. Eg-1, immature xylem at DBH (diameter at breast height); Eg-2, immature xylem at 11.5 height of trunk; Eg-3, apical shoot meristem; SW, sapwood; HW, heartwood; RO, root; ML, mature leaves; YL, young leaves. The same letters in the figures represent no significant difference, while the different letters represent significant differences. The data were subjected to Duncan’s multiple range test. Error bars represent standard error derived from three replicates.

Figure 3.
Differentially expressed genes (DEGs) at the three different heights of E. grandis. (A) The number of upregulated and downregulated genes in pairwise comparisons between the three different heights. (B) The principal component analysis (PCA) of the expressed genes showing sample separation. Principal component 1 (PC1) and PC2 explained 56.6% and 18.2% of the total variance, respectively.

Figure 4.
The most enriched GO terms of 4 clusters which were significantly different.

Figure 5.
Heat map of expression levels (FPKM) of 100 transcripts of CS in the three different parts of E. grandis. Note: the color scale indicating the level of expression of unigenes—deeper red indicates higher expression, while greener colors represent a lower expression.
Figure 5.
Heat map of expression levels (FPKM) of 100 transcripts of CS in the three different parts of E. grandis. Note: the color scale indicating the level of expression of unigenes—deeper red indicates higher expression, while greener colors represent a lower expression.

Figure 6.
Phylogenetic tree of the transcripts of 100 CSs in the studies and 35 CSs of A. thaliana. Red labels indicate CslA cluster; orange labels indicate CslG cluster; yellow labels indicate CslB cluster; green labels indicate ClsH cluster; blue labels indicate CslE cluster; purple labels indicate CslD cluster; pink labels indicate CesA cluster.

Figure 7.
Co-expression network of the 100 transcripts of CesA and Csl genes, based on RNA-seq dataset. The CesA genes are marked in purple, and the Csl genes are marked in blue. The larger the sum of the FPKM values of the gene in all samples, the larger the circular area.
Figure 7.
Co-expression network of the 100 transcripts of CesA and Csl genes, based on RNA-seq dataset. The CesA genes are marked in purple, and the Csl genes are marked in blue. The larger the sum of the FPKM values of the gene in all samples, the larger the circular area.

Figure 8.
(A–K) Expression confirmation of the 11 genes using quantitative real-time PCR (qRT-PCR). (L) The correlation between qRT-PCR and the transcriptome data, as shown by values of log2 (relative expression ratios) in qRT-PCR (x-axis), plotted against the values of log2 (RPKM ratios) in transcriptome data (y-axis) for the 11 candidate CS genes. Red bars represent relative expression of target genes through qRT-PCR and blue bars represent FPKM values of 11 genes. Each sample was analyzed in three biological replicates.

Figure 9.
(A–K) The qRT-PCR of 6 transcripts of CesA and 5 transcripts of Csl in 8 woody and herbaceous tissues of E. grandis. Eg-1, immature xylem at DBH; Eg-2, immature xylem at 11.5 height of trunk; Eg-3, apical shoot meristem. SW, sapwood; HW, heartwood; RO, root; ML, mature leaves; YL, young leaves. Error bars ±SD from 3 biological replicates. Lowercase letters (a, b, c, d, e, and f) indicate the results of Duncan’s multiple range test (significant differences at p < 0.05).

Publisher’s Note: MDPI stays neutral with regard to jurisdictional claims in published maps and institutional affiliations. |
© 2021 by the authors. Licensee MDPI, Basel, Switzerland. This article is an open access article distributed under the terms and conditions of the Creative Commons Attribution (CC BY) license (https://creativecommons.org/licenses/by/4.0/).
Share and Cite
MDPI and ACS Style
Liu, G.; Xie, Y.; Shang, X.; Wu, Z. Expression Patterns and Gene Analysis of the Cellulose Synthase Gene Superfamily in Eucalyptus grandis. Forests 2021, 12, 1254. https://0-doi-org.brum.beds.ac.uk/10.3390/f12091254
AMA Style
Liu G, Xie Y, Shang X, Wu Z. Expression Patterns and Gene Analysis of the Cellulose Synthase Gene Superfamily in Eucalyptus grandis. Forests. 2021; 12(9):1254. https://0-doi-org.brum.beds.ac.uk/10.3390/f12091254
Chicago/Turabian StyleLiu, Guo, Yaojian Xie, Xiuhua Shang, and Zhihua Wu. 2021. "Expression Patterns and Gene Analysis of the Cellulose Synthase Gene Superfamily in Eucalyptus grandis" Forests 12, no. 9: 1254. https://0-doi-org.brum.beds.ac.uk/10.3390/f12091254
Note that from the first issue of 2016, this journal uses article numbers instead of page numbers. See further details here.