
A National Multi-Scale Assessment of Regeneration Deficit as an Indicator of Potential Risk of Forest Genetic Variation Loss


1
Department of Forestry and Environmental Resources, North Carolina State University, Durham, NC 27709, USA
2
Forestry Sciences Laboratory, USDA Forest Service, Durham, NC 27709, USA
*
Author to whom correspondence should be addressed.
Forests 2022, 13(1), 19; https://0-doi-org.brum.beds.ac.uk/10.3390/f13010019
Submission received: 17 November 2021
/
Revised: 15 December 2021
/
Accepted: 20 December 2021
/
Published: 23 December 2021
(This article belongs to the Special Issue Sustainable Forest Management Criteria and Indicators)
Abstract
:Genetic diversity is essential because it provides a basis for adaptation and resilience to environmental stress and change. The fundamental importance of genetic variation is recognized by its inclusion in the Montréal Process sustainability criteria and indicators for temperate and boreal forests. The indicator that focuses on forest species at risk of losing genetic variation, however, has been difficult to address in a systematic fashion. We combined two broad-scale datasets to inform this indicator for the United States: (1) tree species occurrence data from the national Forest Inventory and Analysis (FIA) plot network and (2) climatically and edaphically defined provisional seed zones, which are proxies for among-population adaptive variation. Specifically, we calculated the estimated proportion of small trees (seedlings and saplings) relative to all trees for each species and within seed zone sub-populations, with the assumption that insufficient regeneration could lead to the loss of genetic variation. The threshold between sustainable and unsustainable proportions of small trees reflected the expectation of age–class balance at the landscape scale. We found that 46 of 280 U.S. forest tree species (16.4%) may be at risk of losing genetic variation. California and the Southeast encompassed the most at-risk species. Additionally, 39 species were potentially at risk within at least half of the seed zones in which they occurred. Seed zones in California and the Southwest had the highest proportions of tree species that may be at risk. The results could help focus conservation and management activities to prevent the loss of adaptive genetic variation within tree species.
1. Introduction
Genetic diversity within species is essential for populations of living organisms, including forest trees, because it provides the foundation for adaptation and resilience to environmental stresses and changes [1,2,3]. Intra-specific genetic diversity is also associated with ecosystem functions that are important ecologically [4,5] and economically [6,7]. Empirical evidence suggests that there has been a significant loss of allelic diversity and heterozygosity in wild species since the industrial revolution [8]. Because trees are immobile and long-lived, they are thought to require substantially more genetic variation within their populations than other groups of plants, to enable them to adapt to continually changing environmental conditions [9,10]. As tree species face severe threats such as climate change [11,12] and insect and disease infestations [13,14,15], the loss of potential future benefit conveyed by genetic diversity could be highly detrimental [16,17]. The fundamental importance of genetic variation is reflected in criteria and indicator (C&I) systems used to track forest sustainability at the national scale. Examples include the Forests Europe sustainable forest management C&Is [18] and the Montréal Process Criteria and Indicators for the Conservation and Sustainable Management of Temperate and Boreal Forests [19].
The 12 countries that participate in the Montréal Process encompass 49% of both the world’s forests and its roundwood production, as well as 31% of the world’s human population [19]. The United States, as a participant, uses the Montréal Process C&I as a periodic forest sustainability assessment framework [20,21]. The Montréal Process incorporates three indicators of genetic variation under Criterion 1, which addresses conservation of biological diversity (Table 1), because genetic diversity “is the ultimate source of Biological Diversity at all levels and is important for the functioning of healthy forest ecosystems” [19]. The first of the genetic diversity indicators (1.3.a) aims to quantify the number and geographic distribution of forest-associated species at risk of losing genetic variation and locally adapted genotypes. It was included in the C&I framework because the erosion of genetic variation makes species less able to adapt to environmental change, increases the risk of extinction, and lowers the overall resilience of forest ecosystems [20].
This indicator has been difficult to address in a systematic fashion, due to the large number of forest-associated species (including trees) native to the United States, and given the challenges inherent in quantifying the genetic diversity of species that are distributed across wide geographic regions. Quantifying patterns of adaptive traits within tree species, for example, is expensive and time-consuming [22] so our understanding of broad-scale patterns of adaptive variation is limited to a relatively small number of commercially important tree species [23,24]. Additionally, research in this area has focused on traits of interest to production forestry that may not be relevant in a conservation context [25]. Molecular markers are increasingly cost-effective tools for rapidly quantifying genetic diversity within, and genetic differentiation among, tree populations across their distributions [26,27,28]. They are not, however, usually associated with adaptive trait variation in tree species [29], although some efforts have associated genetic variation with environmental differences [30,31]. More generally, genetic diversity of non-agricultural and non-commercial-forestry species is widely neglected in reporting for biodiversity assessment frameworks such as the international Convention on Biological Diversity [32].
Notwithstanding these challenges to monitoring genetic variation in forest tree species, countries need to meet their genetic diversity reporting commitments. To address the Montréal Process framework, the United States requires an efficient and relatively complete method to quantify the number and geographic distribution of forest-associated species at risk of losing genetic variation and locally adapted genotypes. To address this need, we here describe work that extends the current reporting efforts for indicator 1.3.a by quantifying the range-wide and regional demographic status of 280 forest tree species across the conterminous United States. Specifically, we propose comparing the proportion of stems that are small (i.e., young) for each tree species to the entire population of stems (i.e., young and old). Species populations with a proportion of small trees below a standard cross-species regeneration threshold (i.e., having a regeneration deficit) may be at risk of losing genetic variation based on the idea that sustainable forest ecosystems, across broad scales, have a balanced and stable size–structure relationship in which mortality is offset by regeneration and growth [33].
To construct this regeneration deficit indicator, we utilized tree species occurrence data from the national, standardized and spatially unbiased Forest Inventory and Analysis (FIA) plot network (ca. 138,000 plots), an inventory designed in a way that permits a systematic assessment needed to quantitatively address this indicator [20]. For each species, we divided the estimated total number of stems nationally into large and small (saplings and seedlings combined) diameter classes using a flexible approach that accounts for the stem diameter range for the species. We then compared the proportion of small trees to a threshold, below which the reproduction of the species is assumed more likely to be unsustainable.
To assess the risk of losing genetic variation within the geographic distributions of tree species, we repeated this process within climatically and edaphically defined provisional seed zones that encompass geographic areas with similar geology, climate, vegetation, soils and hydrology. Provisional seed zones are geographic areas in which plant materials can be transferred with relatively little risk of being poorly adapted to their new location [34,35]. They are determined based on environmental information independent of the genetics of individual species so that they can be used to inform the selection of planting locations for numerous species. The objective of their development is to be useful in the selection of appropriate seed origins for most planting locations, since it would be complex and challenging to develop sets of seed-transfer guidelines for all lands and all species [34]. An underlying assumption of such seed zones is that the adaptive variation of plant species that inhabits them is associated with the environmental conditions that define the zones. They have been used, therefore, as indicators of among-population adaptive variation in previous species-level conservation prioritizations of North American forest tree species [36,37]. To generate a set of comprehensive national indicators, we calculated the number and percent of native tree species nationally and within each seed zone that did not meet the regeneration deficit threshold. We also tallied the number of species which potentially had insufficient regeneration in at least half of the provisional seed zones on which they occurred (≥5 FIA plots).
The results of this assessment offer insights into which species and areas of the country may be at risk of losing genetic variation because of inadequate regeneration, meeting the objectives of Montréal Process indicator 1.3.a. It is an approach that should be broadly applicable to any area and at any scale at which an adequate sample of tree size distribution data is available.
2. Materials and Methods
2.1. Data
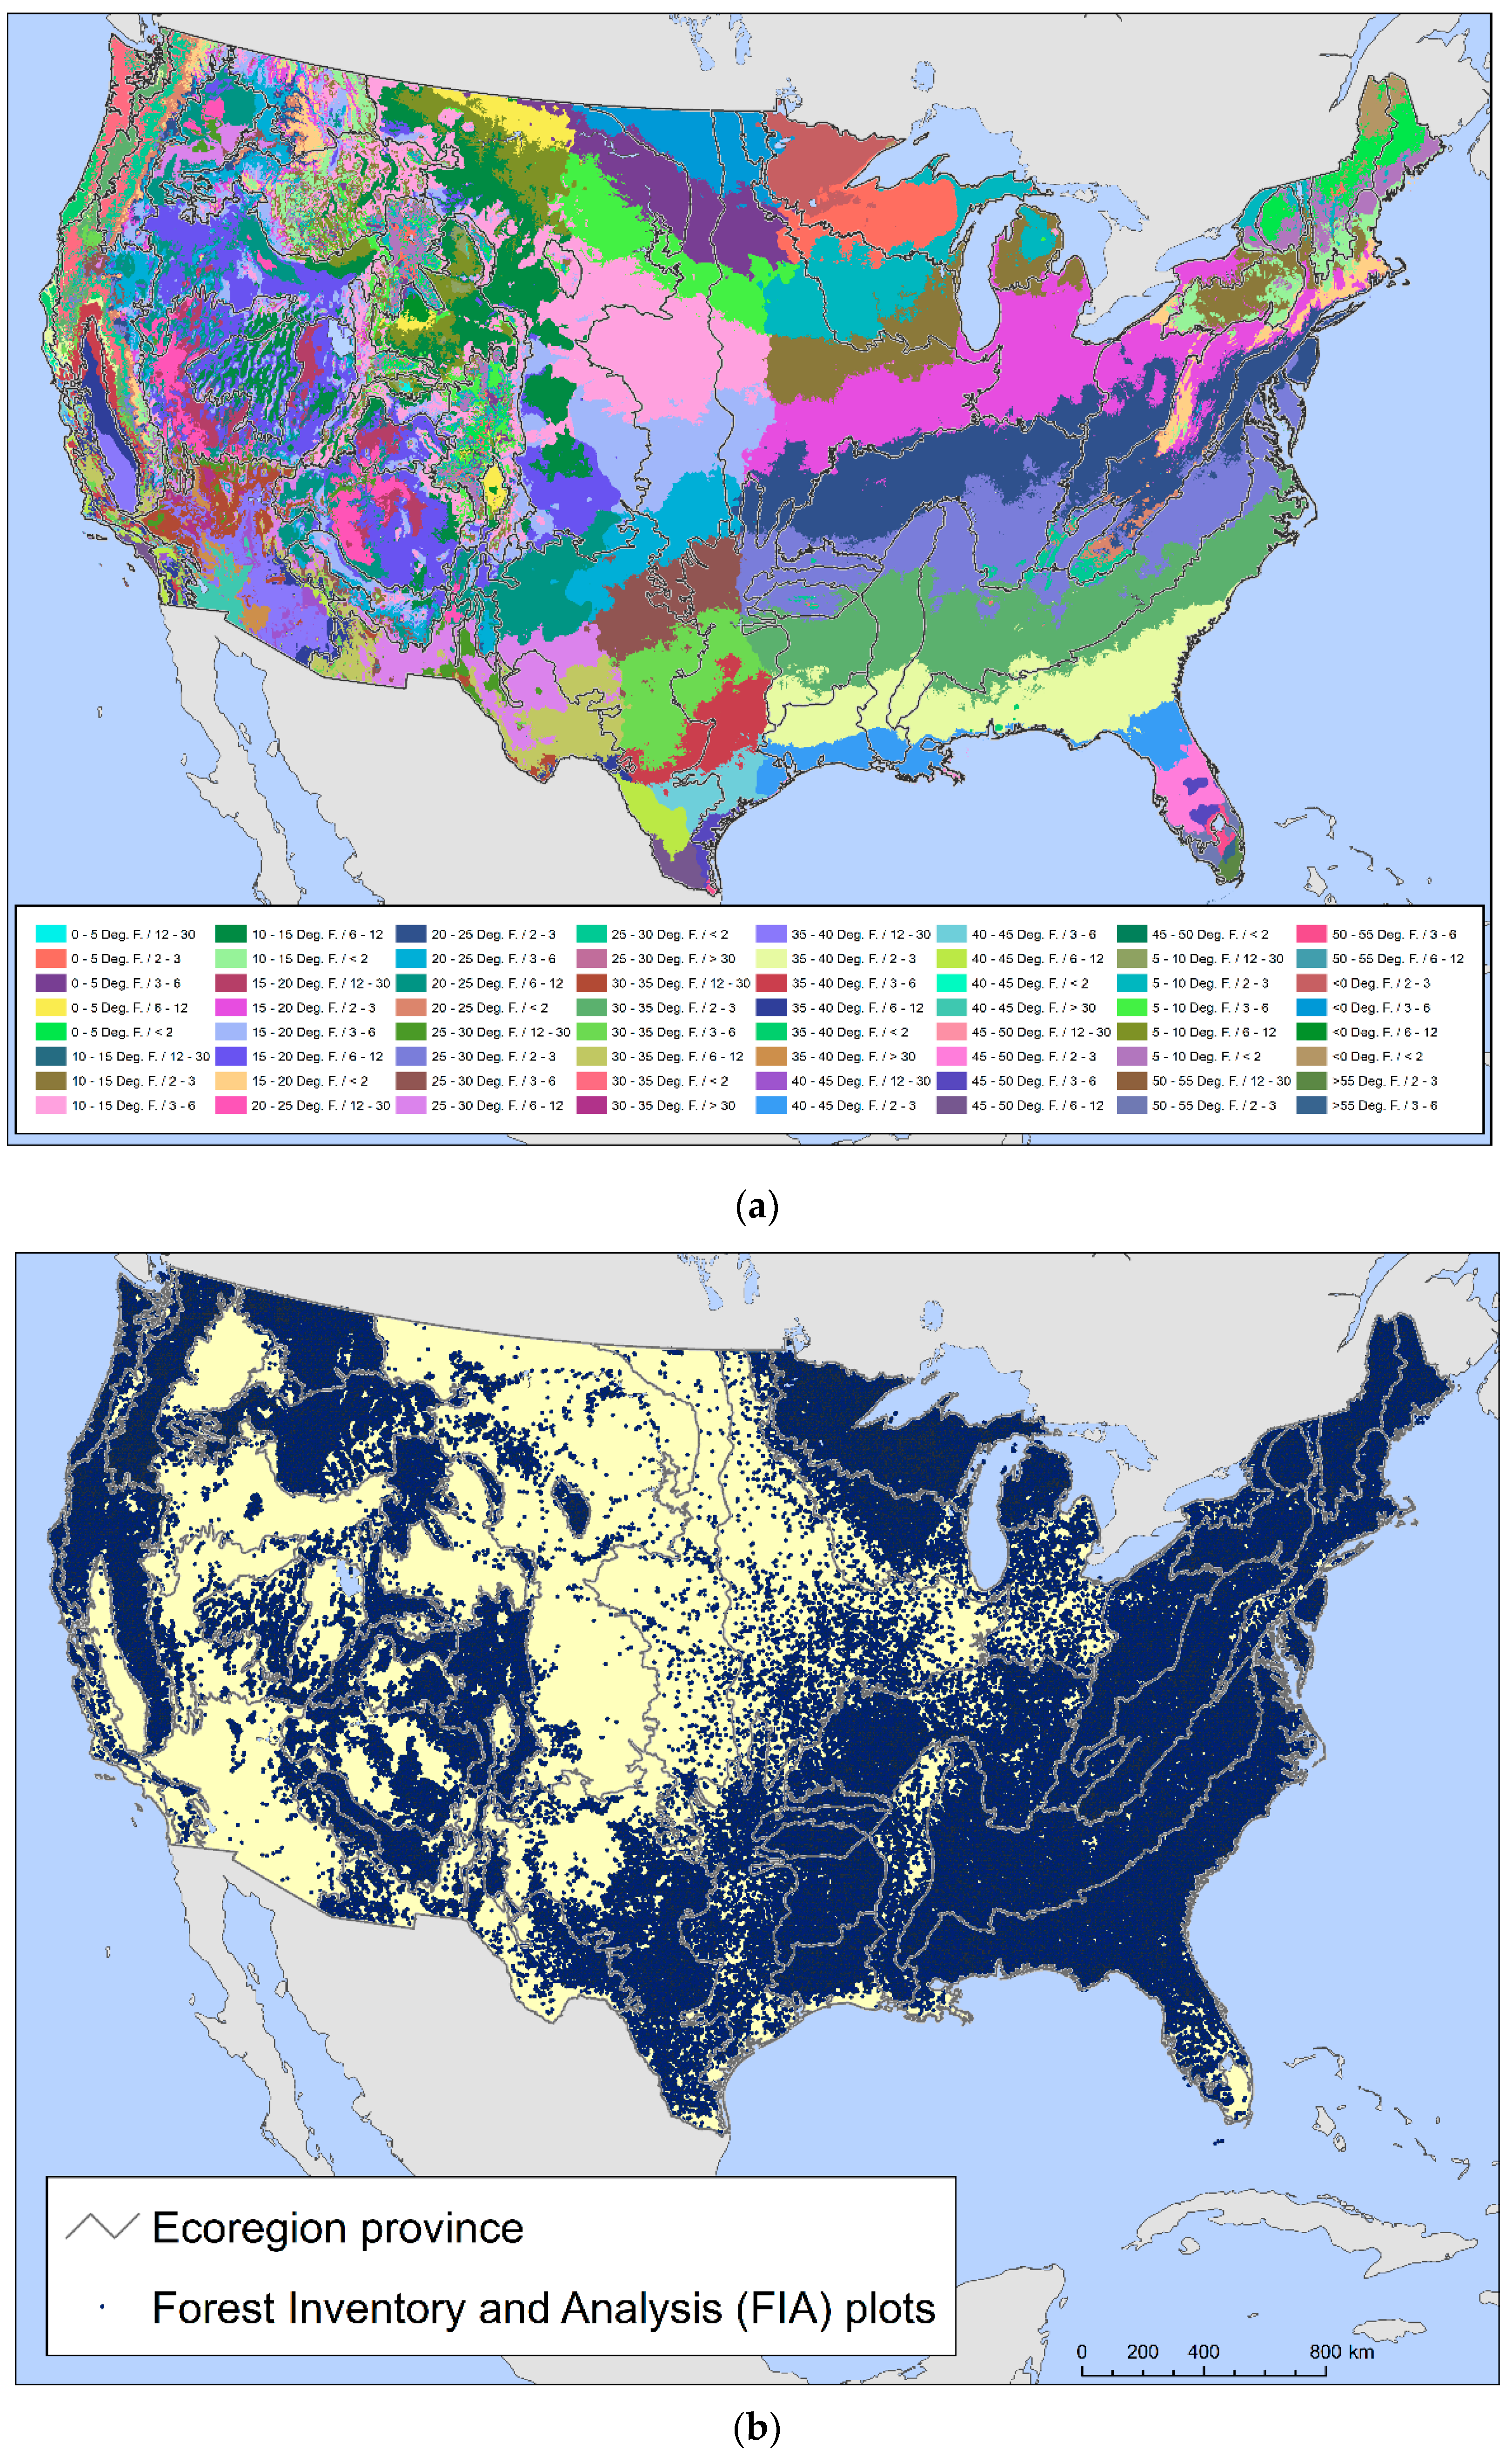
We combined two data sets to assess the number and geographic distribution of forest-associated tree species potentially at risk of losing genetic variation and locally adapted genotypes. The first of these was a set of climatically defined provisional seed transfer zones [38], which are based on two climate factors, minimum temperature (defined using bands of minimum winter temperature) and aridity (defined based on annual heat:moisture index bands (degrees C per m of precipitation)). When combined with ecoregions that account for edaphic and other environmental variability, Bower et al. [38] found that their provisional seed zones were often as good as empirically based seed zones developed for individual species in explaining variation in a suite of traits potentially related to plant fitness. For this study, we intersected their provisional seed zones with the province scale of the national ecoregion hierarchy developed by the USDA Forest Service [39] to account for edaphic factors. Provinces encompass regions similar in ecology, climate, soils, and potential natural vegetation [40,41]. This resulted in 474 provisional seed transfer zones that contained forest and were at least 100,000 ha in area (Figure 1a). The average area was 1,637,809 ha.
The second dataset encompassed plot-level tree occurrence data from the Forest Inventory and Analysis (FIA) program, which is the main source of information about the status, condition, extent and trends in U.S. forest resources across all ownerships [42]. Administered by the United States Department of Agriculture Forest Service, FIA maintains an equal-probability sample network of forest plots across the country, with a sample intensity of approximately one plot per 2428 ha [43]. We developed our indicators using data collected from 137,999 FIA plots in the conterminous 48 states visited by data-collection crews between 2004 and 2018 (Figure 1b), of which more than 90 percent had been visited at least as recently as 2010.
FIA plots cover a total of 0.067 hectares and encompass four circular 7.31 m radius subplots arranged in a triangle, with subplots at the vertices and in the middle [44]. Since approximately the year 2000, forest plots have been visited every 5 to 7 years in the East and every 10 years in the West. During their plot visits, field crews inventory the species, diameter and height of every live tree with a diameter at breast height (DBH) of ≥12.7 cm. Meanwhile, sapling-sized trees (DBH ≥ 2.54 cm and <12.7 cm) are similarly measured on a 2.07 m radius microplot offset from the center of each subplot. Finally, seedlings and woody stems with a DBH < 2.54 cm and height ≥ 30.48 cm if a hardwood, or a height of ≥15.24 cm if a conifer, are tallied by field crews within the microplots [44]. The systematic FIA sample design allows for statistical population-level estimates of the number of trees in a sampled area through “expansion factors” assigned to each plot [43,45]. Summing these estimates across all plots containing a species, nationally or within a region, results in a statistical population estimate of the total number of trees of that species by size class in the area.
2.2. Indicator Development
Our regeneration deficit indicators compare the number of small trees within a species (saplings and seedlings) to the total number of stems. The development of these indicators encompassed four steps. First, we established a method for defining large trees and small trees (seedlings and saplings) that accounted for the differences in the diameter size distribution of each of more than 300 tree species. Second, we used the FIA sample design to estimate, both nationally and within the 474 seed zones, the percent of trees within each species that are below the small-tree cutoff. Third, we compared these percentages with a 75% sustainable regeneration deficit threshold for each species nationally and within the seed zones. Finally, we calculated the number and percent of species nationally and within each seed zone that did not meet this regeneration deficit threshold.
The first step was necessary because trees have a variety of diameter size distributions, from the very narrow (including Cornus florida L. and Ebenopsis ebano (Berland.) Barneby & J.W.Grimes) to the very broad (such as Sequoia sempervirens (D. Don.) Endl. and Liriodendron tulipifera L.). As a result, FIA’s divisions between sapling and tree and between seedling and sapling (see above) are not universally applicable when comparing regeneration across tree species, especially for those with smaller diameter ranges. To be able to compare the relative regeneration success across these species, we needed a standardized method to separate small trees from large trees while accounting for size distributions within species. We did this by defining a cutoff within each species that was 20 percent of the 99.9th percentile maximum diameter estimate of all trees (including saplings and seedlings) in the United States, calculated using the expansion factors described above. For species having a 20th percentile that was greater than 12.7 cm, the cutoff was set at 12.7 cm to be consistent with FIA protocols [46]. Species having a 20th percentile that was less than 2.54 cm were dropped from the analysis because the diameters of seedlings less than this diameter are not recorded on FIA plots. The analysis was limited to tree species native to the conterminous United States.
Second, we calculated the percent of total stems below the small tree/large tree cutoff for each tree species that occurred on at least five FIA plots. We repeated this for each of the provisional seed zones in which the species was present on at least five FIA plots. Again, we used the FIA expansion factors to estimate the total number of stems within the size classes, nationally and within seed zones.
Next, we assessed whether each species, across its range and within seed zones, exceeded a threshold between sustainable and unsustainable proportions of small tree stems compared to all stems. We set this regeneration deficit threshold at 75 percent; in other words, we assume the species has a size distribution that makes it vulnerable to losing genetic variation if less than 75 percent of stems are in the smaller size class. Setting such a threshold is somewhat arbitrary but is informed by the negative exponential or rotated sigmoid diameter distributions that are expected in balanced uneven-aged forests at the stand level [47,48]. We applied the idea of stand-level balance to both uneven- and even-aged stands aggregated at the landscape or statistical population level. While even-aged stands do not exhibit the size structure of uneven stands, their diameters at the landscape scale are expected to exhibit a negative exponential distribution because the structures of multiple even-age stands are averaged [33,47,49]. The 75 percent regeneration deficit threshold may be somewhat conservative since small trees, defined for each species as outlined above, on average represent approximately 90 percent of the tree stems estimated for FIA plots (using the expansion factors associated with seedlings, saplings, and larger trees).
In our final step, we determined the number and percent of tree species across the conterminous United States, and in each provisional seed zone, that had unsustainable proportions of small trees (i.e., less than the 75 percent regeneration deficit threshold). The seed zone results were mapped using ArcGIS 10.7.1 [49].
3. Results
3.1. Forest-Associated Species Potentially at Risk of Losing Genetic Variation
The indicator assessment incorporated 280 species that were inventoried on at least five of the 137,999 FIA plots included in the analysis (Supplementary Table S1). The most common species were Acer rubrum L., present on 41,963 plots, and Prunus serotina Ehrh., found on 24,393 plots. The 99.9th percentile for diameter varied from 12.7 cm for Rhizophora mangle L., 13.0 cm for Castanea pumila Mill., and 13.5 cm for Ebenopsis ebano to 140.2 cm for Pinus balfouriana Balf., 158.2 cm for Sequoia sempervirens, and 190.5 cm for Sequoiadendron giganteum (Lindl.) J. Buchh. Ninety-two species (32 percent of the total) had large enough 99.9th percentile diameters (>63.7 cm) that their sapling-tree thresholds were set at the FIA sapling cutoff of 12.7 cm.
Across the 280 tree species, an average of 82.4 percent of stems were in the small tree size class. Forty-six species (16.4 percent) were classified as having regeneration deficits across their ranges because less than 75 percent of their stems were small trees (Table 2). Fifteen of these species occur primarily in the highly biodiverse southeastern United States (32.6 percent of the total). California, a hotspot of conifer diversity, was the location of 14 additional species (30.4 percent of the total). Four relatively rare California species had no small trees recorded on the plots on which they occurred: Pinus muricata D. Don, Platanus racemosa Nutt., Pseudotsuga macrocarpa (Vasey) Mayr, and Sequioadendron giganteum. An additional nine species with low regeneration were from the Southwest (19.6 percent), eight from Texas (17.4 percent), seven from the Northeast (15.2 percent), six from the Midwest (13.0 percent), and four from the Rocky Mountains (8.7 percent).
The most common genus among these potentially vulnerable species was Pinus, with 14 of its 36 species (38.9 percent) in the conterminous United States having less than 75 percent of stems in the small size class (Table 2). Seven of these were Western species (California, Southwest, and Rocky Mountains) while five were from the Southeast. Other commonly vulnerable genera were Quercus, with five of the 46 total oak species on the list (10.9 percent), and Juniperus, with four of its 10 species (40 percent). Additionally, two of the four Nyssa species and two of the three Platanus species were at potential risk of losing genetic variation.
3.2. Forest-Associated Species at Potential Risk of Losing Locally Adapted Genotypes
We used provisional seed zones [38] to assess regeneration trends within the distributions of forest tree species in the continental United States. Since the provisional seed zones are defined based on environmental variation, they are expected to be associated with meaningful genetic adaptive differences within species. Across the 206 tree species that occurred in at least five seed zones, 25.3 percent of the species’ seed zones were potentially at risk of genetic variation loss on average. Thirty-two species were not at potential risk in any of the seed zones in which they occurred, and 81 were at potential risk in less than 10 percent (Supplementary Table S1).
Meanwhile, 39 forest tree species were possibly at risk of genetic variation loss in at least half of the provisional seed zones in which they were inventoried (Table 3). Thirteen of these (33.3 percent) were pines and six were junipers (15.3 percent), while only three were oaks (7.7 percent). Both baldcypress species were on the list. The Southeast (16 species, 41.0 percent) and California (12 species, 30.8 percent) were the regions with the greatest representation of species at potential risk of genetic variation loss across at least half of their ranges. Texas and the Midwest each had seven (17.9 percent), and the Northeast and Southwest each had five (12.8 percent), while three were in the Rocky Mountain region (7.7 percent).
Surprisingly, a handful of the 39 species on this list cover extremely wide distributions in the conterminous United States, especially Populus deltoides W.Bartram ex Marshall, Platanus occidentalis L., and Pinus ponderosa Douglas ex C. Lawson (Table 3). Four species were at potential risk in all the seed zones in which they occurred: Juniperus californica Carr., Juniperus osteosperma (Torr.) Little, Pinus pungens Lamb., and Quercus lobata Née. These were species with relatively limited distributions, except for J. osteosperma.
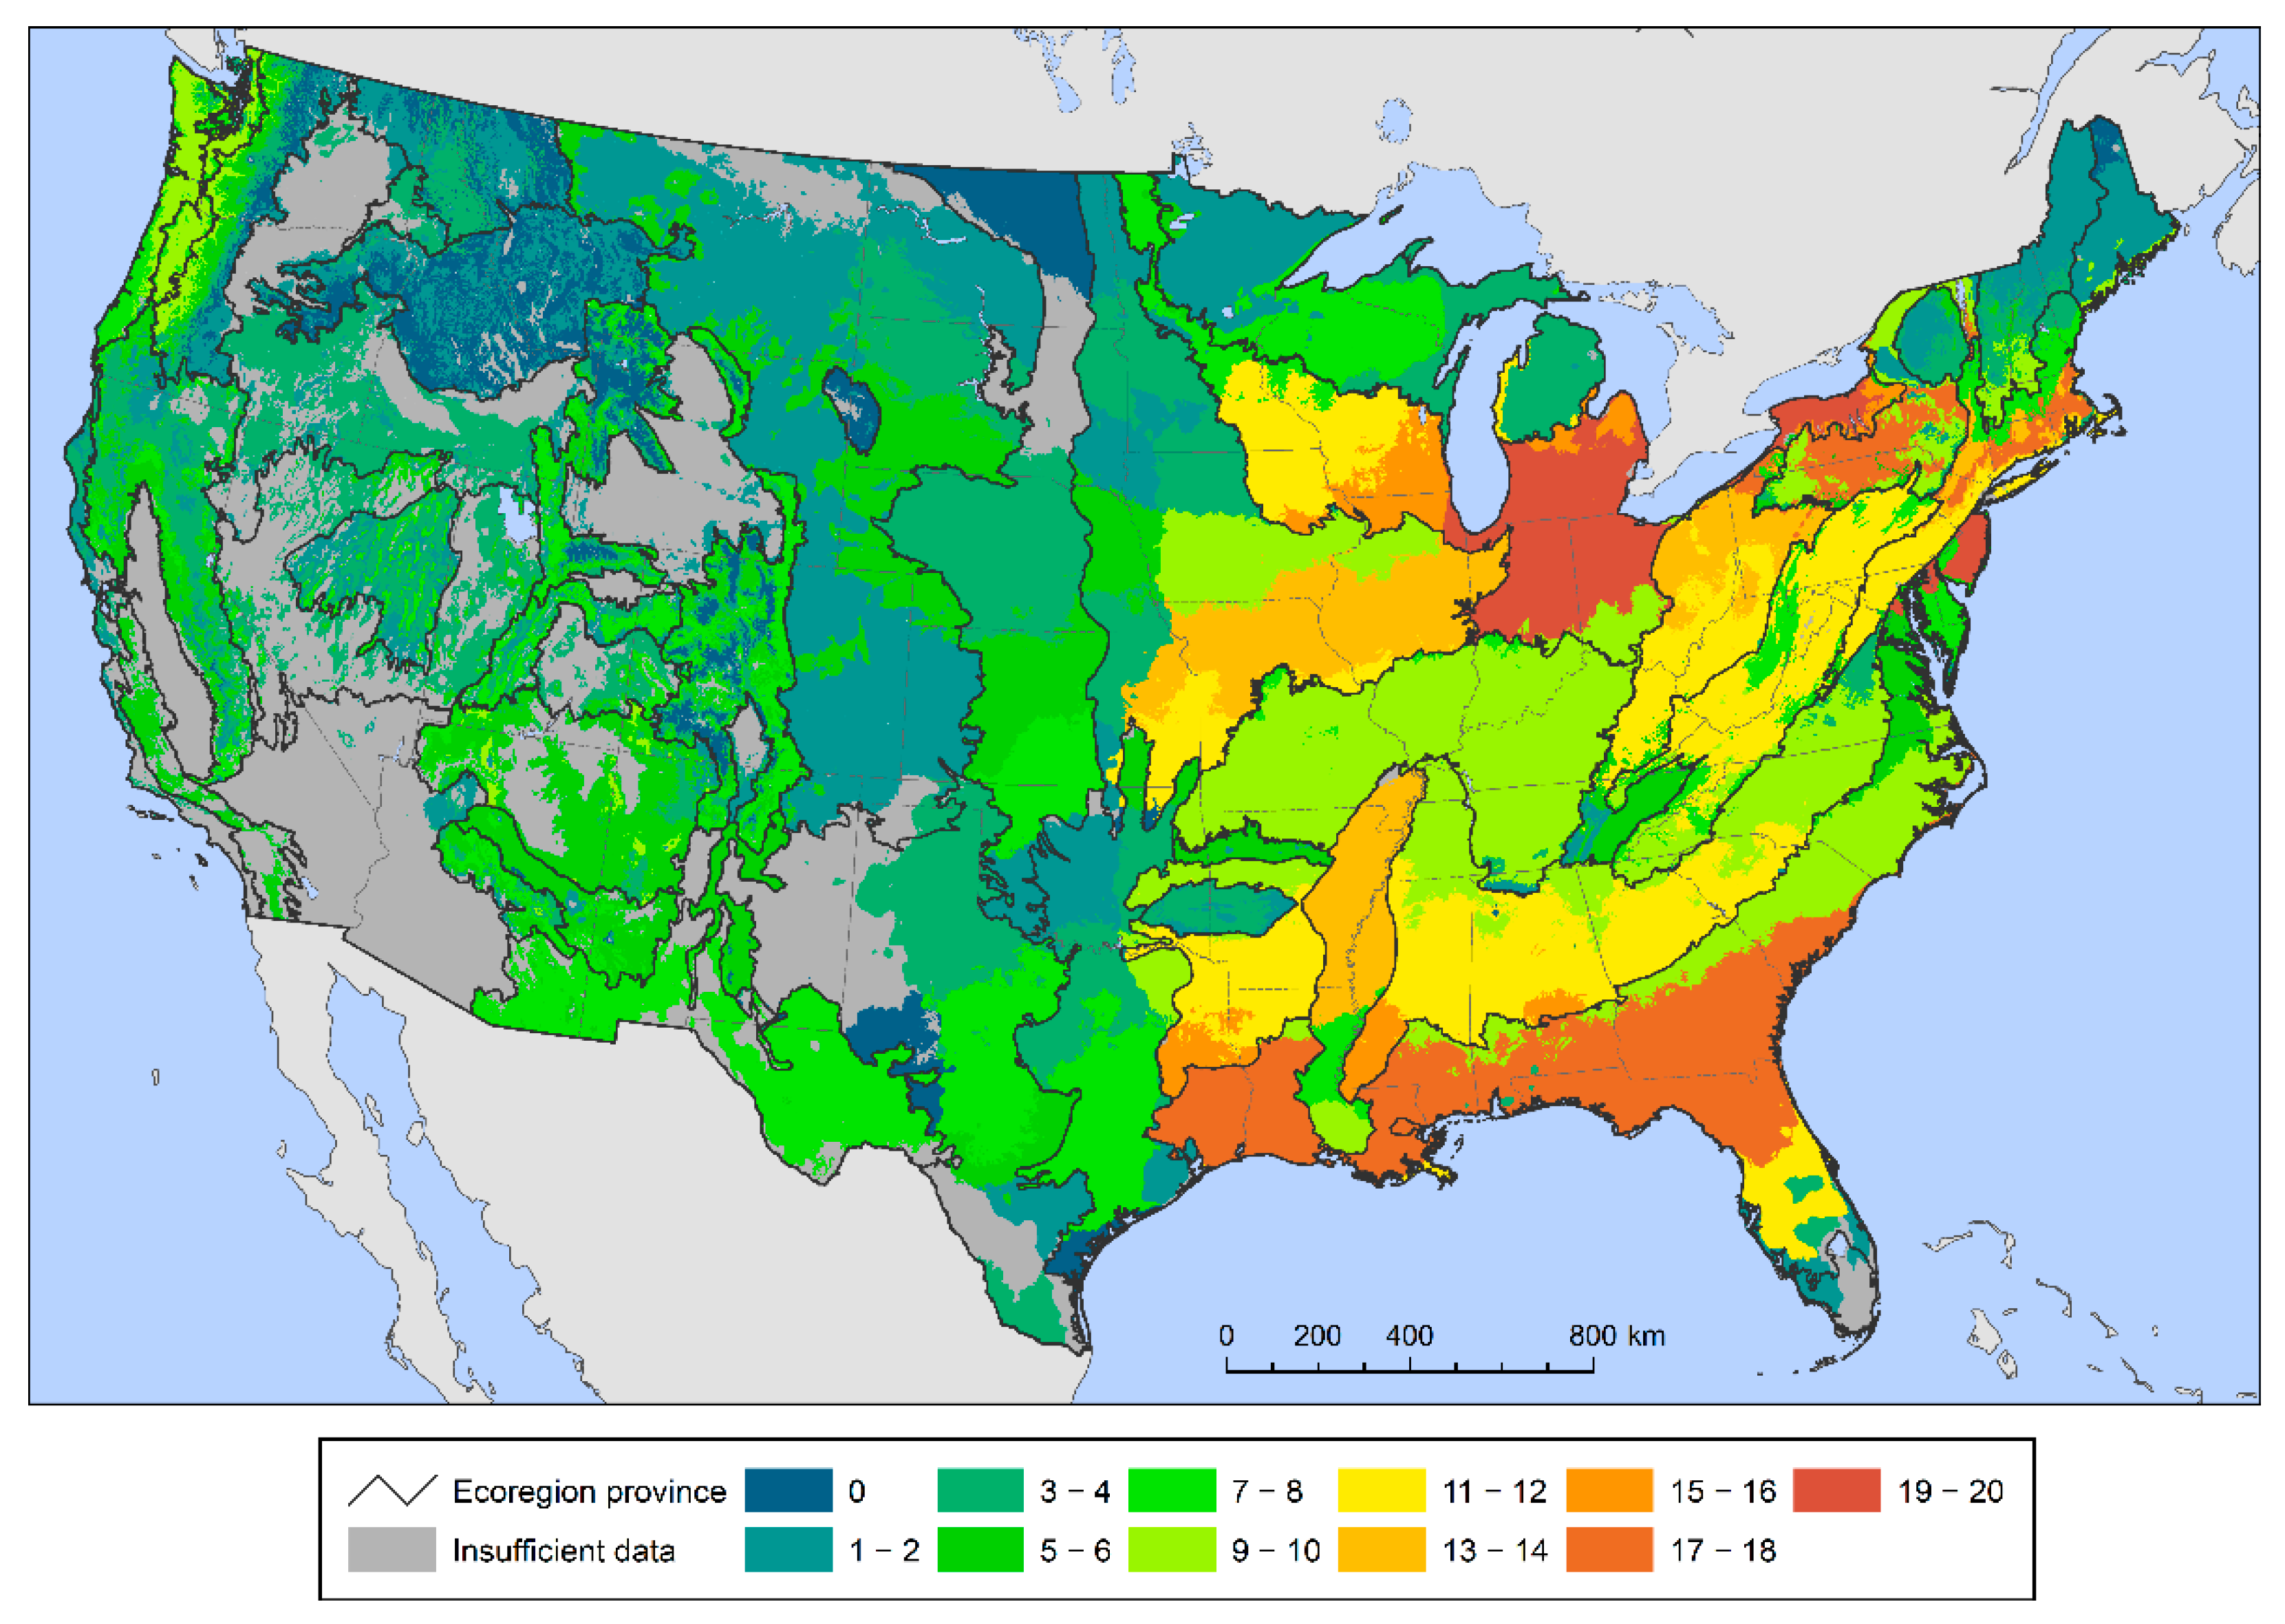
The seed zones encompassing the largest numbers of species with high regeneration deficits—that is, the most species with less than 75 percent of small stems within their boundaries—are in the eastern United States (Figure 2). This is not unexpected given the relatively high tree species richness in the region. There were particularly large numbers of potentially at-risk species (≥15) in the central Great Lakes region, in western New York and Pennsylvania, along the Mid-Atlantic Coast and New England Coast, and in the southeastern coastal plain from east Texas and Louisiana to southern South Carolina.
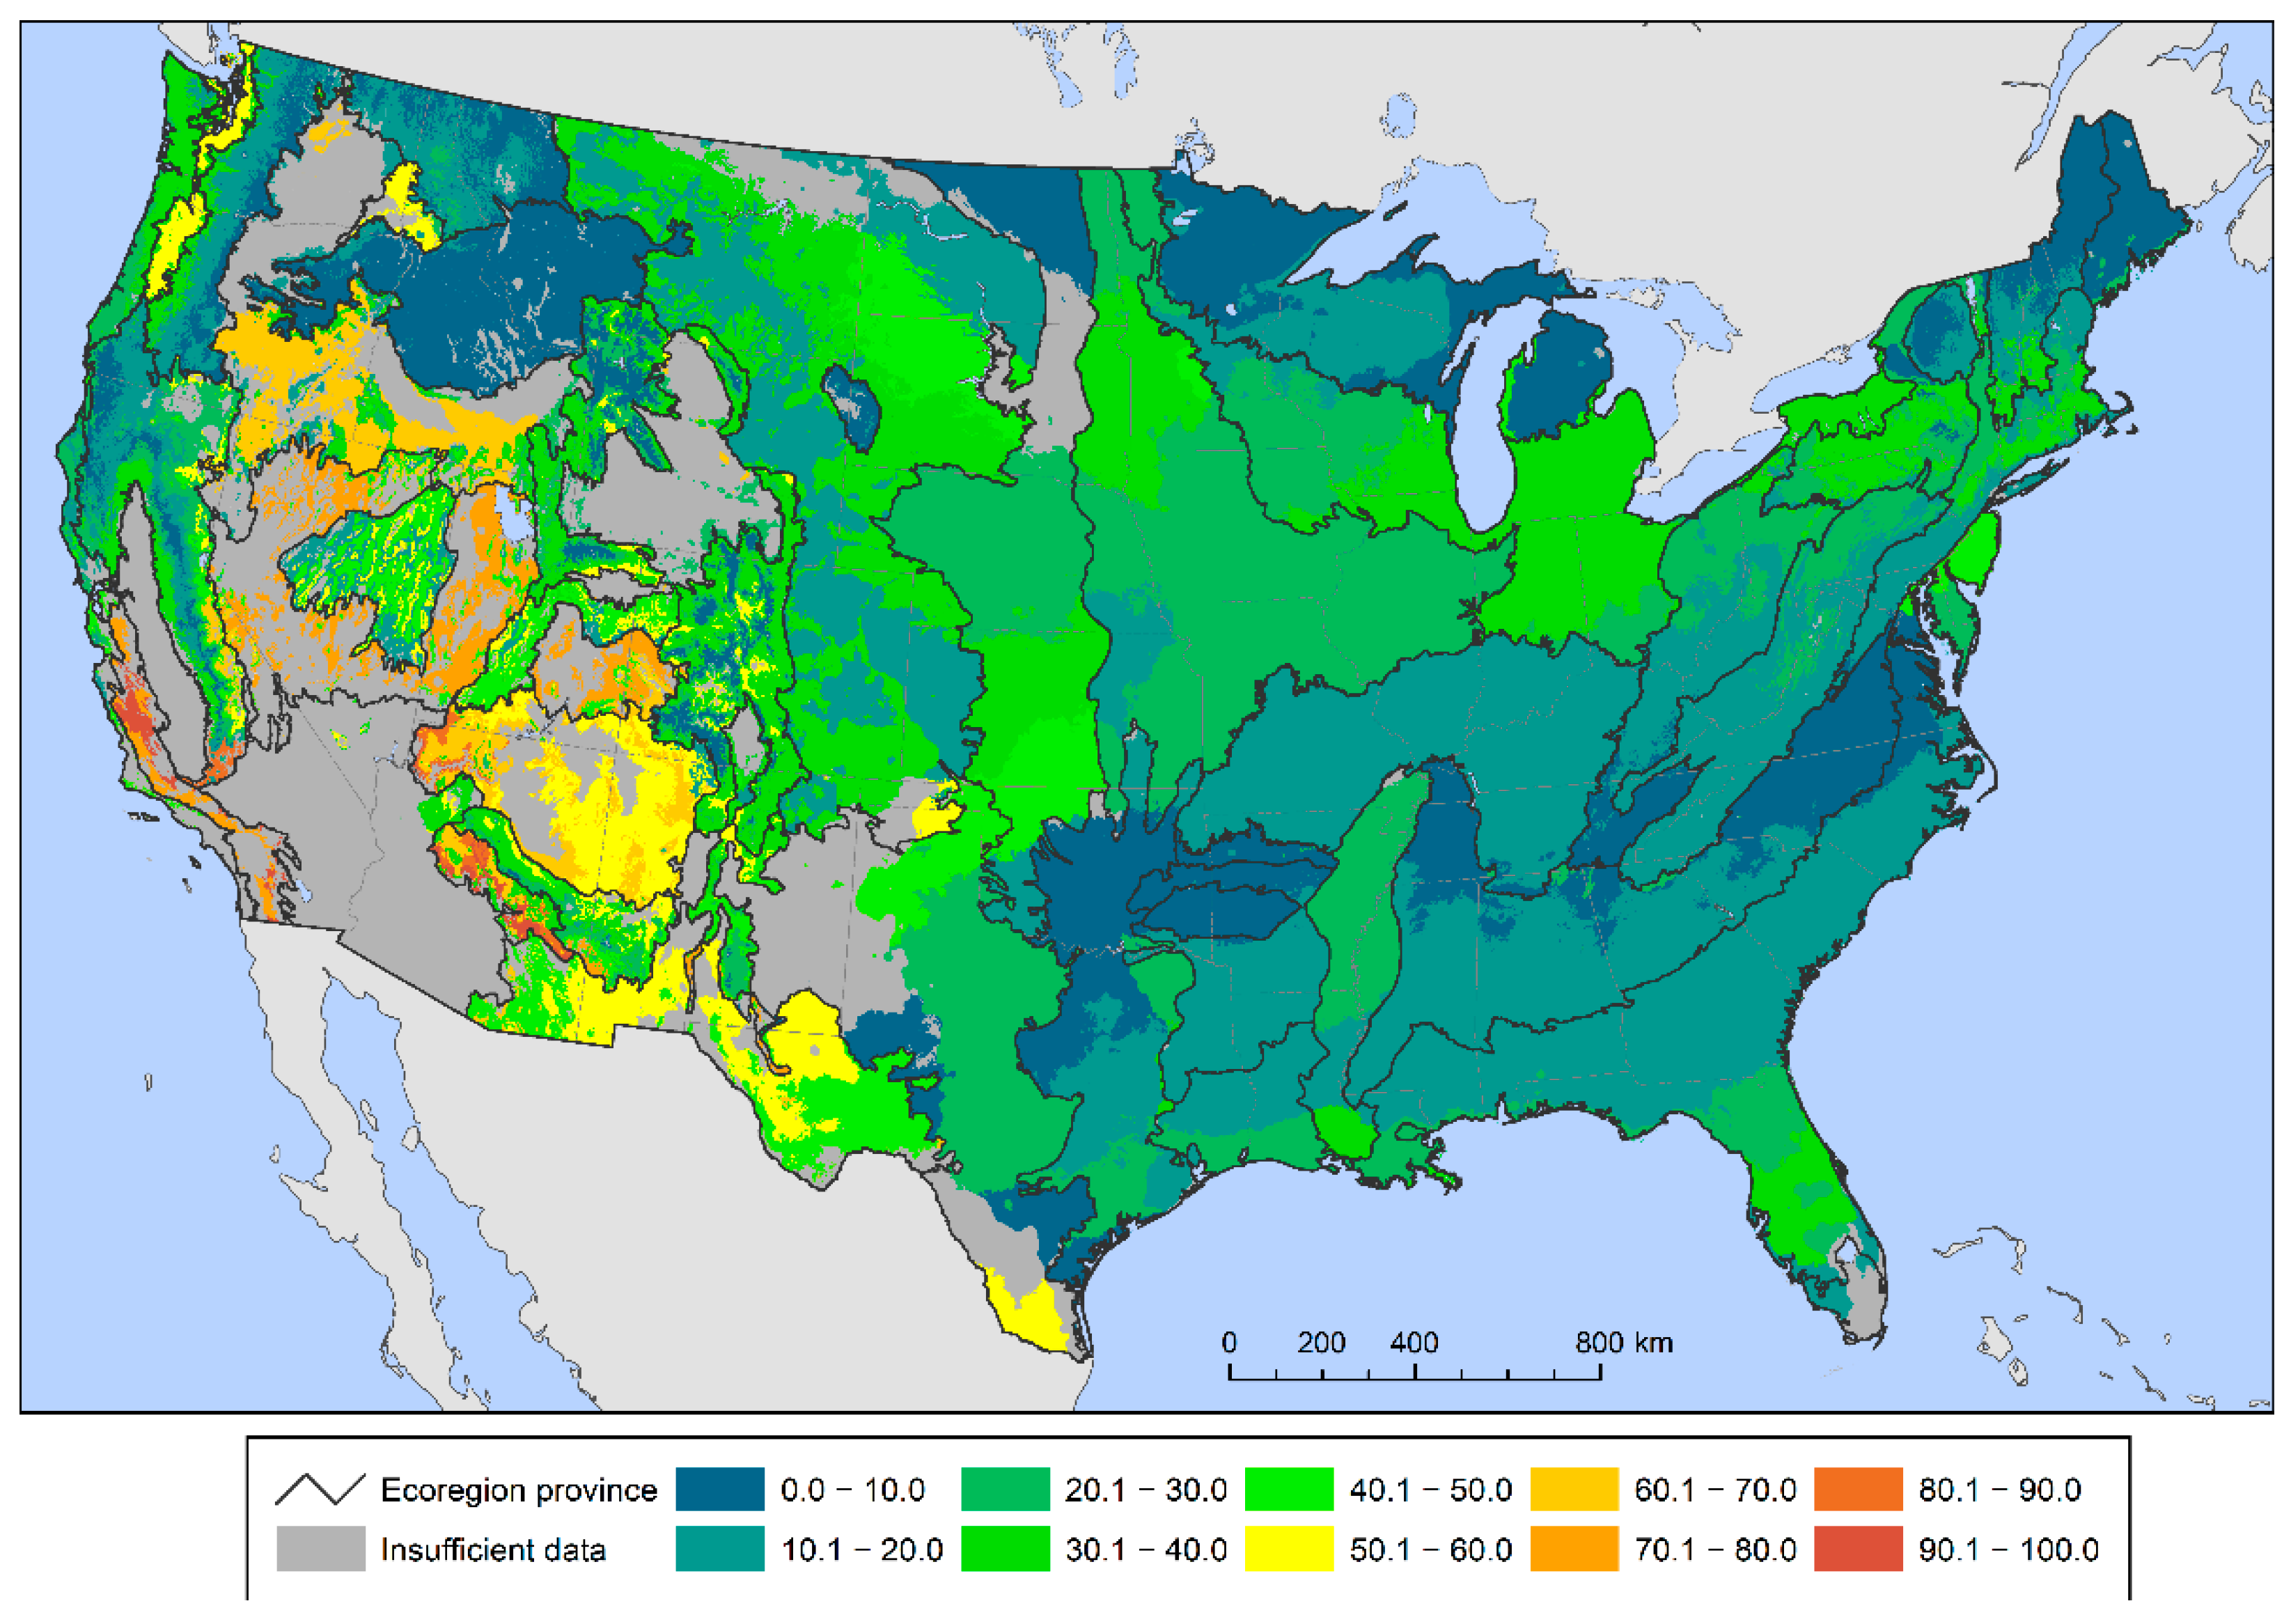
A different geographic pattern emerged when quantifying the percent of total tree species within each provisional seed zone with high regeneration deficits. Between 60 and 100 percent of tree species were possibly at risk in seed zones in parts of the West, especially California, the Southwest, the Great Basin and the Pacific Northwest (Figure 3). The percent of tree species at potential risk was particularly high (at or near 100 percent) in central and southern California and central Arizona. Meanwhile, no provisional seed zones in the East had more than 50 percent of tree species at potential risk of genetic variation loss.
4. Discussion
We combined data from a national, systematic forest inventory with provisional seed transfer zones for the conterminous United States to assess the degree to which tree species may be at risk of losing genetic variation either across their entire populations or within sub-populations characterized by similar environmental conditions. This information addresses genetic diversity indicator 1.3.a under the Montréal Process Criteria and Indicators for the Conservation and Sustainable Management of Temperate and Boreal Forests. The most recent U.S. effort to provide results for this indicator (“Number and geographic distribution of forest associated species at risk of losing genetic variation and locally adapted genotypes”) focused on the percent of species within several taxonomic groups having experienced significant historical range contractions, as well as the number of extirpated species by State [20]. This information reflects the previous version of the indicator, which called for information on the “Number of forest-dependent species that occupy a small portion of their former range” [21].
In our current effort, we developed an indicator that assesses the degree to which forest tree species across the conterminous United States may be at risk of losing genetic variation based the relative proportion of small (seedlings and saplings) trees at the statistical population level. To be as comprehensive as possible, we included 280 native forest tree species in the assessment, all of those that occurred on at least five FIA plots. The proportion of small trees was defined by the relative diameter distribution of each species, with species and their sub-populations considered to potentially be at risk of genetic variation loss when less than 75% of the stems were small trees. Approximately 16% of tree species fell below this threshold, mostly from California and the Southeast, while almost 40 percent of species were potentially at risk within at least half of provisional seed zones encompassed by their current range distributions.
We recognize several potential limitations of this approach. First, it does not involve a direct quantification of genetic variation within forest tree species, but such information is not available for more than a handful of species across their distributions. Second, we assume that a lack of smaller (i.e., younger) trees is an indication that a species (across all or part of its distribution) has inadequate regeneration and is, therefore, vulnerable to losing genetic variation. This may not always be the case, such as when a smaller proportion of seedlings and saplings is the result of a species’ adaptation strategy (e.g., extremely long lifespans and/or the requirement of catastrophic disturbance such as stand-clearing fire for successful regeneration). In general, however, it seems reasonable to expect that species with balanced and stable size–structure relationships across broad scales are more likely to be sustainable with respect to genetic variation. Third, selecting any regeneration deficit threshold is somewhat arbitrary, but we chose a relatively low threshold (75 percent or fewer of all trees being seedlings or saplings) to encompass tree species with adaptive strategies that would naturally result in relatively low levels of regeneration. We chose the 75% threshold to reflect the cyclical regeneration cycles of some species and the fact that some seedlings are difficult to identify as the correct species. This threshold may be relatively conservative given that small trees, on average, represent 90 percent of trees on FIA plots. Finally, we assume that provisional seed zones based on climate and edaphic factors are reasonable delineations of potential within-species genetic differentiation. As such, they do not account for the population history that plays an important role in shaping patterns of genetic diversity and differentiation in tree species. Their use also assumes that species are always well-adapted to their current environmental conditions, and that adaptive variation is partitioned similarly across species. At the same time, provisional seed zones are a useful tool because they can be applied across species, they reflect potential local adaptation to environmental conditions, and they are operationally manageable [38]. They are most useful when there is a lack of information about within-species population differentiation and local adaptation, which is the case with nearly all the species in our analysis.
We understand that there is no consensus about which size distribution best reflects whether a tree species exhibits a sustainable size structure, particularly at landscape scales. Instead, we are extending the concept of stand-level balance to the statistical population level, with the assumption that thresholds from individual uneven-age stands can be a guideline for populations of many stands regardless of whether they tend to be even-aged or uneven-aged. Specifically, we assume that a negative exponential or rotated sigmoid diameter distribution (i.e., many more smaller trees than larger ones) is an indication of sufficient regeneration in the context of the demographics of an entire statistical population of a tree species or of sub-populations within the species. This is based on the finding that unmanaged, uneven-aged stands tend toward one of these distributions [47,50] and that a strong relationship exists between small tree density and sustainability in a tree species [51], particularly across large scales [33,48].
More generally, the objective of forest sustainability indicators such as this is to bridge the forest management gap between science and policy by facilitating communication and discussion of scientific findings among diverse stakeholders [52]. C&I frameworks provide a common construct to present relevant variables that are easily understood and useful for guiding sustainability decision-making [53]. They focus on concise and replicable measures designed to summarize complex phenomena and encourage forest research that is relevant to policy-making [52]. They often require utilizing data that are not perfect but are good enough to address the objectives of the C&I framework. For example, advancing the proposed framework could involve testing sensitivity to assumed thresholds [46] as a first step towards improving the application of FIA data to indicators of genetic sustainability.
We found important regional patterns in the numbers and percentages of tree species potentially at risk of losing genetic variation. Most obviously, the number of at-risk species was highest in several Eastern provisional seed zones, while the percentage of at-risk species was highest in seed zones in California and the Southwest. The main implication of this pattern is that while more species may be lost from parts of the East, the loss of fewer species in some Western seed zones could result in larger impacts on the composition, structure, and function of forest ecosystems there.
This approach is broadly applicable in other countries and at any scale at which an adequate sample of tree size distribution data is available. When considering all or most species in a region, it could be particularly useful in assessing risk of genetic variation loss for C&I reporting under the Montréal Process and similar sustainability frameworks. When considering species individually, it could be helpful for prioritizing those most in need of genetic diversity monitoring, in situ conservation activities, and/or ex situ propagule collections, by accounting for insufficient regeneration, an important characteristic associated with the adaptive capacity of a species [36,37]. Within individual species, this approach could be applied to help design representative sampling designs for range-wide ex situ propagule collections for genetic diversity studies using molecular markers [54].
This indicator does not, of course, encompass all forest-associated species, including fauna and understory plant species. There are two main reasons to focus on forest trees: First, trees represent the majority of primary productivity and live biomass in a fore.st community [55], and their presence is required for an ecosystem to be defined as forest. Second, the FIA dataset provides a robust, equal-probability statistical sample of tree occurrence data that includes measurements of tree diameter [43,44], allowing for the assessment of regeneration sustainability at the regional scale. Among fauna, meanwhile, assessment of reproductive trends across space and time may be possible using the United States Geological Survey Breeding Bird Survey (BBS) data, for example, although this does not encompass the entire diversity of forest-associated animal taxa [56] and there are known biases in the BBS dataset [57,58].
It is important to note that Montréal Process indicator 1.3a is a surrogate rather than a direct measure of genetic diversity, although that is not necessarily problematic. For example, biodiversity assessment experts have argued that genetic diversity indicators for reporting frameworks should encompass (1) the number of populations with effective population sizes above versus below 500, (2) the proportion of populations maintained within species, and (3) the number of species in which genetic diversity is monitored using DNA markers [59,60]. The first two of these do not require direct genetic information. Incidentally, Montréal Process genetic diversity indicator 1.3.b (“Population levels of selected representative forest associated species to describe genetic diversity”) appears to align with the first of these proposed indicators and could potentially be addressed using FIA data within provisional seed zones. The second could be addressed by extending our current approach across multiple FIA plot measurement cycles to determine trends over time in regeneration within provisional seed zones (as surrogates for populations within species with continuous distributions). This indicator could be particularly useful to track within-species changes in response to changing climate conditions, including impacts on trailing edge populations [59]. The last of the proposed indicators is perhaps the most challenging because of the likely logistical challenges and high costs of applying DNA data (such as from microsatellite markers or single-nucleotide polymorphisms) to monitor the genetic diversity of more than a few tree species over time, even in a relatively wealthy nation such as the United States.
The overall objective of this current work was to combine provisional seed zones with a systematic national forest inventory to conduct a relatively rapid assessment of the risk of losing genetic variation across and within the distributions of almost 300 tree species. We suggest the results could be useful both for sustainability reporting and conservation decision-making, offering insights into which tree species (including several pines, oaks, and junipers) may be more at risk of genetic variation loss because of unsustainable levels of regeneration and which areas of the country (especially the Southwest and California) may have forests that are more vulnerable as a result. Future development of this Montréal Process indicator of risk of genetic variation loss could incorporate trends over time using data from FIA plot remeasurements when that information is more widely available over a sufficient time span. Coupled with other data, such information may be able to detect the effects of climate change and other threats on the regeneration dynamics of forest tree species, and thus on their risk of potential genetic variation loss, across all or parts of their ranges.
Supplementary Materials
The following is available online at https://0-www-mdpi-com.brum.beds.ac.uk/article/10.3390/f13010019/s1, Table S1: The 280 United States forest tree species included in the assessment, along with the number of Forest Inventory and Analysis (FIA) plots on which each was inventoried, the 99.9th percentile diameter, the small tree–large tree diameter cutoff (in centimeters), the estimated number of small and large stems based on the FIA sample design, the percent of all trees within the small tree size class, the number of provisional seed zones containing at least five FIA plots of the species, and the number and percent of these that may be at risk of losing genetic variation because of low levels of regeneration.
Author Contributions
K.M.P. conceived the ideas and wrote most of the manuscript. K.M.P. and K.R. developed the methodology. Both authors participated equally in review and revision. All authors have read and agreed to the published version of the manuscript.
Funding
This work was supported by in part through Joint Venture Agreement SRS 13-JV-11330110-072 and through Cost Share Agreement 21-CS-11330180-034 between the U.S. Department of Agriculture, Forest Service, Southern Research Station, and North Carolina State University.
Institutional Review Board Statement
Not applicable.
Informed Consent Statement
Not applicable.
Data Availability Statement
The data presented in this study are available on request from the corresponding author. FIA data are additionally available at https://www.fia.fs.fed.us/ (accessed on 10 November 2021).
Acknowledgments
The authors thank the efforts of the Forest Inventory and Analysis (FIA) field crew members who collected the data used in this study.
Conflicts of Interest
The authors declare no conflict of interest.
References
- Potter, K.M.; Jetton, R.M.; Bower, A.; Jacobs, D.F.; Man, G.; Hipkins, V.D.; Westwood, M. Banking on the future: Progress, challenges and opportunities for the genetic conservation of forest trees. New For. 2017, 48, 153–180. [Google Scholar] [CrossRef]
- Carroll, S.P.; Jorgensen, P.S.; Kinnison, M.T.; Bergstrom, C.T.; Denison, R.F.; Gluckman, P.; Smith, T.B.; Strauss, S.Y.; Tabashnik, B.E. Applying evolutionary biology to address global challenges. Science 2014, 346, 1245993-1–1245993-10. [Google Scholar] [CrossRef] [PubMed] [Green Version]
- Hoffmann, A.A.; Sgro, C.M.; Kristensen, T.N. Revisiting adaptive potential, population size, and conservation. Trends Ecol. Evol. 2017, 32, 506–517. [Google Scholar] [CrossRef]
- Raffard, A.; Santoul, F.; Cucherousset, J.; Blanchet, S. The community and ecosystem consequences of intraspecific diversity: A meta-analysis. Biol. Rev. 2019, 94, 648–661. [Google Scholar] [CrossRef] [PubMed]
- Hughes, A.R.; Inouye, B.D.; Johnson, M.T.J.; Underwood, N.; Vellend, M. Ecological consequences of genetic diversity. Ecol. Lett. 2008, 11, 609–623. [Google Scholar] [CrossRef] [PubMed]
- Des Roches, S.; Pendleton, L.H.; Shapiro, B.; Palkovacs, E.P. Conserving intraspecific variation for nature’s contributions to people. Nat. Ecol. Evol. 2021, 5, 574–582. [Google Scholar] [CrossRef]
- Stange, M.; Barrett, R.D.H.; Hendry, A.P. The importance of genomic variation for biodiversity, ecosystems and people. Nat. Rev. Genet. 2021, 22, 89–105. [Google Scholar] [CrossRef]
- Leigh, D.M.; Hendry, A.P.; Vazquez-Dominguez, E.; Friesen, V.L. Estimated six per cent loss of genetic variation in wild populations since the industrial revolution. Evol. Appl. 2019, 12, 1505–1512. [Google Scholar] [CrossRef] [Green Version]
- FAO. The State of the World’s Forest Genetic Resources; Commission on Genetic Resources for Food and Agriculture, Food and Agriculture Organization of the United Nations: Rome, Italy, 2014; p. 276. [Google Scholar]
- Hamrick, J.L. Response of forest trees to global environmental changes. For. Ecol. Manag. 2004, 197, 323–335. [Google Scholar] [CrossRef]
- Alfaro, R.I.; Fady, B.; Vendramin, G.G.; Dawson, I.K.; Fleming, R.A.; Saenz-Romero, C.; Lindig-Cisneros, R.A.; Murdock, T.; Vinceti, B.; Navarro, C.M.; et al. The role of forest genetic resources in responding to biotic and abiotic factors in the context of anthropogenic climate change. For. Ecol. Manag. 2014, 333, 76–87. [Google Scholar] [CrossRef]
- Zhu, K.; Woodall, C.W.; Clark, J.S. Failure to migrate: Lack of tree range expansion in response to climate change. Glob. Chang. Biol. 2012, 18, 1042–1052. [Google Scholar] [CrossRef]
- Brockerhoff, E.G.; Liebhold, A.M. Ecology of forest insect invasions. Biol. Invasions 2017, 19, 3141–3159. [Google Scholar] [CrossRef]
- Ghelardini, L.; Luchi, N.; Pecori, F.; Pepori, A.L.; Danti, R.; Della Rocca, G.; Capretti, P.; Tsopelas, P.; Santini, A. Ecology of invasive forest pathogens. Biol. Invasions 2017, 19, 3183–3200. [Google Scholar] [CrossRef]
- Potter, K.M.; Escanferla, M.E.; Jetton, R.M.; Man, G. Important insect and disease threats to United States tree species and geographic patterns of their potential impacts. Forests 2019, 10, 304. [Google Scholar] [CrossRef] [Green Version]
- Schaberg, P.G.; DeHayes, D.H.; Hawley, G.J.; Nijensohn, S.E. Anthropogenic alterations of genetic diversity within tree populations: Implications for forest ecosystem resilience. For. Ecol. Manag. 2008, 256, 855–862. [Google Scholar] [CrossRef]
- Jump, A.S.; Marchant, R.; Penuelas, J. Environmental change and the option value of genetic diversity. Trends Plant Sci. 2009, 14, 51–58. [Google Scholar] [CrossRef]
- Forest Europe. State of Europe’s Forests 2015. In Proceedings of the Ministerial Conference on the Protection of Forests in Europe, Madrid, Spain, 20–21 October 2015; p. 312. [Google Scholar]
- Montréal Process Liaison Office. The Montréal Process Criteria and Indicators for the Conservation and Sustainable Management of Temperate and Boreal Forests, 5th ed.; Available online: http://web.archive.org/web/20160211053015/http://montrealprocess.org/documents/publications/techreports/MontrealProcessSeptember2015.pdf (accessed on 10 November 2021).
- United States Department of Agriculture Forest Service. National Report on Sustainable Forests—2010; U.S. Department of Agriculture Forest Service: Washington, DC, USA, 2011; p. 134.
- United States Department of Agriculture Forest Service. National Report on Sustainable Forests—2003; U.S. Department of Agriculture Forest Service: Washington, DC, USA, 2004; p. 139.
- Graudal, L.; Aravanopoulos, F.; Bennadji, Z.; Changtragoon, S.; Fady, B.; Kjaer, E.D.; Loo, J.; Ramamonjisoa, L.; Vendramin, G.G. Global to local genetic diversity indicators of evolutionary potential in tree species within and outside forests. For. Ecol. Manag. 2014, 333, 35–51. [Google Scholar] [CrossRef]
- Rehfeldt, G.E.; Leites, L.P.; St Clair, J.B.; Jaquish, B.C.; Saenz-Romero, C.; Lopez-Upton, J.; Joyce, D.G. Comparative responses to climate in the varieties of Pinus ponderosa and Pseudotsuga menziesii: Clines in growth potential. For. Ecol. Manag. 2014, 324, 138–146. [Google Scholar] [CrossRef]
- Tripiana, V.; Bourgeois, M.; Verhaegen, D.; Vigneron, P.; Bouvet, J.M. Combining microsatellites, growth, and adaptive traits for managing in situ genetic resources of Eucalyptus urophylla. Can. J. For. Res.-Rev. Can. Rech. For. 2007, 37, 773–785. [Google Scholar] [CrossRef] [Green Version]
- Boshier, D.H.; Boyle, T.J. Forest conservation genetics: Limitations and future directions. In Forest Conservation Genetics: Principles and Practice; Young, A.G., Boshier, D., Boyle, T.J., Eds.; CSIRO Publishing: Collingwood, Australia, 2000; pp. 289–297. [Google Scholar]
- Willyard, A.; Bower, A.; Hipkins, V.; Snelling, J.; DeWoody, J. Genetic diversity and population structure in Chrysolepis chrysophylla (golden chinquapin; Fagaceae): SSRs vs SNPs. Can. J. For. Res. 2020, 50, 788–799. [Google Scholar] [CrossRef]
- Callahan, C.M.; Rowe, C.A.; Ryel, R.J.; Shaw, J.D.; Madritch, M.D.; Mock, K.E. Continental-scale assessment of genetic diversity and population structure in quaking aspen (Populus tremuloides). J. Biogeogr. 2013, 40, 1780–1791. [Google Scholar] [CrossRef] [Green Version]
- Potter, K.M.; Hipkins, V.D.; Mahalovich, M.F.; Means, R.E. Nuclear genetic variation across the range of ponderosa pine (Pinus ponderosa): Phylogeographic, taxonomic, and conservation implications. Tree Genet. Genomes 2015, 11, 38. [Google Scholar] [CrossRef] [Green Version]
- Reed, D.H.; Frankham, R. How closely correlated are molecular and quantitative measures of genetic variation? A meta-analysis. Evolution 2001, 55, 1095–1103. [Google Scholar] [CrossRef] [PubMed]
- Shinneman, D.J.; Means, R.E.; Potter, K.M.; Hipkins, V.D. Exploring climate niches of ponderosa pine (Pinus ponderosa Douglas ex Lawson) haplotypes in the western United States: Implications for evolutionary history and conservation. PLoS ONE 2016, 11, e0151811. [Google Scholar] [CrossRef] [PubMed] [Green Version]
- Prasad, A.M.; Potter, K.M. Macro-scale assessment of demographic and environmental variation within genetically derived evolutionary lineages of eastern hemlock (Tsuga canadensis), an imperiled conifer of the eastern United States. Biodivers. Conserv. 2017, 26, 2223–2249. [Google Scholar] [CrossRef]
- Hoban, S.; Campbell, C.D.; da Silva, J.M.; Ekblom, R.; Funk, W.C.; Garner, B.A.; Godoy, J.A.; Kershaw, F.; MacDonald, A.J.; Mergeay, J.; et al. Genetic diversity is considered important but interpreted narrowly in country reports to the Convention on Biological Diversity: Current actions and indicators are insufficient. Biol. Conserv. 2021, 261, 11. [Google Scholar] [CrossRef]
- Manion, P.D.; Griffin, D.H. Large landscape scale analysis of tree death in the Adirondack Park, New York. For. Sci. 2001, 47, 542–549. [Google Scholar] [CrossRef]
- Pike, C.; Potter, K.M.; Berrang, P.; Crane, B.; Baggs, J.; Leites, L.; Luther, T. New seed-collection zones for the Eastern United States: The Eastern Seed Zone Forum. J. For. 2020, 118, 444–451. [Google Scholar] [CrossRef] [Green Version]
- Miller, S.A.; Bartow, A.; Gisler, M.; Ward, K.; Young, A.S.; Kaye, T.N. Can an ecoregion serve as a seed transfer zone? Evidence from a common garden study with five native species. Restor. Ecol. 2010, 19, 268–276. [Google Scholar] [CrossRef]
- Potter, K.M.; Crane, B.S.; Hargrove, W.W. A United States national prioritization framework for tree species vulnerability to climate change. New For. 2017, 48, 275–300. [Google Scholar] [CrossRef]
- Potter, K.M.; Escanferla, M.E.; Jetton, R.M.; Man, G.; Crane, B.S. Prioritizing the conservation needs of United States tree species: Evaluating vulnerability to forest insect and disease threats. Glob. Ecol. Conserv. 2019, 18, 17. [Google Scholar] [CrossRef]
- Bower, A.D.; St Clair, B.; Erickson, V. Generalized provisional seed zones for native plants. Ecol. Appl. 2014, 24, 913–919. [Google Scholar] [CrossRef]
- Cleland, D.T.; Freeouf, J.A.; Keys, J.E.; Nowacki, G.J.; Carpenter, C.A.; McNab, W.H. Ecological Subregions: Sections and Subsections for the conterminous United States. In General Technical Report WO-76; U.S. Department of Agriculture, Forest Service: Washington, DC, USA, 2007. Available online: https://www.fs.usda.gov/treesearch/pubs/48672 (accessed on 10 November 2021).
- Bailey, R.G. Description of the ecoregions of the United States; U.S. Department of Agriculture: Washington, DC, USA, 1995. Available online: https://www.fs.fed.us/land/ecosysmgmt/ (accessed on 10 November 2021).
- Cleland, D.T.; Avers, P.E.; McNab, W.H.; Jensen, M.E.; Bailey, R.G.; King, T.; Russell, W.E. National hierarchical framework of ecological units. In Ecosystem Management: Applications for Sustainable Forest and Wildlife Resources; Boyce, M.S., Haney, A., Eds.; Yale University Press: New Haven, CT, USA, 1997; pp. 181–200. [Google Scholar]
- Smith, W.B. Forest inventory and analysis: A national inventory and monitoring program. Environ. Pollut. 2002, 116, S233–S242. [Google Scholar] [CrossRef]
- Bechtold, W.A.; Patterson, P.L. The Enhanced Forest Inventory and Analysis Program: National Sampling Design and Estimation Procedures; USDA Forest Service, Southern Research Station: Asheville, NC, USA, 2005; p. 85.
- Burrill, E.A.; Wilson, A.M.; Turner, J.A.; Pugh, S.A.; Menlove, J.; Christiansen, G.; Conkling, B.L.; David, W. The Forest Inventory and Analysis Database: Database Description and User Guide Version 8.0 for Phase 2. Available online: https://www.fia.fs.fed.us/library/database-documentation/current/ver80/FIADB%20User%20Guide%20P2_8-0.pdf (accessed on 16 November 2021).
- Pugh, S.A.; Turner, J.A.; Burrill, E.A.; David, W. The Forest Inventory and Analysis Database: Population Estimation User Guide. Available online: https://www.fia.fs.fed.us/library/database-documentation/current/ver80/FIADB%20Population%20Estimation%20user%20guide_11_2018_final_revised_02_2019.pdf (accessed on 16 November 2021).
- Hoover, C.M.; Smith, J.E. Selecting Minimum Diameter for Forest Biomass and Carbon Estimation: How Low Should You Go? United States Department of Agriculture, Forest Service, Northern Research Station: Madison, WI, USA, 2020. [CrossRef]
- Janowiak, M.K.; Nagel, L.M.; Webster, C.R. Spatial scale and stand structure in northern hardwood forests: Implications for quantifying diameter distributions. For. Sci. 2008, 54, 497–506. [Google Scholar] [CrossRef]
- Rubin, B.D.; Manion, P.D.; Faber-Langendoen, D. Diameter distributions and structural sustainability in forests. For. Ecol. Manag. 2006, 222, 427–438. [Google Scholar] [CrossRef]
- ESRI. ArcMap, 10.7.1; Environmental Systems Research Institute Inc.: Redlands, CA, USA, 2019.
- Alessandrini, A.; Biondi, F.; Di Filippo, A.; Ziaco, E.; Piovesan, G. Tree size distribution at increasing spatial scales converges to the rotated sigmoid curve in two old-growth beech stands of the Italian Apennines. For. Ecol. Manag. 2011, 262, 1950–1962. [Google Scholar] [CrossRef]
- Halpin, C.R.; Lorimer, C.G.; Hanson, J.J.; Palik, B.J. Predicted long-term effects of group selection on species composition and stand structure in northern hardwood forests. For. Ecol. Manag. 2017, 400, 677–691. [Google Scholar] [CrossRef]
- Riitters, K.; Robertson, G. The United States’ Implementation of the Montreal Process Indicator of Forest Fragmentation. Forests 2021, 12, 727. [Google Scholar] [CrossRef]
- Ostrom, E. A General Framework for Analyzing Sustainability of Social-Ecological Systems. Science 2009, 325, 419–422. [Google Scholar] [CrossRef]
- Hastings, J.M.; Potter, K.M.; Koch, F.H.; Megalos, M.; Jetton, R.M. Prioritizing conservation seed banking locations for imperiled hemlock species using multi-attribute frontier mapping. New For. 2017, 48, 301–316. [Google Scholar] [CrossRef]
- Muller, R.N. Nutrient relations of the herbaceous layer in deciduous forest ecosystems. In The Herbaceous layer in Forests of Eastern North America; Gilliam, F.S., Roberts, M.R., Eds.; Oxford University Press: New York, NY, USA, 2003; pp. 15–37. [Google Scholar]
- Anderson, S.M.; Heath, L.S.; Emery, M.R.; Hicke, J.A.; Littell, J.S.; Lucier, A.; Masek, J.G.; Peterson, D.L.; Pouyat, R.; Potter, K.M.; et al. Developing a set of indicators to identify, monitor, and track impacts and change in forests of the United States. Clim. Chang. 2021, 165, 16. [Google Scholar] [CrossRef]
- Sauer, J.R.; Peterjohn, B.G.; Link, W.A. Observer differences in the North American Breeding Bird Survey. Auk 1994, 111, 50–62. [Google Scholar] [CrossRef]
- Keller, C.M.E.; Scallan, J.T. Potential roadside biases due to habitat changes along breeding bird survey routes. Condor 1999, 101, 50–57. [Google Scholar] [CrossRef]
- Hoban, S.; Bruford, M.; Jackson, J.D.; Lopes-Fernandes, M.; Heuertz, M.; Hohenlohe, P.A.; Paz-Vinas, I.; Sjogren-Gulve, P.; Segelbacher, G.; Vernesi, C.; et al. Genetic diversity targets and indicators in the CBD post-2020 Global Biodiversity Framework must be improved. Biol. Conserv. 2020, 248, 11. [Google Scholar] [CrossRef]
- Laikre, L.; Hoban, S.; Bruford, M.W.; Segelbacher, G.; Allendorf, F.W.; Gajardo, G.; Rodriguez, A.G.; Hedrick, P.W.; Heuertz, M.; Hohenlohe, P.A.; et al. Post-2020 goals overlook genetic diversity. Science 2020, 367, 1083–1085. [Google Scholar] [CrossRef] [Green Version]
Figure 1.
The two spatial datasets used in the development of the regeneration deficit indicators: (a) provisional seed transfer zones [38] intersected with USDA Forest Service ecoregion provinces [39]; (b) tree species occurrence data from 137,999 USDA Forest Service Forest Inventory and Analysis (FIA) plots [44].

Figure 2.
The number of forest tree species below the 75% sustainable regeneration deficit threshold within each provisional seed zone.
Figure 2.
The number of forest tree species below the 75% sustainable regeneration deficit threshold within each provisional seed zone.

Figure 3.
The percent of all forest tree species within each provisional seed zone below the 75% sustainable regeneration deficit threshold.
Figure 3.
The percent of all forest tree species within each provisional seed zone below the 75% sustainable regeneration deficit threshold.


Table 1.
Criterion 1 of the Montréal Process focuses on the conservation of biological diversity, and includes nine indicators of ecosystem, species, and genetic diversity [19].
Table 1.
Criterion 1 of the Montréal Process focuses on the conservation of biological diversity, and includes nine indicators of ecosystem, species, and genetic diversity [19].
| Criterion 1: Conservation of Biological Diversity. |
|---|
| 1.1 Ecosystem diversity |
| 1.1.a Area and percent of forest by forest ecosystem type, successional stage, age class, and forest ownership or tenure |
| 1.1.b Area and percent of forest in protected areas by forest ecosystem type, and by age class or successional stage |
| 1.1.c Fragmentation of forests |
| 1.2 Species diversity |
| 1.2.a Number of native forest associated species |
| 1.2.b Number and status of native forest associated species at risk, as determined by legislation or scientific assessment |
| 1.2.c Status of on-site and off-site efforts focused on conservation of species diversity |
| 1.3 Genetic diversity |
| 1.3.a Number and geographic distribution of forest associated species at risk of losing genetic variation and locally adapted genotypes |
| 1.3.b Population levels of selected representative forest associated species to describe genetic diversity |
| 1.3.c Status of on-site and off-site efforts focused on conservation of genetic diversity |
Table 2.
The 46 United States forest tree species most at potential risk of losing genetic variation across their distributions, along with the number of Forest Inventory and Analysis (FIA) plots on which each was inventoried, the estimated number of small and large stems based on the FIA sample design, the percent of all trees within the small tree size class, and the region or regions in which the species primarily occurs (CA: California; MW: Midwest; NE: Northeast; RM: Rocky Mountains; SE: Southeast; SW: Southwest; TX: Texas).
| Estimated Stems | |||||
|---|---|---|---|---|---|
| Species | Plots | Small | Large | % Small | Region |
| Pinus muricata | 11 | . | 3,201,331 | 0.0 | CA |
| Platanus racemosa | 12 | . | 568,110 | 0.0 | CA |
| Pseudotsuga macrocarpa | 14 | . | 876,130 | 0.0 | CA |
| Sequoiadendron giganteum | 6 | . | 642,261 | 0.0 | CA |
| Quercus laceyi | 42 | 3,531,744 | 13,855,531 | 20.3 | TX |
| Pinus radiata | 7 | 805,720 | 2,256,087 | 26.3 | CA |
| Ebenopsis ebano | 7 | 3,143,280 | 7,776,171 | 28.8 | TX |
| Pinus longaeva | 33 | 4,036,177 | 8,117,168 | 33.2 | CA/RM |
| Quercus lobata | 96 | 6,738,616 | 11,186,381 | 37.6 | CA |
| Ulmus serotina | 7 | 1,323,092 | 2,164,378 | 37.9 | SE |
| Bursera simaruba | 5 | 453,118 | 714,342 | 38.8 | SE |
| Quercus engelmannii | 8 | 501,619 | 774,952 | 39.3 | CA |
| Quercus oblongifolia | 32 | 2,945,510 | 4,439,051 | 39.9 | SW |
| Pinus balfouriana | 23 | 3,667,384 | 4,781,293 | 43.4 | CA |
| Juniperus osteosperma | 5192 | 1,705,042,053 | 1,852,085,663 | 47.9 | SW |
| Juniperus californica | 93 | 20,479,125 | 18,888,399 | 52.0 | CA |
| Pinus leiophylla | 13 | 2,291,034 | 2,086,389 | 52.3 | SW |
| Pinus resinosa | 2358 | 651,585,247 | 592,268,113 | 52.4 | NE/MW |
| Juniperus monosperma | 2381 | 915,076,545 | 784,121,991 | 53.9 | SW |
| Nyssa aquatica | 543 | 274,436,885 | 212,879,335 | 56.3 | SE |
| Morus microphylla | 5 | 909,545 | 680,855 | 57.2 | TX/SW |
| Quercus douglasii | 473 | 229,864,057 | 154,538,031 | 59.8 | CA |
| Pinus pungens | 196 | 33,893,343 | 21,511,606 | 61.2 | SE |
| Pinus rigida | 917 | 333,647,542 | 188,912,475 | 63.8 | NE/SE |
| Pinus jeffreyi | 785 | 303,719,657 | 162,367,673 | 65.2 | CA |
| Platanus wrightii | 5 | 846,542 | 432,163 | 66.2 | SW |
| Condalia hookeri | 278 | 154,649,389 | 75,831,092 | 67.1 | TX |
| Pinus elliottii | 3376 | 3,803,976,324 | 1,784,082,874 | 68.1 | SE |
| Nyssa ogeche | 55 | 19,908,868 | 9,206,676 | 68.4 | SE |
| Juniperus deppeana | 1181 | 478,038,092 | 218,766,045 | 68.6 | SW |
| Carya ovalis | 68 | 8,514,642 | 3,815,860 | 69.1 | NE/SE/MW |
| Tilia americana heterophylla | 37 | 7,200,971 | 3,074,222 | 70.1 | SE/MW/NE |
| Alnus rubra | 1991 | 956,957,735 | 393,555,656 | 70.9 | NW/CA |
| Salix bebbiana | 51 | 31,448,863 | 12,327,732 | 71.8 | RM/MW/NE |
| Betula populifolia | 751 | 989,927,141 | 379,812,097 | 72.3 | NE |
| Halesia diptera | 25 | 21,505,462 | 8,121,802 | 72.6 | SE |
| Pinus serotina | 386 | 204,557,934 | 75,901,847 | 72.9 | SE |
| Maclura pomifera | 1283 | 500,698,545 | 185,376,403 | 73.0 | TX/SE/MW |
| Pinus palustris | 2019 | 1,343,159,776 | 495,078,052 | 73.1 | SE |
| Pinus remota | 32 | 31,546,173 | 11,605,019 | 73.1 | TX |
| Taxodium distichum | 1227 | 698,154,187 | 247,087,517 | 73.9 | SE/TX |
| Malus coronaria | 55 | 48,212,777 | 16,987,961 | 73.9 | MW/NE/SE |
| Pinus aristata | 140 | 80,046,751 | 27,964,956 | 74.1 | RM |
| Prosopis velutina | 362 | 243,842,284 | 84,664,761 | 74.2 | SW |
| Cercocarpus ledifolius | 912 | 752,320,781 | 260,407,121 | 74.3 | RM/NW/CA |
| Populus fremontii | 40 | 19,766,406 | 6,832,552 | 74.3 | CA/SW/TX |
Table 3.
The 39 United States forest tree species at potential risk of genetic variation loss in at least half of the provisional seed zones in which each occurs (≥5 FIA plots), along with the total number of seed zones in which each occurs, the number and percent of these at potential risk, and the region or regions in which the species primarily occurs (CA: California; MW: Midwest; NE: Northeast; RM: Rocky Mountains; SE: Southeast; SW: Southwest; TX: Texas).
| Seed Zones | |||||
|---|---|---|---|---|---|
| Species | Plots | n | at Risk | % at Risk | Region |
| Juniperus californica | 93 | 6 | 6 | 100.0 | CA |
| Juniperus osteosperma | 5192 | 56 | 56 | 100.0 | SW |
| Pinus pungens | 196 | 5 | 5 | 100.0 | SE |
| Quercus lobata | 96 | 5 | 5 | 100.0 | CA |
| Pinus resinosa | 2358 | 30 | 28 | 93.3 | NE/MW |
| Juniperus monosperma | 2381 | 40 | 37 | 92.5 | SW |
| Quercus douglasii | 473 | 13 | 12 | 92.3 | CA |
| Nyssa aquatica | 543 | 10 | 9 | 90.0 | SE |
| Condalia hookeri | 278 | 7 | 6 | 85.7 | TX |
| Juniperus deppeana | 1181 | 19 | 16 | 84.2 | SW |
| Pinus jeffreyi | 785 | 21 | 17 | 81.0 | CA |
| Prosopis velutina | 362 | 12 | 9 | 75.0 | SW |
| Taxodium distichum | 1227 | 15 | 11 | 73.3 | SE/TX |
| Pinus elliottii | 3376 | 11 | 8 | 72.7 | SE |
| Pinus aristata | 140 | 7 | 5 | 71.4 | RM |
| Pinus palustris | 2019 | 10 | 7 | 70.0 | SE |
| Pinus echinata | 5143 | 31 | 21 | 67.7 | SE |
| Populus deltoides | 994 | 40 | 27 | 67.5 | MW/NE/SE/TX |
| Alnus rubra | 1991 | 21 | 14 | 66.7 | CA/NW |
| Pinus banksiana | 1339 | 9 | 6 | 66.7 | MW/NE |
| Pinus cembroides | 71 | 6 | 4 | 66.7 | TX |
| Betula populifolia | 751 | 20 | 13 | 65.0 | NE |
| Pinus rigida | 917 | 17 | 11 | 64.7 | NE/SE |
| Juniperus coahuilensis | 358 | 14 | 9 | 64.3 | SW/TX |
| Carya laciniosa | 267 | 8 | 5 | 62.5 | MW/SE |
| Maclura pomifera | 1283 | 26 | 16 | 61.5 | TX/SE/MW |
| Alnus rhombifolia | 100 | 7 | 4 | 57.1 | CA/NW |
| Pinus sabiniana | 293 | 14 | 8 | 57.1 | CA |
| Juniperus occidentalis | 1579 | 29 | 16 | 55.2 | CA/NW |
| Planera aquatica | 272 | 11 | 6 | 54.5 | SE |
| Platanus occidentalis | 2630 | 34 | 18 | 52.9 | MW/NE/SE/TX |
| Quercus agrifolia | 287 | 17 | 9 | 52.9 | CA |
| Cercocarpus ledifolius | 912 | 29 | 15 | 51.7 | RM/NW/CA |
| Pinus ponderosa | 11,350 | 115 | 59 | 51.3 | CA/NW/SW/RM |
| Fraxinus caroliniana | 121 | 6 | 3 | 50.0 | SE |
| Magnolia macrophylla | 251 | 10 | 5 | 50.0 | SE |
| Pinus taeda | 18,674 | 38 | 19 | 50.0 | SE |
| Sequoia sempervirens | 304 | 8 | 4 | 50.0 | CA |
| Taxodium ascendens | 863 | 8 | 4 | 50.0 | SE |
Publisher’s Note: MDPI stays neutral with regard to jurisdictional claims in published maps and institutional affiliations. |
© 2021 by the authors. Licensee MDPI, Basel, Switzerland. This article is an open access article distributed under the terms and conditions of the Creative Commons Attribution (CC BY) license (https://creativecommons.org/licenses/by/4.0/).
Share and Cite
MDPI and ACS Style
Potter, K.M.; Riitters, K. A National Multi-Scale Assessment of Regeneration Deficit as an Indicator of Potential Risk of Forest Genetic Variation Loss. Forests 2022, 13, 19. https://0-doi-org.brum.beds.ac.uk/10.3390/f13010019
AMA Style
Potter KM, Riitters K. A National Multi-Scale Assessment of Regeneration Deficit as an Indicator of Potential Risk of Forest Genetic Variation Loss. Forests. 2022; 13(1):19. https://0-doi-org.brum.beds.ac.uk/10.3390/f13010019
Chicago/Turabian StylePotter, Kevin M., and Kurt Riitters. 2022. "A National Multi-Scale Assessment of Regeneration Deficit as an Indicator of Potential Risk of Forest Genetic Variation Loss" Forests 13, no. 1: 19. https://0-doi-org.brum.beds.ac.uk/10.3390/f13010019
Note that from the first issue of 2016, this journal uses article numbers instead of page numbers. See further details here.