Article

Spectral Pre-Processing and Multivariate Calibration Methods for the Prediction of Wood Density in Chinese White Poplar by Visible and Near Infrared Spectroscopy

1
College of Energy and Transportation Engineering, Inner Mongolia Agricultural University, Hohhot 010018, China
2
College of Engineering and Technology, Northeast Forestry University, Harbin 150040, China
3
Forest Products Development Center, School of Forestry and Wildlife Sciences, Auburn University, Auburn, AL 36849, USA
*
Author to whom correspondence should be addressed.
These authors contributed equally to this work.
Submission received: 14 November 2021 / Revised: 25 December 2021 / Accepted: 31 December 2021 / Published: 4 January 2022
(This article belongs to the Section Wood Science and Forest Products)

Abstract

:
Wood density is a key indicator for tree functionality and end utilization. Appropriate chemometric methods play an important role in the successful prediction of wood density by visible and near infrared (Vis-NIR) spectroscopy. The objective of this study was to select appropriate pre-processing, variable selection and multivariate calibration techniques to improve the prediction accuracy of density in Chinese white poplar (Populus tomentosa carriere) wood. The Vis-NIR spectra were de-noised using four methods (lifting wavelet transform, LWT; wavelet transform, WT; multiplicative scatter correction, MSC; and standard normal variate, SNV), and four variable selection techniques, including successive projections algorithm (SPA), uninformative variables elimination (UVE), competitive adaptive reweighted sampling (CARS) and iteratively retains informative variables (IRIV), were compared to simplify the dimension of the high-dimensional spectral matrix. The non-linear models of generalized regression neural network (GRNN) and support vector machine (SVM) were performed using these selected variables. The results showed that the best prediction was obtained by GRNN models combined with the LWT and CARS method for Chinese white poplar wood density ( R p 2 = 0.870; RMSEP = 13 Kg/m3; RPD p = 2.774).

1. Introduction

Wood is a porous, complex and heterogeneous organic material. Changes in wood density result in structural variations at different scales. These molecular, cellular and/or organ variations are strongly associated with the mechanical, physiological and morphological properties of wood [1,2,3]. Thus, the accurate prediction of wood density is an important endeavor for the maximization of utility. However, wood density varies with site, tree species and within trees [4]. For a specific tree, there exist differences in density among different organs such as branches, trunk and roots [5]. In this situation, it is too time-consuming and expensive to predict wood density with the traditional density-measurement techniques, namely gravimetric means measured in the laboratory. Therefore, a simple, rapid and non-destructive method is needed for forestry researchers and managers.
Many studies have been conducted to predict wood properties using near infrared (NIR) spectroscopy [6]. This technique is rapid, cost-effective and non-destructive and can make up for the shortcomings of traditional methods, especially when a large number of samples are required. Near infrared energy causes vibrational excitation of C–H, N–H, O–H, and C=O groups of wood samples, and NIR spectra can be translated into structure and composition information using chemometric tools [7,8].
Chemometrics is a technique of extracting useful information from chemical data using statistical and mathematical methods [9]. The main applications of chemometric tools in spectroscopy include multivariate calibration modeling and pattern recognition [10]. Spectra pre-processing contain various methods on de-noising and dimensionality reduction. Frequently used de-noising methods include smoothing, multiplicative scatter correction (MSC), wavelet transform (WT) and derivation. Some variable selection algorithms such as successive projections algorithm (SPA), genetic algorithm (GA) and iteratively retains informative variables (IRIV) can effectively extract correlation information and simplify high-dimensional spectral dimensions [11,12,13,14]. For multivariate calibration models, partial least squares (PLS) and support vector machine (SVM) are the most commonly used linear and non-linear method, respectively [15,16]. Thus, the selection of appropriate chemometrics is becoming important because model choice will impact prediction performance.
Many comparisons of different chemometric techniques can be found in the scientific literature. For example, Chen and Li found that a modified random frog (MRF) method combined with Gaussian process regression (GPR) outperformed: random frog (RF), successive projections algorithm (SPA) and competitive adaptive reweighted sampling (CARS). The combined MRF and GPR methods led to a better prediction of wood moisture content [17]. Likewise, after a comparison was performed among various variable selection methods including SPA, CARS, genetic algorithm (GA) and Monte Carlo-uninformative variable elimination (MC-UVE), Liang et al. [18] revealed that the CARS method obtained higher accuracy for the estimation of holocellulose and lignin contents for various wood species. It can be found that none of the chemometric methods can obtain the best performance for each application [19].
This study aimed to conduct a comparison of various chemometrics, including de-noising, variables selection methods and calibration models. We then strived to select the most suitable method for improving the prediction accuracy of density in Chinese white poplar (Populus tomentosa carriere) samples. Our specific objectives were as follows: (1) to investigate the optimal de-noising method for Chinese white poplar Vis-NIR spectra among lifting wavelet transform (LWT), WT, MSC and standard normal variate (SNV); (2) to explore the important wavelength variables to predict wood density using four variable selection methods (SPA; uninformative variables elimination, UVE; CARS; and IRIV); (3) to compare the performance of the non-linear models (GRNN and SVM) based on the selected variables.

2. Materials and Methods

2.1. Samples Preparation

Five natural Chinese white poplar trees (Populus tomentosa carriere) were harvested from the Jinsha forest farm in Qitaihe City, Heilongjiang Province, China (131°08′–131°21′ E, 45°44′–45°53′ N). The study area has Temperate Continental monsoon climate and an annual precipitation range between 530 and 550 mm. The age of these trees was from 42 to 58 years. Trees heights ranged from 22.4 to 23.3 m and diameter at breast height varied from 20.9 to 35.6 cm. Five cm disks were made from each tree, with the distance of the interval 2 m from the breast height (1.3 m) to the top of the stem. Then, the disks were divided into 2 cm strip samples from the bark, through the pith and to the opposite bark, and then they were divided into cubes. A total of 87 cube samples with dimensions of 2 cm (longitudinal), 2 cm (radial) and 2 cm (tangential) were used for spectra collection and model calibration.
As the cross-section of wood samples contain growth rings, wood rays, heartwood/sapwood and many other property parameters, the cross-section of wood samples was used for analysis [20]. Before spectral collection, the cross-sections of the samples were polished with an electric plane to remove the influence of surface roughness. Additionally, the color of the heartwood was slightly darker than that of the sapwood. A simple random sample method was employed to divide the calibration (65 samples) and prediction set (22 samples) populations.

2.2. Vis-NIR Spectra Collection and Density Measurement

The Vis-NIR spectra of Chinese white poplar wood were obtained using NIR spectrometer (LabSpec Pro FR/A114260, Analytical Spectral Devices, Inc., Boulder, CO, USA). The whole wavelength range was from 350 to 2500 nm, with a spectral resolution of 3 nm@700 nm, 10 nm@1400/2100 nm. The number of scanning was 30 and a spectrum was automatically generated. The NIR spectrometer was preheated for 30 min before spectra collection to allow for stabilization. The spectrum was collected for each sample on the cross section face using a fiber-optic probe after finishing with a white reference collection. In order to contain the total information of the cross-section, a random sampling point from heartwood and sapwood was selected for spectral collection from two cross-sections, and the average spectrum was regarded as the raw spectrum of each sample. The raw Vis-NIR spectra were reduced to between 350 and 2397 nm and were used to analyze because of the noise at the edges of the spectra. The density of the wood samples was measured according to GB/T 1933–2009 (ISO 3131: 1975, Wood-Determination of density for physical and mechanical tests, MOD). The moisture content of the samples ranged from 38% to 64% for spectra collection and density determination.

2.3. Spectral Data Analysis

2.3.1. Pre-Processing

The collected Vis-NIR spectra usually contained some noise or interference information, such as electrical noise, background noise, scatting, etc. [21]. To eliminate the influence of noise and further improve the signal-to-noise ratio, several pre-processing algorithms including LWT, WT, MSC and SNV were employed. LWT and WT can improve the signal-to-noise ratio [22]; MSC is able to remove scattering variation caused by the distribution and size of particles [23]; and SNV has similar effects with MSC.
The wood density models with these four pre-processing methods were built based on PLS regression, and the optimal pre-processing method was determined by the performance of the PLS models. The PLS technique has been widely applied in the multivariate statistical analysis with the advantage of robust prediction. However, the linear relationships between spectral variables and properties can be achieved by the PLS method [24]. It compresses the data by selecting statistically important latent variables (LVs). The leave-one-out cross-validation procedure was employed to evaluate the performance of the calibration models. In this study, the number of Vis-NIR spectral wavelength variables (2048 data points) was larger than that of samples (87). Therefore, it is suitable to use the PLS algorithm as a calibration model between pre-processed spectral data and the measurement values of Chinese white poplar wood density. LWT and WT were conducted using Matlab R2010b (MathWorks, Natick, MA, USA). MSC, SNV and PLS were implemented in The Unscrambler V10.4 (CAMO Software AS, Oslo, Norway).

2.3.2. Characteristic Wavelengths Selection

With the rapid development of modern spectrometers, a high-dimensional spectral matrix can be obtained, which increases the complexity and time of computation. Thus, after the optimal pre-processing method was obtained, four variable selection methods, namely, SPA, UVE, CARS and IRIV, were employed to simplify the dimensions of the spectral matrix and address “the curse of dimensionality” [25]. These four variables selection methods were also conducted in Matlab R2010b.

2.3.3. Establishment of Vis-NIR Calibration Models

The optimal pre-processing and variable selection methods were determined by the results of the PLS calibration and validation models. In order to better analyze the relationship between the selected characteristic wavelengths and measured density values, two non-linear calibration models of GRNN and SVM were adopted to build prediction models. For the parameters C and g of SVM models, particle swarm optimization (PSO) was applied to search for the optimal parameter values.
The predicted wood density values from different models vs. the measured values were evaluated by the following diagnostics: coefficient of determination (R2), root mean square error (RMSE) and ratio of performance standard deviation (RPD). Generally, a good predictive model was considered to be obtained with large values of R2 and RPD and small RMSE values [26]. RPD values indicate the predictive ability of prediction models, where values more than 3 indicate that the model is excellent for prediction, a good prediction will be obtained when RPD values are between 2.5 and 3, RPD values from 2 to 2.5 indicate that the model can be used for prediction and models are not usable when RPD values less than 1.5 [27].

2.4. Overview of Optimization of the Wood Density Model

An appropriate chemometric method is essential for near infrared spectral data analysis. It is well known that spectra noise, “curse of dimensionality” and calibration models selection are critical for improving the performance of NIR analysis. In this study, four spectral de-noising techniques (LWT, WT, MSC and SNV) were performed for Chinese white poplar wood spectra. The optimal pre-processing method was determined based on the performance of the PLS models. Then, SPA, UVE, CARS and IRIV were employed to address “the curse of dimensionality”. After the optimal de-noising method and variable selection method were obtained, two non-linear calibration models were used to analyze the relationship between these selected characteristic wavelengths and wood density. The total optimization process is depicted in Figure 1.

3. Results

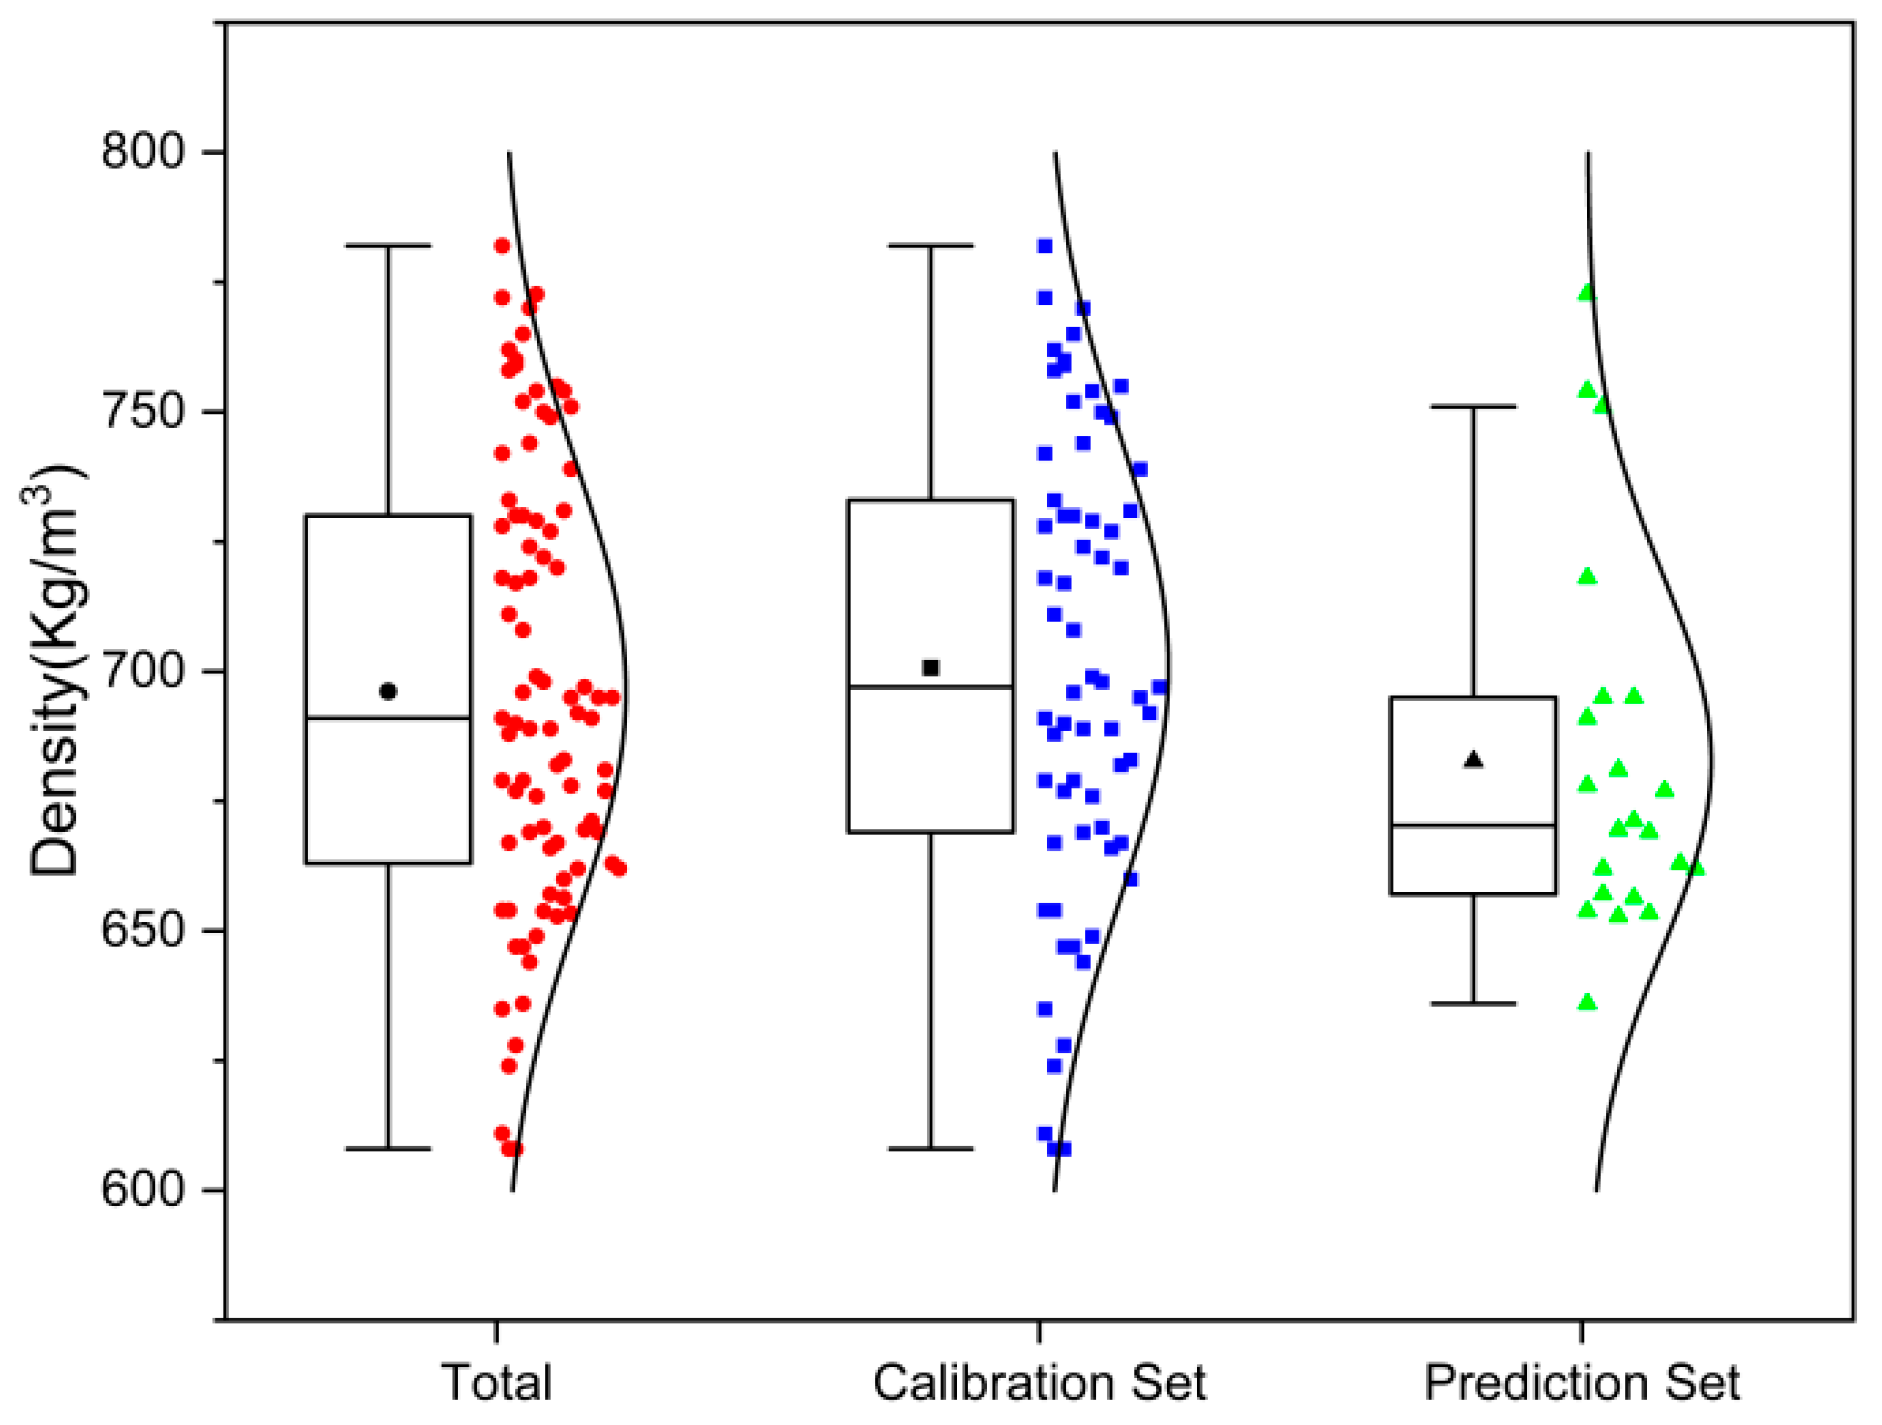
3.1. Descriptive Statistics of Wood Density

The boxplot of the measured density values is shown in Figure 2. The range of the entire data set was from 608 to 782 Kg/m3 and the average density content was 696 Kg/m3. The range of the calibration data set was larger than the prediction data set to ensure no extrapolation. The distributions of the density values of the prediction set were well within the calibration set. The standard deviation (SD) indicates the dispersion degree of the sample set. It can be found that the SD and average values of the calibration and prediction sets were similar, which indicated that the data set was representative.

3.2. Comparison of Various Pre-Processing Methods

There exists noise in the spectrum curve due to the influence of background and environment factors. In this situation, a spectral matrix with noise will results in the decrease of model accuracy. Therefore, several pre-processing methods including LWT, WT, MSC and SNV were adopted to remove noise before building models. The optimal pre-processing method for Chinese white poplar wood spectra was determined by the results of PLS models. The selection of latent variables (LVs) is a key parameter for PLS models. The model will be over-fitted when the number of LV is too large. In contrast, some useful information related wood samples may be removed when the LV number is too small. Therefore, the minimum value of the prediction residual error sum squares (PRESS) of internal cross-validation was used to determine the LVs number. As for LWT and WT, the biorthogonal wavelet family (bior2.6) based on 5 decomposition level was used to de-noise. Table 1 shows the PLS model’s results with various pre-processing methods.
As seen in Table 1, different results were obtained with various pre-processing methods. The model accuracy of the calibration and cross-validation data set was decreased after pre-processing with MSC and SNV methods. The reason may be that the samples were polished using an electric plane and the difference in particle size or surface scatting is too small. In terms of WT, although the performance of cross-validation was improved, the R2 value of the calibration model was similar with other models used on the raw spectra. Regardless of the calibration and cross-validation set, the best performance was achieved when the LWT method was employed for the Vis-NIR spectra that was pre-processed. The R2 values of the calibration and cross-validation sets were 0.809 and 0.720, respectively; and the RMSE values of the calibration and cross-validation sets were 19 and 24 Kg/m3, respectively. The spectrum curve with LWT processed is shown in Figure 3.
It can be seen in Figure 3 that, for raw spectrum and LWT spectrum, the trends and absorption peaks are the same except for the edges of the spectrum, which indicated that the useful information related wood properties were maintained after the spectrum was processed by LWT. Two significant absorption peaks were found around 1417 nm and 1633 nm, and they were related to the first overtone of C-H stretching vibration of lignin and the O-H stretching of cellulose, respectively [28,29]. Combined with the results of the PLS model, it was demonstrated that LWT had improved the model accuracy. Hence, the spectra processed with the LWT method were used for further analysis.

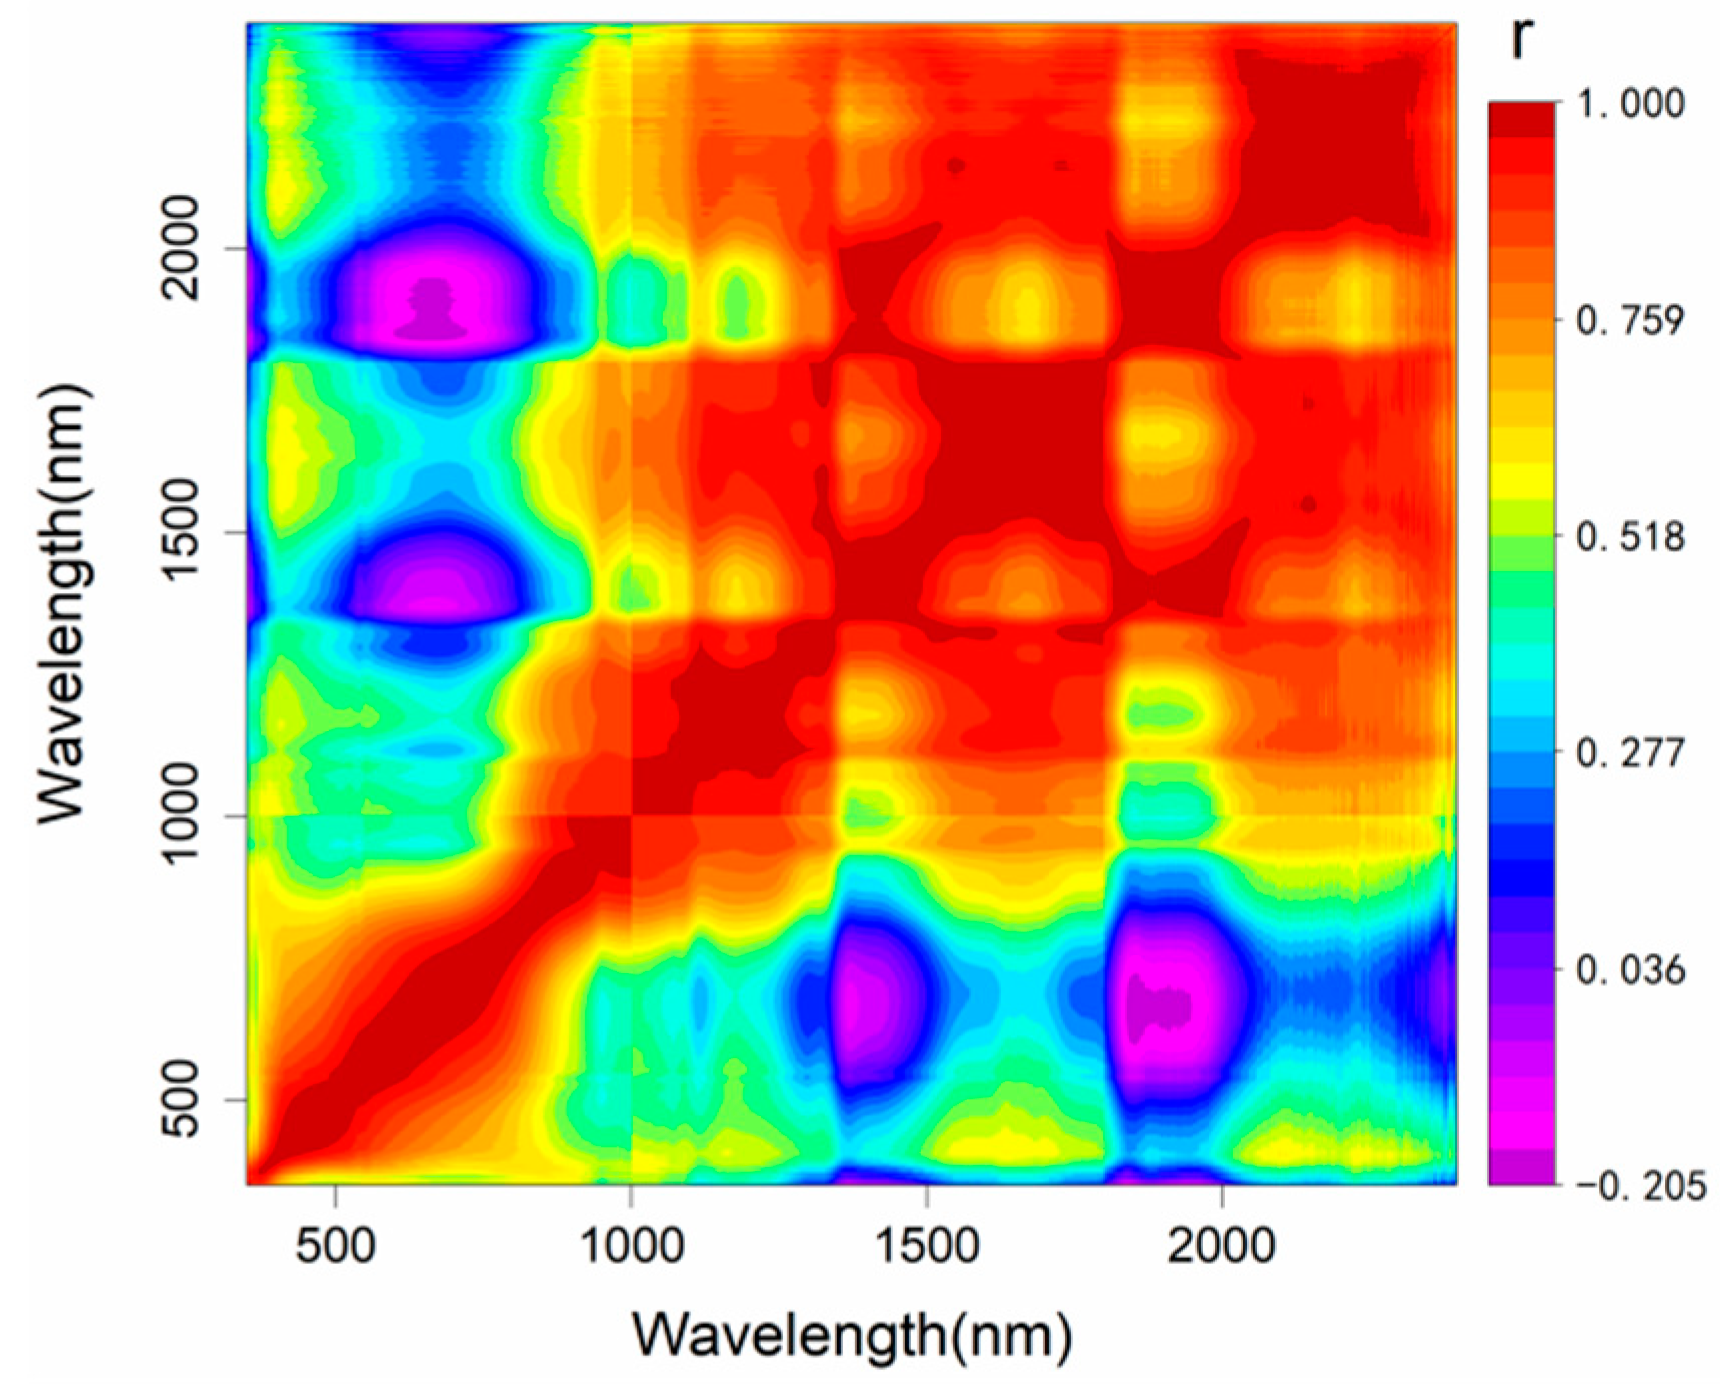
3.3. Characteristic Wavelengths for Predicting Density

Two-dimensional (2D) correlation spectroscopy was adopted to analyze the correlation between Vis-NIR spectral variables from 350 to 2397 nm. A high correlation coefficient (r) value indicated that spectra exist with more collinearity and redundant information. The 2-D correlation spectra of wavelength variables are shown in Figure 4.
As displayed in Figure 4, a relatively low correlation coefficient was achieved between the visible and long-wave NIR spectral region. However, high correlations were obtained around the wavelength range of 350–1000 nm and 1000–2500 nm, especially for adjacent wavelength variables. This demonstrated that the Vis-NIR spectra of Chinese white poplar had multiple collinearity or redundant information, which increased the time, memory and complexity for Vis-NIR modeling. In this study, the spectral region from 350 to 2397 nm was used for model building and a total of 2048 spectral variables were contained. Hence, four variable selection methods (SPA, UVE, CARS and IRIV) were employed to simplify the dimensions of the spectral matrix. To better analyze these four variable selection methods, the performance of PLS model using characteristic bands is shown in Table 2.
As shown in Table 2, the performance of the calibration and cross-validation models were compared. It can be seen that different results were obtained based on the various variable selection methods. This may be due to the fact that different selection strategies among the SPA, UVE, CARS and IRIV methods and different wavelengths were achieved. In terms of the IRIV method, although the percentage decrease in value of the selected variables was higher than that of CARS, the calibration set and cross-validation accuracy were worse than CARS with R2 of 0.755 and 0.697, respectively. In addition, as for SPA and IRIV, the performance of the calibration set was slightly better than the model using the full spectra; however, the cross-validation results were lower than those of full spectra. This demonstrated that some informative variables were not selected or that some useful variables were ignored.
Among these four variable selection methods, the model accuracy of the UVE procedure resulted in the lowest R2 and the highest RMSE values for the calibration and cross-validation set. Moreover, the number of selected variables was more than others, perhaps an indication of a model overfit. Regardless of the performance of calibration set and cross-validation set, the model accuracy of CARS was better than SPA, UVE, IRIV and full spectra. Additionally, the dimension of the spectral matrix was reduced from 2048 to 23 (Percentage decrease = 98.88%).

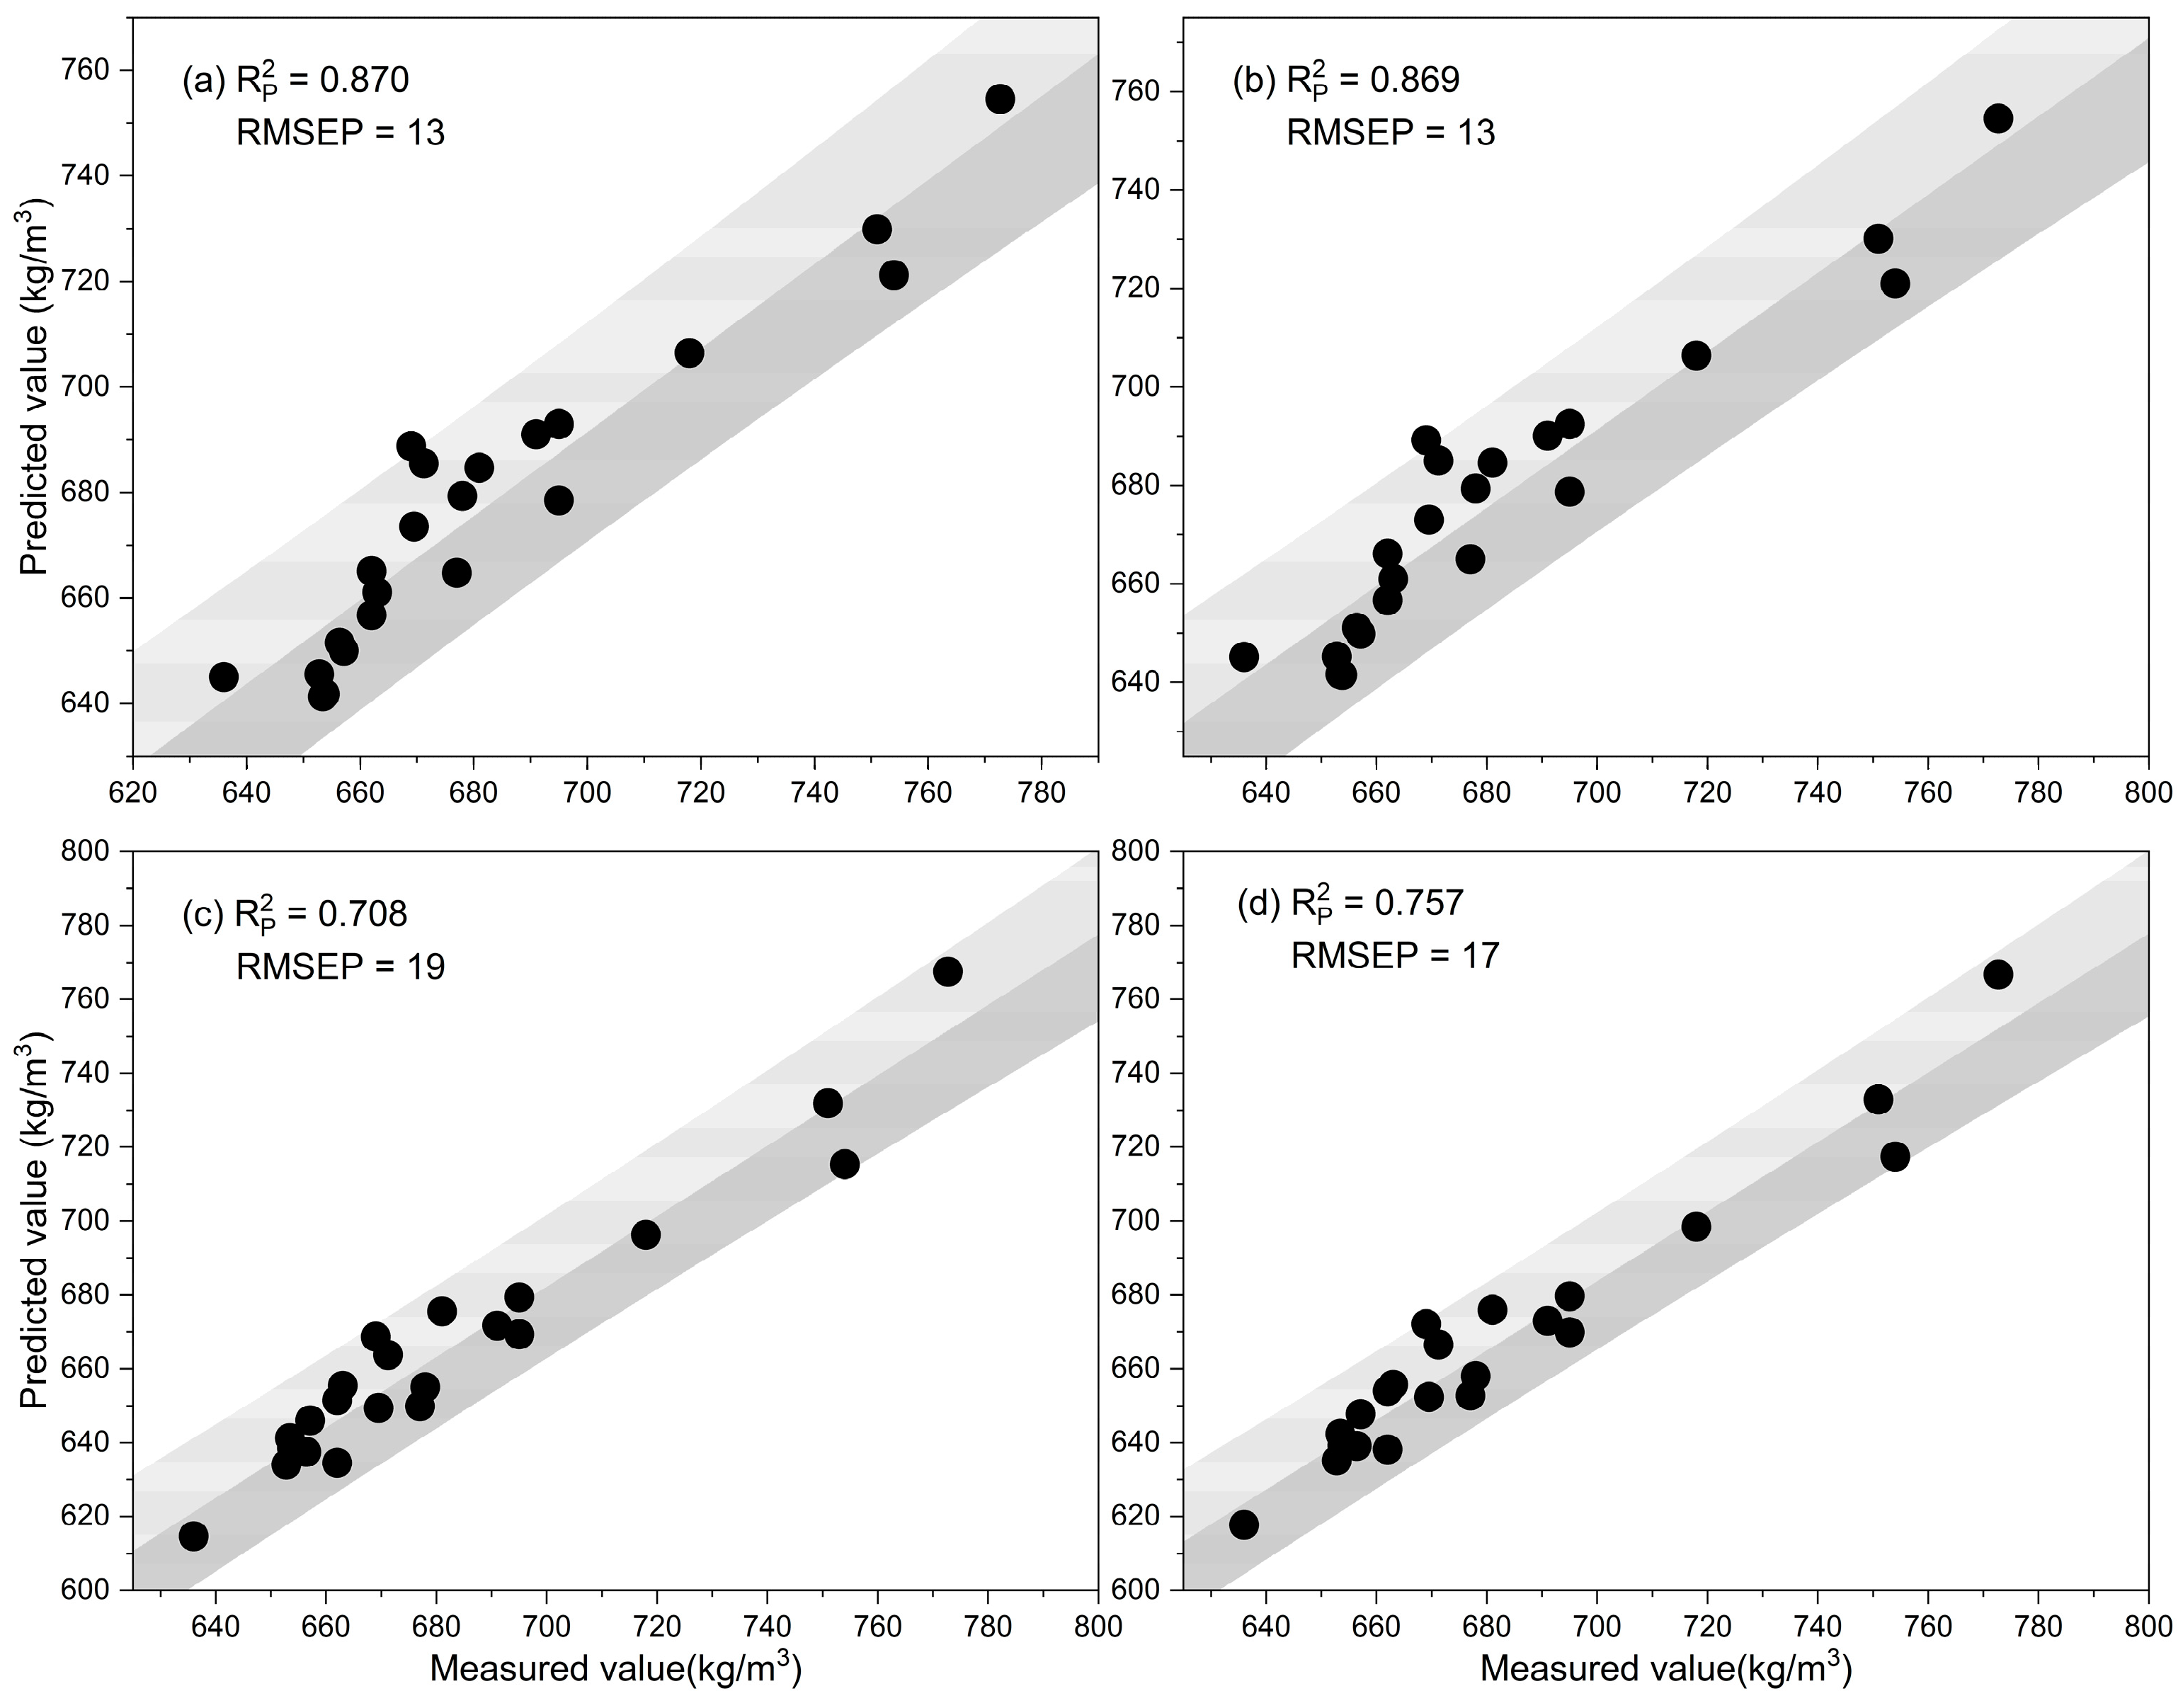
3.4. Prediction Accuracy of Non-Linear Models

In order to better analyze the performance of these selected variables, the GRNN and SVM models were employed to analyze the non-linear relationship between the selected wavelengths and wood density. For the SVM, particle swarm optimization (PSO) was used to optimize SVM parameter values. These two non-linear models were inputted into the prediction set as independent variables to analyze the prediction ability. The prediction results of these two non-linear models are shown in Figure 5.
As seen in Figure 5, regardless of the de-noising pre-processing of LWT, the GRNN model achieved higher and lower RMSEP values when compared to the PSO-SVM model, which indicated the effectiveness of the GRNN model in the prediction of Chinese white poplar wood density. Additionally, in terms of the performance of de-noising for the prediction set with LWT, as for the PSO-SVM model, the values were 0.708 and 0.757 for raw spectra and spectra optimized by LWT, respectively, and the RMSEP values were 19 and 17 Kg/m3, respectively. However, the GRNN models had similar results with the raw spectra, and its performance was better than that of PSO-SVM models and PLS models with raw spectra ( R p 2 = 0.797, RMSEP = 96 Kg/m3). This indicated that original spectra can be used to predict directly when the GRNN model with LWT de-noising was employed to determinate Chinese white poplar wood density.

4. Discussion

Wavelength selection technique is a critical step to tackle the huge datasets with hundreds or even thousands of variables in visible and near infrared spectral analysis. In this study, four variable selection methods were employed to simplify the dimension of Chinese white poplar wood spectra. This study demonstrated that CARS can be used to better optimize characteristic wavelengths for wood density and thus achieve better model accuracy in the prediction of Chinese white poplar wood density. Compared to other methods with the same selection strategy, i.e., SPA, UVE, CARS, or a different (IRIV) selection strategy, the CARS method obtained the best prediction accuracy of wood density, and the spectral dimension was reduced from 2048 to 23. However, this is not consistent with the results of the characteristic variables selection for wood density in our previous study [30], in which UVE was better than CARS in the prediction of Siberian elm (Ulmus pumila L.) wood density. Therefore, the distributions of the selected characteristic variables for these methods were analyzed (Figure 6).
It can be seen from Figure 6 that even though the selection strategy is the same for SPA, UVE and CARS, different characteristic variables were selected for these methods. In addition to UVE, other variable selection methods achieved a small amount of characteristic variables related wood density information, and these selected variables were mainly distributed in the visible and long-wave NIR region. For example, spectral variables were reduced from 2048 in the whole region to 23 and 16 with the CARS and IRIV methods, respectively. In contrast, 410 variables were screened by UVE, and these selected wavelengths were at the one end of spectrum curve (visible spectrum region). The distributions of selected variables are different from our previous study, which led to the different optimization results for the same variable selection method.
According to the corresponding band assignment (Table 3), the bands located around 2338 nm, 2352 nm, 2380 nm, 2188 nm and 2330 nm were attributed to the C-H stretching of cellulose and hemicellulose, while 2384 nm was associated with lignin. This demonstrated that these selected variables play an important role in the prediction of Chinese white poplar wood density, which is consistent with our previous results.
Additionally, except for the difference of tree species and geographical origin, the spectra of the different surfaces of samples also made contributions to the different optimal variable selection method. The reason is that the surfaces of wood samples including the cross-section, tangential and radial section have various wood characteristics due to the difference in anatomical, chemical and physical properties. In this study, the spectra of the cross-section were employed for analysis. However, in terms of the characteristics of the heartwood and sapwood, there also exist little variation in carbon content, with average values of 41.980% and 41.199%, respectively. Therefore, the influence of various surfaces on the spectra analysis should be compared in future studies

5. Conclusions

Appropriate chemometric methods including spectral pre-processing, variable selection and calibration models play an important role in the successful prediction of wood density by visible and near infrared (Vis-NIR) spectroscopy. The impact of these factors was discussed and the optimal combination of chemometric methods was determined. For the prediction of Chinese white poplar wood density, the LWT-CARS-GRNN model achieved the best prediction accuracy, and the spectral dimension was reduced from 2048 to 23. This study demonstrated that an appropriate chemometric method can simplify the spectral matrix and improve model performance.

Author Contributions

Conceptualization, Y.L. (Ying Li) and G.W.; methodology, Y.L. (Ying Li); software, Y.L. (Yaoxiang Li) and B.K.V.; validation, Y.L. (Ying Li), G.W., G.G., Y.L. (Yaoxiang Li), B.K.V. and Z.P.; formal analysis, G.W.; investigation, G.G.; resources, Y.L. (Yaoxiang Li) and Y.L. (Ying Li); data curation, Y.L. (Ying Li) and Y.L. (Yaoxiang Li); writing—original draft preparation, Y.L. (Ying Li); writing—review and editing, Y.L. (Ying Li), G.W., Y.L. (Yaoxiang Li), B.K.V. and Z.P.; visualization, B.K.V.; supervision, Z.P.; project administration, Y.L. (Ying Li) and Z.P.; funding acquisition, Y.L. (Ying Li) and Z.P. All authors have read and agreed to the published version of the manuscript.

Funding

This research was supported by the Science and Technology Project of Inner Mongolia (No. 2020GG0078), the Natural Science Foundation of Inner Mongolia Autonomous Region (No. 2021BS03019), the Major Science and Technology Projects of Inner Mongolia Autonomous Region (No. 2020ZD0009) provided by the Department of Science and Technology of Inner Mongolia Autonomous Region; Open Laboratory Project by College of Energy and Transportation Engineering in Inner Mongolia Agricultural University (No. NYKF20210104); and The APC was funded by Zhiyong Pei.

Data Availability Statement

The data presented in this study are available on request from the corresponding author. The data are not publicly available due to it being used to apply for a project.

Conflicts of Interest

The authors declare no conflict of interest.

References

  1. Filková, V.; Kolár, T.; Rybníček, M.; Gryc, V.; Vavrčík, H.; Jurčík, J. Historical utilization of wood in southeastern Moravia (Czech Republic). iForest 2015, 8, 101–107. [Google Scholar] [CrossRef] [Green Version]
  2. Fang, S.Z.; Liu, Y.; Yue, J.; Tian, Y.; Xu, X.Z. Assessments of growth performance, crown structure, stem form and wood property of introduced poplar clones: Results from a long-term field experiment at a lowland site. For. Ecol. Manag. 2021, 479, 118586. [Google Scholar] [CrossRef]
  3. Waldron, K.; Auty, D.; Tong, T.; Ward, C.; Pothier, D.; Torquato, L.P.; Achim, A. Fire as a driver of wood mechanical traits in the boreal forest. For. Ecol. Manag. 2020, 476, 118460. [Google Scholar] [CrossRef]
  4. Schimleck, L.; Antony, F.; Mora, C.; Dahlen, J. Comparison of whole-tree wood property maps for 13- and 22-year-old loblolly pine. Forests 2018, 9, 287. [Google Scholar] [CrossRef] [Green Version]
  5. Henry, M.; Besnard, A.; Asante, W.A.; Eshun, J.; Adu-Bredu, S.; Valentini, R.; Bernoux, M.; Saint-André, L. Wood density, phytomass variations within and among trees, and allometric equations in a tropical rainforest of Africa. For. Ecol. Manag. 2010, 260, 1375–1388. [Google Scholar] [CrossRef]
  6. Schimleck, L.; Dahlen, J.; Apiolaza, L.A.; Downes, G.; Emms, G.; Evans, R.; Moore, J.; Pâques, L.; Bulcke, J.V.; Wang, X.P. Non-destructive evaluation techniques and what they tell us about wood property variation. Forests 2019, 10, 728. [Google Scholar] [CrossRef] [Green Version]
  7. Tsuchikawa, S.; Kobori, H. A review of recent application of near infrared spectroscopy to wood science and technology. J. Wood Sci. 2015, 61, 213–220. [Google Scholar] [CrossRef] [Green Version]
  8. Sergent, A.S.; Segura, V.; Charpentier, J.P.; Dalla-Salda, G.; Fernández, M.E.; Rozenberg, P.; Martinez-Meier, A. Assessment of resistance to xylem cavitation in cordilleran cypress using near-infrared spectroscopy. For. Ecol. Manag. 2020, 462, 117943. [Google Scholar] [CrossRef]
  9. Paul, A.; Harrington, P.B. Chemometric applications in metabolomic studies using chromatography-mass spectrometry. TrAC Trends Anal. Chem. 2021, 135, 116165. [Google Scholar] [CrossRef]
  10. Chu, X.L. Molecular Spectroscopy Analytical Technology Combined with Chemometrics and Its Applications; Chemical Industry Press: Beijing, China, 2011; pp. 231–249. [Google Scholar]
  11. Song, X.; Huang, Y.; Tian, K.; Min, S. Near infrared spectral variable optimization by final complexity adapted models combined with uninformative variables elimination-A validation study. Optik 2019, 203, 164019. [Google Scholar] [CrossRef]
  12. Lu, B.; Liu, N.H.; Li, H.L.; Yang, K.F.; Hu, C.; Wang, X.F.; Li, Z.X.; Shen, Z.X.; Tang, X.Y. Quantitative determination and characteristic wavelength selection of available nitrogen in coco-peat by NIR spectroscopy. Soil Tillage Res. 2019, 191, 266–274. [Google Scholar] [CrossRef]
  13. Xu, S.; Zhao, Y.; Wang, M.; Shi, X. Determination of rice root density from Vis–NIR spectroscopy by support vector machine regression and spectral variable selection techniques. Catena 2017, 157, 12–23. [Google Scholar] [CrossRef]
  14. Hu, F.; Zhou, M.; Yan, P.; Li, D.; Lai, W.; Zhu, S.; Wang, Y. Selection of characteristic wavelengths using SPA for laser induced fluorescence spectroscopy of mine water inrush. Spectrochim. Acta Part A Mol. Biomol. Spectrosc. 2019, 219, 367–374. [Google Scholar] [CrossRef]
  15. Virginia dos Santos Pereira, E.; Douglas de Sousa Fernandes, D.; Ugulino de Araújo, M.C.; Gonçalves Dias Diniz, P.H.; Sucupira Maciel, M.I. Simultaneous determination of goat milk adulteration with cow milk and their fat and protein contents using NIR spectroscopy and PLS algorithms. LWT 2020, 127, 109427. [Google Scholar] [CrossRef]
  16. Wang, Y.; Yang, M.; Wei, G.; Hu, R.; Luo, Z.; Li, G. Improved PLS regression based on SVM classification for rapid analysis of coal properties by near-infrared reflectance spectroscopy. Sens. Actuators B Chem. 2014, 193, 723–729. [Google Scholar] [CrossRef]
  17. Chen, J.; Li, G. Prediction of moisture content of wood using modified random frog and Vis-NIR hyperspectral imaging. Infrared Phys. Technol. 2020, 105, 103225. [Google Scholar] [CrossRef]
  18. Liang, L.; Wei, L.; Fang, G.; Xu, F.; Deng, Y.; Shen, K.; Tian, Q.W.; Wu, T.; Zhu, B. Prediction of holocellulose and lignin content of pulp wood feedstock using near infrared spectroscopy and variable selection. Spectrochim. Acta Part A Mol. Biomol. Spectrosc. 2019, 225, 117515. [Google Scholar] [CrossRef]
  19. Chang, C.W.; Laird, D.A.; Mausbach, M.J.; Hurburg, C.R.J. Near-infrared reflectance spectroscopy-principal component regression analysis of soil properties. Soil Sci. Soc. Am. J. 2001, 65, 480–490. [Google Scholar] [CrossRef] [Green Version]
  20. Liu, Y.N. Preliminary Investigation of Wood Identification by Near Infrared Spectroscopy. Master’s Thesis, Chinese Academy of Forestry, Beijing, China, 2014. [Google Scholar]
  21. Rinnan, Å.; Berg, F.; Engelsen, S.B. Review of the most common pre-processing techniques for near-infrared spectra. TrAC Trends Anal. Chem. 2009, 28, 1201–1222. [Google Scholar] [CrossRef]
  22. Geladi, P.; MacDougall, D.; Martens, H. Linearization and scatter-correction for near-infrared reflectance spectra of meat. Appl. Spectrosc. 1985, 39, 491–500. [Google Scholar] [CrossRef]
  23. Titterington, D.M. Statistical challenges of high-dimensional data. Phil. Trans. R. Soc. A 2009, 367, 4235–4470. [Google Scholar]
  24. Wold, S.; Sjöström, M.; Eriksson, L. PLS-regression: A basic tool of chemometrics. Chemom. Intell. Lab. Syst. 2001, 58, 109–130. [Google Scholar] [CrossRef]
  25. Williams, P.C.; Norris, K. Implementation of Near-Infrared Technology. In Near-Infrared Technology in the Agricultural and Food Industries; AACC: St. Paul, MN, USA, 2001; pp. 145–171. [Google Scholar]
  26. Zhang, X.C.; Wu, J.Z.; Xu, Y. Near Infrared Spectroscopy Technique and Applications in Modern Agriculture; Publishing House of Electronics Industry: Beijing, China, 2012; pp. 48–49. [Google Scholar]
  27. Huang, H.P.; Hu, X.J.; Tian, J.P.; Jiang, X.N.; Sun, T.; Luo, H.B.; Huang, D. Rapid and nondestructive prediction of amylose and amylopectin contents in sorghum based on hyperspectral imaging. Food Chem. 2021, 359, 129954. [Google Scholar] [CrossRef]
  28. Shenk, J.S.; Workman, J.J.; Westerhaus, M.O. Handbook of Near-Infrared Analysis; Burns, D.A., Ciurczak, E.W., Eds.; Marcel Dekker Inc.: New York, NY, USA, 2001; pp. 7–21. [Google Scholar]
  29. Watanabe, A.; Morita, S.; Ozaki, Y. Temperature-dependent structural changes in hydrogen bonds in microcrystalline cellulose studied by infrared and near-infrared spectroscopy with perturbation-correlation moving-window two-dimensional correlation analysis. Appl. Spectrosc. 2006, 60, 611–618. [Google Scholar] [CrossRef]
  30. Li, Y.; Via, B.; Li, Y.X. Lifting wavelet transform for Vis-NIR spectral data optimization to predict wood density. Spectrochim. Acta Part A Mol. Biomol. Spectrosc. 2020, 240, 118566. [Google Scholar] [CrossRef] [PubMed]
  31. Schwanninger, M.; Hinterstoisser, B.; Gradinger, C.; Messner, K.; Fackler, K. Examination of spruce wood biodegraded by Ceriporiopsis subvermispora using near and mid infrared spectroscopy. J. Near Infrared Spectrosc. 2004, 12, 397. [Google Scholar] [CrossRef]
  32. Workman, J.; Weyer, L. Practical Guide to Interpretive Near-Infrared Spectroscopy, 1st ed.; CRC Press: Boca Raton, FL, USA, 2007. [Google Scholar]
  33. Hein, P.R.G.; Campos, A.C.M.; Mendes, R.F.; Mendes, L.M.; Chaix, G. Estimation of physical and mechanical properties of agro-based particleboards by near infrared spectroscopy. Eur. J. Wood Prod. 2011, 69, 431. [Google Scholar] [CrossRef] [Green Version]
Figure 1. Steps of the optimization process.
Forests 13 00062 g001
Figure 2. The boxplot of wood density of Chinese white poplar.
Forests 13 00062 g002
Figure 3. Raw spectrum and LWT spectrum of a random sample.
Forests 13 00062 g003
Figure 4. 2-D correlation spectra of wavelength variables.
Forests 13 00062 g004
Figure 5. The results of the GRNN and PSO-SVM models with characteristic bands. (a) GRNN model with raw spectra; (b) GRNN model with LWT de-noising; (c) PSO-SVM model with raw spectra; (d) PSO-SVM model with LWT de-noising.
Forests 13 00062 g005
Figure 6. The distributions of the selected wavelength variables for each method. (a) SPA; (b) UVE; (c) CARS; (d) IRIV.
Forests 13 00062 g006
Table 1. PLS model’s results with different pre-processing for the prediction of Chinese white poplar wood density.
Pre-Processing MethodsLVs NumberCalibration SetCross-Validation
R2RMSE
(Kg/m3)
R2RMSE
(Kg/m3)
Raw spectra30.749220.71524
LWT60.809190.72024
WT30.748220.72124
MSC40.646260.52232
SNV40.654260.54031
Table 2. The PLS models with various variable selection methods.
MethodsVariable NumbersPercentage DecreaseCalibration SetCross-Validation Set
R2RMSE
(Kg/m3)
R2RMSE
(Kg/m3)
Full spectra204800.749220.71524
SPA6496.88%0.765220.68226
UVE41079.98%0.679260.66726
CARS2398.88%0.783210.76722
IRIV1699.22%0.755220.69725
Table 3. The band assignment of these selected variables.
Wavelength (nm)Assignment
1660Cellulose hydroxyls
2338, 2352, 2380Cellulose [31,32,33]
2188Cellulose hydroxyl–water
2330Hemicellulose
2384Lignin
Publisher’s Note: MDPI stays neutral with regard to jurisdictional claims in published maps and institutional affiliations.

