Article

Effects of Structural and Diversity Attributes on Biomass in Different Types of Urban Forests in Changchun, Northeast China, and Suggestions for Urban Forest Planning

1
College of Landscape Architecture, Changchun University, Changchun 130022, China
2
Key Laboratory of Wetland Ecology and Environment, Northeast Institute of Geography and Agroecology, Chinese Academy of Sciences, Changchun 130102, China
3
Academy of Forestry Sciences of Changchun, Changchun 130119, China
*
Authors to whom correspondence should be addressed.
Submission received: 6 September 2022 / Revised: 18 October 2022 / Accepted: 28 October 2022 / Published: 30 October 2022
(This article belongs to the Special Issue Forest Biodiversity and Ecosystem Stability)

Abstract

:
Understanding of the relationship between structural and diversity attributes and biomass is important for plant biodiversity conservation, ecosystem service function enhancement and sustainable development of urban forest ecosystems. In this study, road forest (RF), attached forest (AF) and landscape and relaxation forest (LF) were selected as research objects. We systematically evaluated the diversity attributes and above ground biomass (AGB) at two dimensions of different diameter at breast height (DBH) grades and different tree height grades of urban forests in Changchun, Northeast China. Structural equation modeling (SEM) analyses of the correlation between structure attributes, diversity attributes and biomass among different types of urban forests were carried out. The results showed that species richness (SR) and Shannon–Wiener index (H′) of shrubs were lower than those of trees. Under the DBH grades, H′ in each forest type was highest in the 0–10 m grades and SR was highest in the 10–20 m grades. Under tree height grades, both H′ and SR of each type were at the top of the list. AGB was highest in each forest type under 5–10 m height grades. The relationship between AGB and H′ was better in LF, but with no significant relationships in the other forest types. SEM highlighted that in the overall aspect, the effect of forest type on biomass was mediated by structure and diversity attributes. Particularly in LF, there were direct and indirect effects between structure attributes and biomass mediated by diversity attributes. The improvement of the H′, evenness index (J′) and SR could enhance urban forest services, especially for the biomass and diversity of LF.

1. Introduction

Urban forest species diversity is an important component of urban biodiversity, which concerns the survival and development of human beings and is an important criterion for measuring the ecological health of the habitat [1]. Countries around the world are currently in a period of rapid urbanization, and urban forests are central to the conservation of urban species diversity [2]. Species diversity as the main evaluation indicator of ecological environment in urban areas will become an important link to reconnect people and nature [3,4]. Recent studies have shown that there is a certain relationship between the species diversity of urban forests and the ecosystem services they provided [5,6]. A higher level of species diversity can provide diverse and sustainable ecosystem services [7]. A large number of results confirm the positive correlation between plant diversity and productivity or biomass [8,9]. At the same time, it has also been shown that evenness index (J′) negatively related to aboveground biomass (AGB) [10]. There is uncertainty in the correlation results, and species differences are an important factor in the uncertainty of the relationship between diversity and biomass. [11,12].
Biomass is the basis for the functioning of ecosystem services; the coordinated improvement of biomass and diversity is the common goal of forest managers [13]. Currently, most of the empirical studies on species diversity that can improve biomass in sample sites are from natural forest ecosystem [14]. Studies on species diversity and biomass at different spatial scales have found that with the increase in species diversity, biomass may exhibit a unimodal relationship, which is linear and positive [15,16,17]. Meta-analysis of the relationship between diversity and productivity in global forest ecosystems indicates that J′ plays a dominant role in increasing forest productivity [18]. Although the positive relationship between species diversity and AGB is mostly found in forests, it shows high species richness and many trophic levels. However, biological and abiotic factors will affect the size and quality of this relationship [19]. These effects should be taken into account, especially in multivariable studies such as competition intensity, resource heterogeneity and population dynamics [20]. The biomass ratio hypothesis is also particularly important for biomass replenishment, by finding the opposite in forests of varying humidity: in dry forests, traditionally acquired species are associated with higher productivity and biomass [21]. However, there is little evidence supporting the relationship between species diversity and biomass in urban forest ecosystem.
Since the 1990s, the expansion of urbanization in Changchun has accelerated, urban and rural populations have begun to integrate [3] and the main urban area of Changchun has continued to expand. With the continuous improvement of urban infrastructure, the intertwined road networks and buildings have changed the distribution pattern of urban forests [2]. This phenomenon has led to the emergence of forest types with different ecological functions, resulting in differences in the structure, species and functions of different forest types [22,23]. However, due to the great influence of human factors, urban forests are facing a series of ecological environment problems, such as relatively poor soil fertility, monotonous tree species, less abundant structures than natural forests, and declining ecological service functions [24]. Given the lack of research on the relationship between urban ecosystem biomass and biodiversity [25], it is important to explore the coordinated improvement of urban biomass and biodiversity for the performance of urban ecosystem services [26,27].
In this study, the correlation of urban forest structural and diversity attributes, and biomass in Changchun were studied through combining the methods of field surveying, remote sensing and Geographic Information System (GIS) technology. Consequently, the aims were: (1) to clarify the species diversity and biomass distribution of urban forests at different DBH grades and different tree height grades; (2) to explore the correlation between structural and taxonomic attributes and biomass of different types of urban forests; and (3) to ascertain the direct and indirect effects between structural attributes, diversity attributes, and biomass. Systematic studies on the above questions could provide theoretical and data support for the coordinated improvement of urban forest diversity, biomass and their ecological service functions. We assumed that structural and diversity attributes had positive effect on biomass, but the effect varied between different forest types.

2. Materials and Methods

2.1. Study Sites

Changchun is located in the geographic center of the Northeast, in the Songliao Plain, the hinterland of the Northeast Plain, and is the capital city of Jilin Province. It is characterized by a temperate continental humid climate type with four distinct seasons and the same periods of rain and heat. Due to its unique geographical location, it has sufficient water, fertilizer, air, heat and light conditions. The annual maximum temperature is 27.5 °C, the minimum temperature is −19 °C. The annual precipitation is 522~615 mm. The precipitation is mainly concentrated in July and August, there is relatively little precipitation in winter. By the end of 2020, the city’s park area was 5913.60 hm2, built-up area green coverage reached 22,865 hm2 and built-up area green coverage rate reached 41.5% [28]. We selected the area within the fifth ring road of Changchun, with a width of 25 km from east to west, a length of 35 km from north to south, and an area of 50,400 hm2 as the research object (Figure 1). Urban forests are mainly composed of arbors and shrubs, among which Salix matsudana Koidz., Populus davidiana Dode., Pinus sylvestris var. mongolica Litv. are the main plant community trees, and the main shrubs conclude Prunus triloba Lindl. and Syringa oblata Lindl.

2.2. Fieldwork and Plot Design

The method of stratified random sampling was used to allocate the sample plots. The area of different forest types was extracted from Google earth images by manual visual interpretation, then a grid of 2 km × 2 km was divided, and the sample points were randomly laid according to the size of the area of each type of urban forests in each grid. The classification of urban forests adopted the method of He Xingyuan et al. and was divided into three categories according to their function, geographical location and management approach [29]. In this study, the urban forests were divided into attached forest (AF), landscape and relaxation forest (LF) and road forest (RF). The size of the plots was 400 m2, and a total of 299 plots were investigated, AF (96), LF (80) and RF (123). Details for the number of trees, species richness, DBH higher than 2 cm at the above ground 1.3 m and tree height in every plot were recorded (Table 1).

2.3. Urban Forest Plant Diversity attributes and Biomass Calculation

In each sample plot, the species names of arbors and shrubs, the abundance of each species were recorded. The Shannon–Wiener index (H′), the Evenness index (J′) and the Margalef index (D) of each plot were calculated as follows.
Shannon - Wiener   index   H = i = 1 S RA i   ( ln RA i )  
Evenness   index   J = H ln ( S )  
Margalef   index   D = S 1 ln ( N )  
where S is the number of species, RAi is relative density of species i, N is the sum of the number of individuals of all species.
The estimation of AGB dry weight of individual trees in urban forests was based on allometric growth equation (Table A1). The selection of equation was based on the near-earth principle [30,31]. If no suitable equation was available for a species, the allometric equations for the species of the same family or genus could be adopted. If the allometric equations for the species of the same family or genus were still lacking, the general equation was adopted [32,33,34,35]. Since urban trees required daily climbing shears and management, their aboveground biomass was less than that of natural forests. Therefore, the estimation of the biomass of trees in urban forests should be multiplied by a coefficient of 0.8 [36].

2.4. Statistical Analysis

For finding the differences of each tested parameter in different forest types, the differences of structural attributes and diversity attributes of different forest types were examined by one-way analysis of variance. All these analyses were performed using SPSS 23.0 (SPSS, Chicago, FL, USA). Using the violin diagram in RStudio clearly showed the distribution of different values of each index in different forest types, showing where the median was located, which was beneficial to control the attributes of each forest type from a macro perspective. Structural equation modeling (SEM) was performed to determine the relationships between complex associations, which built the relationship between objects such as structure attributes, species diversity attributes, biomass, etc. It was important to deal with latent variables (data that could not be directly measured). SEM was implemented using the lavaan package in R software [37].

3. Results

3.1. Distribution of Structural and Diversity Attributes

Structural attributes and AGB differed significantly among different types of urban forests. Overall, the median structural attributes and AGB of AF were smaller than those of LF and RF. The median of both Height and AGB were the largest for LF, and the median of both CW and DBH were the largest for RF. The AGB between LF and AF were significantly different (Figure 2a, p < 0.01). LF had the highest average AGB of 3331.16 kg, and AF had the lowest average value of 2327.13 kg. The distribution trend of CW and DBH was similar, and RF was significantly different from both other forest types (Figure 2b,c, p < 0.01). CW and DBH had the largest mean value in RF, and the ratio of their both maximum and minimum values is greater than 8. The tree heights of both LF and RF were significantly different from those of AF, with the highest mean value of LF is 7.44 m and the lowest mean value of AF is 5.94 m (Figure 2d).
Significant differences were found among all forest types in the diversity indexes used for the analysis. For the H′, the larger and smaller values of AF and LF were less and concentrated in the middle position (Figure 3a). The RF from low to high was represented as a ‘more-less-more-less’ situation. Interestingly, the distribution of J′ and SR were very characteristic. The J′ in each forest type was distributed in a ‘T’ shape, while the SR showed an inverted ‘T’ shape (Figure 3b,c), the RF was expressed as ‘more-less-more’. The SR was relatively concentrated between 1 and 10, the most was only 19 species of AF. The distribution of D was also relatively unstable (Figure 3d).

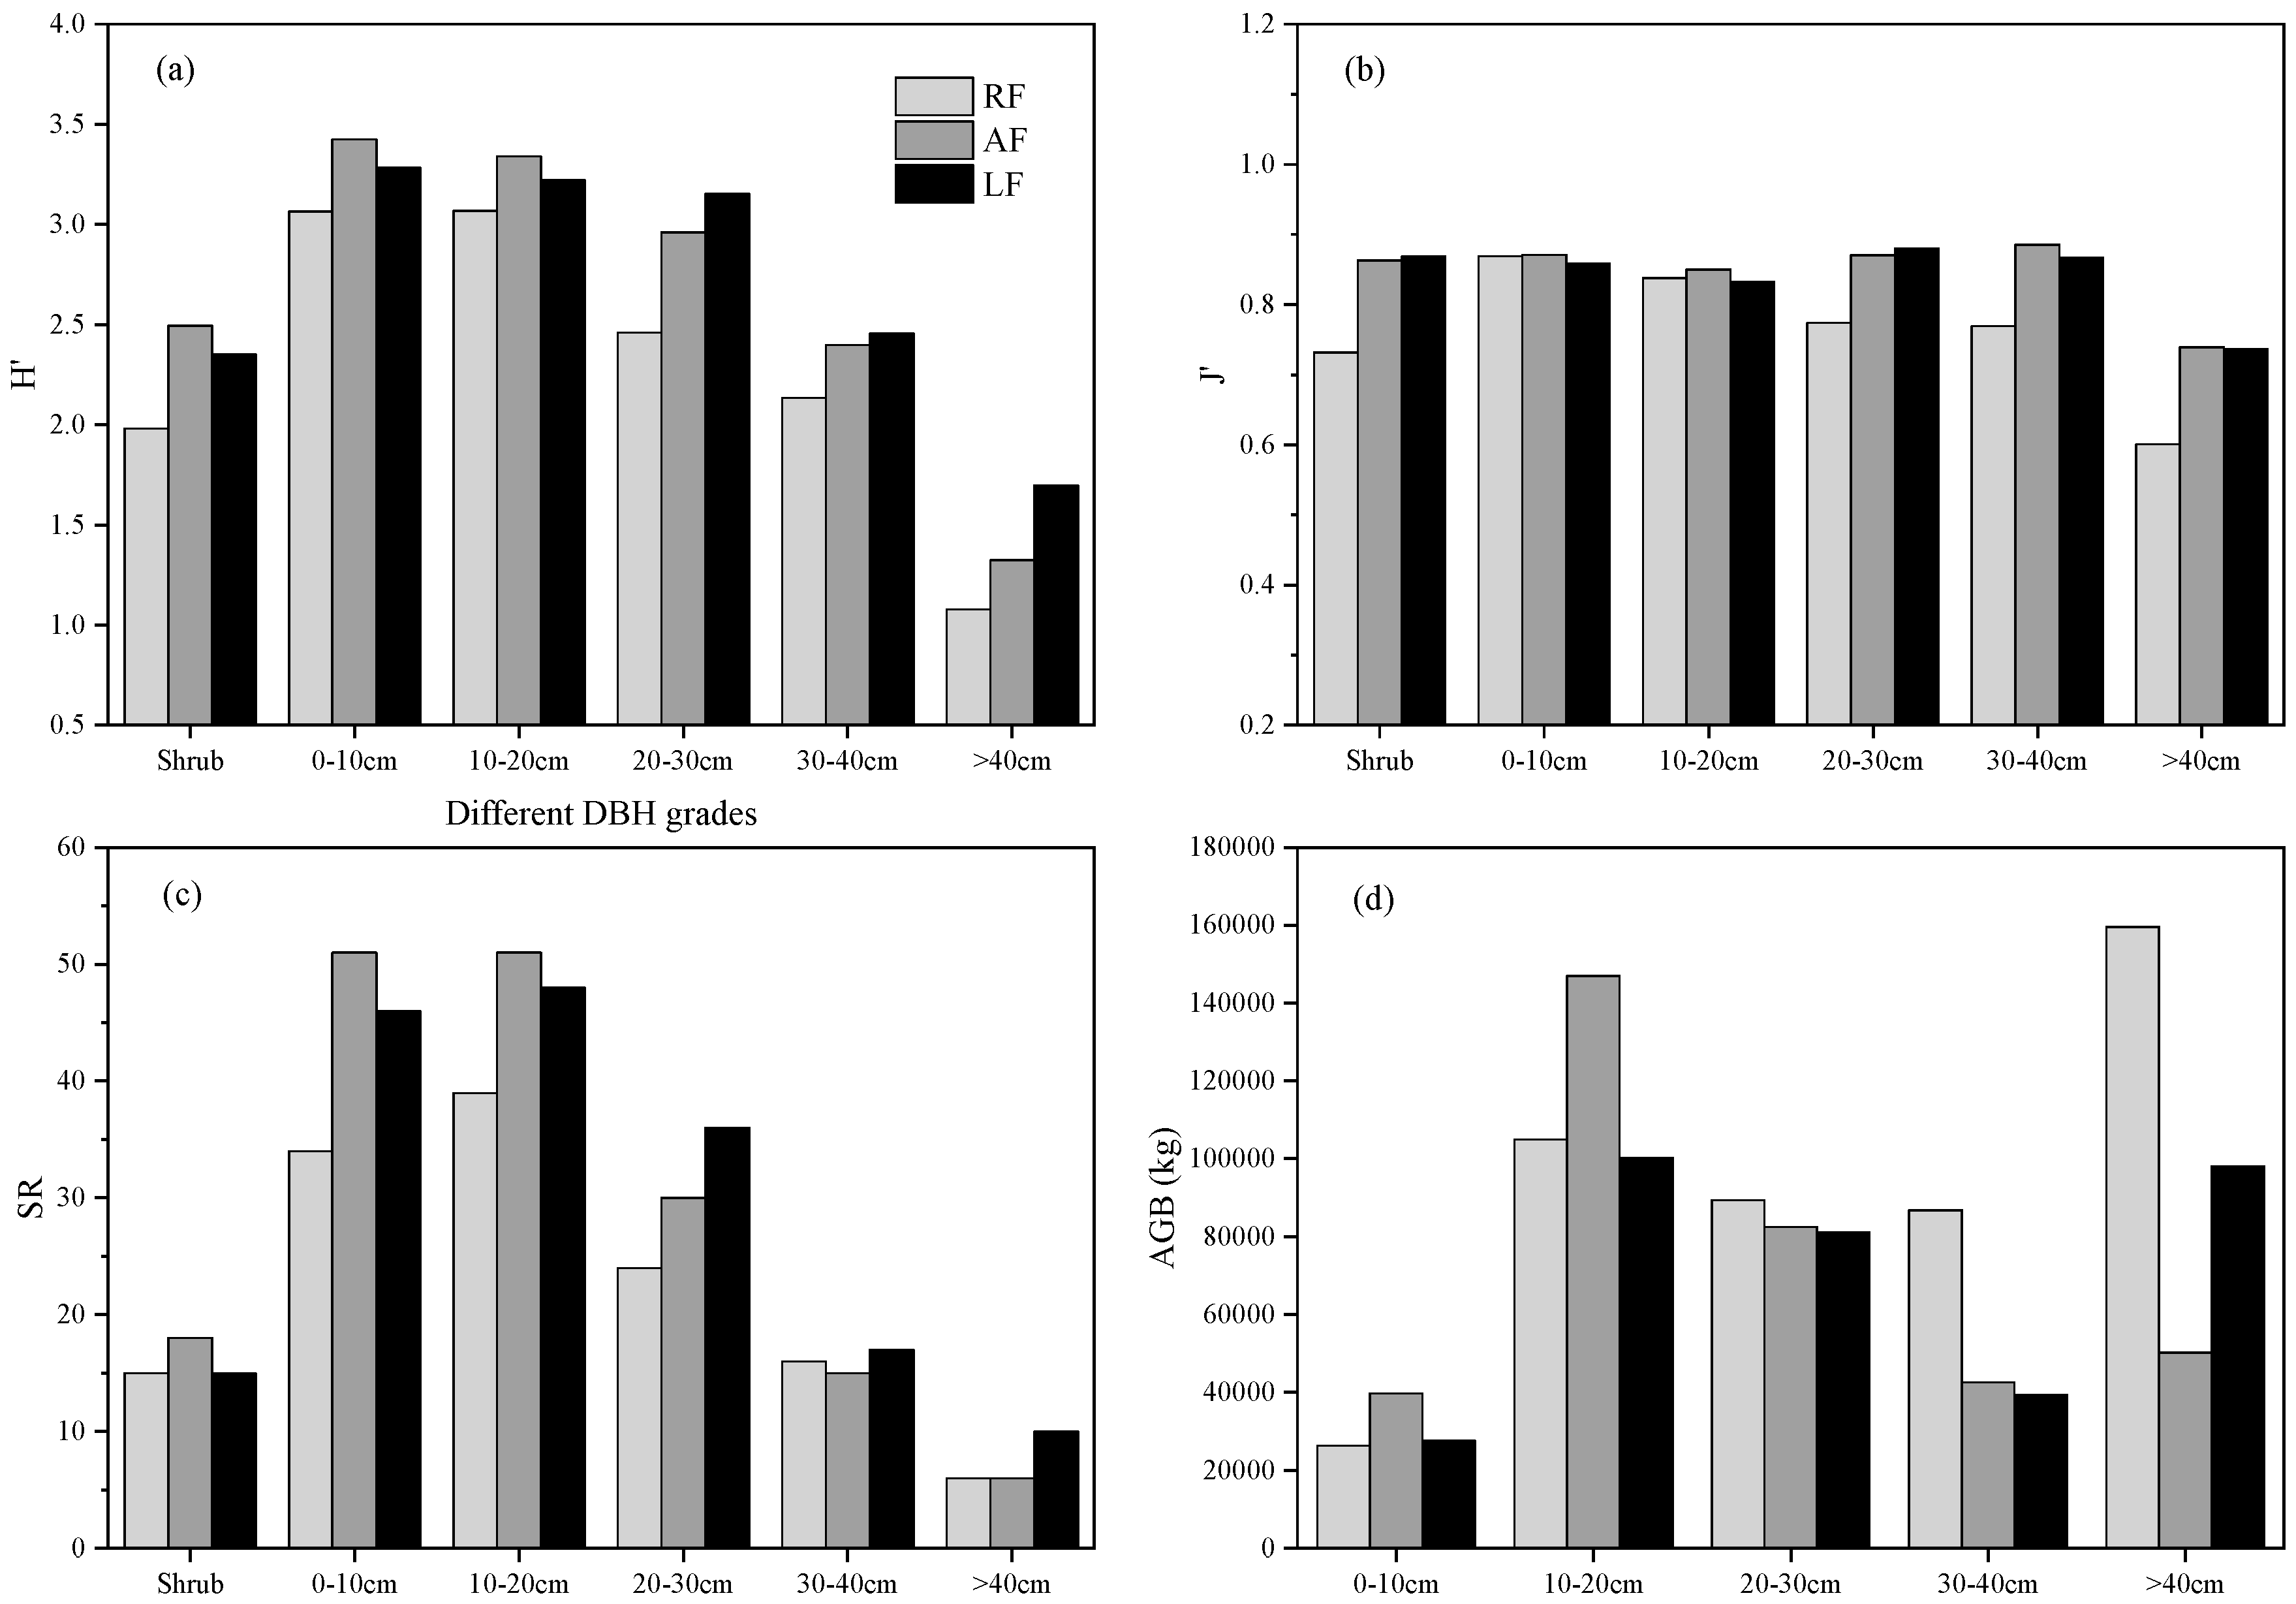
3.2. Species Diversity and AGB of Different DBH Grades

The H′ decreased gradually with the increase in tree diameter at breast height. The H′ of different types of forests with different DBH grades showed that the diversity was the highest at 0–10 cm, which were 3.42 (AF), 3.28 (LF) and 3.07 (RF) (Figure 4a). The variation of J′ of different DBH grades was relatively gentle, and did not reach a peak like the richness and diversity index H′ (Figure 4b). Except for trees with DBH grades >40 cm, the evenness of other trees and shrubs at DBH grades was low. As shown in Figure 4c, the species richness of trees in the 0–20 cm DBH grades in different types of urban forests was relatively large, and they were all in the order of AF > LF > RF. The species richness in the grade of 10–20 cm DBH was more than 5 times that of >40 cm DBH grade, peak at the 10–20 cm DBH grade. The AGB distribution attributes of different DBH grades showed that the AGB of trees was higher than shrubs, and the AGB of different types of urban forests and the overall level basically showed a maximum peak at 10–20 cm, accounting for 31% of the total AGB (Figure 4d).

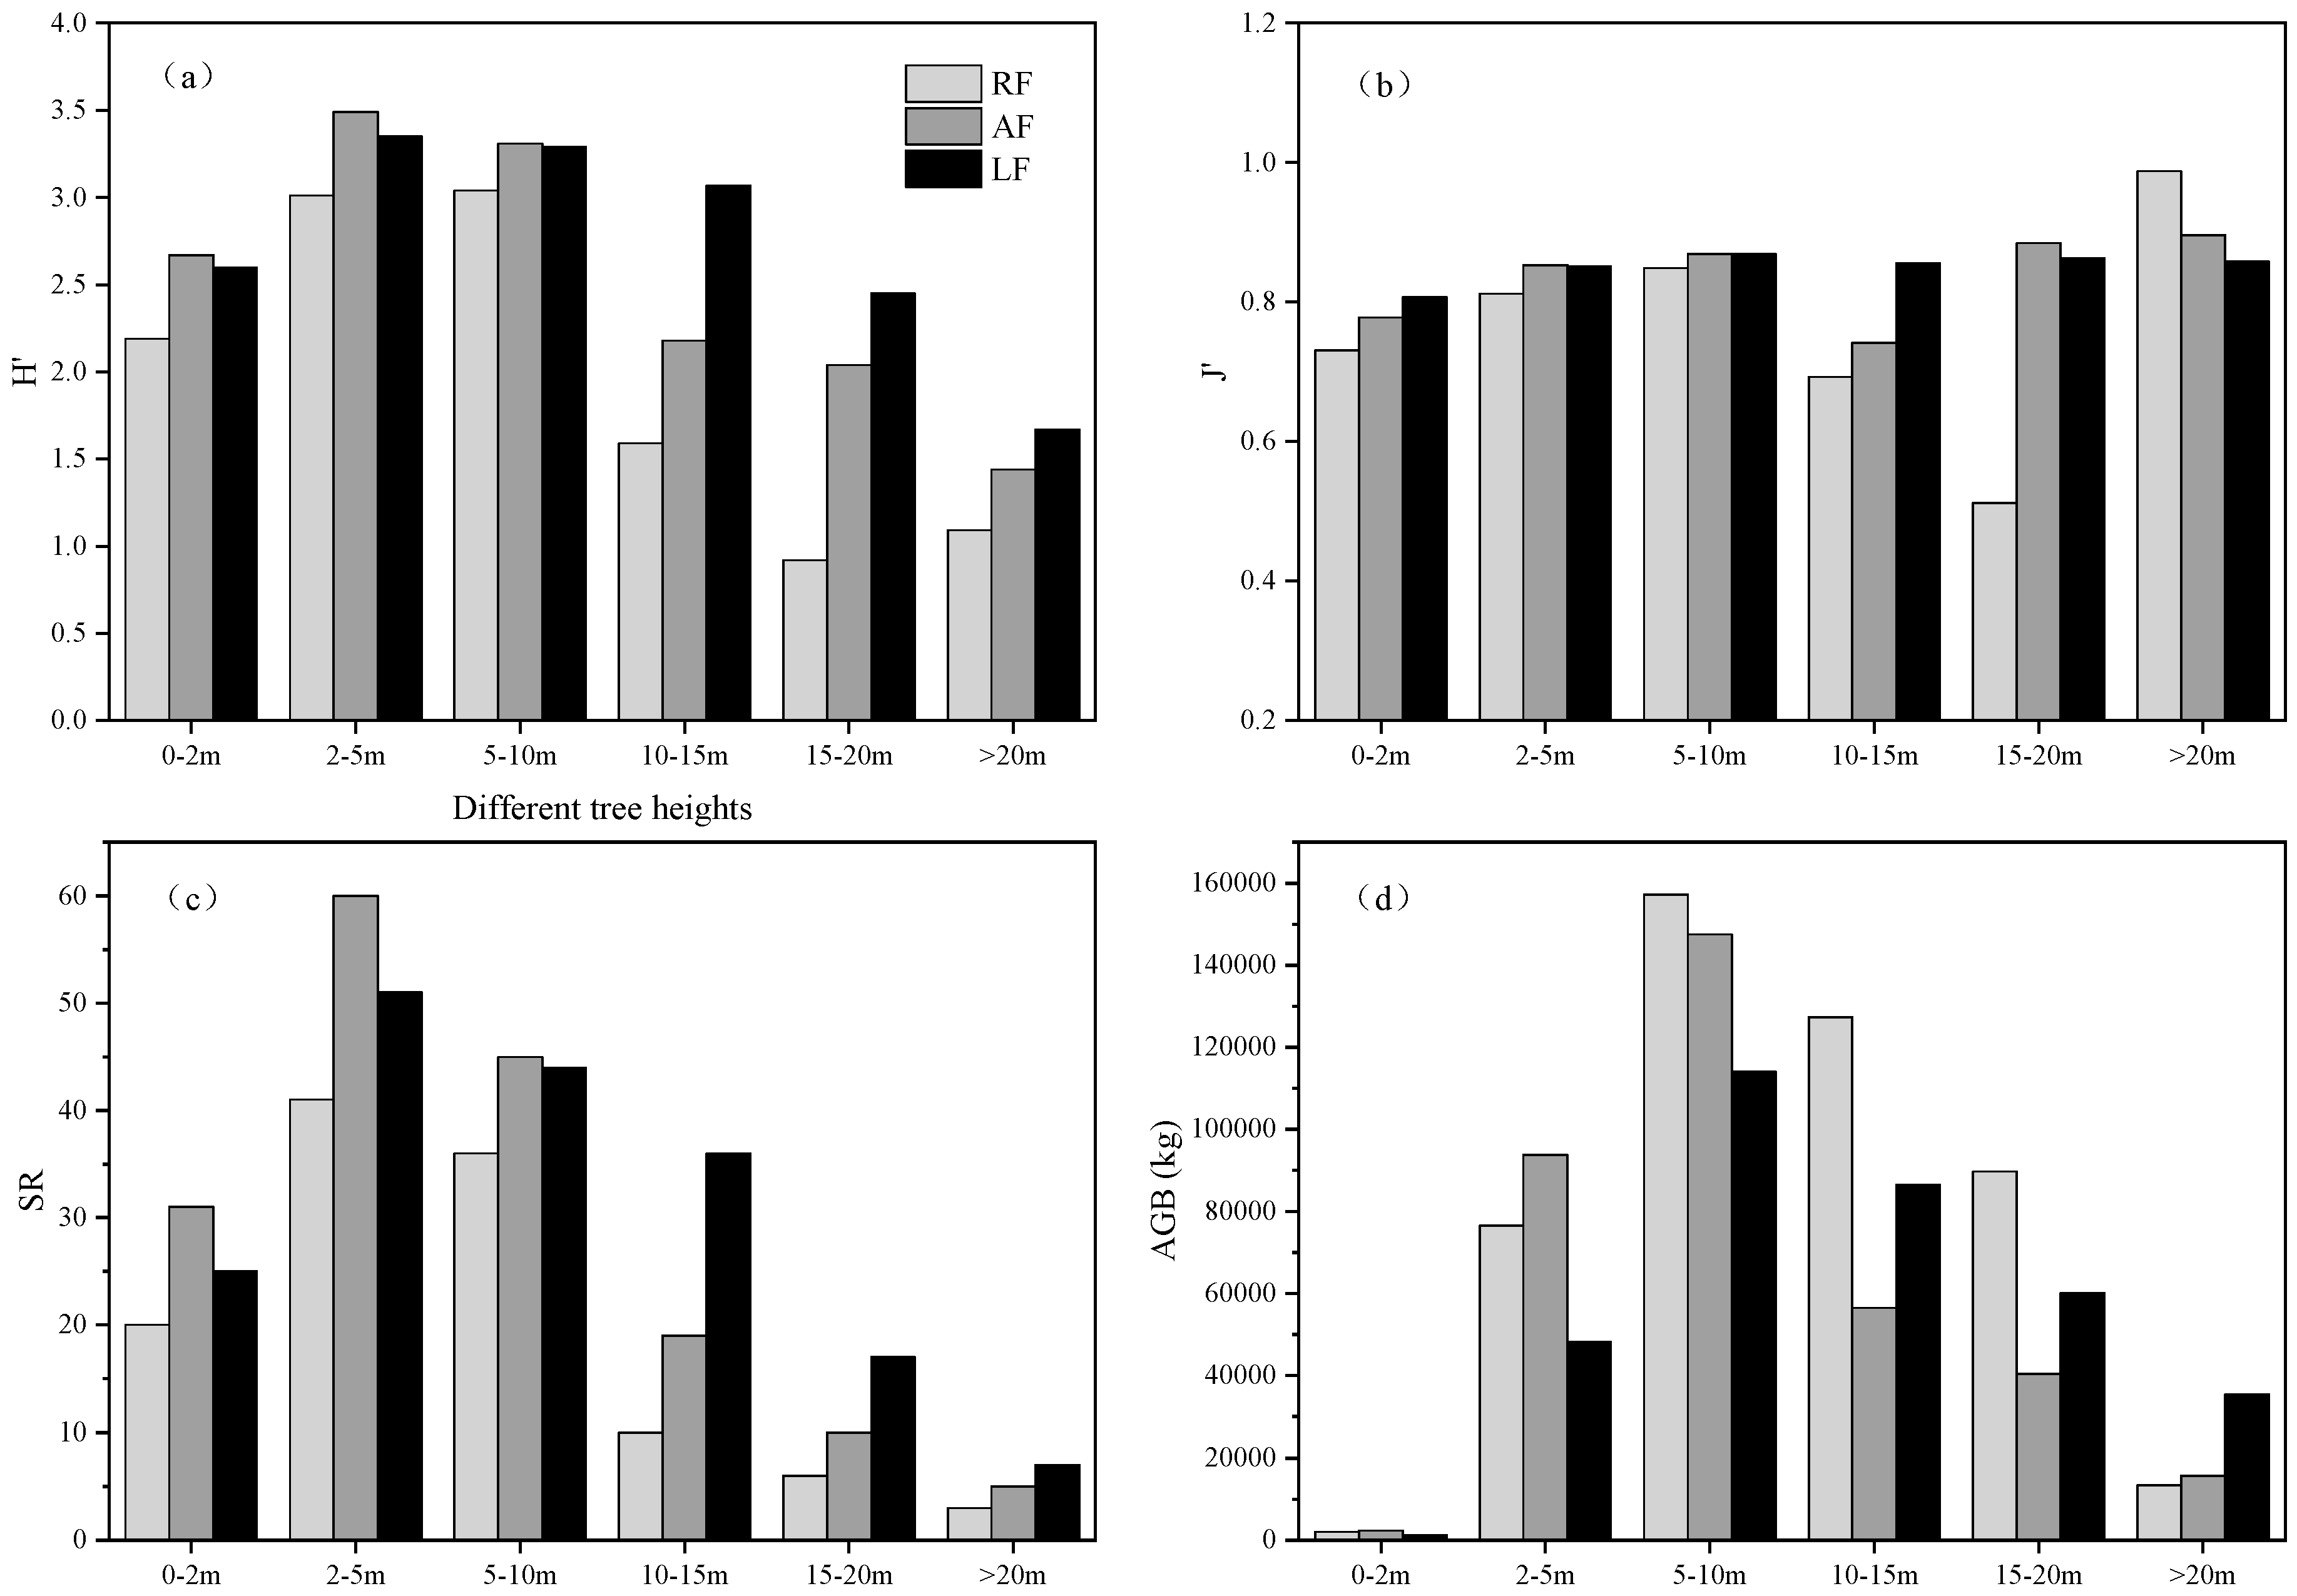
3.3. Species Diversity and AGB of Different Tree Height Grades

Among them, the order of H′ at the tree level in different forest types followed the same trend as the overall vegetation. Trends in overall species diversity and richness of vegetation with different tree height were similar (Figure 5a). In the variation range of AF and LF, 0–5 m showed an upward trend, while RF showed a gradual increase from 0–2 m to 5–10 m and reached a peak. In different types of urban forests, AF had the same trend as the overall vegetation, the uniformity J′ of LF varied gently among different tree height grades, ranging from 0.81 to 0.87 (Figure 5b). While the RF showed that the uniformity was the best when the tree height reached >20 m. The overall species richness among different tree height grades showed an increasing trend from 0–2 m to 2–5 m (Figure 5c). When the tree height was greater than 2–5 m, the species richness gradually decreased with the increase in tree height. The AGB distribution attributes of different tree height grades showed that the overall vegetation AGB gradually increased from 0 to 10 m with the increase in tree height grades, and reached a maximum of 38.75 × 10⁴ kg when the tree height grades reached 5–10 m (Figure 5d). The distribution attributes of AGB in different types of urban forests at different tree height grades had the same regularity.

3.4. Relationship between Structure Attributes, Diversity Attributes and Above-Ground Biomass

As shown in Figure 6, structural equation modeling (SEM) was constructed for the whole and LF, respectively. The results showed that, on the whole, forest type directly affected structure and diversity attributes, which, in turn, had further direct effects on biomass. The contribution of structural attributes to AGB was about 62.8% and the contribution of diversity to AGB was 27.1%; the contribution of direct effect was 87.3% and the contribution of indirect effect was 21.5%. Forest type did not directly affect biomass-related parameters, i.e., the effect of forest type on AGB was indirect. The indirect effect of forest type on AGB improvement through SR (0.027, p < 0.01) was weaker than CW (0.032, p < 0.01). The direct effect of DBH on AGB (0.75, p < 0.001) was three times higher than H′ (0.20, p < 0.001), and CW and SR also had significant direct effects on AGB with approximately the same coefficients (0.20 to 0.24). In LF, DBH, as a representative of structural attributes, had the most direct effect on AGB (0.59, p < 0.001). The graph showed that the direct effect of CW on AGB was also significant (−0.08, p < 0.001). Either CW or DBH, SR was stronger than H′ in mediating the indirect effects of both on AGB. The indirect effect of CW on AGB through SR (−0.091, p < 0.01) was 14 times greater than the indirect effect on AGB through H′ (0.006, p < 0.01). The situation was exactly the same in CW, which also showed the more significant role of SR.

4. Discussion

4.1. Differences in Structural and Diversity Attributes among Different Types of Urban Forests

For different urban forest type, the diversity indexes and AGB distributed among different DBH grades and height grades varied greatly. Meta-analysis of the competitive pressures faced by different types of forests indicates that road forests are under greater pressure to survive due to their restricted habitat [38]. Related studies have shown that tree structure and morphological attributes are also influenced by competition among trees for water and other resources, which leads to uneven biomass distribution [39,40]. Smaller DBH faces greater competitive pressure than larger DBH and is often eliminated from competition for resources [41]. RF had the highest mean structural attributes (DBH and CW) and LF had the highest mean tree height and AGB. In the comparison of RF and AF in different urban forests, the mean DBH, tree height and CW were higher in Harbin than in Changchun [42]. Among them, the tree height and DBH of RF in Harbin were 1.15 times higher than those in Changchun [41]. Therefore, cultivation management should be strengthened and reasonably dense planting should be undertaken to create a good living space for the trees in the attached forest [43,44,45]. At the same time, focusing on improving plant configuration for RF, the current situation of unreasonable configuration of family, genus and species could be alleviated by planting additional street trees such as Catalpa ovata, Juniperus chinensis L. and Pinus sylvestris var. mongholica Litv. [46,47].

4.2. Attributes of Diversity and Biomass Distribution between Different DBH Grades and Tree Height Grades

The AGB distribution varied more significantly among different DBH grades and tree height grades, while the diversity attributes (H′, J′, SR) did not vary significantly. In the study, the H′ gradually decreased with increasing DBH, and the same was true for different tree height classes. Therefore, it was hypothesized that as the trees became thicker and taller, they produced some disturbance or competition for resources to other plant species, so that the diversity and stability of woody plant community structure were affected [48]. The change in J′ for different DBH classes was relatively flat, and the values did not reach the same significant change as the richness and H′. This result is contrary to the sharp decrease in J′ with plant growth in the survey of communities in northwest China [49]. This may be due to the high degree of soil salinization in northwest China, while the soils in Changchun are fertile and have good physicochemical properties. The DBH grade of plants tends to have a positive effect on species richness [50]. In different types of urban forests, the species richness of trees with DBH of 0–10 cm and 10–20 cm grades were relatively large, and they were all in the order AF > LF > RF. The results of this study are consistent with those of a study in a tropical montane rainforest in Xishuangbanna [51], which together confirm that species richness gradually decreases with increasing DBH. The AGB of trees was much higher than that of shrubs, and the AGB of different types of urban forests reached the maximum at DBH of 10–20 cm and tree height of 5–10 m. The currently commonly observed contribution of biodiversity to productivity may be due to the fact that diversity promotes tree growth or improves survival, thus increasing AGB [52]. In the planning, it is important to overcome the problems of community structure and species monotony to try to build a multi-layered structure of arbor–shrub–grass.

4.3. Relationship between Structural Attributes, Diversity Attributes and Biomass of Urban Forests

AGB was influenced by structural attributes and diversity attributes, and direct and indirect interplay constituted a complex and stable network of influences. The results of this study confirmed the hypothesis presented in the introduction that structural and diversity attributes had positive effect on biomass, but the effect varied between different forest types. Previous studies showed that the relationship between species diversity and ecological functions may be dynamic fluctuations in diversity attributes [53]; it has also been suggested that diversity is related to production and biomass with both linear positive and progressive positive correlations [54]. In this study, the indirect effect of forest type on AGB improvement through SR was weaker than CW. In LF, the direct effect of CW on AGB was very pronounced. The indirect effect of CW on AGB through SR was stronger than the indirect effect on AGB through H′, which also indicated a more pronounced effect of SR. Furthermore, a direct positive correlation between species richness and above-ground biomass was found during a survey of primary pine forests [55]. In this study, the effect of DBH on AGB was found to be significantly greater than CW in LF, indicating that DBH could more easily and substantially enhance AGB. The above results showed that H′ could be significantly enhanced by adjusting the DBH and CW of trees, while reasonable interventions on tree height could also contribute to the enhancement of J′. It has been pointed out that diversity will have a great enhancement on biomass and productivity, while it will increase this effect with time [56], this coincided with our results. Certainly, two major aspects, diversity and structure, act together to synergistically enhance and complement each other in regulating biomass [57].

5. Conclusions

This study explored the relationship between structure attributes, diversity attributes and biomass of different forest types in Changchun. The results showed that the relationship between structural-diversity attributes and biomass was better in the LF. There was no significant relationship between species attributes and biomass in other forest types. In LF, either CW or DBH, SR was stronger than H′ in mediating the indirect effects of both on AGB. Additionally, the RF had the highest biomass among the three forest types, which showed that it had great ecological services, but its SR was the lowest. By examining the distribution of vegetation diversity attributes for different DBH grades, we found that the SR and H′ of shrubs were lower than those of trees. The H′, J′, and SR of RF were lower than those of AF and LF under different tree height grades. When developing other types of urban forests, it is also important to consider a balanced and reasonable enhancement of species diversity in RF, and to enhance the richness of different diameter at breast height grades and tree height grades. The results provide a reference for the structural classification, utilization and development of urban forests. Furthermore, it is important for the elevation of urban ecosystem services and the residents’ well-being.

Author Contributions

D.Z. and C.G. designed the research, supervised the data analysis. J.W. and Z.W. and Y.W. collected and analyzed the field data. Figures were prepared by J.W. and Z.W. The manuscript was written by J.W., and revised by D.Z., C.G. and C.Z. All authors have read and agreed to the published version of the manuscript.

Funding

This work was supported by the National Natural Science Foundation of China (Grant No. 41601094) and the Young Scholar Climbing Program of Changchun University (Grant No. ZKP202015).

Acknowledgments

We appreciate the editor and the anonymous reviewers for their meaningful and constructive suggestions on this manuscript.

Conflicts of Interest

The authors declare no conflict of interest.

Appendix A

Table A1. Dry biomass equations of various trees and shrubs [32].
Latin NameAllometric Growth EquationReference
PlatycladusBag = Bstem + Bbranch + BleafBstem = 131.38 × (D2H) 0.5968 + 36.31 × (D2H) 0.6759Bbranch = 27.41 × (D2H) 0.5974 + 49.66 × (D2H) 0.5978 + 5.52 × (D2H) 0.5876Bleaf = 37.86 × (D2H) 0.5977[30]
Pinus sylvestris L.var. mongolicaBag = Bstem + Bbranch + BleafBstem = 0.0438 × (D2H) 0.8862Bbranch = 0.02388 × D4.1913H–2.3076Bleaf = 0.1083 × D2.7169H–1.3955[31]
Juglans mandshuricaBag = 0.1717 × D2.286 [33]
Betula platyphyllaBag = 0.1443 × D2.366 [33]
Pinus koraiensisBag = 0.1723 × D2.143 [33]
PopulusBag = 0.066 × D2.557 [33]
Phellodendron amurenseBag = 0.0876 × D2.330 [33]
Larix gmeliniiBag = 0.0947 × D2.451 [33]
Arbor General Equation Bag = 0.0881 × D2.466 [33]
AcerBag = 0.0851 × D2.534 [33]
FraxinusBag = 0.1369 × D2.409 [33]
TiliaBag = 0.0403 × D2.658 [33]
Quercus mongolicaBag = 0.1006 × D2.455 [33]
Spiraea salicifoliaBag = 0.0931 × CAH0.913 [34]
Shrubs General Equation Bag = 0.1008 × CAH0.926 [34]
Philadelphus schrenkiiBag = 0.0345 × H2.50 [34]
LoniceraBag = 0.1809 × CA1.395 [34]
Pinus tabulaeformisBag = Bstem + Bbranch + BleaBstem = 0.11 × D2.35Bbranch = 0.01 × D2.59Bleaf = 0.0049 × D2.49[35]
UlmusBag = Bstem + Bbranch + BleaBstem = 0.044 × D2.87Bbranch = 0.0075 × D2.67Bleaf = 0.0029 × D2.50[35]
Robinia pseudoacaciaBag = Bstem + Bbranch + BleaBstem = 0.069 × D2.53Bbranch = 0.068 × D1.88Bleaf = 0.0014 × D3.27[35]
Picea asperataBag = Bstem + Bbranch + BleaBstem = 0.058 × D2.49Bbranch = 0.013 × D2.42Bleaf = 0.082 × D2.36 [35]
Notes: Bag (kg) represents the biomass for the woody plant above ground; Bleaf is biomass for leaf; Bbranch is biomass for branch; Bstem is biomass for stem; H (m) is the tree height; D (cm) is the diameter at breast height (DBH); CA (cm2) is the crown area.

References

  1. Alvey, A.A. Promoting and preserving biodiversity in the urban forest. Urban For. Urban Green. 2006, 5, 195–201. [Google Scholar] [CrossRef]
  2. Moro, M.F.; Castro, A.S.F. A check list of plant species in the urban forestry of Fortaleza, Brazil: Where are the native species in the country of megadiversity? Urban Ecosyst. 2014, 18, 47–71. [Google Scholar] [CrossRef]
  3. Zhang, D.; Wang, W.; Zheng, H.; Ren, Z.; Zhai, C.; Tang, Z.; Shen, G.; He, X. Effects of urbanization intensity on forest structural-taxonomic attributes, landscape patterns and their associations in Changchun, Northeast China: Implications for urban green infrastructure planning. Ecol. Indic. 2017, 80, 286–296. [Google Scholar] [CrossRef]
  4. Kendal, D.; Dobbs, C.; Lohr, V.I. Global patterns of diversity in the urban forest: Is there evidence to support the 10/20/30 rule? Urban For. Urban Green. 2014, 13, 411–417. [Google Scholar] [CrossRef]
  5. Dallimer, M.; Irvine, K.N.; Skinner, A.M.J.; Davies, Z.G.; Rouquette, J.R.; Maltby, L.; Warren, P.H.; Armsworth, P.; Gaston, K.J. Biodiversity and the Feel-Good Factor: Understanding Associations between Self-Reported Human Well-being and Species Richness. BioScience 2012, 62, 47–55. [Google Scholar] [CrossRef] [Green Version]
  6. Nowak, D.J.; Hoehn, R.E.; Bodine, A.R.; Greenfield, E.J.; O’Neil-Dunne, J. Urban forest structure, ecosystem services and change in Syracuse, NY. Urban Ecosyst. 2016, 19, 1455–1477. [Google Scholar] [CrossRef]
  7. Escobedo, F.J.; Clerici, N.; Staudhammer, C.L.; Corzo, G.T. Socio-ecological dynamics and inequality in Bogotá, Colombia’s public urban forests and their ecosystem services. Urban For. Urban Green. 2015, 14, 1040–1053. [Google Scholar] [CrossRef]
  8. Cavanaugh, K.C.; Gosnell, J.S.; Davis, S.L.; Ahumada, J.; Boundja, P.; Clark, D.B.; Mugerwa, B.; Jansen, P.; O’Brien, T.G.; Rovero, F.; et al. Carbon storage in tropical forests correlates with taxonomic diversity and functional dominance on a global scale. Glob. Ecol. Biogeogr. 2014, 23, 563–573. [Google Scholar] [CrossRef]
  9. Paquette, A.; Messier, C. The effect of biodiversity on tree productivity: From temperate to boreal forests. Glob. Ecol. Biogeogr. 2011, 20, 170–180. [Google Scholar] [CrossRef] [Green Version]
  10. Li, Y.; Dong, S.; Liu, S.; Su, X.; Wang, X.; Zhang, Y.; Zhao, Z.; Gao, X.; Li, S.; Tang, L. Relationships between plant diversity and biomass production of alpine grasslands are dependent on the spatial scale and the dimension of biodiversity. Ecol. Eng. 2019, 127, 375–382. [Google Scholar] [CrossRef]
  11. Vilà, M.; Inchausti, P.; Vayreda, J.; Barrantes, O.; Gracia, C.; Ibáñez, J.J.; Mata, T. Confounding Factors in the Observational Productivity-Diversity Relationship in Forests. In Forest Diversity and Function: Temperate and Boreal Systems; Scherer-Lorenzen, M., Körner, C., Schulze, E.-D., Eds.; Springer: Berlin/Heidelberg, Germany, 2005; pp. 65–86. [Google Scholar] [CrossRef]
  12. Mensah, S.; du Toit, B.; Seifert, T. Diversity–biomass relationship across forest layers: Implications for niche complementarity and selection effects. Oecologia 2018, 187, 783–795. [Google Scholar] [CrossRef] [PubMed]
  13. Naeem, S.; Duffy, J.E.; Zavaleta, E. The Functions of Biological Diversity in an Age of Extinction. Science 2012, 336, 1401–1406. [Google Scholar] [CrossRef] [PubMed] [Green Version]
  14. Pyles, M.V.; Prado-Junior, J.A.; Magnago, L.F.S.; de Paula, A.; Meira-Neto, J.A.A. Loss of biodiversity and shifts in aboveground biomass drivers in tropical rainforests with different disturbance histories. Biodivers. Conserv. 2018, 27, 3215–3231. [Google Scholar] [CrossRef]
  15. Hooper, D.U.; Vitousek, P.M. The Effects of Plant Composition and Diversity on Ecosystem Processes. Science 1997, 277, 1302–1305. [Google Scholar] [CrossRef] [Green Version]
  16. Tilman, D.; Wedin, D.; Knops, J. Productivity and sustainability influenced by biodiversity in grassland ecosystems. Nature 1996, 379, 718–720. [Google Scholar] [CrossRef]
  17. Ni, J.; Wang, G.; Bai, Y.; Li, X. Scale-dependent relationships between plant diversity and above-ground biomass in temperate grasslands, south-eastern Mongolia. J. Arid Environ. 2007, 68, 132–142. [Google Scholar] [CrossRef]
  18. Zhang, Y.; Chen, H.Y.H.; Reich, P.B. Forest productivity increases with evenness, species richness and trait variation: A global meta-analysis. J. Ecol. 2012, 100, 742–749. [Google Scholar] [CrossRef]
  19. Li, S.; Su, J.; Lang, X.; Liu, W.; Ou, G. Positive relationship between species richness and aboveground biomass across forest strata in a primary Pinus kesiya forest. Sci. Rep. 2018, 8, 2227. [Google Scholar] [CrossRef] [PubMed] [Green Version]
  20. Yuan, Z.; Wang, S.; Ali, A.; Gazol, A.; Ruiz-Benito, P.; Wang, X.; Lin, F.; Ye, J.; Hao, Z.; Loreau, M. Aboveground carbon storage is driven by functional trait composition and stand structural attributes rather than biodiversity in temperate mixed forests recovering from disturbances. Ann. For. Sci. 2018, 75, 67. [Google Scholar] [CrossRef]
  21. Prado-Junior, J.A.; Schiavini, I.; Vale, V.S.; Arantes, C.S.; van der Sande, M.T.; Lohbeck, M.; Poorter, L. Conservative species drive biomass productivity in tropical dry forests. J. Ecol. 2016, 104, 817–827. [Google Scholar] [CrossRef] [Green Version]
  22. Ali, A.; Yan, E.-R.; Chen, H.Y.H.; Chang, S.X.; Zhao, Y.-T.; Yang, X.-D.; Xu, M.-S. Stand structural diversity rather than species diversity enhances aboveground carbon storage in secondary subtropical forests in Eastern China. Biogeosciences 2016, 13, 4627–4635. [Google Scholar] [CrossRef] [Green Version]
  23. Chang, Y.; Wang, Z.; Zhang, D.; Fu, Y.; Zhai, C.; Wang, T.; Yang, Y.; Wu, J. Analysis of Urban Woody Plant Diversity among Different Administrative Districts and the Enhancement Strategy in Changchun City, China. Sustainability 2022, 14, 7624. [Google Scholar] [CrossRef]
  24. Baran, J.; Pielech, R.; Kauzal, P.; Kukla, W.; Bodziarczyk, J. Influence of forest management on stand structure in ravine forests. For. Ecol. Manag. 2020, 463, 118018. [Google Scholar] [CrossRef]
  25. Likongwe, P.J.; Chimaimba, F.B.; Chiotha, S.S.; Mandevu, T.; Kamuyango, L.; Garekae, H. Urban Community Power: Enhancing Urban Forest Diversity and Reversing Ecosystem Disservices in Zomba City, Malawi. Land 2021, 10, 1258. [Google Scholar] [CrossRef]
  26. Borges, E.R.; Dexter, K.G.; Pyles, M.V.; Bueno, M.L.; dos Santos, R.M.; Fontes, M.A.L.; Carvalho, F.A. The interaction of land-use history and tree species diversity in driving variation in the aboveground biomass of urban versus non-urban tropical forests. Ecol. Indic. 2021, 1291, 107915. [Google Scholar] [CrossRef]
  27. Carrus, G.; Scopelliti, M.; Lafortezza, R.; Colangelo, G.; Ferrini, F.; Salbitano, F.; Agrimi, M.; Portoghesi, L.; Semenzato, P.; Sanesi, G. Go greener, feel better? The positive effects of biodiversity on the well-being of individuals visiting urban and peri-urban green areas. Landsc. Urban Plan. 2015, 134, 221–228. [Google Scholar] [CrossRef]
  28. Changchun Statistics Bureau. Statistical Bulletin of Changchun National Economic and Social Development in 2020; Changchun Daily: Changchun, China, 2021; p. 007. [Google Scholar]
  29. He, X.; Liu, C.; Chen, W.; Guan, Z.; Zhao, G. Exploring the classification of urban forests. J. Ecol. 2004, 23, 175–178. [Google Scholar] [CrossRef]
  30. Chang, X.; Che, K.; Song, C.; Wang, J.; Li, B. Biomass and Nutrient Element Accumulation of Sabina Prezewalskii Forest Community. J. Northwest For. Coll. 1997, 12, 23–28. [Google Scholar]
  31. Jia, W.; Jiang, S.; Li, F. Biomass of Single Tree of Pinus Sylvestris Var. Mongolica in Eastern Heilongjiang. Liaoning For. Sci. Technol. 2008, 3, 5–9. [Google Scholar] [CrossRef]
  32. Zhang, D.; Zheng, H.; Ren, Z.; Zhai, C.; Shen, G.; Mao, Z.; Wang, P.; He, X. Effects of forest type and urbanization on carbon storage of urban forests in Changchun, Northeast China. Chin. Geogr. Sci. 2015, 25, 147–158. [Google Scholar] [CrossRef]
  33. Wang, C. Biomass allometric equations for 10 co-occurring tree species in Chinese temperate forests. For. Ecol. Manag. 2006, 222, 9–16. [Google Scholar] [CrossRef]
  34. Li, X.; Guo, Q.; Wang, X.; Zheng, H. Allometry of Understory Tree Species in a Natural Secondary Forest in Northeast China. Sci. Silvae Sin. 2010, 46, 22–32. [Google Scholar] [CrossRef]
  35. Liu, C.; Li, X. Carbon storage and sequestration by urban forests in Shenyang, China. Urban For. Urban Green. 2012, 11, 121–128. [Google Scholar] [CrossRef]
  36. Zhang, D.; Zheng, H.; He, X.; Ren, Z.; Zhai, C.; Yu, X.; Mao, Z.; Wang, P. Effects of forest type and urbanization on species composition and diversity of urban forest in Changchun, Northeast China. Urban Ecosyst. 2016, 19, 455–473. [Google Scholar] [CrossRef]
  37. Rosseel, Y. Lavaan: An R package for structural equation modeling and more. Version 0.5–12 (BETA). J. Stat. Softw. 2012, 48, 1–36. [Google Scholar] [CrossRef] [Green Version]
  38. Nizamani, M.M.; Harris, A.; Cheng, X.; Zhu, Z.; Jim, C.Y.; Wang, H. Positive relationships among aboveground biomass, tree species diversity, and urban greening management in tropical coastal city of Haikou. Ecol. Evol. 2021, 11, 12204–12219. [Google Scholar] [CrossRef]
  39. Hu, H.; Ye, J.; Liu, B.; Mao, L.; Smith, S.A.; Barrett, R.L.; Soltis, P.S.; Soltis, D.E.; Chen, Z.; Lu, L. Temporal and spatial comparisons of angiosperm diversity between eastern Asia and North America. Natl. Sci. Rev. 2022, 9, nwab199. [Google Scholar] [CrossRef]
  40. Ding, X.; Liu, G.; Fu, S.; Chen, H.Y. Tree species composition and nutrient availability affect soil microbial diversity and composition across forest types in subtropical China. CATENA 2021, 201, 105224. [Google Scholar] [CrossRef]
  41. Liu, C.Y.; Fang, W.J.; Cai, Q.; Ma, S.H.; Ji, C.J.; Fang, J.Y. Allometric Relationship between Tree Height and Diameter of Larch Forests in China. Acta. Sci. Nat. Univ. Pekin. 2017, 53, 1081–1088. [Google Scholar] [CrossRef]
  42. Wang, W.; Xiao, L.; Lyu, H.; Xu, H.; Zhang, B.; Zhou, W.; He, X. Structural Characteristics and Ecological Service Functions of Urban Forests: A Case Study of Harbin. In Proceedings of the 16th National Member Congress and 85th Anniversary Annual Meeting of the Botanical Society of China, Kunming, China, 10–13 October 2018; pp. 409–410. [Google Scholar]
  43. Feng, Y.; Ziegler, A.D.; Elsen, P.R.; Liu, Y.; He, X.; Spracklen, D.V.; Holden, J.; Jiang, X.; Zheng, C.; Zeng, Z. Upward expansion and acceleration of forest clearance in the mountains of Southeast Asia. Nat. Sustain. 2021, 4, 892–899. [Google Scholar] [CrossRef]
  44. Liu, D.; Zhou, C.; Keesing, J.K.; Serrano, O.; Werner, A.; Fang, Y.; Chen, Y.; Masque, P.; Kinloch, J.; Sadekov, A.; et al. Wildfires enhance phytoplankton production in tropical oceans. Nat. Commun. 2022, 13, 1348. [Google Scholar] [CrossRef] [PubMed]
  45. Forzieri, G.; Girardello, M.; Ceccherini, G.; Spinoni, J.; Feyen, L.; Hartmann, H.; Beck, P.S.A.; Camps-Valls, G.; Chirici, G.; Mauri, A.; et al. Emergent vulnerability to climate-driven disturbances in European forests. Nat. Commun. 2021, 12, 1081. [Google Scholar] [CrossRef] [PubMed]
  46. Gaggini, L.; Rusterholz, H.-P.; Baur, B. Settlements as a source for the spread of non-native plants into Central European suburban forests. Acta Oecologica 2017, 79, 18–25. [Google Scholar] [CrossRef]
  47. Vilà, M.; Vayreda, J.; Gracia, C.; Ibáñez, J.J. Does tree diversity increase wood production in pine forests? Oecologia 2003, 135, 299–303. [Google Scholar] [CrossRef]
  48. Larpkern, P.; Totland, Ø.; Moe, S.R. Do disturbance and productivity influence evenness of seedling, sapling and adult tree species across a semi-deciduous tropical forest landscape? Oikos 2011, 120, 623–629. [Google Scholar] [CrossRef]
  49. Li, Y.; Zhang, Q.-B. History of Tree Growth Declines Recorded in Old Trees at Two Sacred Sites in Northern China. Front. Plant Sci. 2017, 8, 1779. [Google Scholar] [CrossRef] [Green Version]
  50. Xiong, M.; Long, W.; Yang, X.; Huang, J.; Li, S.; Lin, M.; Wang, Q.; Lin, D.; Kang, Y. Relationship between Plant Species Diversity and Habitat in a Tropical Moist Forest. J. Zhejiang For. Sci. Technol. 2015, 35, 18–23. [Google Scholar] [CrossRef]
  51. Li, Z.; Tang, J.-W.; Zheng, Z.; Zhu, S.; Duan, W.; Song, J.; Guo, X.; Zeng, R. Tree species diversity of tropical montane rain forest in Xishuangbanna, Yunnan. Ying Yong Sheng Tai Xue Bao J. Appl. Ecol. 2005, 16, 1183–1188. [Google Scholar]
  52. Wang, X.; Dallimer, M.; Scott, C.E.; Shi, W.; Gao, J. Tree species richness and diversity predicts the magnitude of urban heat island mitigation effects of greenspaces. Sci. Total Environ. 2021, 770, 145211. [Google Scholar] [CrossRef]
  53. Chen, G.; Yang, Y.; Yang, Z.; Xie, J.; Guo, J.; Gao, R.; Yin, Y.; Robinson, D. Accelerated soil carbon turnover under tree plantations limits soil carbon storage. Sci. Rep. 2016, 6, 19693. [Google Scholar] [CrossRef] [Green Version]
  54. Luna-Kamyshev, N.M.; López-Martínez, J.O.; Vargas-Larreta, B.; Islebe, G.A.; Villalobos-Guerrero, T.F.; De La Rosa, A.V.; Reyes-Mendoza, O.; Treviño-Garza, E. Floristic Composition, Diversity, and Biomass of a Protected Tropical Evergreen Forest Belize. Trop. Conserv. Sci. 2020, 13, 1940082920915433. [Google Scholar] [CrossRef]
  55. Yan, H.; Sun, Y.; Liu, B. Effects of Competition on Drought Adaptability and Growth Decline of Pinus Koraiensis Trees. J. Beijing For. Univ. 2022, 44, 1–9. [Google Scholar] [CrossRef]
  56. Cardinale, B.J.; Wright, J.P.; Cadotte, M.W.; Carroll, I.T.; Hector, A.; Srivastava, D.S.; Loreau, M.; Weis, J.J. Impacts of plant diversity on biomass production increase through time because of species complementarity. Proc. Natl. Acad. Sci. USA 2007, 104, 18123–18128. [Google Scholar] [CrossRef] [PubMed] [Green Version]
  57. Zimudzi, C.; Chapano, C. Diversity, Population Structure, and Above Ground Biomass in Woody Species on Ngomakurira Mountain, Domboshawa, Zimbabwe. Int. J. Biodivers. 2016, 2016, 4909158. [Google Scholar] [CrossRef]
Figure 1. Study area and sample location. The different colored dots in the figure show the distribution of the different forest types in the city. The yellow dots represent attached forest (AF), red dots represent landscape and relaxation forest (LF), and blue dots represent road forest (RF). The different colored patches show the specific area sizes of the different forest types. The light green patches represent AF, the dark green patches represent LF, the yellow patches represent RF.
Forests 13 01805 g001
Figure 2. The distribution of AGB and structural and diversity attributes. (a) depicts the distribution of above-ground biomass (AGB); (b) depicts the distribution of crown width (CW); (c) depicts the distribution of diameter at breast height (DBH); (d) depicts the distribution of tree height. In the figure, the horizontal black line in the middle is the median, the box shape ranges from the lower quartile to the upper quartile and the thin black line represents the whiskers. The outer shape is the kernel density estimate (used to estimate unknown density functions in probability theory, one of the nonparametric test methods). In the figure, mean values sharing different letters are significantly different (p < 0.05), and mean values sharing the same letters are not significantly different (p > 0.05). RF, road forest; AF, attached forest; LF, landscape and relaxation forest.
Forests 13 01805 g002
Figure 3. The distribution of species diversity indexes. (a) depicts the distribution of Shannon–Wiener index (H′); (b) depicts the distribution of evenness index (J′); (c) depicts the distribution of species richness (SR); (d) depicts the distribution of Margalef index (D). In the figure, mean values sharing different letters are significantly different (p < 0.05), and mean values sharing the same letters are not significantly different (p > 0.05). RF, road forest; AF, attached forest; LF, landscape and relaxation forest.
Forests 13 01805 g003
Figure 4. Distribution attributes of species diversity indexes and above-ground biomass with different DBH grades in various forest types. (a) depicts the magnitude of Shannon–Wiener index (H′) at DBH grades for different forest types; (b) depicts the magnitude of evenness index (J′) at DBH grades for different forest types; (c) depicts the magnitude of species richness (SR) at DBH grades for different forest types; (d) depicts the magnitude of above-ground biomass (AGB) at DBH grades for different forest types. RF, road forest; AF, attached forest; LF, landscape and relaxation forest.
Forests 13 01805 g004
Figure 5. Distribution attributes of species diversity indexes and above-ground biomass at different height grade. (a) depicts the magnitude of Shannon–Wiener index (H′) at tree height grades for different forest types; (b) depicts the magnitude of evenness index (J′) at tree height grades for different forest types; (c) depicts the magnitude of species richness (SR) at tree height grades for different forest types; (d) depicts the magnitude of above-ground biomass (AGB) at tree height grades for different forest types. RF, road forest; AF, attached forest; LF, landscape and relaxation forest.
Forests 13 01805 g005
Figure 6. The SEM analysis of the effect of forest type, structures, and diversity on biomass ((a) represents the overall situation, (b) represents the situation of LF). The direct and indirect effects’ standardized coefficient (standard), statistical significance (p-value) in the table. (** indicated p < 0.01, *** indicated p < 0.001). One-way arrows represent direct causal relationships, the arrows point to the response (result), the starting point is the cause, and the mark on the line is the load; the two variables pointed by the double-headed arrows are correlated (but without a causal equation), labeled as covariance.
Forests 13 01805 g006
Table 1. Species distribution of different forest types.
QuadratNo. TreeSpecies RichnessAverage DBH (cm) Average Height (m) Dominant Species
AF25086014.105.99Picea koraiensis Nakai.
Amygdalus persica L. var. persica f. duplex Rehd.
Salix matsudana Koidz.
Syringa oblata Lindl.
LF212251 7.35Pinus sylvestris var. mongolica Litv.
15.35Fraxinus mandshurica Rupr.
Quercus mongolica Fisch. ex Ledeb.
RF24364117.337.26Salix matsudana Koidz.
Populus davidiana Dode.
Pinus sylvestris var. mongolica Litv.
Prunus triloba Lindl.
Ulmus densa Litw.
Prunus ussuriensis Kov. et Kost.
Publisher’s Note: MDPI stays neutral with regard to jurisdictional claims in published maps and institutional affiliations.

