Article

The Missing Limb: Including Impacts of Biomass Extraction on Forest Carbon Stocks in Greenhouse Gas Balances of Wood Use

1
IFEU-Institut für Energie-und Umweltforschung Heidelberg gGmbH, Wilckensstraße 3, 69120 Heidelberg, Germany
2
Environmental Research Institute, North Highland College, Castle Street, Thurso KW14 7JD, UK
3
Öko-Institut e.V., Rheinstraße 95, 64295 Darmstadt, Germany
*
Author to whom correspondence should be addressed.
Submission received: 29 December 2021 / Revised: 15 February 2022 / Accepted: 18 February 2022 / Published: 22 February 2022
(This article belongs to the Special Issue Carbon Stock and Sequestration in Forest Ecosystems)

Abstract

:
The global carbon neutrality challenge places a spotlight on forests as carbon sinks. However, greenhouse gas (GHG) balances of wood for material and energy use often reveal GHG emission savings in comparison with a non-wood reference. Is it thus better to increase wood production and use, or to conserve and expand the carbon stock in forests? GHG balances of wood products mostly ignore the dynamics of carbon storage in forests, which can be expressed as the carbon storage balance in forests (CSBF). For Germany, a CSBF of 0.25 to 1.15 t CO2-eq. m−3 wood can be assumed. When the CSBF is integrated into the GHG balance, GHG mitigation substantially deteriorates and wood products may even turn into a GHG source, e.g., in the case of energy wood. In such cases, building up forest carbon stocks would be the better option. We conclude that it is vital to include the CSBF in GHG balances of wood products to assess the impacts of wood extraction from forests. Only then can GHG balances provide political decision makers and stakeholders in the wood sector with a complete picture of GHG emissions.

Graphical Abstract

1. Introduction

To prevent global warming above 1.5 degrees Celsius compared to pre-industrial levels, the Paris Agreement requires a substantial reduction in greenhouse gas (GHG) emissions in the coming decades and a balance of remaining GHG emissions with carbon sinks by the middle of this century [1]. Forests and their ability to sequester carbon are expected to play a key role in reaching peak net GHG emissions and achieving carbon neutrality [2]. Consequently, different countries across the world are in the process of defining targets not only for their entire economy but also for carbon sinks in forests and other land uses, reflected in their nationally determined contributions [3]. At the same time, countries struggle to implement consistent policies and measures to achieve these targets. A range of complex factors need to be taken into account to accurately assess which options, including forest management and wood use, are best suited to achieve ambitious mitigation targets in forests and the entire economy.
The European Commission has recently proposed nationally binding targets for the Land Use, Land-Use Change and Forestry (LULUCF) sector in their Member States for 2030 to achieve an EU-wide net sink target of −310 Mt CO2-eq. [4]. The target for Germany was set at −30.8 Mt CO2-eq. Similarly, the German Federal Government’s Climate Protection Act requires a net sink in the LULUCF sector of −25 Mt CO2-eq. in 2030. According to Hennenberg et al. [5], this target requires a net sink in German forests of approx. −35 Mt CO2-eq. in 2030. In comparison, the GHG inventory of the German government reports −57.0 Mt CO2-eq. for forests in 2019 [6]. Recently, forests in Germany have been severely disturbed by drought, storm events and subsequent bark beetle infestation, which led to a significant decrease in forest vitality [7,8]. This resulted in a strong increase in salvage logging, which amounted to 75% of the entire annual wood removals in 2020 [9,10]. In consequence, the preliminary inventory data that are currently under review indicate that the GHG balance for forests will only amount to −52.3 Mt CO2-eq. in 2019 and −45.8 Mt CO2-eq. in 2020 [11]. Furthermore, the net sink of forests is not only influenced by natural disturbances, but also by the intensity of forest management [12]. A comparison of forest management scenarios in Germany shows that higher carbon storage can be achieved on the forest area with more extensive forest management [13,14,15,16,17,18]. Evidently, planning of mitigation measures involving forests needs to consider an intricate network of factors.
When it comes to GHG mitigation in practice, the question of the benefits and drawbacks of different options for mitigation measures arises. Is it better to increase wood production or reduce it to conserve or build up the forest carbon stock? This question cannot usually be addressed with a GHG inventory alone, since emissions arising along the process chain are reported in different sectors. The effects of material wood use on forests are assigned to the LULUCF sector, whereas emissions from harvesting occur in the agriculture sector and wood processing is considered in the industry sector. Transport is reported in the transport sector and possible substitution effects due to the displacement of fossil and mineral products such as heating oil or reinforced concrete may be relevant across all sectors. This clear sector allocation of GHG emissions is necessary to avoid double counting at the country level [19]. However, to explore the environmental impacts of the use of wood products in comparison with alternative materials, a so-called life cycle assessment (LCA) approach is required. An LCA compiles and evaluates inputs, outputs, and the potential environmental impacts of a product system throughout its life cycle [20,21]. The GHG balance as part of an LCA is suitable for determining GHG emissions and GHG savings along the process chain of wood products and comparing these with alternatives, e.g., fossil and mineral products. The results can be used by decision makers and consumers to favor climate-friendly wood products over less climate-friendly options.
Several studies have documented that reductions in GHG emissions can be achieved with the use of wood products as material and energy sources [22,23,24,25,26]. The EU Renewable Energy Directive (RED II [27]) assumes a reduction in GHG emissions of over 80% in comparison with a fossil fuel reference where stem wood is used for energy purposes in the heating and cooling sector (transport distance < 2500 km). However, a common weakness in the GHG accounting of wood uses lies in the oversimplification of the balance of forest carbon stock. In fact, GHG balances of wood products commonly assume sustainable forest management as a default. Thus, the underlying assumption is that the amount of timber felled for a product grows back on neighboring areas simultaneously. Therefore, emissions from a forest caused by forest management and wood harvesting are expected to be net zero and effects from forest management are not further considered in the GHG balance, cf. [28]. However, if harvesting is reduced, the storage capacity of the forest changes in response. Trees not harvested still store carbon and continue to grow and fix carbon in addition to the trees in neighboring areas. At the same time, tree mortality might change with changing tree density and tree age.
In light of the common neglect of the impacts of forest management practices, the aim of this paper is to integrate the carbon storage balance in forests (CSBF) into the GHG balance of wood use and to assess the relevance of the CSBF in a case study modelling GHG balances for wood use in Germany.

2. Materials and Methods

For the case study, GHG balances were calculated for six wood product groups, i.e., construction wood, chipboard and medium density fiberboard (MDF) for material use and wood chips, pellets and firewood for energy use. A temporal reference is required for the calculation of the carbon storage of wood products and—depending on the methodology—also for the CSBF. Since the overall objective is to reduce GHG emissions by 2050, the period from 2020 to 2050 (30 years) was defined as the credit period for the following calculations.

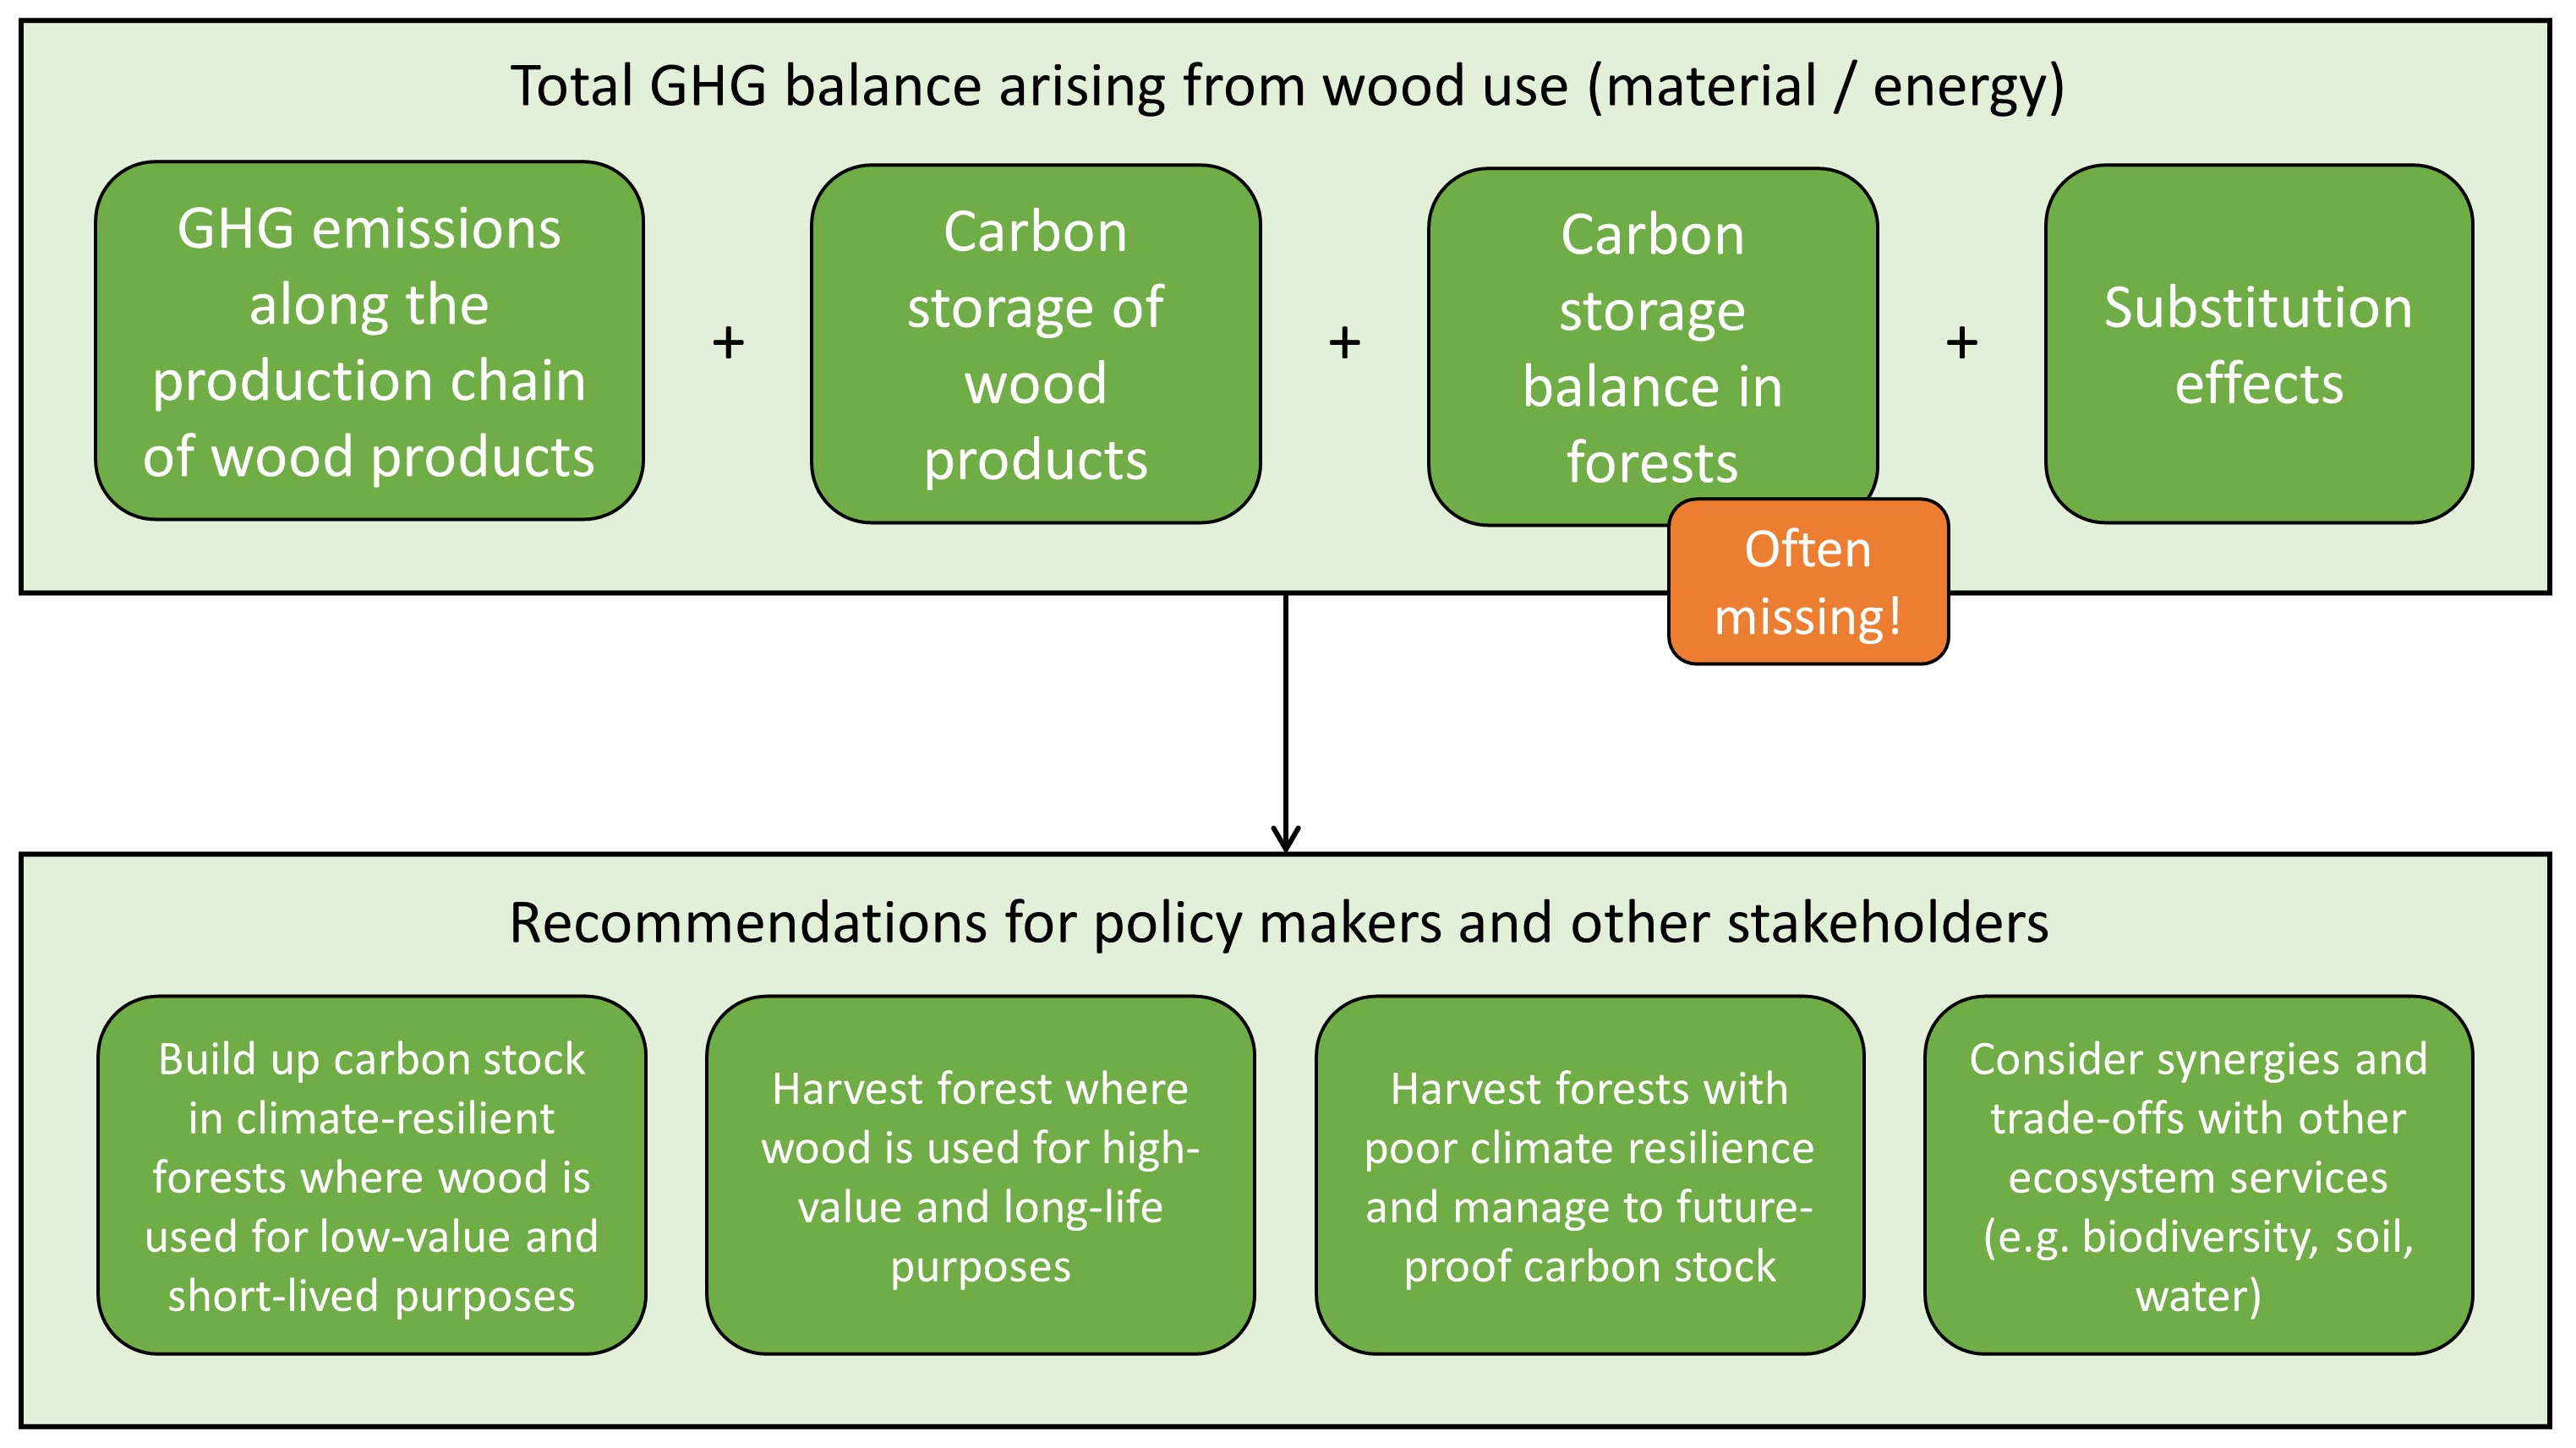
2.1. Total GHG Balance

Looking at the normative specifications for LCA [20,21] and carbon footprinting [29], it is undisputed that all GHG emissions directly arising from the production and use phases shall be considered for the GHG accounting of wood products. Furthermore, it is generally accepted that material use of wood not only stores carbon in the technosphere [30], but also that the substitution of non-wood products with wood products can achieve additional GHG savings [31,32]. The total GHG balance of wood products (TBWP) is calculated as:
TBWP = PCWP + CSWP + CSBF + SE
where PCWP (production chain of wood products) sums up all activities associated with wood production in the forest and for the manufacture of a specific product (including transport and use); CSWP (carbon storage of wood products) is the capacity for carbon storage in wood products; CSBF (carbon storage balance in forests) covers changes in the carbon storage capacity of the forest in response to forest management and wood harvesting activities; and SE (substitution effects) represents the GHG emissions from the substitution of non-wood products by wood products.
The GHG emission reduction (ER) achieved by a wood product is calculated in relation to the substitution of non-wood products:
ER = (PCWP + CSWP + CSBF) • SE−1
The following subchapters describe the assumptions made for these factors.

2.2. GHG Emissions along the Production Chain (PCWP)

The calculation of total GHG emissions along the production chain for wood product groups was carried out using the material flow and life cycle assessment model HoLCA based on Fehrenbach et al. [23]. This model, based on the Umberto software, has been created in accordance with the requirements of ISO 14040 [20] and ISO 14044 [21] and enables us to perform LCAs that equally meet these standards. The structure of the model represents the entire wood flow in Germany. Starting with forestry, the various processing and supply chains associated with the respective products or product groups are covered. The individual modules of HoLCA include life cycle assessment data on inputs (energy, other raw materials or chemicals, water, etc.) and outputs (emissions to air and water, waste, etc.). More detailed explanations about HoLCA are provided as Supplementary Materials Document S1.
In HoLCA, the principle of allocation can be used to break down the balance for the entire wood material flow on individual products. For the assessment carried out here, mass-based allocation is applied. In consequence, GHG emissions arising from a specific stage in the production process are allocated to main and by-products according to their respective mass. Sahoo et al. [33] show in their review of about 100 LCAs on forest-based products that the majority use the mass-based allocation approach. The only alternative is the market value-based approach that requires information on different wood qualities, including prices and wood share used as main or co-products. From our point of view, mass-based allocation has the advantage that it can be applied in a simple and transparent way.
MDF production is associated with high emissions due to the addition of synthetic resin. Please note that aggregation at product group level requires simplifications. At the end of the life cycle of wood products, a combination of recycling and energy recovery options are available. However, these result in new products with product life cycles, which in turn represent individual systems in an LCA and are not included in the GHG balance. The GHG emissions along the production chain are summarized in Table 1.

2.3. Carbon Storage Capacity of Wood Products (CSWP)

The mean carbon storage capacity of wood products was estimated based on data on carbon content and the proportion of wood in a product. For construction wood, we assume an average lifetime of 70 years, whereas the average lifetime for chipboard and MDF was 50 years [23]. Since the LCA models cover the period from 2020 to 2050 and the assumed life spans are longer than 30 years, the sequestered carbon of a product is fully accounted for in the GHG balance as a simplification (Table 2). In cases of products with a shorter lifetime only a share of the sequestered carbon should be accounted.
According to the German GHG inventory [6] and related Common Reporting Format (CRF) tables, an additional 4.73 million m3 of wood was added to the wood product storage of sawn wood and wood panel on average between 2010 and 2019 resulting in an additional mean storage of −3.21 Mt CO2-eq. This corresponds to −0.74 t CO2-eq. m−3 or, with an average wood weight of 0.50 t/m3, to −1.48 t CO2-eq. tair-dry−1. This value falls within an order of magnitude comparable to the values for the carbon storage capacity of wood products in Table 2.

2.4. Carbon Storage Balance in Forests (CSBF)

The German GHG Inventory [6] derives emission factors for changes in biomass carbon stocks, i.e., living biomass, of forests from national forest inventories and calibrates them on the basis of the annual quantity of logged wood following the method provided by Röhling et al. [12].
In the period from 2008 to 2017 (Figure 1), between 64.5 and 76.1 Mm3 of wood (6.0 to 7.3 m3 ha−1) was harvested. This corresponded to a carbon storage capacity of the living biomass on the forest area of −43.1 to −50.2 Mt CO2-eq. (−3.8 to −4.7 t CO2-eq. ha−1). The CSBF expressed as ton CO2-eq. per cubic meter of harvested wood amounts to −0.62 t CO2-eq. m−3 (see regression in Figure 1). This means that harvesting decreases the carbon storage capacity of living biomass by this factor, whereas carbon storage capacity increases by the same factor when harvesting is reduced.
The years 2002 to 2007 (Figure 1) were a period of strong natural disturbances, i.e., two storms (2002 storm “Janette”, 2007 storm “Kyrill”) and a drought in 2003. The resulting damage led to a general decrease in the carbon storage capacity of the living biomass in forests between −12.6 to −22.5 Mt CO2-eq. (−1.2 to −2.1 t CO2-eq. ha−1), which was considerably lower than the storage capacity between 2008 and 2017. The CSBF also declined to a value of 0.25 t CO2-eq. m−3 (see regression in Figure 1), as not only harvesting but also increased natural mortality rates impact the carbon storage capacity of living biomass.
The CSBF can also be determined assuming two forest management scenarios with different levels of use intensity (e.g., current use versus no use). The difference in carbon stored on the forest area per scenario and the difference in the amount of wood harvested are compared. Based on the analysis of several studies modelling forests in Germany, the CSBF ranges from 0.62 to 1.68 t CO2-eq. m−3 with a mean of 1.15 t CO2-eq./m−3 (see [35] and detailed data in [36]).
Based on the data and results presented above, we assumed four different levels for the CSBF (no-CSBF, low-CSBF, med-CSBF and high-CSBF; see description in Table 3). These levels are used for scenarios in a sensitivity analysis of the total GHG balance. For each wood product, the respective CSBF is multiplied by the wood input from forests (see calculation in Table 4).

2.5. Substitution Effects
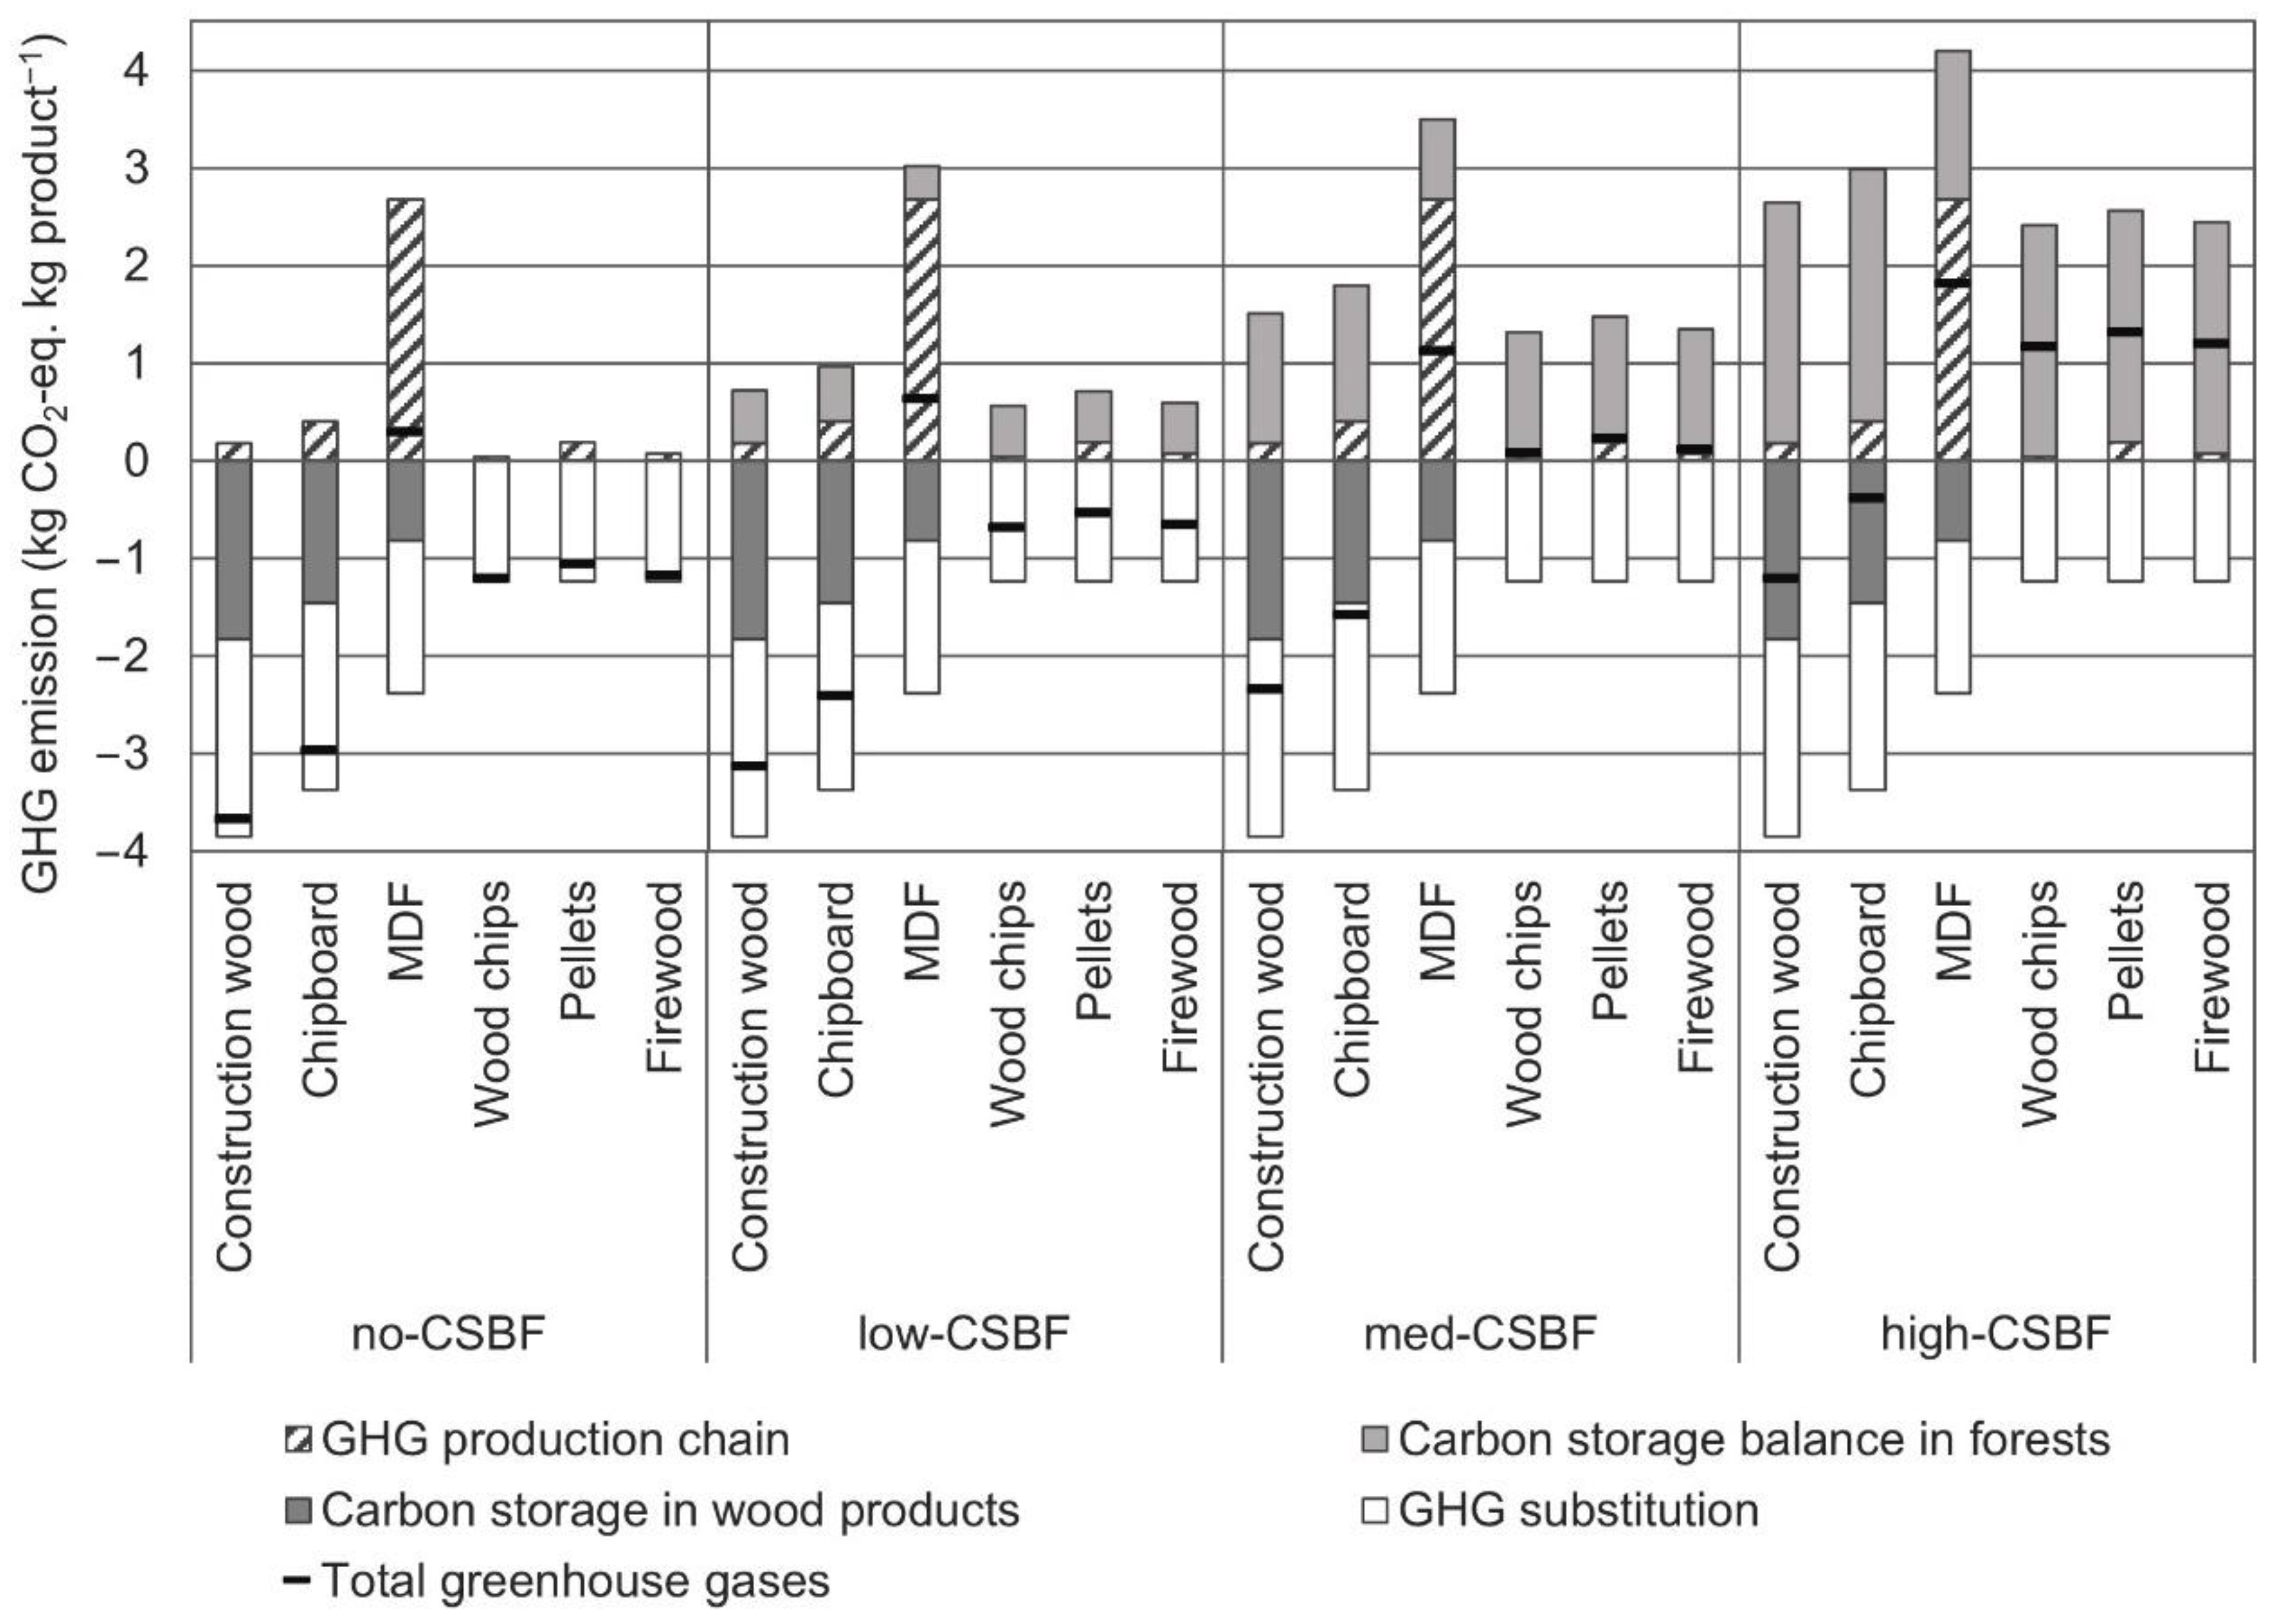
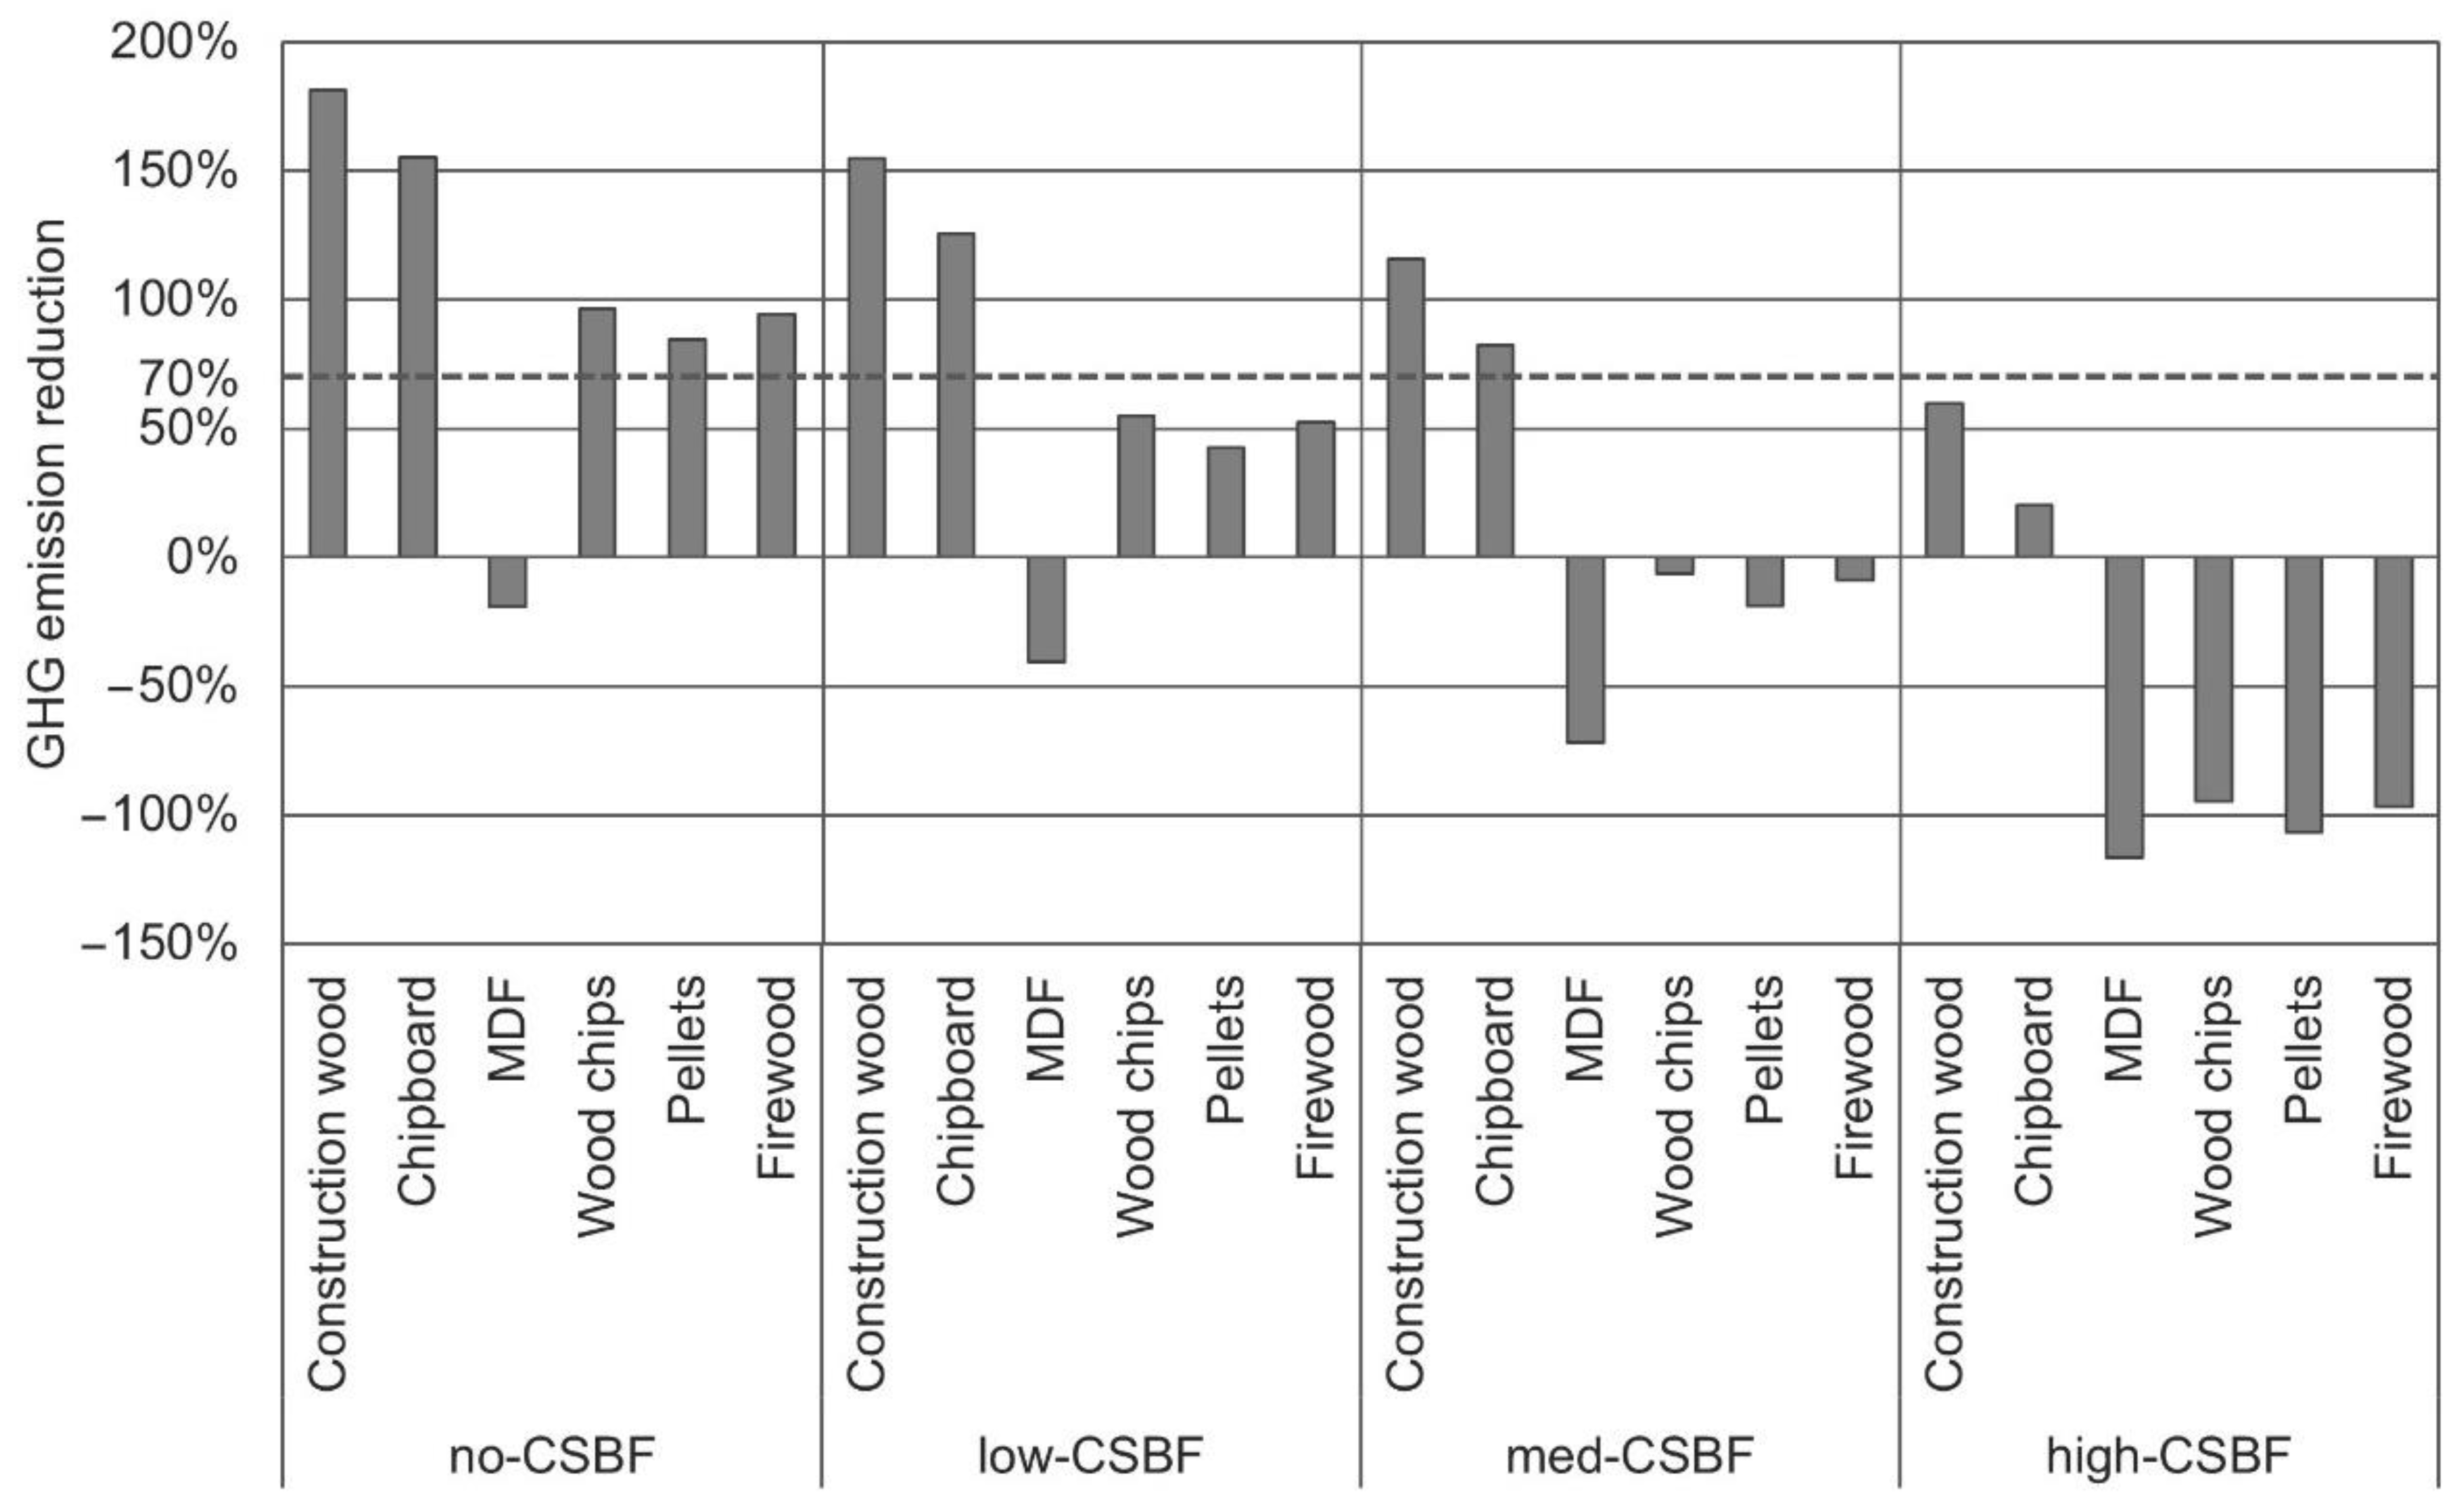
Substitution effects occur when a non-wood product is replaced by a wood product with the same degree of functionality. If the GHG emissions of the wood product are lower than those of the non-wood product, a GHG reduction is achieved. Table 5 presents expected substitutes and substituted GHG emissions for the wood product groups construction wood, chipboard, MDF and energy wood (wood chips, pellets, firewood).

3. Results

The total GHG balances and the GHG emission reduction (ER) per wood product group are presented in Figure 2 and Figure 3, assuming four different levels for the CSBF (no-CSBF, low-CSBF, med-CSBF and high-CSBF scenario; see description in Table 3). Negative values shown in Figure 2 indicate net GHG uptake, while positive values indicate net GHG emissions. In the no-CSBF scenario, a GHG reduction is achieved with most wood products (Figure 2) and the GHG emission reduction shows values above 155% for construction wood and chipboard and above 85% for energy wood (Figure 3). Substitution effects play a major role, and the carbon storage of wood products is equally important. The exception is MDF due to high emissions from fossil additives; thus, no GHG reduction is achieved in the no-CSBF scenario. With increasing CSBF, the GHG balance of all wood products decreases markedly (Figure 2). If a medium value for the CSBF (med-CSBF scenario) is included in the calculation, the GHG balance deteriorates so much that energy wood turns into a GHG source. This effect is even more pronounced in the high-CSBF scenario. However, construction wood and chipboard can still reduce GHG emissions compared to the non-wood reference (Figure 2). It is remarkable that the GHG emission reduction for energy wood declines below 70%, a threshold set in RED II [27], in the low-CSBF scenario and reaches below 0% in the med-CSBF scenario. For the high-CSBF scenario, the GHG emissions from wood energy are almost twice as high as from the fossil reference, indicated by a GHG emission reduction from −94% to −107% calculated for wood energy products (Figure 3).

4. Discussion

4.1. Integration of the CSBF into the GHG Balance of Wood Products

In this study, we propose an approach to consider changes in forest carbon stock in GHG balances of wood products through applying the CSBF (carbon storage balance in forests). Our method is designed to comply with the ISO requirements for both LCA [20,21] and carbon footprint calculation [29]. This is achieved by quantifying net CO2-eq. emissions per harvested volume of wood and incorporating it into the material flow framework of the GHG balance. Reductions in GHG emissions associated with a wood product in comparison with a fossil or mineral reference are determined with comparative LCA.
The GHG balances calculated with different estimates for CSBF show a clear pattern. With long-lived wood products such as construction wood and chipboard, substantial GHG reductions can be achieved compared to the non-wood reference. In contrast, the GHG reductions for energy wood are considerably lower. The difference between these two product groups arises from two factors: first, a significant amount of carbon is stored in long-lived wood products, and second, the achievable substitution effects are higher for long-lived wood products than for energy wood (see [38,39]). In the GHG balance, MDF performs particularly poorly due to the high amount of fossil additives. This illustrates that long-lived wood products do not per se contribute to climate protection. Our results for GHG emissions arising from the process chain, CO2 storage in wood products, and avoidance of emissions by substitution with non-wood products—excluding the CSBF—are on the same order of magnitude as documented in other studies on the use of wood products in Germany [23,31,40]. In these studies, substitution effects also play a significant role in improving the GHG balance of wood products.
Please note that substitution is not an inherent part of the wood use system. Unlike the other components of the total GHG balance, material substitution extends into other product systems. Although disaggregation of all individual components of the total GHG balance is always required for reasons of transparency, this is especially true for substitution. Modelling substitution involves an additional full LCA. It also requires assumptions and analyses of market events and adopts potential scenarios that cannot be clearly defined. Evidently, the choice of which particular metal or plastic replaces a wooden table is highly dependent on assumptions. However, if wood use cannot guarantee that non-wood products associated with high GHG emissions are substituted, the GHG balance will deteriorate accordingly [41]. In contrast, the CSBF is an inherent part of wood production and must be considered in the LCA of wood products. The comparative LCA we carried out is transparent and includes all relevant details. It allows researchers to integrate the results including the CSBF into future studies and to replace substitutes where required.

4.2. Comparison to Other Indicators and Influencing Factors

Similar approaches have been developed in recent years [42,43,44], comparing forest scenarios with different harvest intensities with a focus on effects at the country level, as opposed to the product level. Pingoud et al. [42] introduced a relative carbon indicator that is most similar to the CSBF. However, both the concept of payback time (e.g., [28,45,46]) and the concept of the displacement factor (synonym substitution factor; [47,48]) conflate the individual GHG balances of a wood product and a non-wood product into one indicator. As a result, there is a loss of transparency. The respective shares of wood and non-wood products in the GHG balance are no longer apparent. Consequently, the subsequent use of results, e.g., in other studies, is more complicated. The so-called payback time calculates the required time period until forest regrowth and reduction in fossil emissions can jointly pay back the carbon debt on the first stand harvested. Thus, the results of a comparative GHG balance, which always includes changes in the sink performance of the forest area, are expressed as a time period. The displacement factor compares the GHG balance of wood and non-wood products and correlates the result to the wood used. In their recent review on the concept, Myllyviita et al. [48] noted that very few studies have included changes in forest and product carbon stocks in displacement factors. These findings highlight that the CSBF is currently mostly ignored in studies, yet also confirms that its integration into the displacement factor is possible.
These studies as well as our results highlight the relevance of the CSBF for estimating total GHG balances. The effect of removing wood from living biomass on carbon storage in forests likely depends on underlying assumptions for the type of management (e.g., even-aged or continuous cover forestry), harvesting type and intensity (e.g., final felling, selective thinning), and forest type (e.g., tree species composition and structure). The CSBF is also likely to vary with geographical region and environmental site parameters, but it is also affected by methodological assumptions, such as the forest carbon pools considered (e.g., above-ground living biomass, dead and living biomass, litter and soil).
Overall, our analysis has allowed the calculation of the CSBF only from a limited number of studies representing limited geographical scope, forest types and harvest intensities. Consequently, more specific and applicable scenario studies and data are clearly required. The CSBF can be calculated from any pair of modelling scenarios with two different harvesting intensities. Using model simulation results, it should be ensured that all other influencing factors besides except harvest intensity (e.g., differences in environmental conditions) are excluded. Based on such results, specific CSBF values could be used in the total GHG balance of specific wood products (e.g., CSBF of conifers for construction wood; CSBF of broadleaf trees for fire wood).

4.3. Relevance of the CSBF for Climate Policy and Forest-Based Mitigation

The debate on the CSBF and payback time is not purely academic, is has a political dimension. At present, the International Energy Agency assumes that despite the known impacts on the forest sink, e.g., the use of firewood is compatible with the goals of the Paris Agreement [49]. This is called into question by the European Academies Science Advisory Council (EASAC), which assumes considerably longer carbon payback times [50]. Our findings for Germany, however, show that the consideration of the CSBF has a marked influence on the GHG balance of wood products. For instance, the GHG emission savings from chipboard and construction wood decrease from 155% and 180%, respectively, without CSBF to savings of 20% and 60%, respectively, when a high CSBF is assumed. In consequence, reliable, albeit reduced, GHG emission savings can be expected for long-lived wood products when the CSBF is considered. The picture changes for wood energy. Without considering the CSBF, the GHG emission savings amount to 85 to 95%. However, already with a medium CSBF, wood energy achieves no net GHG reduction compared to the non-wood reference. Even at a low CSBF value, GHG reduction dips below 70%. In the RED II [27], the sustainability requirement stipulates that wood energy in new plants should achieve GHG emission savings of at least 70% from 2021 and 80% from 2026. For wood pellets from stem wood, the RED II Annex gives default values of GHG savings for heat and electricity exceeding 70% compared to the fossil reference (transport distance up to 10,000 km, process energy from wood chips). However, when the CSBF is considered, the GHG reduction does no longer meet the mandatory savings target. In their literature review, Agostini et al. [28] also highlight that temperate and boreal stemwood energy-dedicated harvests achieve GHG savings only after 50 years compared to coal, and even later compared to natural gas, see also [46]. For harvest residues and wood from thinning, however, GHG savings can be expected after 10 years [28,51]. Adopting a German perspective, Bolte et al. [52] point out that carbon stock depletion, such as in the case of intensive energy use of wood, is detrimental to the climate, since the medium- and long-term reduction in the carbon sink in the forest can no longer be compensated by the substitution effects.
Similar to energy wood, other wood products with a short life cycle such as packaging wood or paper and cardboard can be expected to yield only low or no GHG emission savings if the CSBF is included. These products are generally associated with few GHG emission savings even without taking the CSBF into account [23,24,25,26].
GHG emission savings can be reliably achieved with long-lived products even when the CSBF is considered, which is not the case for wood energy and for many wood products with a shorter life cycle. As a consequence, the GHG perspective suggests that wood assortments primarily used for direct wood energy or short-lived wood products should not be harvested or harvesting should be postponed to build up the carbon stock in the forest. It must be taken into account, though, that the carbon stocks built up in forests must also be maintained, especially in climate-resilient mixed deciduous forests in Germany [53,54]. These forest stands in particular provide additional benefits, e.g., increased habitat for rare and endangered species, when they mature [55,56,57]. Positive effects for the water balance and soil protection are also expected to be associated with such a development [58,59].
The Paris Agreement requires a rapid reduction in fossil fuel emissions. The considered mitigation measures include also an increased use of wood for substituting fossil energy and products. A complete GHG balance of wood use as presented here is an important precondition for an effective forest-based mitigation policy to support informed decisions of policy makers and other stakeholders on climate change mitigation measures.

5. Conclusions

The extraction of wood from forests has implications for carbon stocks in forests. By comparing two alternative scenarios, impacts can be assessed by estimating the carbon storage balance in forests (CSBF). This effect needs to be included also in the GHG balances of wood products. Only this integration guarantees a complete picture of total net GHG emissions from wood products. Our approach of the CSBF provides political decision-makers and stakeholders in the forest sector with a reliable metric to assess options for forest management, wood use and climate change mitigation. To optimize the interplay between forest sink performance and GHG emission reduction achieved with the use of wood products, the following key aspects should be considered:
  • In climate-resilient forest stands with high ecological integrity (e.g., mainly deciduous and mixed forests in Germany) where mainly low-quality and short-lived wood products are expected, harvesting should be reduced to build up forest carbon stock.
  • In forest stands with poor climate resilience and low ecological integrity (e.g., spruce forests in unsuitable locations in Germany), harvesting should continue with the long-term goal of conversion into climate-resilient forests.
  • In forests where wood output is primarily used for high-value and long-lived products, carbon stock accumulation through reduced harvesting is likely to not reduce overall GHG emissions.
  • Synergies and trade-offs with other ecosystem services such as biodiversity, soil and water should be factored into decision-making.

Supplementary Materials

The following are available online at https://0-www-mdpi-com.brum.beds.ac.uk/article/10.3390/f13030365/s1, Document S1: Detailed explanations about the material flow and life cycle assessment model HoLCA.

Author Contributions

H.F., K.J.H. and H.B. designed the approach; H.F., K.J.H. and M.B. conducted LCA; J.R. and K.J.H. visualized the results. H.F., M.B., K.J.H., H.B. and J.R. wrote the manuscript text. All authors have read and agreed to the published version of the manuscript.

Funding

The research leading to results presented in this paper was funded by the German Ministry of Environment, grant number FKZ: 67KE0059.

Institutional Review Board Statement

Not applicable.

Informed Consent Statement

Not applicable.

Data Availability Statement

The data presented in this study are available on request from the corresponding author.

Conflicts of Interest

The authors declare no conflict of interest. The funders had no role in the design of the study; in the collection, analyses, or interpretation of data; in the writing of the manuscript, or in the decision to publish the results.

References

  1. United Nations. Paris Agreement; United Nations: San Francisco, CA, USA, 2021; pp. 1–27. Available online: http://unfccc.int/files/essential_background/convention/application/pdf/english_paris_agreement.pdf (accessed on 28 December 2021).
  2. Rogelj, J.; Shindell, D.; Jiang, K.; Fifita, S.; Forster, P.; Ginzburg, V.; Handa, C.; Kheshgi, H.; Kobayashi, S.; Kriegler, E.; et al. Mitigation Pathways Compatible with 1.5 °C in the Context of Sustainable Development. In Global Warming of 1.5 °C. An IPCC Special Report on the Impacts of Global Warming of 1.5 °C above Pre-Industrial Levels and Related Global Greenhouse Gas Emission Pathways, in the Context of Strengthening the Global Response to the Threat of Climate Change, Sustainable Development, and Efforts to Eradicate Poverty; Intergovernmental Panel on Climate Change (IPCC): Geneva, Switzerland, 2018; pp. 1–174. Available online: https://www.ipcc.ch/site/assets/uploads/sites/2/2019/05/SR15_Chapter2_Low_Res.pdf (accessed on 28 December 2021).
  3. United Nations Environment Programme. Emissions Gap Report 2021: The Heat Is On—A World of Climate Promises Not Yet Delivered; United Nations Environment Programme: Nairobi, Kenia, 2021; pp. 1–79. Available online: https://www.unep.org/emissions-gap-report-2021 (accessed on 28 December 2021).
  4. European Commission. Proposal for a Regulation of the European Parliament and of the Council Amending Regulations (EU) 2018/841 as Regards the Scope, Simplifying the Compliance Rules, Setting out the Targets of the Member States for 2030 and Committing to the Collective Achievement of Climate Neutrality by 2035 in the Land Use, Forestry and Agriculture Sector, and (EU) 2018/1999 as Regards Improvement in Monitoring, Reporting, Tracking of Progress and Review. Brussels, 14.7.2021. COM(2021) 554 Final ANNEX. Available online: https://eur-lex.europa.eu/resource.html?uri=cellar:ea67fbc9-e4ec-11eb-a1a5-01aa75ed71a1.0001.02/DOC_2&format=PDF (accessed on 27 December 2021).
  5. Hennenberg, K.; Boettcher, H.; Reise, J.; Herold, A.; Bohn, F.; Gutsch, M.; Reyer, C. Interpretation des Klimaschutzgesetzes für die Waldbewirtschaftung verlangt adäquate Datenbasis—Reaktion auf die Stellungnahme des Wissenschaftlichen Beirats für Waldpolitik beim BMEL (vom 22.06.2021); Öko-Institut Working Paper 3/2021; Öko-Institut: Freiburg, Germany, 2021; pp. 1–28. Available online: https://www.oeko.de/fileadmin/oekodoc/03-WP-Klimaschutzgesetz-Waldbewirtschaftung.pdf (accessed on 27 December 2021).
  6. Strogies, M.; Gniffke, P. Submission under the United Nations Framework Convention on Climate Change and the Kyoto Protocol 2021. National Inventory Report for the German Greenhouse Gas Inventory 1990–2019; UBA Climate Change 44/2021; Umweltbundesamt: Dessau-Roßlau, Germany, 2021; pp. 1–994. Available online: https://www.umweltbundesamt.de/sites/default/files/medien/5750/publikationen/2021-05-19_cc_44-2021_nir_2021_0.pdf (accessed on 27 December 2021).
  7. BMEL. Ergebnisse der Waldzustandserhebung 2020; Bundesministerium für Ernährung und Landwirtschaft (BMEL): Bonn, Germany, 2021; pp. 1–72. Available online: https://www.bmel.de/SharedDocs/Downloads/DE/Broschueren/ergebnisse-waldzustandserhebung-2020.pdf?__blob=publicationFile&v=8 (accessed on 27 December 2021).
  8. Ibisch, P.; Gohr, C.; Mann, D.; Blumröder, J. Der Wald in Deutschland auf dem Weg in die Heißzeit. Vitalität, Schädigung und Erwärmung in den Extremsommern 2018–2020; Hochschule für nachhaltige Entwicklung Eberswalde: Eberswalde, Germany, 2021; pp. 1–96. Available online: https://www.researchgate.net/publication/356443090_Der_Wald_in_Deutschland_auf_dem_Weg_in_die_Heisszeit_Vitalitat_Schadigung_und_Erwarmung_in_den_Extremsommern_2018-2020 (accessed on 27 December 2021).
  9. DESTATIS 41261-0003; Schadholzeinschlag: Deutschland, Jahre, Einschlagsursache, Holzartengruppen, Waldeigentumsarten. 2011–2020. Statistisches Bundesamt (Destatis): Wiesbaden, Germany, 2021. Available online: https://www-genesis.destatis.de/genesis//online?operation=table&code=41261-0003&bypass=true&levelindex=1&levelid=1640635855139#abreadcrumb (accessed on 27 December 2021).
  10. Jochem, D.; Weimar, H.; Dieter, M. Holzeinschlag kalamitätsbedingt weiter angestiegen. Holz-Zent. 2021, 147, 563–564. Available online: https://literatur.thuenen.de/digbib_extern/dn063967.pdf (accessed on 27 December 2021).
  11. Eionet Central Data Repository: GHG Inventory EU 15-01-2022, Germany. Available online: https://cdr.eionet.europa.eu/de/eu/mmr/art07_inventory/ghg_inventory/envyefchw (accessed on 28 December 2021).
  12. Röhling, S.; Dunger, K.; Kändler, G.; Klatt, S.; Riedel, T.; Stümer, W.; Brötz, J. Comparison of Calculation Methods for Estimating Annual Carbon Stock Change in German Forests under Forest Management in the German Greenhouse Gas Inventory. Carbon Balance Manag. 2016, 11, 12. [Google Scholar] [CrossRef] [PubMed] [Green Version]
  13. Krause, A.; Knoke, T.; Rammig, A. A regional assessment of land-based carbon mitigation potentials: Bioenergy, BECCS, reforestation, and forest management. Global Change Biol. Bioenergy 2020, 12, 346–360. [Google Scholar] [CrossRef]
  14. Bösch, M.; Elsasser, P.; Rock, J.; Weimar, H.; Dieter, M. Extent and costs of forest-based climate change mitigation in Germany: Accounting for substitution. Carbon Manag. 2019, 10, 127–134. [Google Scholar] [CrossRef]
  15. Böttcher, H.; Hennenberg, K.; Winger, C. Forest Vision Germany. Waldvision Deutschland. Description of Methodology, Assumptions and Results.; Oeko-Institute: Freiburg/Berlin/Darmstadt, Germany, 2018; pp. 1–77. Available online: https://www.oeko.de/fileadmin/oekodoc/Forest-Vision-Methods-and-Results.pdf (accessed on 27 December 2021).
  16. Gutsch, M.; Lasch-Born, P.; Kollas, C.; Suckow, F.; Reyer, C.P.O. Balancing Trade-Offs between Ecosystem Services in Germany’s Forests under Climate Change. Environ. Res. Lett. 2018, 13, 045012. [Google Scholar] [CrossRef]
  17. Oehmichen, K.; Klatt, S.; Gerber, K.; Polley, H.; Röhling, S.; Dunger, K. Die alternativen WEHAM-Szenarien: Holzpräferenz, Naturschutzpräferenz und Trendfortschreibung—Szenarienentwicklung, Ergebnisse und Analyse; Thünen Report 59; Johann Heinrich von Thünen-Institut: Braunschweig, Germany, 2018; pp. 1–91. Available online: https://literatur.thuenen.de/digbib_extern/dn059875.pdf (accessed on 27 December 2021).
  18. Knauf, M.; Köhl, M.; Mues, V.; Olschofsky, K.; Frühwald, A. Modeling the CO2-effects of forest management and wood usage on a regional basis. Carbon Balance Manag. 2015, 10, 13. [Google Scholar] [CrossRef] [Green Version]
  19. IPCC. 2006 IPCC Guidelines for National Greenhouse Gas Inventories. Prepared by the National Greenhouse Gas Inventories Programme; Eggleston, H.S., Buendia, L., Miwa, K., Ngara, T., Tanabe, K., Eds.; Intergovernmental Panel on Climate Change: Hayama, Japan, 2006; Volume 1, ISBN 4-88788-032-4.
  20. ISO 14040:2006; Environmental Management—Life Cycle Assessment—Principles and Framework. International Organisation for Standardization: Geneva, Switzerland, 2006; pp. 1–20.
  21. ISO 14044:2006; Environmental Management—Life Cycle Assessment—Requirements and Guidelines. International Organisation for Standardization: Geneva, Switzerland, 2006; pp. 1–46.
  22. IPCC. Climate Change and Land: An IPCC Special Report on Climate Change, Desertification, Land Degradation, Sustainable Land Management, Food Security, and Greenhouse Gas Fluxes in Terrestrial Ecosystems; Intergovernmental Panel on Climate Change: Geneva, Switzerland, 2019. Available online: https://www.ipcc.ch/site/assets/uploads/2019/11/SRCCL-Full-Report-Compiled-191128.pdf (accessed on 27 December 2021).
  23. Fehrenbach, H.; Köppen, S.; Kauertz, B.; Wellenreuther, F.; Baur, F.; Wern, B.; Breitmayer, E. Biomassekaskaden—Mehr Ressourceneffizienz Durch Stoffliche Kaskadennutzung von Biomasse—von der Theorie zur Praxis—Gesamtökologische Betrachtung ausgewählter Biomassekaskaden; UBA Texte 53/2017; Umweltbundesamt: Dessau-Roßlau, Germany, 2017; pp. 1–112. Available online: https://www.umweltbundesamt.de/sites/default/files/medien/1410/publikationen/2017-06-13_texte_53-2017_biokaskaden_anlage.pdf (accessed on 27 December 2021).
  24. Höglmeier, K.; Steubing, B.; Weber-Blaschke, G.; Richter, K. LCA-Based Optimization of Wood Utilization under Special Consideration of a Cascading Use of Wood. J. Environ. Manag. 2015, 152, 158–170. [Google Scholar] [CrossRef]
  25. Sathre, R.; González-García, S. Life Cycle Assessment (LCA) of Wood-Based Building Materials. In Eco-efficient Construction and Building Materials; Woodhead Publishing Limited: Cambridge, UK, 2014; pp. 311–337. Available online: https://0-linkinghub-elsevier-com.brum.beds.ac.uk/retrieve/pii/B9780857097675500145 (accessed on 27 December 2021)ISBN 978-0-85709-767-5.
  26. Helin, T.; Holma, A.; Soimakallio, S. Is Land Use Impact Assessment in LCA Applicable for Forest Biomass Value Chains? Findings from Comparison of Use of Scandinavian Wood, Agro-Biomass and Peat for Energy. Int. J. Life Cycle Assess. 2014, 19, 770–785. [Google Scholar] [CrossRef]
  27. European Commission. Directive (EU) 2018/2001 of the European Parliament and of the Council of 11 December 2018 on the Promotion of the Use of Energy from Renewable Sources. Available online: https://eur-lex.europa.eu/eli/dir/2018/2001/oj (accessed on 23 December 2021).
  28. Agostini, A.; Giuntoli, J.; Boulamanti, A.; Marelli, L. Carbon Accounting of Forest Bioenergy. Conclusions and Recommendations from a Critical Literature Review; European Commission, Joint Research Centre, Institute for Energy and Transport: Luxembourg, 2014; pp. 1–88. [Google Scholar] [CrossRef]
  29. ISO 14067:2018; Greenhouse Gases—Carbon Footprint of Products—Requirements and Guidelines for Quantification. International Organisation for Standardization: Geneva, Switzerland, 2018; pp. 1–46.
  30. IPCC. Chapter 12: Harvested Wood Products. In Guidelines for National Greenhouse Gas Inventories, Volume 4: Agriculture, Forestry and Other Land Use; Eggleston, H.S., Buendia, L., Miwa, K., Ngara, T., Tanabe, K., Eds.; Intergovernmental Panel on Climate Change, pepared by the National Greenhouse Gas Inventories Programme; Institute for Global Environmental Strategies (IGES): Hayama, Japan, 2006. [Google Scholar]
  31. Rüter, S.; Werner, F.; Forsell, N.; Prins, C.; Vial, E.; Levet, A. ClimWood2030, Climate Benefits of Material Substitution by Forest Biomass and Harvested Wood Products: Perspective 2030—Final Report; Thünen Report 42; Johann Heinrich von Thünen-Institut: Braunschweig, Germany, 2016; Available online: https://literatur.thuenen.de/digbib_extern/dn056927.pdf (accessed on 27 December 2021)ISBN 978-3-86576-160-6.
  32. Leskinen, P.; Cardellini, G.; González-García, S.; Hurmekoski, E.; Sathre, R.; Seppälä, J.; Smyth, C.; Stern, T.; Verkerk, P.J. Substitution Effects of Wood-Based Products in Climate Change Mitigation; From Science to Policy; European Forest Institute: Joensuu, Finland, 2018; Volume 7, Available online: https://efi.int/sites/default/files/files/publication-bank/2019/efi_fstp_7_2018.pdf (accessed on 27 December 2021)ISBN 978-952-5980-70-7. [CrossRef]
  33. Sahoo, K.; Bergman, R.; Alanya-Rosenbaum, S.; Gu, H.; Liang, S. Life Cycle Assessment of Forest-Based Products: A Review. Sustainability 2019, 11, 4722. [Google Scholar] [CrossRef] [Green Version]
  34. R Core Team. R: A Language and Environment for Statistical Computing. R Version 4.0.2 (22.06.2020); R Foundation for Statistical Computing: Vienna, Austria, 2021; Available online: https://www.R-project.org/ (accessed on 28 December 2021).
  35. Hennenberg, K.; Boettcher, H.; Wiegmann, K.; Reise, J.; Fehrenbach, H. Kohlenstoffspeicherung in Wald Und Holzprodukten. AFZ-Der Wald 2019, 17, 36–39. Available online: https://co2-speichersaldo.de/media/Hennenberg_Oekobilanz_sl.pdf (accessed on 27 December 2021).
  36. Öko-Institut CO2-Speichersaldo. Available online: https://co2-speichersaldo.de/ (accessed on 27 December 2021).
  37. Fachagentur Nachwachsende Rohstoffe (FNR). Basisdaten Bioenergie Deutschland 2021; FNR: Gülzow-Prüzen, Germany, 2020; pp. 1–52. Available online: https://www.fnr.de/fileadmin/Projekte/2020/Mediathek/broschuere_basisdaten_bioenergie_2020_web.pdf (accessed on 28 December 2021).
  38. Pingoud, K.; Pohjola, J.; Valsta, L. Assessing the Integrated Climatic Impacts of Forestry and Wood Products. Silva Fenn. 2010, 44, 155–175. [Google Scholar] [CrossRef] [Green Version]
  39. Geng, A.; Yang, H.; Chen, J.; Hong, Y. Review of Carbon Storage Function of Harvested Wood Products and the Potential of Wood Substitution in Greenhouse Gas Mitigation. For. Policy Econ. 2017, 85, 192–200. [Google Scholar] [CrossRef]
  40. Hafner, A.; Rüter, S.; Ebert, S.; Schäfer, S.; König, H.; Cristofaro, L.; Diederichs, S.; Kleinhenz, M.; Krechel, M. Treibhausgasbilanzierung von Holzgebäuden—Umsetzung neuer Anforderungen an Ökobilanzen und Ermittlung empirischer Substitutionsfaktoren (THG-Holzbau); BMEL/BMUB: Bochum, Germany, 2017; Available online: https://literatur.thuenen.de/digbib_extern/dn058600.pdf (accessed on 28 December 2021)ISBN 978-3-00-055101-7.
  41. Leturcq, P. GHG Displacement Factors of Harvested Wood Products: The Myth of Substitution. Sci Rep. 2020, 10, 20752. [Google Scholar] [CrossRef] [PubMed]
  42. Pingoud, K.; Ekholm, T.; Soimakallio, S.; Helin, T. Carbon Balance Indicator for Forest Bioenergy Scenarios. GCB Bioenergy 2016, 8, 171–182. [Google Scholar] [CrossRef] [Green Version]
  43. Valade, A.; Luyssaert, S.; Vallet, P.; Njakou Djomo, S.; Jesus Van Der Kellen, I.; Bellassen, V. Carbon Costs and Benefits of France’s Biomass Energy Production Targets. Carbon Balance Manag. 2018, 13, 26. [Google Scholar] [CrossRef]
  44. Seppälä, J.; Heinonen, T.; Pukkala, T.; Kilpeläinen, A.; Mattila, T.; Myllyviita, T.; Asikainen, A.; Peltola, H. Effect of Increased Wood Harvesting and Utilization on Required Greenhouse Gas Displacement Factors of Wood-Based Products and Fuels. J. Environ. Manag. 2019, 247, 580–587. [Google Scholar] [CrossRef]
  45. Bentsen, N. Carbon Debt and Payback Time—Lost in the Forest? Renew. Sustain. Energy Rev. 2017, 73, 1211–1217. [Google Scholar] [CrossRef]
  46. Searchinger, T.D.; Beringer, T.; Holtsmark, B.; Kammen, D.M.; Lambin, E.F.; Lucht, W.; Raven, P.; van Ypersele, J.-P. Europe’s Renewable Energy Directive Poised to Harm Global Forests. Nat. Commun. 2018, 9, 3741. [Google Scholar] [CrossRef] [Green Version]
  47. Hurmekoski, E.; Smyth, C.E.; Stern, T.; Verkerk, P.J.; Asada, R. Substitution Impacts of Wood Use at the Market Level: A Systematic Review. Environ. Res. Lett. 2021, 16, 123004. [Google Scholar] [CrossRef]
  48. Myllyviita, T.; Soimakallio, S.; Judl, J.; Seppälä, J. Wood Substitution Potential in Greenhouse Gas Emission Reduction–Review on Current State and Application of Displacement Factors. For. Ecosyst. 2021, 8, 42. [Google Scholar] [CrossRef]
  49. IEA Bioenergy The Use of Forest Biomass for Climate Change Mitigation: Response to Statements of EASAC 2019. Available online: https://www.ieabioenergy.com/wp-content/uploads/2019/12/WoodyBiomass-Climate_EASACresponse_Nov2019.pdf (accessed on 28 December 2021).
  50. Norton, M.; Baldi, A.; Buda, V.; Carli, B.; Cudlin, P.; Jones, M.B.; Korhola, A.; Michalski, R.; Novo, F.; Oszlányi, J.; et al. Serious Mismatches Continue between Science and Policy in Forest Bioenergy. GCB Bioenergy 2019, 11, 1256–1263. [Google Scholar] [CrossRef] [Green Version]
  51. Camia, A.; Giuntoli, J.; Jonsson, K.; Robert, N.; Cazzaniga, N.; Jasinevičius, G.; Avitabile, V.; Grassi, G.; Barredo Cano, J.I.; Mubareka, S. The Use of Woody Biomass for Energy Production in the EU.EUR 30548 EN.; Publications Office of the European Union: Luxembourg, 2020; Available online: https://publications.jrc.ec.europa.eu/repository/handle/JRC122719 (accessed on 28 December 2021)ISBN 978-92-76-27866-5.
  52. Bolte, A.; Ammer, C.; Annighöfer, P.; Bauhus, J.; Eisenhauer, D.-R.; Geisler, C.; Leder, B.; Petercord, R.; Rock, J.; Seifert, T.; et al. Fakten Zum Thema: Wälder Und Klimaschutz. AFZ-Der Wald 2021, 11, 12–15. Available online: https://literatur.thuenen.de/digbib_extern/dn063660.pdf (accessed on 28 December 2021).
  53. Wissenschaftlicher Beirat für Waldpolitik. Geplante Änderung des Klimaschutzgesetzes Riskiert Reduktion der Potenziellen Klimaschutzbeiträge von Wald und Holz. Stellungnahme; Wissenschaftlicher Beirat Waldpolitik beim BMEL (Hrsg.): Berlin, Germany, 2021; Available online: https://www.bmel.de/SharedDocs/Downloads/DE/_Ministerium/Beiraete/waldpolitik/klimaschutzgesetz.pdf?__blob=publicationFile&v=5 (accessed on 28 December 2021).
  54. Wissenschaftlicher Beirat für Waldpolitik. Die Anpassung von Wäldern und Waldwirtschaft an den Klimawandel; Wissenschaftlicher Beirat für Waldpolitik: Berlin, Germany, 2021; Available online: https://www.bmel.de/SharedDocs/Downloads/DE/_Ministerium/Beiraete/waldpolitik/gutachten-wbw-anpassung-klimawandel.pdf?__blob=publicationFile&v=2 (accessed on 28 December 2021)ISBN 978-3-00-070408-6.
  55. Höltermann, A.; Reise, J.; Finck, P.; Riecken, U. Forstlich ungenutzte Wälder in Deutschland. Nat. Und Landsch. 2020, 95, 80–87. [Google Scholar] [CrossRef]
  56. Hennenberg, K.J.; Winter, S.; Reise, J. Die dritte Bundeswaldinventur aus Sicht des Naturschutzes. Nat. Und Landsch. 2017, 92, 201–208. [Google Scholar] [CrossRef]
  57. Luick, R.; Hennenberg, K.; Leuschner, C.; Grossmann, M.; Jedicke, E.; Schoof, N.; Waldenspuhl, T. Primeval, Natural and Commercial Forests in the Context Biodiversity and Climate Protection. Part 1: Functions for Biodiversity and as Carbon Sinks and Reservoirs. Nat. Und Landsch. 2021, 53, 12–25. Available online: https://www.nul-online.de/Primeval-Forests-Natural-Forests-and-Managed-Forests-in-the-Context-of-the-Biodiversity-Debate-and-Climate-Protection,QUlEPTcwMDQ4OTYmTUlEPTExMTE.html?UID=578458F2200F98A04A40433ACE61AC7F9EAED1984F18FB (accessed on 27 December 2021). [CrossRef]
  58. Devi, A.S. Influence of Trees and Associated Variables on Soil Organic Carbon: A Review. J. Ecol. Environ. 2021, 45, 5. [Google Scholar] [CrossRef]
  59. Müller, J. Die forsthydrologische Forschung im Nordostdeutschen Tiefland: Veranlassung, Methoden, Ergebnisse und Perspektiven; University of Rostock: Rostock, Germany, 2019; Available online: https://www.openagrar.de/receive/openagrar_mods_00055651 (accessed on 28 December 2021).
Figure 1. Relation between the emission factor of living biomass in German forests and wood harvest for a period with major storm and drought damage (dotted line, y = −0.253 x + 3.363; r2 = 1.000; p < 0.001) and for a period with minor damage (solid line, y = −0.620 x + 8.353; r2 = 0.984; p < 0.001). Linear regression was computed in the software package R [34]. Source: Emission factor of living biomass from CRF-tables adopted from [6], harvest rate adopted from [10].
Forests 13 00365 g001
Figure 2. Total greenhouse gas balances of wood products (TBWP) in different carbon storage balance scenarios in forests. MDF = medium-density fiberboard, CSBF = carbon storage balance in forests. See explanation of the scenarios no-CSBF, low-CSBF, med-CSBF and high-CSBF in Table 3.
Forests 13 00365 g002
Figure 3. Greenhouse gas emission reduction (ER) of wood products in relation to non-wood products in different carbon storage balance scenarios in forests. According to RED II [27], ER shall be at least 70% for heating production from wood used in installations starting in 2021. MDF = medium-density fiberboard, CSBF = carbon storage balance in forests. See explanation of the scenarios no-CSBF, low-CSBF, med-CSBF and high-CSBF in Table 3.
Forests 13 00365 g003
Table 1. GHG emissions along the production chain of wood products (PCWP).
UseProductWood Input from
Forests *
Proportion of Wood
in the Product
GHG Emissions along the
Production Chain (PCWP)
(kg Woodair-dry kg Product−1) (kg CO2-eq. kg Product−1)
MaterialConstruction wood1.041.000.18
Chipboard1.090.950.40
MDF **0.640.562.68
EnergyWood chips1.001.000.04
Pellets1.001.000.19
Firewood1.001.000.07
* The input volume corresponds to the physical material flow (allocation by mass). Values > 1 imply material loss along the production chain (residual materials not used elsewhere); values < 1 imply that the product contains non-wood components (e.g., MDF board with a high proportion of synthetic resin). ** MDF = Medium density fiberboard. Source: own calculations based on HoLCA using data from Fehrenbach et al. [23].
Table 2. Calculation of the mean carbon storage capacity of wood products (CSWP) during a credit period of 30 years (material use only).
ProductCarbon Content
of Wood [30]
Carbon Storage Capacity
of Products *
CO2 Storage Capacity
of Products (CSWP) **
(kg C kg Woodair-dry−1)(kg C kg Product−1)(kg CO2-eq. kg Product−1)
Construction wood0.50−0.50−1.83
Chipboard0.50−0.48−1.74
MDF ***0.50−0.28−1.03
* Calculation: (carbon content of wood) • (proportion of wood in the product; Table 1) • (−1). ** Stoichiometric conversion from C to CO2 (factor 44/12). *** MDF = Medium density fiberboard.
Table 3. Carbon storage balance in forests (CSBF) for removed wood.
LevelCarbon Storage Balance in Forests (CSBF)Note
(t CO2-eq. m−3)(t CO2-eq. tair-dry−1) *(g CO2-eq. MJ−1) **
no-CSBF0.000.000.00No CSBF: The CSBF is not taken into account. This reflects the assumption that the removal of the wood has no effect on the development of the carbon stock in the forest.
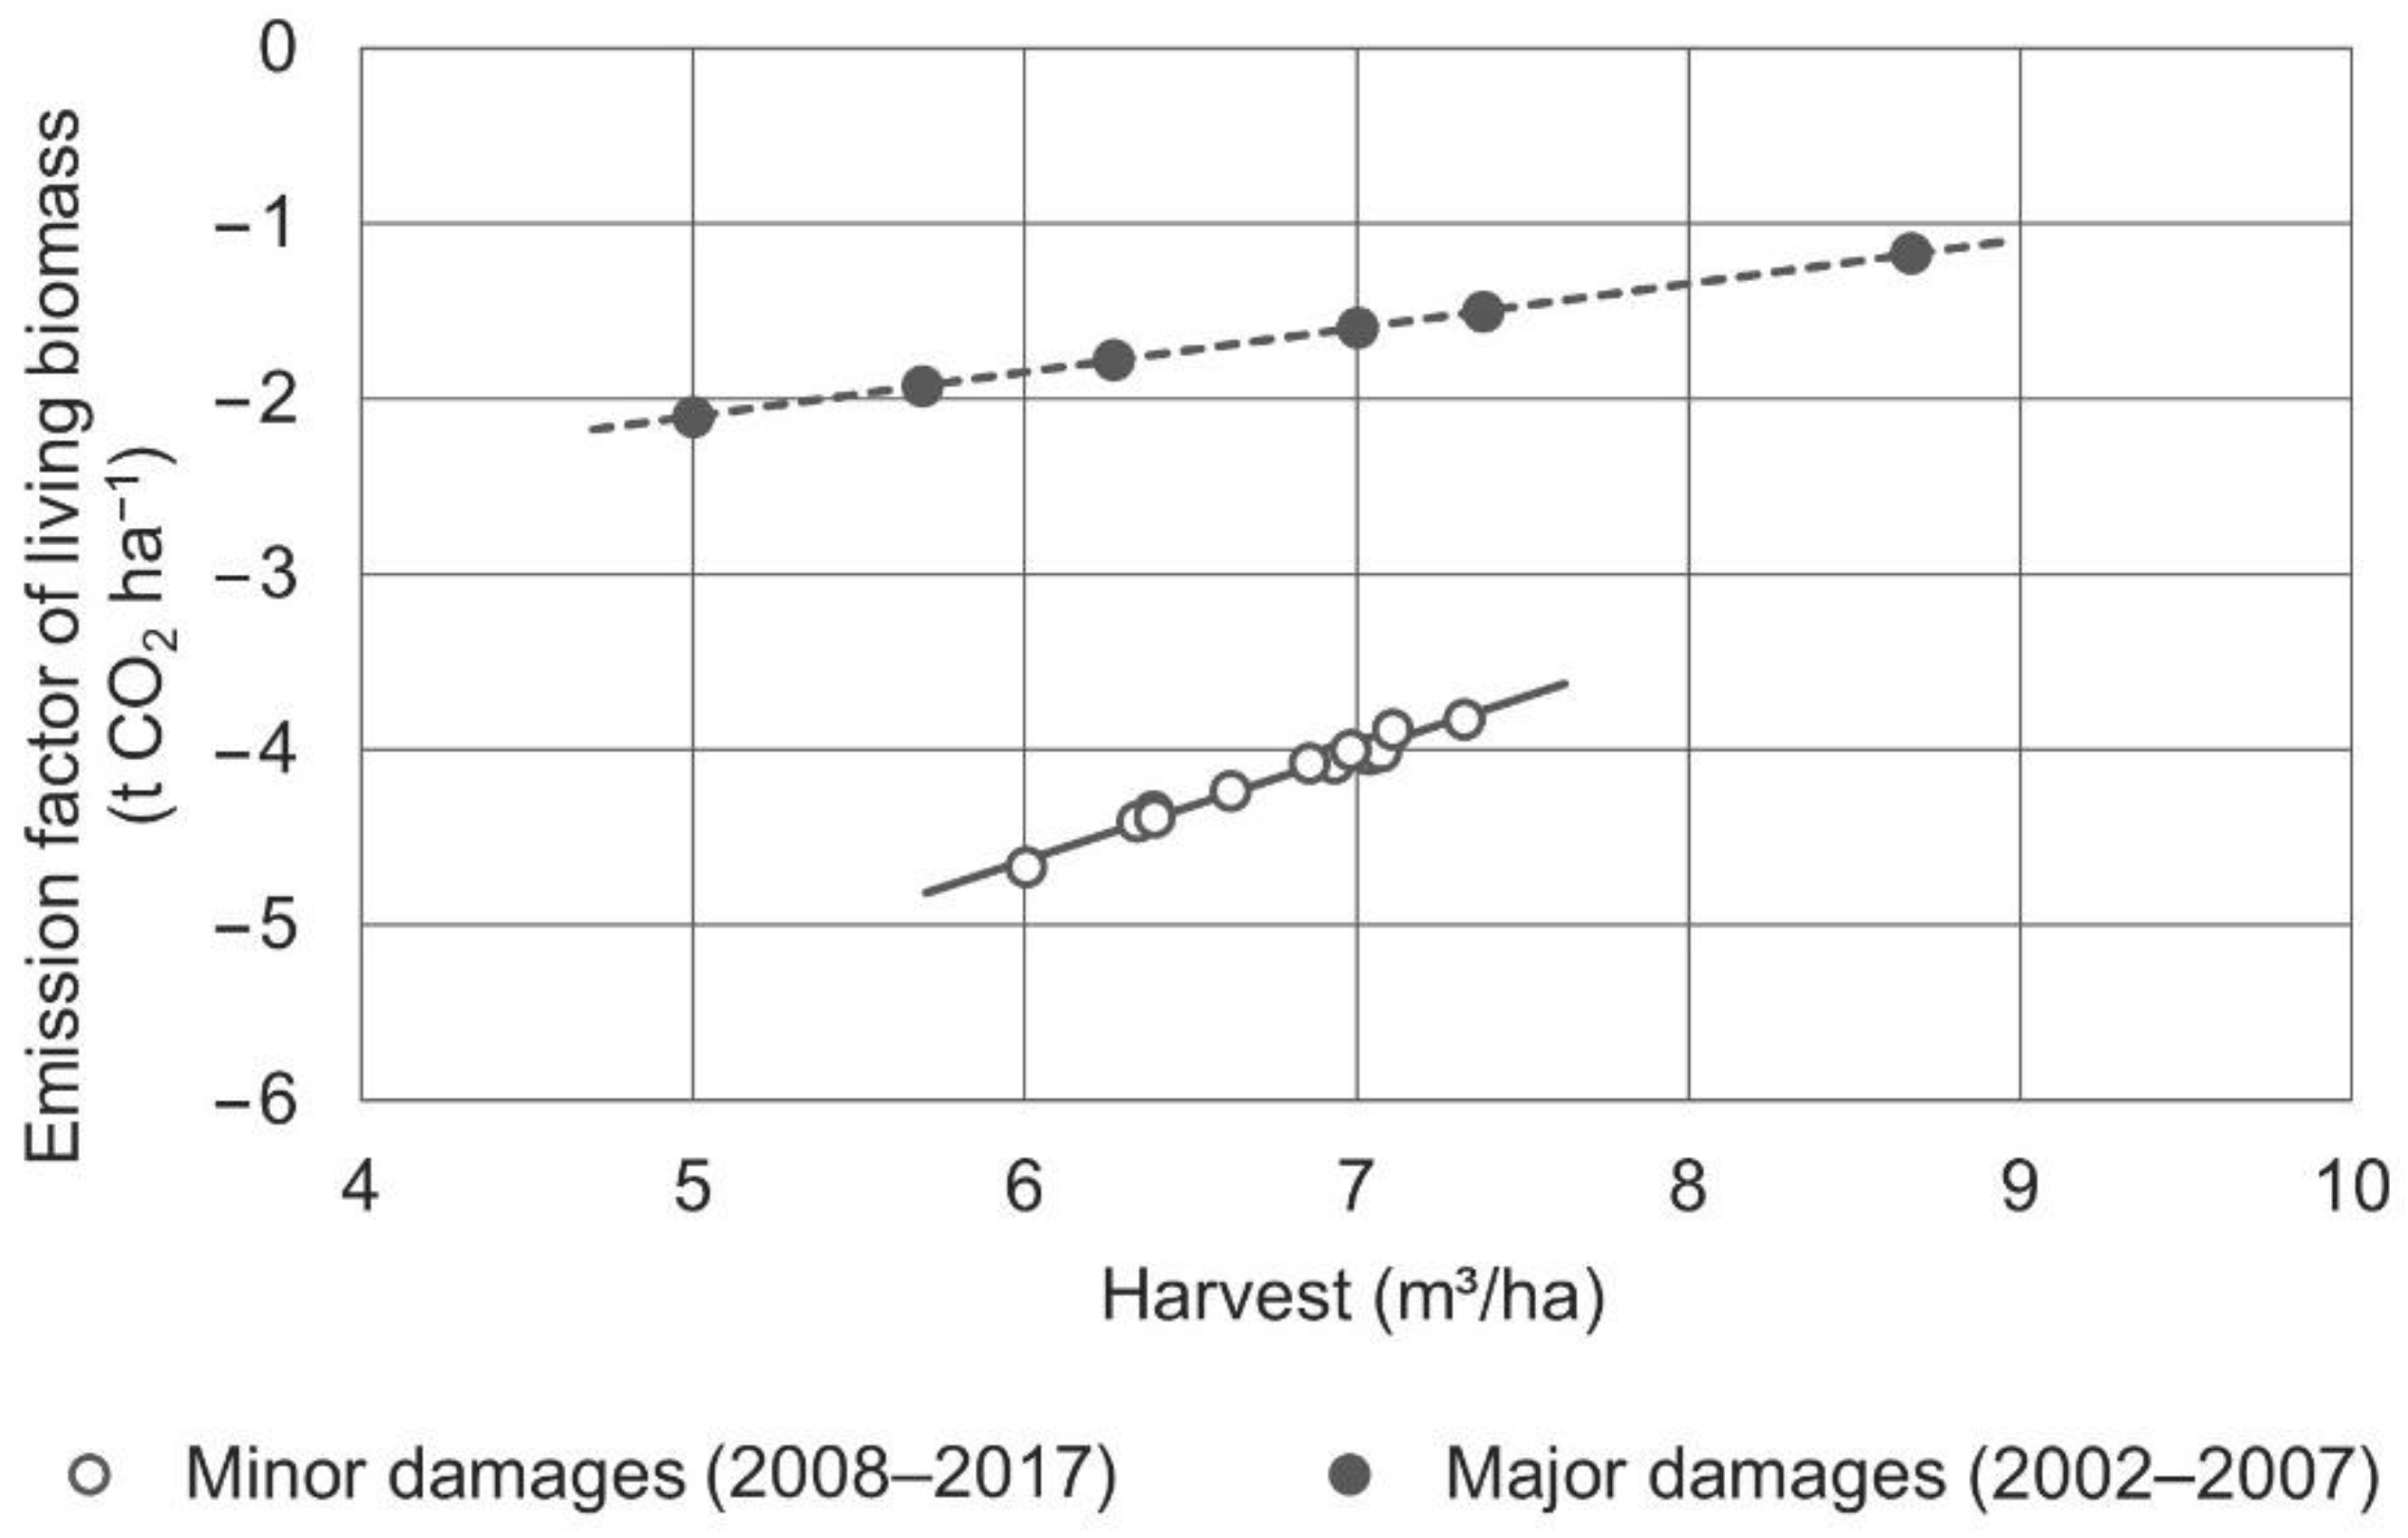
low-CSBF0.250.5233.5Low CSBF: Lower threshold of the CSBF according to data reported in [6,10], see Figure 1
med-CSBF0.621.2882.6Medium CSBF: Upper threshold of the CSBF according to data reported in [6,10], see Figure 1
high-CSBF1.152.37152.9High CSBF: Higher threshold of the range of the CSBF according to modelling results (period: 2020–2050) [35,36])
* Mean wood density of 0.485 tair-dry m−3; wood density: spruce for conifers = 0.426 tair-dry m−3, beach for broadleaf trees = 0.623 tair-dry m−3 [37]; proportion of harvested wood: 70% conifers and 30% broadleaf trees [10]. ** Heating value of 15.5 MJ kgair-dry−1 [37].
Table 4. Carbon storage balance in forests for individual groups of wood products.
UseProductno-CSBF *low-CSBF *med-CSBF *high-CSBF *
(kg CO2-eq. kg Product−1)
MaterialConstruction wood0.000.541.332.46
Chipboard0.000.571.402.58
MDF **0.000.330.821.52
EnergyWood chips0.000.521.282.37
Pellets0.000.521.282.37
Firewood0.000.521.282.37
* Calculation: (carbon storage balance in forests (CSBF), Table 3) • (wood input from forests; Table 1). ** MDF = Medium density fiberboard.
Table 5. Potential substitution effects of wood products.
Material Use
Wood ProductSubstituteProportion
[23]
Substitution
Factor [23]
GHG Emissions
Substitute [23]
Substitution
Effect (SP) *
(kg Substitute
kg Wood Product−1)
(kg CO2-eq.
kg Substitute−1)
(kg CO2-eq.
kg Wood Product−1)
Construction woodSteel0.502.001.72−1.72
Concrete0.504.800.125−0.30
Weighted total −2.02
ChipboardPlasterboard0.500.800.34−0.14
Steel sheets0.401.201.72−0.83
Lightweight concrete
elements
0.108.001.17−0.94
Weighted total −1.87
MDF ***Plastic (PVC)1.001.01.56 **−1.56
Energy Use
Wood productSubstituteProportion [27]Substitution
Factor [27]
GHG Emissions Substitute [27]Substitution
Effect (SP) ****
(MJ Substitute
MJ Wood Product−1)
(g CO2-eq.
MJ Substitute−1)
(kg CO2-eq.
kg Wood Product−1)
Energy wood *****Fossil fuel mix1.01.080.0−1.20
* Calculation: (proportion). • (substitution factor) • (GHG emissions substitute) • (−1). ** Own estimation. *** MDF = Medium density fiberboard. **** Calculation: (proportion) • (substitution factor) • (GHG emissions substitute) • (heating value of 15 MJ kgair-dry−1 • (−1). ***** Energy wood = wood chips, pellets, and firewood.
Publisher’s Note: MDPI stays neutral with regard to jurisdictional claims in published maps and institutional affiliations.

