
Drought Sensitivity and Resilience of Oak–Hickory Stands in the Eastern United States


Department of Geography, Indiana University, Bloomington, IN 47405, USA
*
Author to whom correspondence should be addressed.
Forests 2022, 13(3), 389; https://0-doi-org.brum.beds.ac.uk/10.3390/f13030389
Submission received: 21 January 2022
/
Revised: 15 February 2022
/
Accepted: 22 February 2022
/
Published: 27 February 2022
(This article belongs to the Special Issue Vulnerability of Forests to Climate Variability and Change)
Abstract
:Forest composition in the eastern United States (US) has been shifting from an oak–hickory to maple–beech assemblage, but whether there are species-specific differences within these oak–hickory stands in their responses and recovery from drought remains unclear. Here, we examined drought responses and resilience derived from radial growth of 485 co-occurring Carya ovata and Quercus alba individual trees at 15 forests in the eastern US. Water availability over the growing season (May to August) of the current year controls growth variability of both C. ovata and Q. alba. Drought that occurred in June caused the greatest growth reduction for both species while interspecific differences inof drought-induced growth reduction was found in July, where Q. alba experienced stronger reduction than C. ovata. Both species are resilient to early growing season drought, but late growing season drought caused larger drought legacy effects for Q. alba. The increasing drought frequency and intensity will have a more prominent impact in oak–hickory stands in the eastern US. The species composition of a forest along with species-specific responses and recovery is likely to be a critical control on forest productivity and species abundance.
1. Introduction
Forests provide fundamental and irreplaceable ecosystem services, but recent anthropogenic climate change has disrupted global hydrological patterns, carbon cycles, and even microclimatic conditions offered by the forests [1,2]. A warmer climate increases the vapor pressure deficit and exacerbates drought stress on forest ecosystems [3]. Heat-induced drought causes substantial reduction in productivity and even causes embolism in xylem tissue, which triggers widespread tree mortality when xylem cavitation cannot be reversed [4,5,6,7]. These events will weaken carbon sequestration provided by the forests and even shift the forests to a carbon source temporarily [5]. It is therefore imperative to understand the consequences of climate extremes on forest productivity and resilience.
Anthropogenic disturbances not only disrupt important ecosystem services but also alter species distribution [8,9] and can change a community’s composition [10]. In the eastern United States (US), the composition of the forests was initially dominated by oak–hickory stands but the shade-tolerant maple–beech assemblages have become more abundant in recent decades [11,12,13]. Multiple and interactive hypotheses were postulated for this phenomenon, including fire suppression, climate change with wetter conditions, and land-use change with decreasing forest cover, etc. [12]. However, less frequent fire occurrence appears to have contributed to diminishing oak abundance the most [14]. In addition to anthropogenic fire suppression, the demographic shift also contributed to less frequent fire because the maple leaf litter is less flammable, which altered the forests with a cooler and moister microclimate and generated a positive feedback loop that favored the establishment of maples but suppressed the regeneration of other fire-tolerant species, such as oaks and hickory [11]. In the context of increasing drought stress in the eastern US, one of the potential consequences of such a compositional shift from oaks to maples is an alteration of drought impacts on forest productivity, where drought could cause stronger growth reduction of maple-dominant stands, especially when drought occurs in the later growing season [15]. However, the water demand (i.e., potential evapotranspiration) controls oak species dominance differentially; the higher potential evapotranspiration favors dominance of white oak (Quercus alba) over red oak (Quercus rubra) [14].
Although maples (Acer) are becoming more dominant, while oaks (Quercus) are diminishing, hickory (Carya) still occupy a substantial portion (up to 30%) in some forest stands of the eastern US [13]. Oaks and hickory are ring-porous species [16]; therefore, both genera are assumed to have similar responses and sensitivity to climate variability due to the similarity of wood anatomical traits. However, this assumption remains to be tested in the context of regional-scaled forest demographic change with increasing drought frequency and intensity. Annual tree radial growth contains valuable long-term information about species-specific tree growth responses and sensitivity to major climate variables, including temperature and moisture variability [17,18,19,20]. In order to better compare interspecific responses, sampling co-occurring species is preferred to control confounding variables influencing tree growth responses, such as site characteristics [15].
Here, we ask whether (1) the co-occurring Carya ovata and Quercus alba demonstrate a similar climate–growth relationship, particularly to water variability; (2) C. ovata and Q. alba has a similar drought sensitivity in terms of the magnitude in growth reduction; (3) C. ovata and Q. alba demonstrate a similar resilience to drought and therefore, the capacity to restore their growth to pre-drought level, because of their similar ecological traits and niches.
2. Materials and Methods
2.1. Study Area and Species
We sampled co-occurring Carya ovata and Quercus alba at 15 sites across Iowa, Illinois, Indiana, Missouri, and Ohio in the eastern US (Figure 1). The only exception is that the Quercus macrocarpa (bur oak) was sampled at Meltzer Woods (MW), Indiana instead of Quercus alba but both Q. macrocarpa and Q. alba are under the white oak group with similar responses to climate [15,21,22]. For simplicity, Q. alba will be used to represent Q. macrocarpa in the following sections. We sampled 6–43 trees (12–85 increment cores) per species at each site (Table 1). In total, we sampled 933 cores from 485 individual trees at these 15 sites for the following analyses.
2.2. Field Sampling and Chronology Development
The tree cores were sampled at breast height with 5.1 mm diameter increment borers. All samples were air-dried, mounted, and polished progressively with sandpapers. The tree cores were then measured and crossdated under a microscope at 0.001 mm precision with a Velmex measuring system (Velmex Inc., Bloomfield, NY, USA). The accuracy of crossdating and measurement was statistically checked by the COFECHA program [23]. We standardized these tree series with a two-third smoothing spline to remove low frequency signals associated with biological growth trends and forest dynamics and then used a bi-weighted average to compute the mean C. ovata and Q. alba chronology at each site by the dplR package in R [15,24,25].
2.3. Climate Data
Given tree radial growth is responsive to water variability in the study region [15,16,26,27], we only considered climatic water balance and the Standardized Precipitation-Evapotranspiration Index (SPEI, version 2.6) at 0.5° spatial resolution for our analyses. Climatic water balance is the difference between water supply (precipitation) and water demand (potential evapotranspiration, PET), which were derived from CRU TS version 4.05 [28]. Monthly PET was calculated by monthly maximum temperature, minimum temperature, and monthly precipitation using the Hargreaves method provided by SPEI package in R [29]. The SPEI is a standardized measure of the difference between water supply (precipitation) and water demand (PET) [30] for analyzing the potential climate–growth relationship and determining drought severity across study sites. The SPEI time series was extracted from the closest grid of the study site coordinates. We gathered both 1-month SPEI for individual month analyses and 3-month integrations of SPEI for seasonal analyses. We defined drought as being an SPEI less than or equal to −1.5 (≤−1.5), while non-drought as being greater than −1.5 (>−1.5) at each study site. For the sites within 0.5° spatial resolution (e.g., MM-LD and DW-PM, Figure 1), both C. ovata and Q. alba shared similar growth variability with a correlation coefficient ranging from 0.31 to 0.72.
2.4. Methods
We used Pearson’s correlation to explore the relationship between climatic water balance, SPEI, and standardized radial growth over the common period (1908–2011) of all 15 sites. As tree growth mainly responds to water variability of the current growing season in the eastern US [15,16,26,27], correlation was calculated with 1-month SPEI for individual months from April to September as well as with 3-month SPEI of the current growing season (i.e., June–July-August). We also employed a linear mixed model to examine the relationship between climate water balance and standardized tree radial growth across 15 sites over the common period (1908–2011). Five models were computed for the most responsive individual months inferred from the correlation analysis (i.e., May, June, July, August, and JJA) by the lme4 package in R [31] with the following equation:
where SRW is the standardized ring width, A is the intercept, β is the slope of the fixed effect (climatic water balance of each month), γ is the slope of interaction terms between climatic water balance and the species, and ε are the random effects, including the number of sites (n = 15), species (n = 2), and sites crossed with species (n = 30).
We calculated the percentage of tree growth reduction during drought for both species. The percentage of tree growth reduction is defined as the differences between averaged standardized ring width (SRW) during drought years and non-drought years compared to the SRW during non-drought years [15]. We also used resilience index to quantify the species’ ability to restore pre-drought growth level for drought that occurred at different months of the growing season, which is the ratio between the SRW 4 years after drought (SRWpost1–4) and the SRW 4 years before the drought (SRWpre1–4) [32]. We only considered single drought years instead of consecutive years of drought events to avoid potential impacts of consecutive drought events influencing the resilience calculation. For sites that experienced more than one drought event, we averaged the resilience index of all drought events to represent the resilience of the species at a given site. Resilience above 1 indicates that the species is fully recovered from drought and vice versa. We used one sample t-tests to determine if the mean percentage of growth reduction and the mean resilience were different from zero and one, respectively, for both C. ovata and Q. alba. We also used two sample t-tests to determine if there were interspecific differences in the mean percentage of growth reduction and the mean resilience.
3. Results
3.1. Climate–Growth Relationship
The inter-series correlations of Carya ovata and Quercus alba chronologies ranged from 0.515 to 0.637 and 0.575 to 0.719, respectively (Table 1), suggesting that the tree series were statistically crossdated and shared a common signal at each site. C. ovata and Q. alba demonstrated positive responses to both climatic water balance and SPEI over the current growing season of the common period 1908–2011, indicating that the radial growth of both species is sensitive to water availability (Figure 2). The radial growth of both species starts as early as May with the mean correlation coefficient between climatic water balance (SPEI) and radial growth being 0.12 (0.14) for C. ovata and 0.26 (0.28) for Q. alba. The water availability in June is the most influential for the growth of both species with the mean correlation coefficients of 0.36 (0.37) and 0.50 (0.51) for C. ovata and Q. alba, respectively, at 15 study sites (p < 0.05). Both C. ovata and Q. alba also demonstrated a strong positive response to the seasonal June–July-August (JJA) climatic water balance (SPEI) with a correlation coefficient of 0.34 (0.35) and 0.51 (0.52), respectively (p < 0.05).
The linear mixed models also demonstrated similar results with the correlation analyses that water availability in June had the strongest control on the radial growth of both C. ovata and Q. alba. The growth of C. ovata and Q. alba were increased by 0.123 and 0.139, respectively, when climatic water balance was increased by 100mm, but the growth rate of both species in June was not significantly different (Table 2). However, the water availability in July and JJA caused a significant difference in tree growth between C. ovata and Q. alba, where the growth rate was 0.063 and 0.092 for C. ovata and Q. alba, respectively, in July (p < 0.01), and 0.18 and 0.216 for C. ovata and Q. alba, respectively, in JJA (p < 0.05), for every 100mm increase of climate water balance (Table 2).
3.2. Drought-Induced Reduction
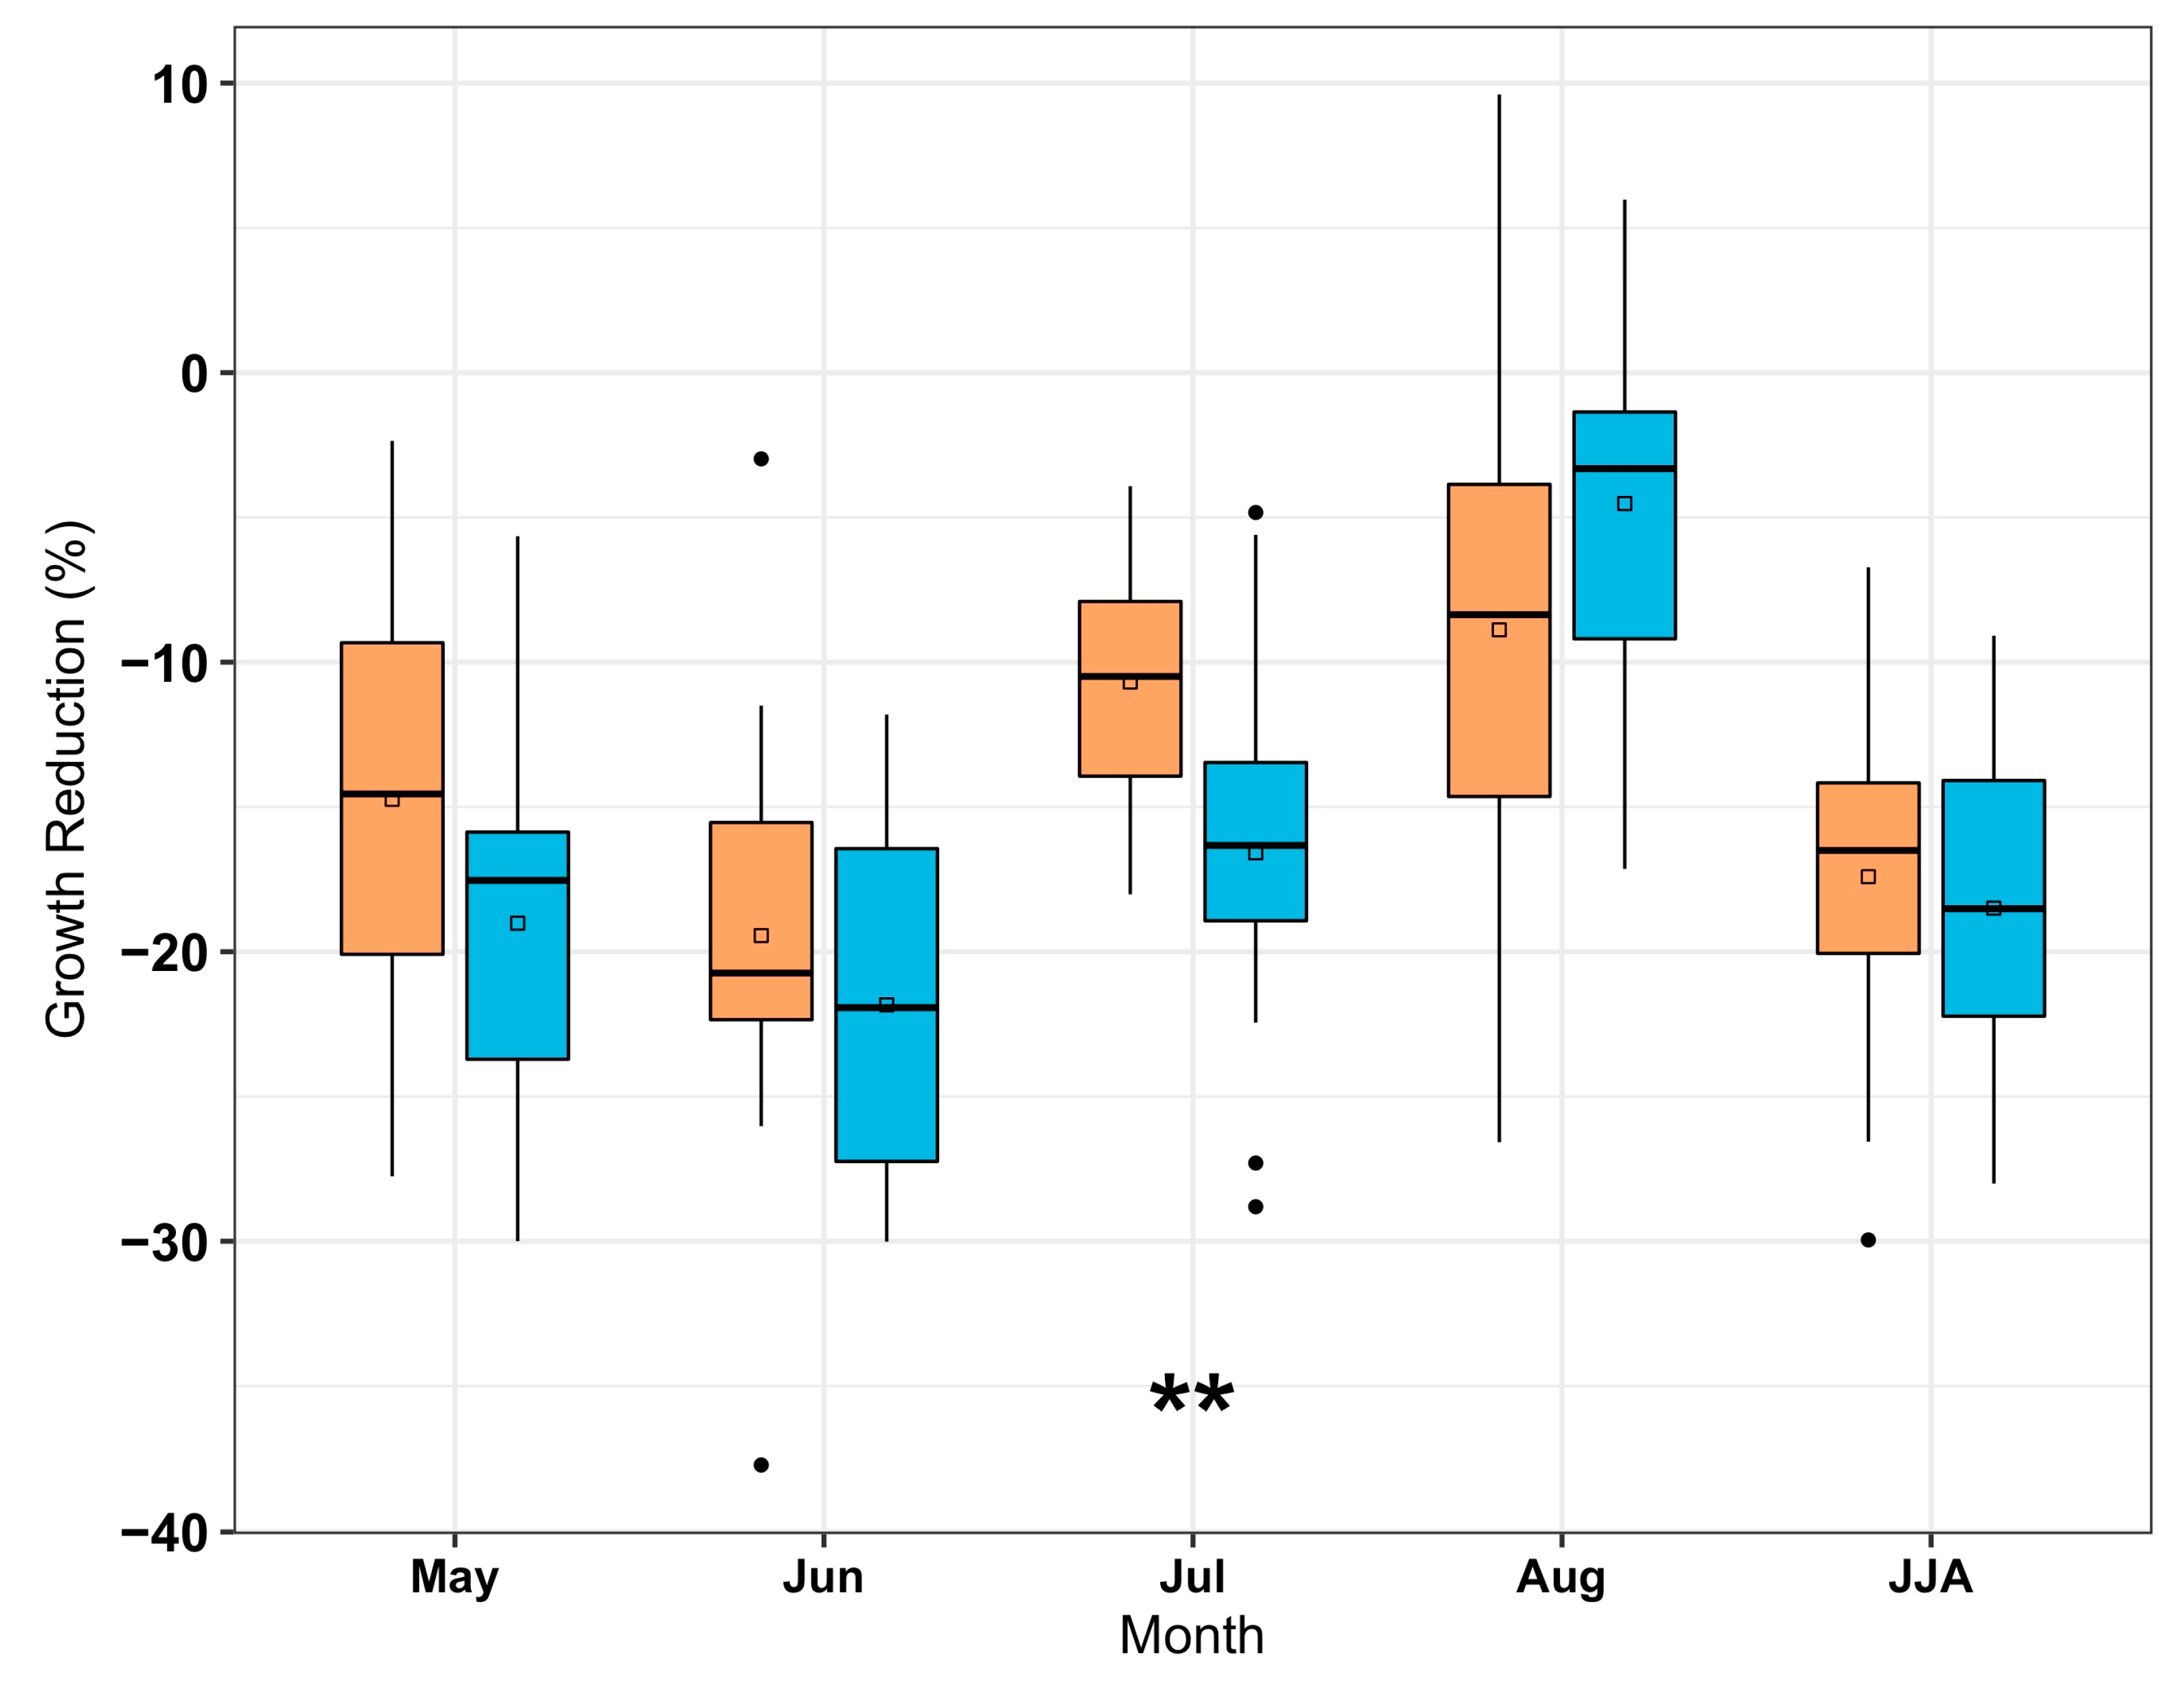
Drought caused a significant growth reduction for both species when tree growth took place from May to August (t14 = −2.8 to −13.6, p < 0.05, Figure 3). Although C. ovata had a lower correlation to interannual drought variability compared to Q. alba (Figure 2), both species demonstrated a similar degree of growth reduction during drought over the growing season from May to August (Figure 3). In particular, the degree of growth reduction was the most prominent for both species when drought happened in June with a mean reduction of 19% and 22% for C. ovata and Q. alba, respectively. However, drought happening in July caused an interspecific difference in mean growth reduction, where Q. alba has 6% more reduction than C. ovata (t28 = 2.8, p < 0.01). The seasonal JJA drought reduced the radial growth by 17% and 19% on average for C. ovata and Q. alba, respectively, but did not induce an interspecific difference.
3.3. Resilience to Drought Stress
The resilience index quantifies the ability of the species recovering from drought compared to pre-drought level. In general, we found both Carya ovata and Quercus alba were more resilient (mean resilience above 1) when drought happened in the early growing season (i.e., in May and June), while both species were less resilient (mean resilience below 1) when drought occurred in the late growing season (i.e., in July and August) (Figure 4). The mean resilience of C. ovata and Q. alba were 1.04 and 1.03, respectively, for drought happening in May, and 1.06 and 1.03, respectively, for drought happening in June, which are all significantly above 1.0 (t14 = 2.2 to 2.8, p < 0.05). The mean resilience of C. ovata and Q. alba were 0.99 and 0.97, respectively, for drought happening in July, and 0.99 and 0.95, respectively, for drought happening in August. The mean resilience of Q. alba was significantly less than 1 for the August drought (t14 = −2.3, p < 0.05). For seasonal drought that occurred during June-July−August (JJA), the mean resilience was 1.0 and 0.96 for C. ovata and Q. alba, respectively, and the resilience index for Q. alba was significantly less than 1 (t14 = −2.5, p < 0.05). Meanwhile, the higher mean resilience of C. ovata than that of Q. alba indicated a mild interspecific difference in drought resilience during the JJA seasonal drought (t28 = 1.9, p = 0.07).
4. Discussion
The correlation analysis and linear mixed models demonstrated that water availability is the main determinant on the growth of both Carya ovata and Quercus alba over the growing season (i.e., June−July−August, JJA), which is consistent with previous studies [16,33]. Among the growing season, both species are the most responsive to water variability in June and the growth of Q. alba better followed the water variability than that of C. ovata with higher mean correlation coefficient across 15 sites (Figure 2). However, higher correlations did not correspond to higher sensitivity during drought in terms of growth reduction for Q. alba. Indeed, both C. ovata and Q. alba experienced a similar degree of growth reduction in June and during JJA. The interspecific disparity in drought sensitivity only occurred for drought happening in July where Q. alba demonstrated a greater averaged growth reduction than C. ovata (Figure 3). Although drought in May and June caused greater growth reductions for both C. ovata and Q. alba than drought in July and August, the degree of reduction did not hinder how the species recovered to pre-drought growth. In particular, both species were more resilient to the early growing season drought and less resilient to the later growing season drought, while C. ovata seems to have higher resilience to seasonal drought than Q. alba (Figure 4). Here, we discuss how hydraulic trait and drought timing relate to the species-specific drought sensitivity and resilience.
4.1. Hydraulic Trait and Growth Reduction
We found that drought has an immediate effect on tree growth with the greatest reduction for both C. ovata and Q. alba when drought took place in June. During periods of limited water availability, tree growth is reduced due to a decline in cell formation [34]. Further, carbon uptake is reduced as well during drought due to stomatal closure that limits water loss [35]. While growth and photosynthesis are not always coupled [34,36], both growth and photosynthesis are negatively impacted during periods of drought. Thus, during drought, stomatal closure and declines in growth combine to further reduce carbon uptake from the atmosphere [5,35]. The degree of stomatal closure varies by species and could lead to species-specific drought sensitivity. The spectrum of isohydric to anisohydric hydraulic behavior can be inferred from leaf water potential measurement because more isohydric species tend to conserve water (higher leaf water potential) with stricter stomatal control during drought but also limit carbon assimilation, while more anisohydric species have a looser stomatal control to maintain more steady transpiration (lower leaf water potential) and carbon assimilation when drought occurs [35,37,38]. C. ovata and Q. alba are considered anisohydric species compared to isohydric Acer saccharum in the eastern US [35,39]. C. ovata was reported to have lower leaf water potentials over the growing season as well as greater decrease between predawn and middle leaf water potentials than Q. alba in July [39]. This behavior suggested C. ovata is even more anisohydric than Q. alba in July, which may explain why Q. alba has a greater growth reduction in July compared to C. ovata while C. ovata did not respond severely to July drought.
4.2. Later Growing Season Drought Hindering Tree Growth Recovery
Late season drought during July and August could induce lower mean resilience (below 1) than early season drought for both C. ovata and Q. alba in Figure 4. Lower resilience is equivalent to drought legacy—a prolonged tree growth recovery due to drought disturbance [40]. Drought timing could determine the impacts of drought on tree growth recovery [41]. Trees experiencing early season drought may have more time to perform photosynthesis during the later growing season to compensate the growth reduction by storing nonstructural carbohydrates for tree growth for the following years [40]. Trees experiencing late season drought, however, may not have sufficient time to store photosynthetic products for preparing and initiating tree growth in the following years [40]. In addition, Q. alba is found to be more vulnerable to hydraulic damage with xylem embolism during drought [42]. Repairing xylem tissue may also cost carbohydrate reserve and lead to a stronger recovery delay for Q. alba [35,43,44]. Indeed, other external factors, such as late frost and pest outbreaks, could impair radial growth [45,46], but frost is not common throughout the region and all tree individuals sampled appeared healthy at the time of sampling.
4.3. Impacts of Drought Timing and Duration
Drought sensitivity and recovery could vary with the timing and duration of drought, with the greatest reduction during early season drought, while drought sensitivity could also be species-specific where interspecific differences in drought sensitivity were found in July [15,47,48]. Species composition in the forest ecosystem of the eastern US is shifting; therefore, the impacts of drought on forest productivity and carbon storage will depend on species-specific drought sensitivity and the timing of when future drought will occur. Early season drought is the most detrimental to tree growth in the current year while late season drought could be more detrimental to tree growth in the following year [47]. As vapor pressure deficit over the summer is projected to increase and intensify the drought stress, the oak-dominated stands may experience more reduction in primary productivity, and oak may become even less abundant in oak–hickory stands under the scenario of shifting future drought regimes due to the greater sensitivity of Q. alba to later season droughts [49,50].
5. Conclusions
Both C. ovata and Q. alba have ring-porous xylem architecture and adopt anisohydric behavior to cope with drought stress; thus, these species are assumed to have similar growth performance and responses to drought. Here, we demonstrated that drought timing could influence species sensitivity and recovery ability, probably due to interspecific differences in hydraulic traits and vulnerability to drought. The influence of early season drought on growth reduction and resilience is similar for both species but interspecific differences in drought sensitivity and resilience are more prominent in the later growing season drought. These findings provided evidence of species-specific drought responses even though two distinct species share similar traits. With anthropogenic climate change and alteration of the forest ecosystems, species composition of the forests with species-specific responses to the changing climate could have a substantial influence on the carbon and water cycles.
Author Contributions
T.F.A. and J.T.M. conceptualized and designed the study. T.F.A. analyzed and interpretated the data. T.F.A. wrote the original draft with input from J.T.M. All authors have read and agreed to the published version of the manuscript.
Funding
This research was funded by the Indiana University College of Arts and Sciences Dissertation Research Fellowship, the USDA Agriculture and Food Research Initiative through grant (No. 2017-67013-26191), and the Indiana University Vice Provost of the Research Faculty Research Program.
Institutional Review Board Statement
Not applicable.
Informed Consent Statement
Not applicable.
Data Availability Statement
Tree-ring data are available on the International Tree-Ring Data Bank (https://www.ncei.noaa.gov/products/paleoclimatology/tree-ring).
Acknowledgments
We would like to thank Matthew Dannenberg for assisting with site access and sampling for the PK and LK sites. We also thank Joshua Bregy, Anna Hennage, Trevis Matheus, Brandon Strange, and Brynn Taylor for fieldwork assistance.
Conflicts of Interest
The authors declare no conflict of interest.
References
- De Frenne, P.; Zellweger, F.; Rodriguez-Sanchez, F.; Scheffers, B.R.; Hylander, K.; Luoto, M.; Vellend, M.; Verheyen, K.; Lenoir, J. Global buffering of temperatures under forest canopies. Nat. Ecol. Evol. 2019, 3, 744–749. [Google Scholar] [CrossRef] [PubMed]
- Bonan, G.B. Forests and climate change: Forcings, feedbacks, and the climate benefits of forests. Science 2008, 320, 1444–1449. [Google Scholar] [CrossRef] [Green Version]
- Novick, K.A.; Ficklin, D.L.; Stoy, P.C.; Williams, C.A.; Bohrer, G.; Oishi, A.C.; Papuga, S.A.; Blanken, P.D.; Noormets, A.; Sulman, B.N. The increasing importance of atmospheric demand for ecosystem water and carbon fluxes. Nat. Clim. Chang. 2016, 6, 1023–1027. [Google Scholar] [CrossRef] [Green Version]
- Anderegg, W.R.; Kane, J.M.; Anderegg, L.D. Consequences of widespread tree mortality triggered by drought and temperature stress. Nat. Clim. Chang. 2013, 3, 30. [Google Scholar] [CrossRef]
- Ciais, P.; Reichstein, M.; Viovy, N.; Granier, A.; Ogée, J.; Allard, V.; Aubinet, M.; Buchmann, N.; Bernhofer, C.; Carrara, A. Europe-wide reduction in primary productivity caused by the heat and drought in 2003. Nature 2005, 437, 529. [Google Scholar] [CrossRef] [PubMed]
- Allen, C.D.; Macalady, A.K.; Chenchouni, H.; Bachelet, D.; McDowell, N.; Vennetier, M.; Kitzberger, T.; Rigling, A.; Breshears, D.D.; Hogg, E.T. A global overview of drought and heat-induced tree mortality reveals emerging climate change risks for forests. For. Ecol. Manag. 2010, 259, 660–684. [Google Scholar] [CrossRef] [Green Version]
- Choat, B.; Brodribb, T.J.; Brodersen, C.R.; Duursma, R.A.; López, R.; Medlyn, B.E. Triggers of tree mortality under drought. Nature 2018, 558, 531. [Google Scholar] [CrossRef]
- Pecl, G.T.; Araújo, M.B.; Bell, J.D.; Blanchard, J.; Bonebrake, T.C.; Chen, I.-C.; Clark, T.D.; Colwell, R.K.; Danielsen, F.; Evengård, B. Biodiversity redistribution under climate change: Impacts on ecosystems and human well-being. Science 2017, 355, eaai9214. [Google Scholar] [CrossRef]
- Lenoir, J.; Bertrand, R.; Comte, L.; Bourgeaud, L.; Hattab, T.; Murienne, J.; Grenouillet, G. Species better track climate warming in the oceans than on land. Nat. Ecol. Evol. 2020, 4, 1044–1059. [Google Scholar] [CrossRef]
- McDowell, N.G.; Allen, C.D.; Anderson-Teixeira, K.; Aukema, B.H.; Bond-Lamberty, B.; Chini, L.; Clark, J.S.; Dietze, M.; Grossiord, C.; Hanbury-Brown, A. Pervasive shifts in forest dynamics in a changing world. Science 2020, 368, eaaz9463. [Google Scholar] [CrossRef]
- Nowacki, G.J.; Abrams, M.D. The demise of fire and “mesophication” of forests in the eastern United States. BioScience 2008, 58, 123–138. [Google Scholar] [CrossRef]
- McEwan, R.W.; Dyer, J.M.; Pederson, N. Multiple interacting ecosystem drivers: Toward an encompassing hypothesis of oak forest dynamics across eastern North America. Ecography 2011, 34, 244–256. [Google Scholar] [CrossRef]
- Abrams, M.D. Where has all the white oak gone? BioScience 2003, 53, 927–939. [Google Scholar] [CrossRef] [Green Version]
- Novick, K.; Jo, I.; D’Orangeville, L.; Benson, M.; Au, T.F.; Barnes, M.; Denham, S.; Fei, S.; Heilman, K.; Hwang, T. The Drought Response of Eastern US Oaks in the Context of Their Declining Abundance. BioScience 2022. [Google Scholar] [CrossRef]
- Au, T.F.; Maxwell, J.T.; Novick, K.A.; Robeson, S.M.; Warner, S.M.; Lockwood, B.R.; Phillips, R.P.; Harley, G.L.; Telewski, F.W.; Therrell, M.D.; et al. Demographic shifts in eastern US forests increase the impact of late-season drought on forest growth. Ecography 2020, 43, 1475–1486. [Google Scholar] [CrossRef]
- Martin-Benito, D.; Pederson, N. Convergence in drought stress, but a divergence of climatic drivers across a latitudinal gradient in a temperate broadleaf forest. J. Biogeogr. 2015, 42, 925–937. [Google Scholar] [CrossRef] [Green Version]
- Li, T.; Li, J.; Au, T.F.; Zhang, D.D. Moisture Variability in the East Pearl River Basin since 1894 CE Inferred from Tree Ring Records. Atmosphere 2020, 11, 1075. [Google Scholar] [CrossRef]
- Li, T.; Li, J.; Au, T.F.; Zhang, D.D. Tree-Ring Width Data of Tsuga longibracteata Reveal Growing Season Temperature Signals in the North-Central Pearl River Basin 1824 AD. Forests 2021, 12, 1067. [Google Scholar] [CrossRef]
- Li, J.; Li, J.; Li, T.; Au, T.F. 351-year tree ring reconstruction of the Gongga Mountains winter minimum temperature and its relationship with the Atlantic Multidecadal Oscillation. Clim. Chang. 2021, 165, 1–19. [Google Scholar] [CrossRef]
- Li, J.; Li, J.; Li, T.; Au, T.F. Tree growth divergence from winter temperature in the Gongga Mountains, southeastern Tibetan Plateau. Asian Geogr. 2020, 37, 1–15. [Google Scholar] [CrossRef]
- Woodcock, D. Climate sensitivity of wood-anatomical features in a ring-porous oak (Quercus macrocarpa). Can. J. For. Res. 1989, 19, 639–644. [Google Scholar] [CrossRef]
- Robertson, P.A. Factors affecting tree growth on three lowland sites in southern Illinois. Am. Midl. Nat. 1992, 128, 218–236. [Google Scholar] [CrossRef]
- Holmes, R. Program COFECHA user’s manual. In Laboratory of Tree-Ring Research; The University of Arizona: Tucson, AZ, USA, 1983. [Google Scholar]
- Bunn, A.G. A dendrochronology program library in R (dplR). Dendrochronologia 2008, 26, 115–124. [Google Scholar] [CrossRef]
- Cook, E.R.; Kairiukstis, L.A. Methods of Dendrochronology: Applications in the Environmental Sciences; Springer Science & Business Media: Berlin/Heidelberg, Germany, 2013. [Google Scholar]
- Maxwell, J.T.; Harley, G.L.; Mandra, T.E.; Yi, K.; Kannenberg, S.A.; Au, T.F.; Robeson, S.M.; Pederson, N.; Sauer, P.E.; Novick, K.A. Higher CO2 concentrations and lower acidic deposition have not changed drought response in tree growth but do influence iWUE in hardwood trees in the Midwestern United States. J. Geophys. Res. Biogeosci. 2019, 124, 3798–3813. [Google Scholar] [CrossRef]
- Maxwell, J.T.; Harley, G.L.; Matheus, T.J.; Strange, B.M.; Van Aken, K.; Au, T.F.; Bregy, J.C. Sampling density and date along with species selection influence spatial representation of tree-ring reconstructions. Clim. Past 2020, 16, 1901–1916. [Google Scholar] [CrossRef]
- Harris, I.; Osborn, T.J.; Jones, P.; Lister, D. Version 4 of the CRU TS monthly high-resolution gridded multivariate climate dataset. Sci. Data 2020, 7, 1–18. [Google Scholar] [CrossRef] [PubMed] [Green Version]
- Beguería, S.; Vicente-Serrano, S.M. SPEI: Calculation of the Standardised Precipitation-Evapotranspiration Index. R Package Version 1.7. 2017. Available online: https://CRAN.R-project.org/package=SPEI (accessed on 20 January 2022).
- Vicente-Serrano, S.M.; Beguería, S.; López-Moreno, J.I. A multiscalar drought index sensitive to global warming: The standardized precipitation evapotranspiration index. J. Clim. 2010, 23, 1696–1718. [Google Scholar] [CrossRef] [Green Version]
- Bates, D.; Mächler, M.; Bolker, B.; Walker, S. Fitting Linear Mixed-Effects Models Using lme4. J. Stat. Softw. 2015, 67, 1–48. [Google Scholar] [CrossRef]
- Lloret, F.; Keeling, E.G.; Sala, A. Components of tree resilience: Effects of successive low-growth episodes in old ponderosa pine forests. Oikos 2011, 120, 1909–1920. [Google Scholar] [CrossRef]
- Cowden, M.M.; Hart, J.L.; Buchanan, M.L. Canopy accession strategies and climate responses for three Carya species common in the Eastern Deciduous Forest. Trees 2014, 28, 223–235. [Google Scholar] [CrossRef]
- Körner, C. Paradigm shift in plant growth control. Curr. Opin. Plant Biol. 2015, 25, 107–114. [Google Scholar] [CrossRef]
- Roman, D.; Novick, K.; Brzostek, E.; Dragoni, D.; Rahman, F.; Phillips, R. The role of isohydric and anisohydric species in determining ecosystem-scale response to severe drought. Oecologia 2015, 179, 641–654. [Google Scholar] [CrossRef]
- Etzold, S.; Sterck, F.; Bose, A.K.; Braun, S.; Buchmann, N.; Eugster, W.; Gessler, A.; Kahmen, A.; Peters, R.L.; Vitasse, Y. Number of growth days and not length of the growth period determines radial stem growth of temperate trees. Ecol. Lett. 2021, 25, 427–439. [Google Scholar] [CrossRef]
- Martínez-Vilalta, J.; Poyatos, R.; Aguadé, D.; Retana, J.; Mencuccini, M. A new look at water transport regulation in plants. New Phytol. 2014, 204, 105–115. [Google Scholar] [CrossRef] [Green Version]
- Klein, T. The variability of stomatal sensitivity to leaf water potential across tree species indicates a continuum between isohydric and anisohydric behaviours. Funct. Ecol. 2014, 28, 1313–1320. [Google Scholar] [CrossRef]
- Bryant, K.N.; Fredericksen, B.W.; Rosenthal, D.M. Ring-and diffuse-porous species exhibit a spectrum of hydraulic behaviors from isohydry to anisohydry in a temperate deciduous forest. Trees 2021, 1–11. [Google Scholar] [CrossRef]
- Anderegg, W.R.; Schwalm, C.; Biondi, F.; Camarero, J.J.; Koch, G.; Litvak, M.; Ogle, K.; Shaw, J.D.; Shevliakova, E.; Williams, A. Pervasive drought legacies in forest ecosystems and their implications for carbon cycle models. Science 2015, 349, 528–532. [Google Scholar] [CrossRef] [Green Version]
- Huang, M.; Wang, X.; Keenan, T.F.; Piao, S. Drought timing influences the legacy of tree growth recovery. Glob. Chang. Biol. 2018, 24, 3546–3559. [Google Scholar] [CrossRef] [Green Version]
- Benson, M.C.; Miniat, C.F.; Oishi, A.C.; Denham, S.O.; Domec, J.C.; Johnson, D.M.; Missik, J.E.; Phillips, R.P.; Wood, J.D.; Novick, K.A. The xylem of anisohydric Quercus alba L. is more vulnerable to embolism than isohydric co-dominants. Plant Cell Environ. 2022, 45, 329–346. [Google Scholar] [CrossRef] [PubMed]
- Kannenberg, S.A.; Novick, K.A.; Phillips, R.P. Anisohydric behavior linked to persistent hydraulic damage and delayed drought recovery across seven North American tree species. New Phytol. 2019, 222, 1862–1872. [Google Scholar] [CrossRef] [PubMed]
- McDowell, N.; Pockman, W.T.; Allen, C.D.; Breshears, D.D.; Cobb, N.; Kolb, T.; Plaut, J.; Sperry, J.; West, A.; Williams, D.G. Mechanisms of plant survival and mortality during drought: Why do some plants survive while others succumb to drought? New Phytol. 2008, 178, 719–739. [Google Scholar] [CrossRef] [PubMed]
- Dittmar, C.; Fricke, W.; Elling, W. Impact of late frost events on radial growth of common beech (Fagus sylvatica L.) in Southern Germany. Eur. J. For. Res. 2006, 125, 249–259. [Google Scholar] [CrossRef]
- Fei, S.; Morin, R.S.; Oswalt, C.M.; Liebhold, A.M. Biomass losses resulting from insect and disease invasions in US forests. Proc. Natl. Acad. Sci. USA 2019, 116, 17371–17376. [Google Scholar] [CrossRef] [Green Version]
- D’orangeville, L.; Maxwell, J.; Kneeshaw, D.; Pederson, N.; Duchesne, L.; Logan, T.; Houle, D.; Arseneault, D.; Beier, C.M.; Bishop, D.A. Drought timing and local climate determine the sensitivity of eastern temperate forests to drought. Glob. Chang. Biol. 2018, 24, 2339–2351. [Google Scholar] [CrossRef]
- Elliott, K.J.; Miniat, C.F.; Pederson, N.; Laseter, S.H. Forest tree growth response to hydroclimate variability in the southern Appalachians. Glob. Chang. Biol. 2015, 21, 4627–4641. [Google Scholar] [CrossRef] [PubMed]
- Ficklin, D.L.; Novick, K.A. Historic and projected changes in vapor pressure deficit suggest a continental-scale drying of the United States atmosphere. J. Geophys. Res. Atmos. 2017, 122, 2061–2079. [Google Scholar] [CrossRef]
- Trenberth, K.E.; Dai, A.; Van Der Schrier, G.; Jones, P.D.; Barichivich, J.; Briffa, K.R.; Sheffield, J. Global warming and changes in drought. Nat. Clim. Chang. 2014, 4, 17–22. [Google Scholar] [CrossRef]
Figure 1.
Map of the 15 study sites in the eastern US (blue square), where co-occurring Carya ovata and Quercus alba were sampled and analyzed. Site abbreviations are listed in Table 1.
Figure 1.
Map of the 15 study sites in the eastern US (blue square), where co-occurring Carya ovata and Quercus alba were sampled and analyzed. Site abbreviations are listed in Table 1.

Figure 2.
Correlation coefficient of co-occurring Carya ovata (orange) and Quercus alba (blue) chronologies with (a) climatic water balance and (b) standardized precipitation evapotranspiration index (SPEI) at 15 sites from April to September as well as June-July-August (JJA) of current growing season during the common period 1908–2011. Horizontal dash line indicates 0.05 significance level.

Figure 3.
Percentage of standardized radial growth reduction of co-occurring Carya ovata (orange) and Quercus alba (blue) chronologies during drought (SPEI ≤ −1.5) of individual months and June-July–August (JJA) of current growing season at 15 study sites. Asterisk indicates that means of growth reduction between C. ovata and Q. alba are significantly different at a 0.01 level.

Figure 4.
Mean growth resilience to drought (SPEI ≤ −1.5) with 95% confidence interval of co-occurring Carya ovata (orange) and Quercus alba (blue) chronologies of individual months and June−July–August (JJA) of current growing season at 15 study sites.
Figure 4.
Mean growth resilience to drought (SPEI ≤ −1.5) with 95% confidence interval of co-occurring Carya ovata (orange) and Quercus alba (blue) chronologies of individual months and June−July–August (JJA) of current growing season at 15 study sites.


Table 1.
Summary of co-occurring Carya ovata (CYOV), Quercus alba (QUAL), and Quercus macrocarpa (QUMA) at 15 sites.
Table 1.
Summary of co-occurring Carya ovata (CYOV), Quercus alba (QUAL), and Quercus macrocarpa (QUMA) at 15 sites.
| Site, State (Abbreviation) | Latitude, Longitude | Species | Tree (Core) | Master Series (Year) | Inter-Series Correlation |
|---|---|---|---|---|---|
| Lacey Keosauqua, IA (LK) | 40.72, −91.98 | CYOV | 10 (20) | 165 (1855–2019) | 0.564 |
| QUAL | 24 (47) | 305 (1715–2019) | 0.655 | ||
| Palisades-Kepler IA (PK) | 41.91, −91.51 | CYOV | 10 (19) | 160 (1860–2019) | 0.637 |
| QUAL | 28 (56) | 249 (1770–2018) | 0.687 | ||
| Fox Ridge, IL (FR) | 39.40, −88.16 | CYOV | 10 (19) | 255 (1762–2016) | 0.515 |
| QUAL | 33 (68) | 341 (1674–2014) | 0.682 | ||
| Kickapoo, IL (KP) | 40.14, −87.75 | CYOV | 10 (19) | 172 (1845–2016) | 0.578 |
| QUAL | 24 (43) | 345 (1670–2014) | 0.668 | ||
| Lincoln’s New Salem, IL (NS) | 39.98, −89.85 | CYOV | 10 (19) | 170 (1847–2016) | 0.532 |
| QUAL | 43 (84) | 344 (1671–2014) | 0.719 | ||
| Donaldson Woods, IN (DW) | 38.73, −86.42 | CYOV | 9 (21) | 338 (1676–2013) | 0.618 |
| QUAL | 13 (27) | 289 (1725–2013) | 0.615 | ||
| Hemmer Woods, IN (HW) | 38.23, −87.37 | CYOV | 10 (20) | 264 (1753–2016) | 0.634 |
| QUAL | 16 (31) | 317 (1700–2016) | 0.659 | ||
| Lilly Dickey, IN (LD) | 39.24, −86.22 | CYOV | 9 (18) | 138 (2876–2013) | 0.625 |
| QUAL | 10 (20) | 151 (1863–2013) | 0.717 | ||
| Meltzer Woods, IN (MW) | 39.51, −85.67 | CYOV | 10 (19) | 347 (1670–2016) | 0.590 |
| QUMA | 9 (17) | 190 (1827–2016) | 0.610 | ||
| Morgan-Monroe, IN (MM) | 39.32, −86.41 | CYOV | 10 (20) | 125 (1891–2015) | 0.597 |
| QUAL | 11 (21) | 109 (1907–2015) | 0.575 | ||
| Pioneer Mothers, IN (PM) | 38.54, −86.45 | CYOV | 6 (12) | 127 (1886–2012) | 0.577 |
| QUAL | 22 (30) | 195 (1817–2011) | 0.577 | ||
| Babler State Park, MO (BS) | 38.62, −90.69 | CYOV | 15 (26) | 180 (1837–2016) | 0.607 |
| QUAL | 43 (85) | 375 (1641–2015) | 0.632 | ||
| Missouri flux tower, MO (MO) | 38.74, −92.20 | CYOV | 10 (20) | 109 (1908–2016) | 0.520 |
| QUAL | 10 (20) | 109 (1907–2015) | 0.681 | ||
| Goll Woods, OH (GW) | 41.55, −84.36 | CYOV | 9 (17) | 277 (1739–2015) | 0.525 |
| QUAL | 10 (20) | 257 (1760–2016) | 0.626 | ||
| Johnson Woods, OH (JW) | 40.88, −81.75 | CYOV | 10 (19) | 354 (1663–2016) | 0.563 |
| QUAL | 41 (76) | 387 (1626–2012) | 0.662 |
Table 2.
The linear mixed models showing the fixed effect estimates, standard error (SE), and degree of freedom (df) when analyzing the relationship between monthly climatic water balance (CWB) and the standardized growth of co-occurring Carya ovata and Quercus alba (QUAL) over 1908–2011 at 15 sites.
| Month | Variables | Estimate ± SE | df | t-Value | p-Value |
|---|---|---|---|---|---|
| May | Intercept | 0.997 ± 0.01 | 1 | 92.175 | 0.007 |
| CWB | 0.00038 ± 0.00007 | 2333 | 5.496 | <0.001 | |
| CWB: QUAL | 0.00023 ± 0.0001 | 1290 | 2.322 | 0.02 | |
| June | Intercept | 1.061 ± 0.013 | 1 | 84.55 | 0.008 |
| CWB | 0.00123 ± 0.00007 | 728.6 | 17.104 | <0.001 | |
| CWB: QUAL | 0.00016 ± 0.0001 | 205.6 | 1.564 | 0.12 | |
| July | Intercept | 1.043 ± 0.019 | 1 | 53.548 | 0.0117 |
| CWB | 0.00063 ± 0.00007 | 1206 | 8.762 | <0.001 | |
| CWB: QUAL | 0.00029 ± 0.0001 | 405.1 | 2.894 | 0.004 | |
| August | Intercept | 1.005 ± 0.006 | 1 | 170.3 | 0.0037 |
| CWB | 0.00042 ± 0.00008 | 6.871 | 5.469 | 0.001 | |
| CWB: QUAL | −0.00013 ± 0.00009 | 0.7 | -1.473 | 0.457 | |
| JJA | Intercept | 1.118 ± 0.021 | 1 | 52.6 | 0.01 |
| CWB | 0.0018 ± 0.0001 | 624.7 | 16.1 | <0.001 | |
| CWB: QUAL | 0.00036 ± 0.0002 | 167.2 | 2.341 | 0.02 |
Publisher’s Note: MDPI stays neutral with regard to jurisdictional claims in published maps and institutional affiliations. |
© 2022 by the authors. Licensee MDPI, Basel, Switzerland. This article is an open access article distributed under the terms and conditions of the Creative Commons Attribution (CC BY) license (https://creativecommons.org/licenses/by/4.0/).
Share and Cite
MDPI and ACS Style
Au, T.F.; Maxwell, J.T. Drought Sensitivity and Resilience of Oak–Hickory Stands in the Eastern United States. Forests 2022, 13, 389. https://0-doi-org.brum.beds.ac.uk/10.3390/f13030389
AMA Style
Au TF, Maxwell JT. Drought Sensitivity and Resilience of Oak–Hickory Stands in the Eastern United States. Forests. 2022; 13(3):389. https://0-doi-org.brum.beds.ac.uk/10.3390/f13030389
Chicago/Turabian StyleAu, Tsun Fung, and Justin T. Maxwell. 2022. "Drought Sensitivity and Resilience of Oak–Hickory Stands in the Eastern United States" Forests 13, no. 3: 389. https://0-doi-org.brum.beds.ac.uk/10.3390/f13030389
Note that from the first issue of 2016, this journal uses article numbers instead of page numbers. See further details here.