
Evaluation of PM2.5 Retention Capacity and Structural Optimization of Urban Park Green Spaces in Beijing


1
State Key Laboratory of Urban and Regional Ecology, Research Center for Eco-Environmental Sciences, Chinese Academy of Sciences, Beijing 100085, China
2
College of Resources and Environment, University of Chinese Academy of Sciences, Beijing 100049, China
*
Author to whom correspondence should be addressed.
Forests 2022, 13(3), 415; https://0-doi-org.brum.beds.ac.uk/10.3390/f13030415
Submission received: 6 February 2022
/
Revised: 1 March 2022
/
Accepted: 3 March 2022
/
Published: 5 March 2022
(This article belongs to the Special Issue Advances on the Influence of Vegetation and Forest on Urban Air Quality and Thermal Comfort)
Abstract
:Green space can effectively retain particles and improve air quality. However, most studies have focused on leaf-scale measurements or regional-scale model simulations, and few focus on individual trees. In this study, 176 urban park green spaces were selected within the 5th Ring Road in Beijing, and the i-Tree Eco model was used to estimate the PM2.5 retention levels of individual trees and sample plots. The results show that the retention capacity varied according to tree species. The PM2.5 retention of each sample plot was significantly affected by the tree coverage, species richness, mean tree height, mean crown width, and number of trees. The PM2.5 retention of urban park green spaces in the study area was estimated to be about 6380 t·year−1, and the air quality improvement rate was 1.62%. After structural optimizing, PM2.5 retention of the mixed coniferous and broad-leaved green space was as high as 80,000 g·year−1. This study studied the effects of trees on PM2.5 retention at multiple scales to fill the gaps in existing research at the scales of individual trees and communities, and it can serve as a reliable reference for the design and construction of green spaces aimed at improving air quality.
1. Introduction
Particulate matter (PM) refers to solid or liquid particles suspended in the atmosphere and is the main component of air pollutants [1]. PM pollution has serious adverse effects on human health, being not only the cause of various respiratory and cardiovascular diseases but also leading to premature human death and prenatal death [2,3]. Due to the small particle size and large specific surface area of PM2.5 (PM with a diameter <2.5 μm), it can easily carry toxic and harmful substances, has a long residence time, and can be transported over long distances in the atmosphere. Consequently, PM2.5 has a substantial negative impact on human health and air quality [4,5]. Due to the retention effect of vegetation on PM, green space construction has become an important measure to prevent and control PM pollution [6,7].
Many studies have explored, from different perspectives, the ability of vegetation to retain dust. Leaf characteristics, green space structure, and meteorological conditions all affect the deposition of PM on the surface of vegetation [7,8,9]. Existing studies have generally concluded that rough and sticky blades are more conducive to dust retention; the blade size and inclination angle also affect the process for the dry deposition of PM [10,11]. The green space structure has a significant impact on the PM retention effect of the green space [9,12]. The leaf area index (LAI), leaf area density, and canopy density are important influencing factors [12]. The more complex the structure of the green space, the stronger the dust retention effect [13]. Moreover, due to the difference in the PM retention capacities between tree species, the composition of the tree species will also affect the PM retention capacity of the green space [11,14]. Meteorological factors such as temperature, humidity, wind speed, and precipitation are also important parameters that affect PM retention and thus are also necessary input parameters for related models [15,16]. Temperature affects the diffusion and deposition process of PM [17]. Moisture in the atmosphere is directly related to the hygroscopic growth process of PM and increases the stickiness of the plant surface, thereby accelerating deposition and reducing the PM resuspension [18]. Wind speed has a direct effect on both the processes of deposition and resuspension of PM [19]. PM retention is also related to the environmental concentration of PM: the higher the ambient concentration, the greater the gravity deposition velocity and PM retention [16].
It is very difficult to directly measure the amount of PM retained by a plant or a green space. Therefore, accurate quantification of PM retained on the surfaces of plants is usually only carried out at the leaf scale [20,21]. PM retention studies carried out on a larger scale usually rely on dry deposition models. The UFORE model and the subsequent i-Tree model released by the USDA (US Department of Agriculture) Forest Service are widely used worldwide [12,22]. Many scholars have used the i-Tree model to estimate PM retention by vegetation in specific regions and cities [23,24,25]. However, these two types of studies may not fully reflect the mechanisms of PM retention in plants because the scale of the research is either too small or too large. Moreover, it is easy to ignore the influence of some important parameters at the individual or community level, resulting in relatively limited results that may not be able to provide a suitable reference for specific green space construction.
The present study focuses on urban park green spaces in Beijing as the research object. Based on a field investigation and model simulations and starting from individual trees, we studied PM2.5 retention and its influencing factors in the sample plot and at regional scales. To fully consider the status quo of the construction of urban park green spaces in Beijing and achieve better PM2.5 retention capabilities, the structures of green spaces were accordingly optimized. The purpose of this work is to bridge the gap between studies of PM retention in green spaces at different scales and to provide support for the design and construction of green spaces for improved air quality.
2. Materials and Methods
2.1. Study Sites
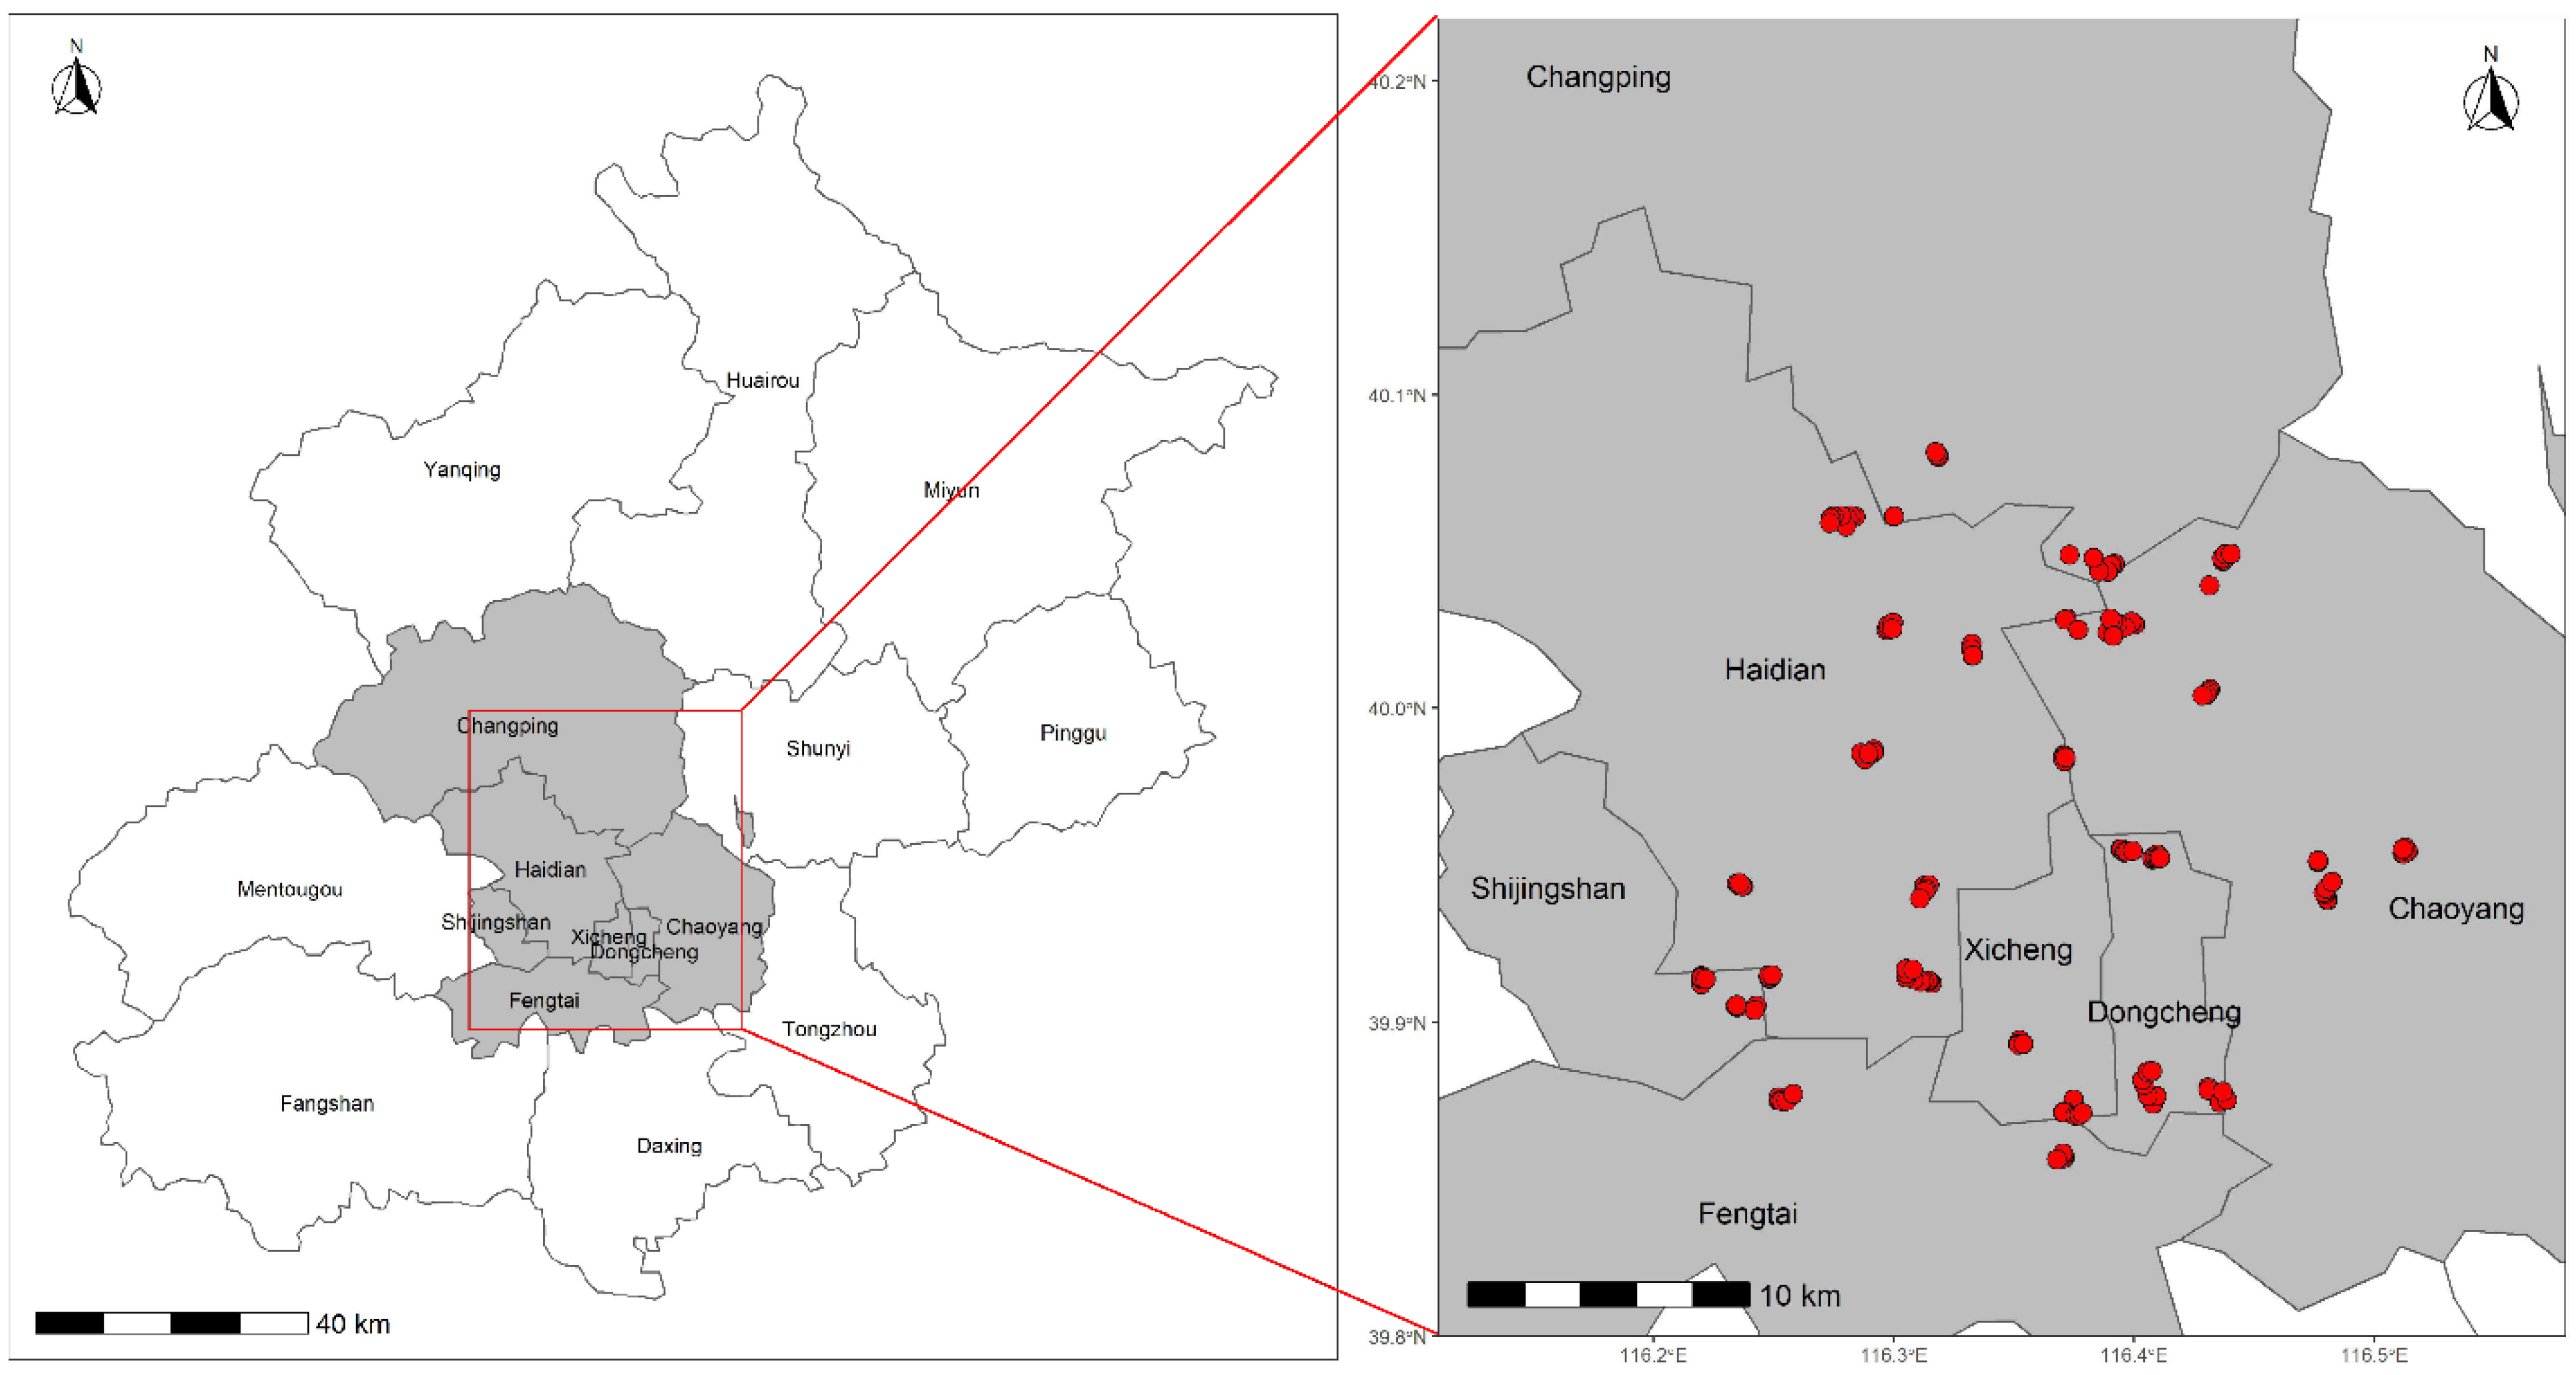
Beijing, the capital of China, is located in the northern part of the North China Plain, with its center located at 116°20′ east longitude and 39°56′ north latitude. Beijing has jurisdiction over 16 districts, with a total area of 16,410.54 km2. Beijing has a warm temperate semi-humid and semi-arid monsoon climate, with hot and rainy summers, cold and dry winters, and a short spring and autumn. The study area is within the 5th Ring Road in Beijing, covering an area of about 667 km2 and involving seven administrative districts, among which the urban park covers an area of 64.8 km2 [26]. In total, 176 green spaces were selected from 28 parks in 7 administrative districts, most of which were located within Beijing’s 5th Ring Road (due to the phenomenon that the park was separated by the 5th Ring Road, a few sample sites were located outside the 5th Ring Road) (Figure 1). These green spaces were located in different directions in each park, separated from each other by hardened ground, and the canopies were not connected. These green spaces belonged to 3 community types, including 17 tree lands, 77 tree–herb lands, and 82 tree–shrub–herb lands.
2.2. Field Investigation
A 20 m × 20 m sample plot was set up at a distance of 5 m from the edge of each green space to investigate the green space structure. The survey time encompassed the rainless days from July to September 2017. The surveyed features include the following: vegetation coverage, tree coverage, shrub coverage, and herb coverage. We also measured and recorded the species, tree height, crown base height, and crown width of each tree in the sample plot. Additionally, the tree species richness, mean tree height, mean tree diameter at breast height (DBH), mean tree crown width, and number of trees in each sample plot were obtained by calculations. The species and height and number of shrubs were also measured and recorded, and the woody species richness of each sample plot was calculated in combination with tree species. Further, five quadrats of 1 m × 1 m were set along the diagonal of the sample plot (one at the center and four at the corners), the species and heights of herbs in each quadrats were measured and recorded, and the data were accumulated to represent the herb information of the sample plot.
2.3. i-Tree Model Simulation
i-Tree is a software suite developed by the USDA Forest Service that provides urban and rural forestry analysis and benefit assessment tools. Since the initial release of i-Tree tools in 2006, this software has been widely used to quantify the benefits and values of individual trees and forests [27,28]. The most commonly used i-Tree tool is the i-Tree Eco model. i-Tree Eco version 6 is a flexible software application designed to use data collected in the field from single trees, complete inventories, or randomly located plots throughout a study area along with local hourly air pollution and meteorological data to quantify the forest structure, environmental effects, and value to communities [29]. In this study, the i-Tree Eco model was used to assess the PM2.5 retention in urban park green space. Complete inventories of 176 sample plots were conducted using information obtained from field surveys. The input parameters included tree species, land use, DBH, dieback (%), total tree height, live tree height, crown base height, crown width (N–S), crown width (E–W), and missing crown (%). Hourly pollution concentration data were obtained from the China National Environmental Monitoring Centre, and hourly weather data were obtained from the Beijing Capital International Airport weather station, both selected from i-Tree Eco’s database list. The core algorithm to determine PM2.5 deposition per unit leaf area in i-Tree Eco is as follows:
where Ft represents PM2.5 flux at time (g·m−2·h−1), Vd,t represents deposition velocity at time t (m·s−1), and Ct represents PM2.5 concentration at time t (g·m−3).
Ft = Vd,t × Ct × 3600
In i-Tree Eco, deposition velocity for PM2.5 was based on the average measured values from the literature, which were adjusted depending on the leaf phenology and leaf area. Air pollution removal estimates used the LAI and percent of evergreen, which were derived by the Eco model. LAI was estimated using species, total height, crown base height, crown width, and percent of missing crown. Percent of evergreen was estimated based on the amount of leaf area contributed by evergreen species. In addition, i-Tree Eco also takes into account the resuspension of particles and wash-off from precipitation when estimating PM removal. A more complete description of the model can be found in Hirabayashi et al. [30].
2.4. Statistical Analyses
In this study, the K-means clustering method was used to cluster tree species and sample plots. First, the number of clusters was determined by the fviz_nbclust function in “factoextra” package, and then the “stats” package was used for subsequent K-means calculations. The Wilcoxon rank sum test was used to test whether there were significant differences in structural characteristics and PM2.5 retention between broad-leaved and coniferous species. Kruskal–Wallis ANOVA with post hoc Dunn’s multiple comparison test was used to test for significant differences in PM2.5 retention between three types of sample plots and between sample plots in seven administrative districts. The relationship between green space structure and PM2.5 retention was analyzed using multiple stepwise regression. All analyses were performed using R 4.0.2.
The PM2.5 retention in urban park green spaces within the 5th Ring Road of Beijing was calculated according to the following equations:
where is the annual PM2.5 retention amount per unit area of urban park green space (g·m−2·year−1), Ap is the area of urban park green space (m2), Favg is the average annual PM2.5 retention amount of the sample plot (g·year−1), and Aavg is the sample plot area (m2).
Fp = R × Ap
R = Favg/Aavg
The air quality improvement rate of urban park green space in the study area was calculated as follows:
where S is the PM2.5 stock in the atmosphere within the 5th Ring Road of Beijing.
P = Fp/(Fp + S)
The optimization of green space structure in this study involved a random sampling combination of 56 tree species with replacements. When the cumulative area of the canopy exceeded the set sample plot size, we stopped and recorded the data, generated the corresponding configuration combination, and calculated the annual PM2.5 retention amount. After 300 million calculations, 10 configuration combinations with the highest PM2.5 retention levels were screened out. The set sample plot size for structural optimization was then calculated according to the following equation:
where A is the set sample plot size for structural optimization (m2), and B is the area ratio of a rectangle to a circle of the same diameter, set to 1.27. This parameter is used because in the calculation, the occupied shape of the tree is calculated as a rectangle, whereas in the survey, the tree canopy is closer to a circle. D is the average canopy coverage in the sample plot based on the field investigation data—that is, the ratio of the canopy area to the sample plot area.
A = Aavg × B × D
3. Results
3.1. Species-Level PM2.5 Retention
The 176 sample plots investigated in this study contained 3952 trees corresponding to 23 families, 44 genera, and 56 species. The main characteristics of trees in the sample plots are shown in Table 1. The 11 most numerous species were Sabina chinensis, Pinus tabuliformis, Ginkgo biloba, Robina pseudoacacia, Sophora japonica, Platycladus orientalis, Populus alba, Fraxinus chinensis, Malus spectabilis, Koelreuteria paniculata, and Pinus bungeana, accounting for about 75% of the total. The 11 species with the largest contribution of PM2.5 retention were Populus alba, Sabina chinensis, Populus tomentosa, Robina pseudoacacia, Ginkgo biloba, Pinus tabuliformis, Platycladus orientalis, Koelreuteria paniculata, Sophora japonica, Fraxinus chinensis, and Salix babylonica; the PM2.5 retention of these tree species accounted for about 75% of total PM2.5 retention.
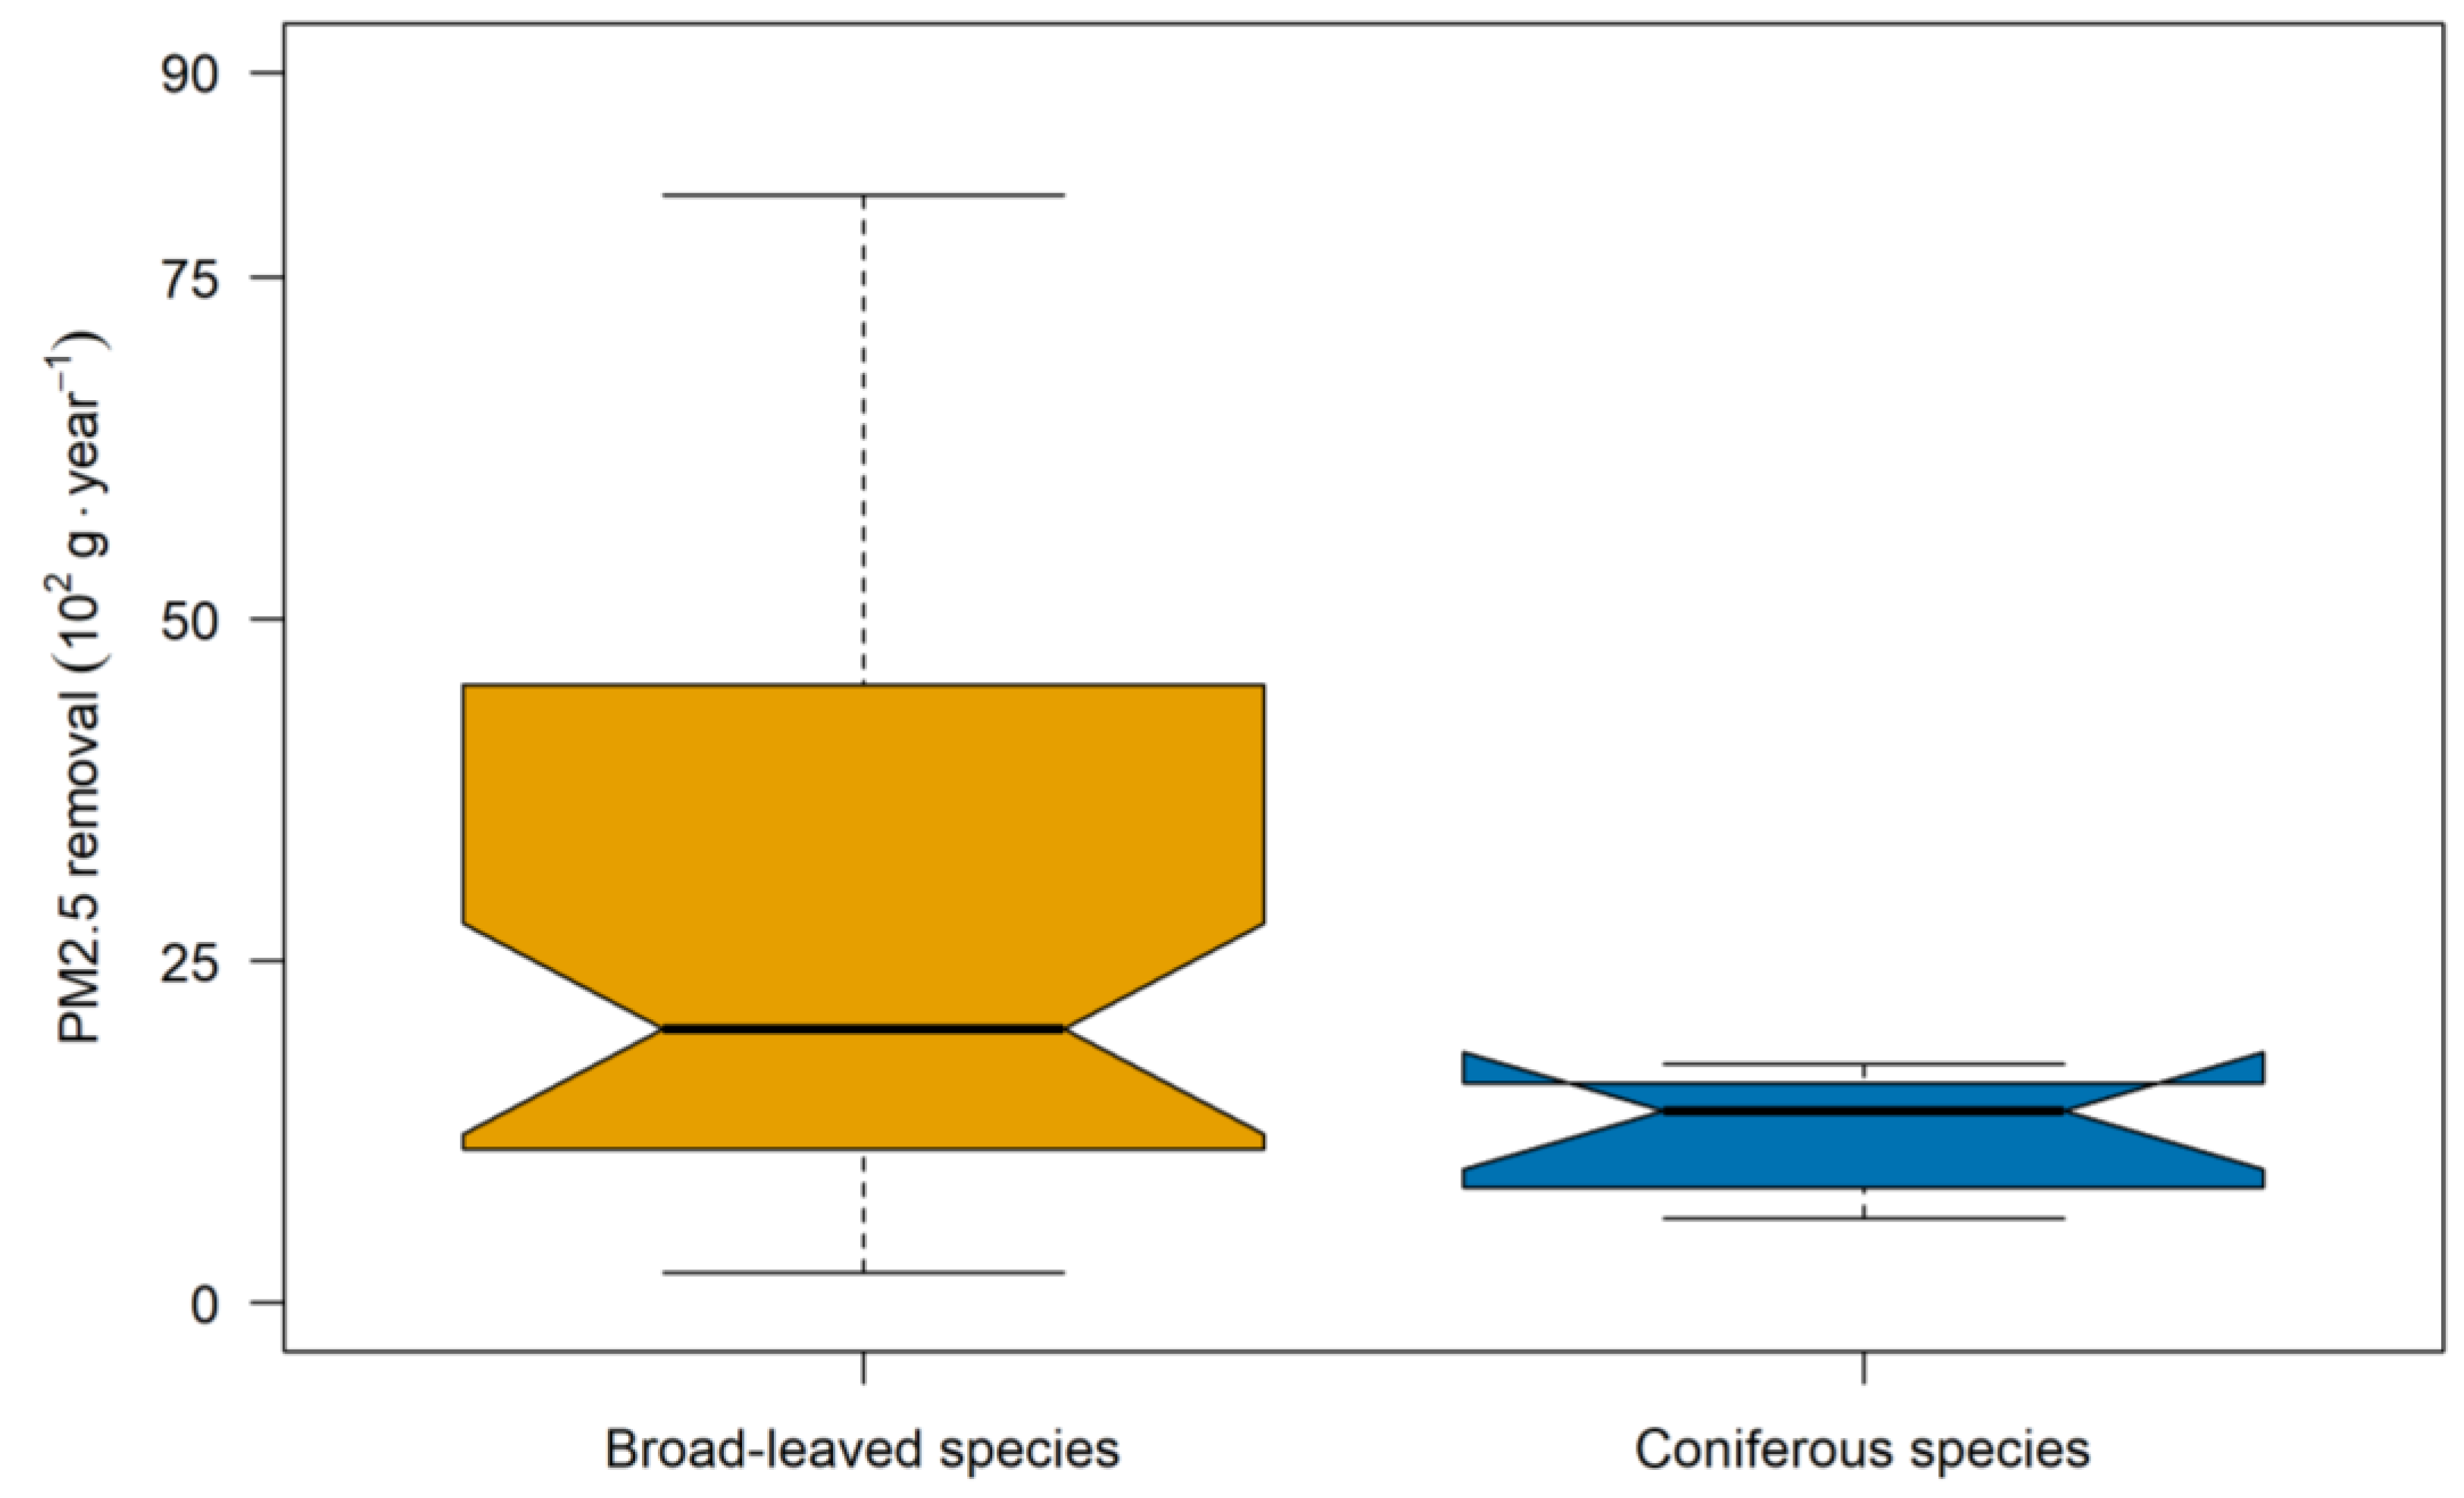
The PM2.5 retention capacities of different tree species were found to be significantly different. Among the tree species with a sample size of ≥3, the annual PM2.5 retention was the highest for Populus tomentosa (12,234.06 g per tree) and lowest for Rhus typhina (221.2 g per tree). The average PM2.5 retention was 1790 g per tree. There were a total of 14 tree species with a PM2.5 retention of more than 3000 g per tree. The results of the Wilcoxon rank sum test for 48 broad-leaved tree species and 8 coniferous tree species showed that the tree height, crown base height, and crown diameter (N–S and E–W) of broad-leaved tree species were significantly higher than those of conifers (Table 1), and the PM2.5 retention per tree of broad-leaved tree species was significantly higher than that of coniferous species (p-value: 0.0427) (Figure 2).
3.2. Green Space-Level PM2.5 Retention
The annual PM2.5 retention levels of the 176 investigated sample plots were between 845.8 and 173,427 g, with an average of 39,376 g. Around 82% of the sample plots (144/176) had PM2.5 retention levels below 57,845.8 g·year−1. The results of the regression analyses showed that the tree coverage, tree species richness, mean tree height, mean crown width, and number of trees had significant positive effects on the PM2.5 retention in the green space. These structural parameters explained about 64% of the PM2.5 retention in the green space, and the mean tree height had the greatest impact on PM2.5 retention (Table 2).
The 176 sample plots were clustered according to the green space structure, and three types of green space were extracted. The results of the Kruskal–Wallis ANOVA with post hoc Dunn’s multiple comparison test on the PM2.5 retention corresponding to the three types of green space, referred to as groups, showed that the PM2.5 retention in Group 1 was significantly higher than that in Group 2, and both were significantly higher than that in Group 3 (Table 3). The differences in the structures of these three types of green space were mainly reflected in the following results: the tree coverage in Group 2 was significantly higher than that in Group 1, and both were significantly higher than that in Group 3; the shrub coverage and herb coverage in Group 3 were significantly higher than those in Groups 1 and 2; the mean tree height, mean DBH, and mean crown width in Group 1 were significantly higher than those in Groups 2 and 3; and the number of trees in Group 2 was significantly higher than that in Groups 1 and 3.
3.3. PM2.5 Retention of Urban Park Green Space in the Study Area
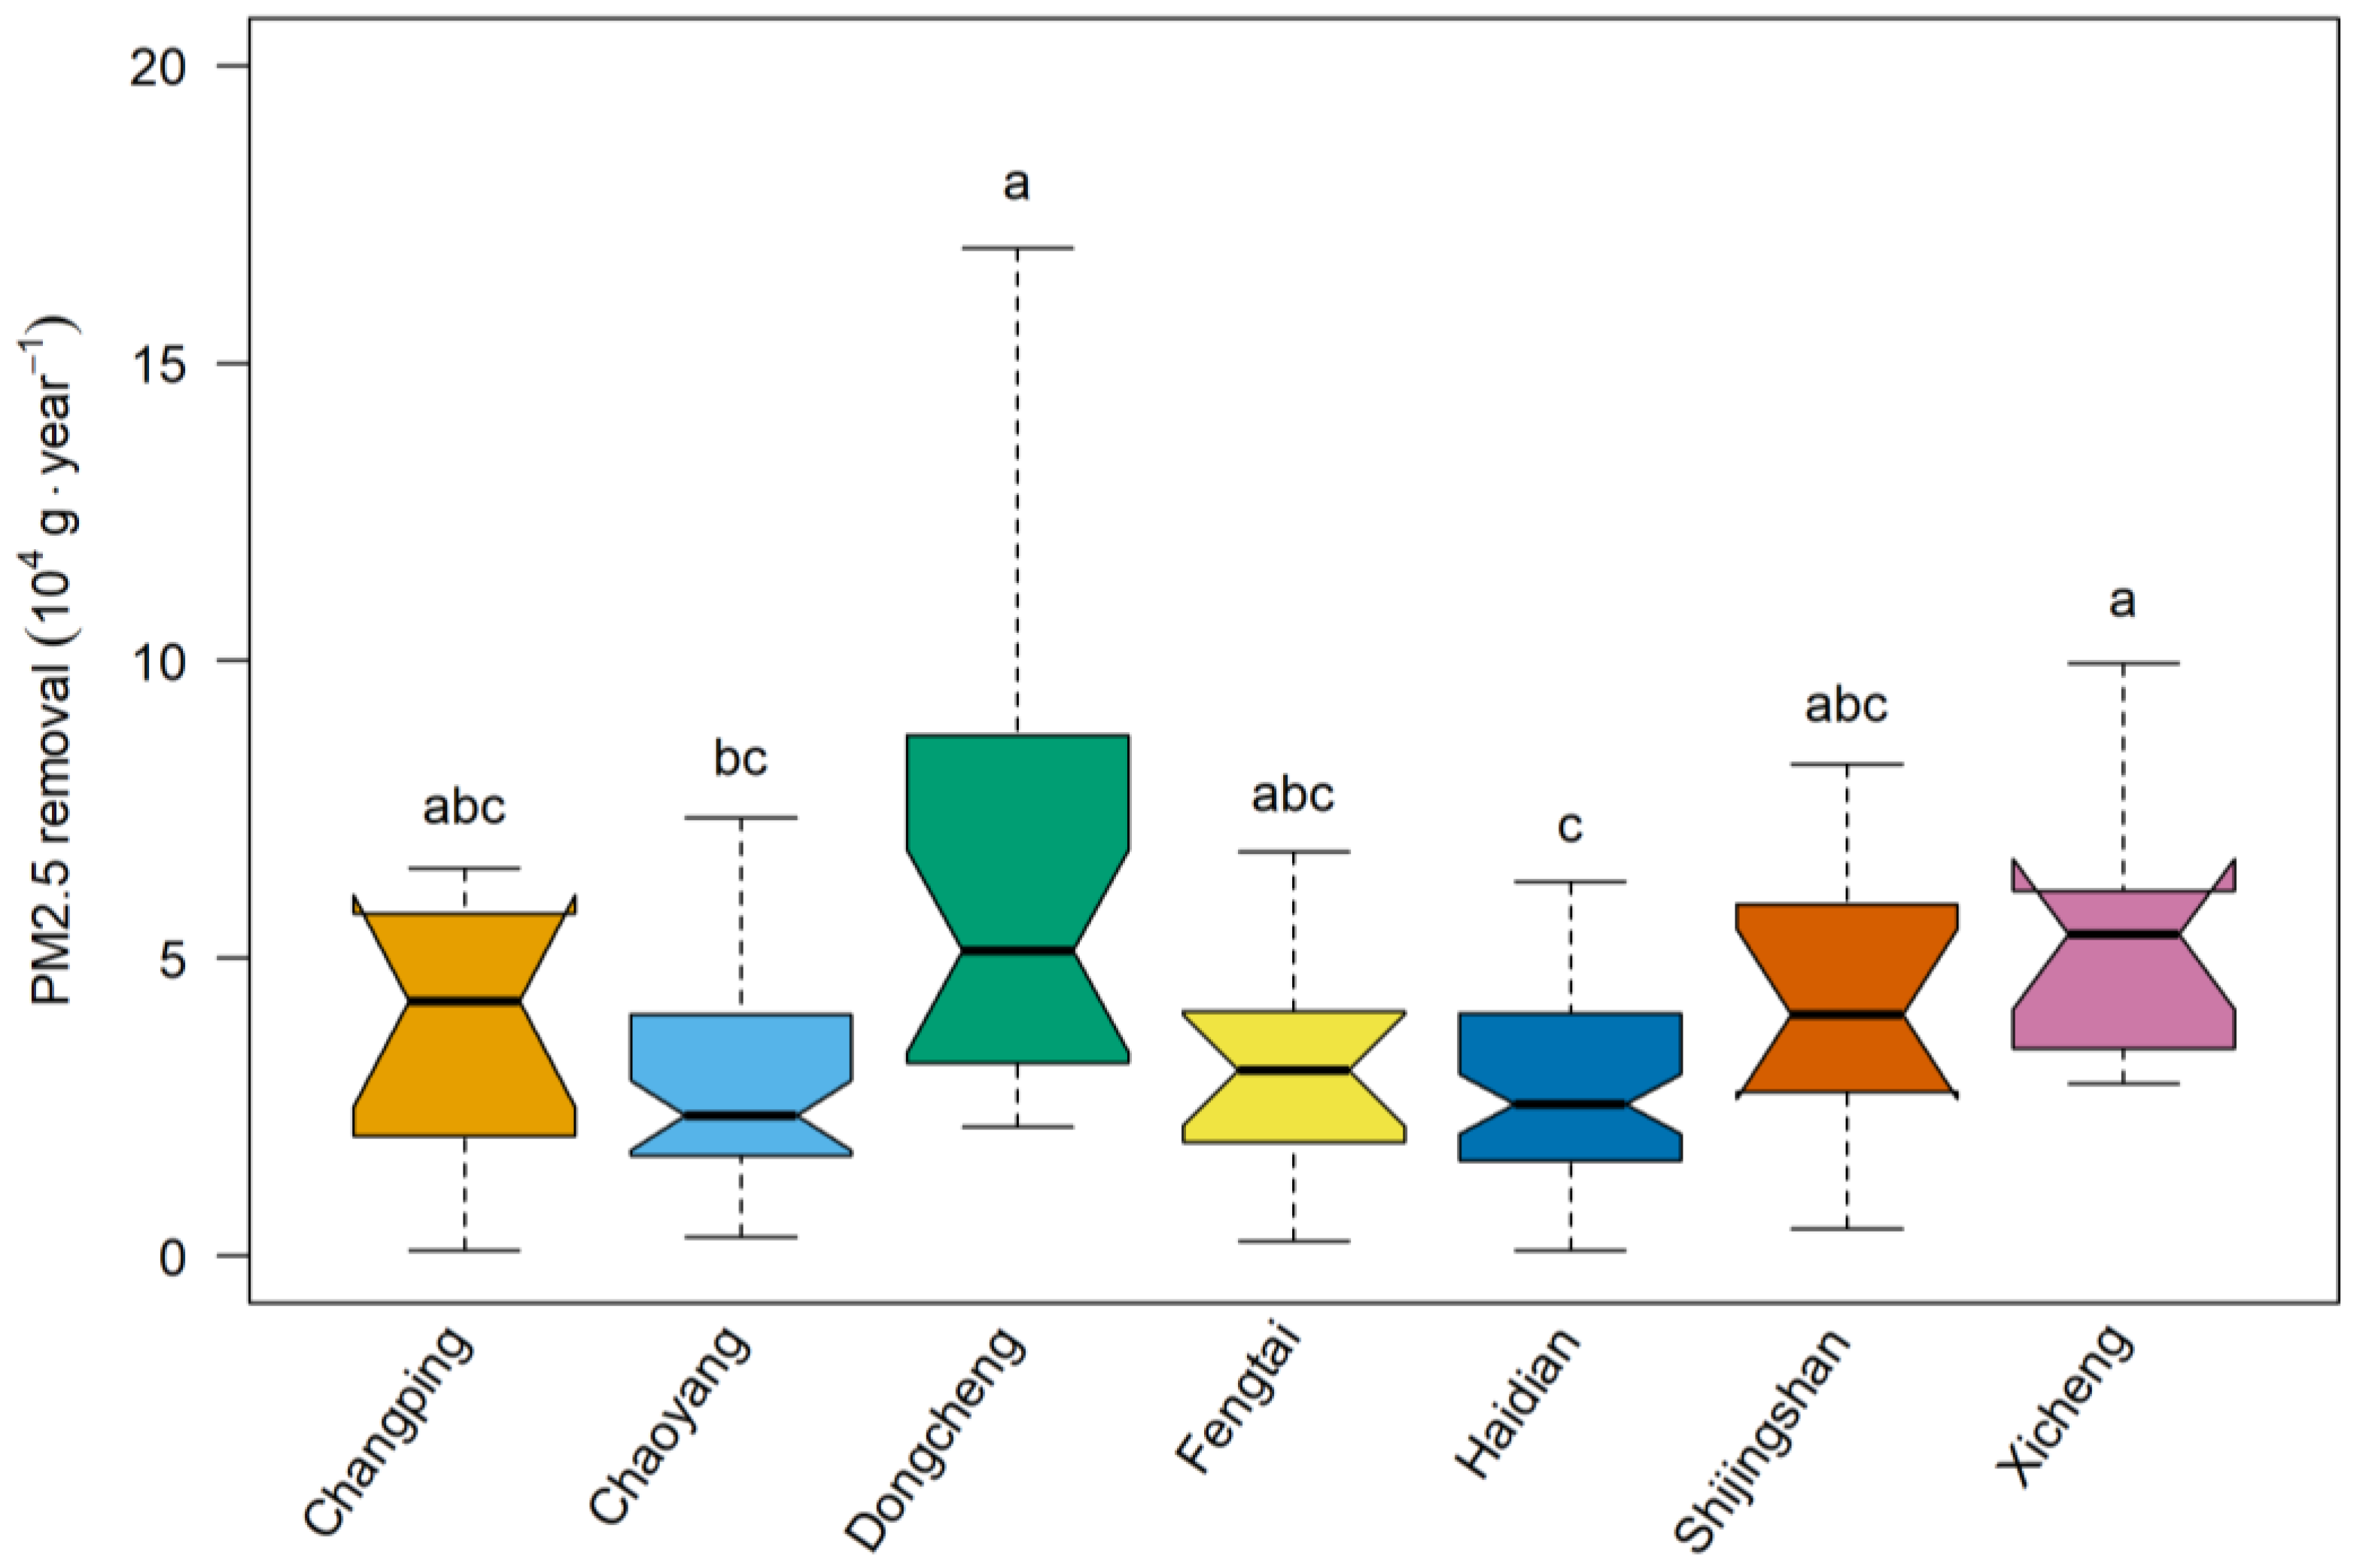
The 176 sample plots were located in 7 administrative districts, including 11 in Changping District, 40 in Chaoyang District, 26 in Dongcheng District, 14 in Fengtai District, 62 in Haidian District, 12 in Shijingshan District, and 11 in Xicheng District. The PM2.5 retention levels of the sample plots in Dongcheng and Xicheng Districts were significantly higher than those in Chaoyang and Haidian Districts (Figure 3).
Based on the annual PM2.5 retention per unit area of the surveyed sample plots, we estimated the annual PM2.5 retention in the urban park green spaces within the 5th Ring Road of Beijing. The average annual PM2.5 retention (Favg) of the sample plots was 39,746 g, and the average area of the sample plots (Aavg) was 400 m2. The annual PM2.5 retention rate (R) of the urban park green space was 99.44 g·m−2 (Equation (3)). According to the statistics published by the Beijing Gardening and Greening Bureau [26], the area (Ap) of the parks within the 5th Ring Road in Beijing is about 64,800,537 m2, and the annual PM2.5 retention (Fp) of the urban park green spaces within the 5th Ring Road in Beijing is 6380 t (Equation (2)).
According to the research of Wang et al. [31], in 2017, the PM2.5 stock (S) in the atmosphere of the 5th Ring Road in Beijing was 388,000 t. Using Equation (4), the improvement rate (P) of PM2.5 of urban park green spaces within the 5th Ring Road in Beijing was found to be 1.62%.
3.4. Structural Optimization of Green Spaces
The average canopy coverage (D) of the sample plots was 101%. Simulations were performed using 515 m2 as the set sample size based on Equation (5). Table 4 presents the 10 configuration combinations with the highest PM2.5 retention after 300 million calculations. These 10 combinations ranged from 79,947.99 to 82,778.22 g in the annual PM2.5 retention, the tree species richness ranged from 4 to 11, and the number of trees ranged from 8 to 17. Combinations 1, 4, 5, 7, 8, and 9 were green spaces with mixed coniferous and broad-leaved trees, and combinations 2, 3, 6, and 10 were green spaces with broad-leaved trees. From the perspective of vertical structure, combinations 1, 2, 4, 5, 6, 7, 8, 9, and 10 were multi-layered green space, and combination 3 was single-layered green space. Among these combinations, Populus tomentosa appeared the most frequently. Syringa oblata was the most frequently found small tree/shrub.
Eight coniferous species were used for the configuration, and the results are shown in Table 5. In the coniferous forest configuration, the three cypresses (Platycladus orientalis, Sabina chinensis, and Juniperus formosana) were dominant in frequency. The annual dust retention capacity of coniferous green spaces was found to reach more than 50,000 g.
4. Discussion
The PM2.5 retention capacity varied greatly between different tree species. The annual PM2.5 retention of the 56 tree species involved in this study ranged from 221.2 to 12,234.06 g per tree, and the maximum difference between species reached 12,000 g per tree. There have been many studies on the differences in PM retention capacity between tree species. Most of these studies have compared the PM retention per unit leaf area of different species at the leaf scale. The results show that the main factors leading to the differences in PM retention capacities between species were the microscopic characteristics of the leaves, such as whether the leaf surface was attached to hairs, whether there were trichomes, and differences in stomatal density and roughness [11,12,32,33]. In this study, each tree was taken as a whole to evaluate the annual PM2.5 retention in combination with air PM concentration and meteorological conditions. This process distinguished between the leafy and leafless stages of trees and also took into account seasonal changes in the tree’s PM2.5 retention capacity. In addition, the wet deposition process of PM was also considered in i-Tree Eco, a process where a new round of PM retention is started by precipitation-flushing the PM from the leaf surface to the ground surface [30]. In this study, the three-dimensional structures of trees, rather than leaf characteristics, were the decisive factor for species PM2.5 retention. Although broad-leaved tree species have a deciduous period, the annual PM2.5 retention per tree among the broad-leaved tree species was found to be significantly higher than that of the coniferous species due to the greater tree height and larger crown width in the former group (Table 1 and Figure 2). The results of the structural optimization of green spaces also confirmed this; the green space composed of conifers did not have higher PM2.5 retention than the green space composed of broad-leaved trees (Table 4 and Table 5). These results are inconsistent with previous studies, as the results of PM retention at the leaf scale often show that conifer species have higher PM retention capacities than broad-leaved species [12]. Differences in study scale and method are responsible for this inconsistency. The interpretation and generalization of the results obtained need to fully consider the research scale. In the future, incorporating leaf-scale findings into relevant models to differentiate PM retention capabilities among species may bring us new insights.
Evaluating PM2.5 retention at the green space level essentially involves taking the sum of the PM2.5 retention of each tree in the green space. However, the result was of great significance in reflecting the real structures and dust retention functions of the urban park green spaces in Beijing. Our study found that the morphological characteristics of trees within a green space, rather than the number, most strongly affected the PM2.5 retention capacity of the green space (Table 2 and Table 3). Tall trees are more conducive to PM2.5 retention, and the mean tree height of trees in the green space was the structural parameter that had the greatest influence on the level of PM2.5 retention (Table 2). According to the clustering results of the green space structure, although the number of trees in Group 1 was only half that in Group 2, the PM2.5 retention of trees in Group 1 was twice that in Group 2 due to the dominant morphological characteristics of the trees in that green space. Only when the morphological characteristics of trees were at the same level did the number of trees significantly affect the PM2.5 retention capacity of the green space. There was no significant difference in tree morphology between Groups 2 and 3, whereas the number of trees in Group 2 was 1.9 times that in Group 3, and the corresponding PM2.5 retention capacity was 1.6 times that of Group 3 (Table 3). Considering its influence on PM2.5 retention, tree height should be an important configuration parameter in green space construction, as optimizing the vertical structures of trees may result in benefits from increased PM2.5 retention. At the same time, the results of this study remind us that, in the construction of green space, we should not blindly pursue a greater quantity of trees. Instead, we should leave enough space for the growth of trees to allow increased PM retention. We believe that it is also crucial to balance the quantity and quality of trees in green space planning and design in consideration of other ecological benefits.
Dongcheng District and Xicheng District, which are located in the core of Beijing, are the oldest urban areas of Beijing and have been urbanized for the longest time. Due to historical and cultural reasons, many parks in these two districts were transformed from royal gardens and private gardens; consequently, there are many old and large trees in these areas [34,35]. We argue that this greater number of old and large trees is the main reason why the PM2.5 retention of sample plots in Dongcheng and Xicheng districts is significantly higher than that in other districts.
Many studies used dry deposition models to estimate the amount of PM retention in green spaces within specific areas of Beijing but with rather varied results. Xiao et al. [36] used the NDVI (normalized difference vegetation index) to estimate the LAI of the study area and combined the NDVI with the dry deposition model to estimate the total PM2.5 retention in urban green space within the 5th Ring Road of Beijing in 2000, 2005, and 2010 (156.3, 304.7, and 423.7 t, respectively). Using the core algorithm of the UFORE model combined with the NDVI index, Wang et al. [31] calculated that the total PM2.5 retention of urban green spaces (coniferous forests, broad-leaved forests, and grasslands) within the 5th Ring Road in Beijing in 2017 was 922.63 t. The results of our study indicate that the PM2.5 retention in urban park green spaces within the 5th Ring Road of Beijing is 6380 t, which is much higher than the values in the aforementioned research results. This variance in results is likely due to differences in the employed estimation methods. The mentioned studies first estimated the LAI of the region through remote sensing images and then used the dry deposition model or the mathematical formula in the model for calculations. This approach ignores the three-dimensional structures of trees when estimating LAI in an area, and our research has shown that tree height is an important parameter affecting PM retention (Table 2). Furthermore, a limitation of NDVI is its lower sensitivity to areas with high vegetation coverage [37,38]. Therefore, using this approach to study urban green spaces will generate large errors, especially when the resolution of remote sensing images is low, which may lead to a substantial underestimation of the PM retention of assessed regional vegetation.
Referring to research on the PM retention of trees at a small scale, He et al. [39] showed that in winter, the PM2.5 retention per unit leaf area of broad-leaved trees can reach 0.15 mg·cm−2. In the study of Meier et al. [40], the number of fallen leaves observed on the ground under the canopy was 2700–5000 pieces per square meter. Based on the average crown width obtained in the present study, we calculated that the average number of leaves per tree is about 60,000, whereas the PM2.5 retention of a tree with a single-leaf area of 30 cm2 is about 279 g. It should be noted that this is only an instantaneous value; a tree will experience several dust retention processes under the action of precipitation over a year. Therefore, the annual PM2.5 retention of a tree calculated in this way is closer to our research results (1790 g). According to a study by Yang et al. [41], there were about 2,000,000 trees within the 4th Ring Road in Beijing in 2002, which provided 3580 t of dust retention. However, considering that our study area is larger, and the number of trees for green construction is increasing, the annual PM2.5 retention of urban park green spaces within the 5th Ring Road in Beijing obtained in this study is reasonable. Although the above analysis only provides a rough calculation, it is sufficient to demonstrate that the PM retention of green spaces calculated from individual trees will be much higher than the results obtained by using remote sensing images to estimate the LAI of a region.
Due to differences in the background concentration of atmospheric PM in the different study areas, there will inevitably be large differences in the amount of PM retained by green spaces. Thus, it would be more meaningful to use the PM improvement rate as a reference. Based on the i-Tree eco model, Wu et al. [42] found that the urban vegetation in Shenzhen (a city in China) had improved PM2.5 levels, which had decreased by about 1%. Zhang et al. [43] used the NDVI to estimate the LAI of shelter forests in the Three Norths of China on a large scale and combined the dry deposition model with the vegetation collection model. Using this methodology, the authors found that the rate of atmospheric PM2.5 improvement by the shelter forest with a vegetation coverage of about 12.4% was about 1%, which is similar to the improvement rate obtained in our study (1.62%).
Urban park green spaces in Beijing have high potential for PM retention. In this study, the i-Tree model was used to simulate the PM2.5 retention of each tree based on a field investigation, and structural optimization of the green space was carried out on this basis. The PM2.5 retention capacity of the optimized sample plot was found to reach more than twice the average value of the field survey (Table 4 and Table 5). At the same time, these configuration combinations have high diversity and can meet various needs, thus providing a reliable reference for developing green space configurations that exert the benefits of PM retention.
This study took individual trees as the basic research unit and comprehensively considered the seasonal changes in trees and environmental factors to evaluate the annual PM2.5 retention of trees. Compared to previous research, the results of this study more accurately reflect the PM2.5 retention capacity of trees under real conditions and have greater significance as a reference for green space construction work. The main disadvantage of this study is the possibility that we overestimated the amount of PM retention in urban park green spaces within the study area. This possible overestimation stems from two main factors. First, we may have underestimated the tree canopy loss ratio. It was difficult to accurately judge the canopy loss ratio of each tree in our field investigation, so the actual canopy loss ratio is likely higher than the ideal in the model. Second, this study used the whole area of the park and not the green space area within the park. In the future, investigations of tree structure and detailed classifications of green space types in combination with high-resolution remote sensing images will lead to more accurate estimates.
5. Conclusions
Through a field investigation combined with i-Tree Eco model estimations, the PM2.5 retention capacities of different tree species were found to vary greatly. In this study, the three-dimensional structure of trees was the main factor affecting their annual PM2.5 retention, and for this reason, the annual PM2.5 retention of broad-leaved trees was significantly higher than that of conifers. Tree coverage, tree species richness, mean tree height, mean crown width, and number of trees had significant effects on the PM2.5 retention of the green space, among which mean tree height was found to have the greatest impact. In green space construction, balancing the quantity and quality of trees to maximize the effect of tree height would be of great significance in improving PM pollution. Urban park green spaces in Beijing played an important role in reducing PM2.5 pollution; the annual PM2.5 retention of the urban park green spaces within the 5th Ring Road was estimated to be about 6380 t, and the rate of air quality improvement was 1.62%. Ultimately, urban park green spaces have great potential for PM2.5 retention. After structural optimization, the annual PM2.5 retention capacity of the green space with mixed coniferous and broad-leaved trees was found to be as high as 80,000 g·year−1, which was much higher than those of the green spaces in our field investigation. This study started from the individual scale of trees and studied the PM2.5 retention capacity of green space at various scales, which complemented the existing research well. This study can provide insights to developing nature-based air pollution mitigation practices for urban planners, urban foresters, and urban environmental managers.
Author Contributions
Conceptualization, Z.Y.; investigation, Z.Y.; methodology, Z.Y.; data curation, Z.Y.; writing—original draft preparation, Z.Y.; project administration, Y.Z.; writing—review and editing, K.M.; supervision, K.M.; project administration, K.M. All authors have read and agreed to the published version of the manuscript.
Funding
This research was funded by National Science Foundation of China (Key Program No. 41430638) and the Innovation Project of the State Key Laboratory of Urban and Regional Ecology of China.
Data Availability Statement
Not applicable.
Acknowledgments
This work was supported by National Science Foundation of China (Key Program No. 41430638) and the Innovation Project of the State Key Laboratory of Urban and Regional Ecology of China.
Conflicts of Interest
The authors declare no conflict of interest.
References
- Van Donkelaar, A.; Martin, R.V.; Brauer, M.; Hsu, N.C.; Kahn, R.A.; Levy, R.C.; Lyapustin, A.; Sayer, A.M.; Winker, D.M. Global estimates of fine particulate matter using a combined geophysical-statistical method with information from satellites, models, and monitors. Environ. Sci. Technol. 2016, 50, 3762–3772. [Google Scholar] [CrossRef]
- Cohen, A.J.; Brauer, M.; Burnett, R.; Anderson, H.R.; Frostad, J.; Estep, K.; Balakrishnan, K.; Brunekreef, B.; Dandona, L.; Dandona, R.; et al. Estimates and 25-year trends of the global burden of disease attributable to ambient air pollution: An analysis of data from the Global Burden of Diseases Study 2015. Lancet 2017, 389, 1907–1918. [Google Scholar] [CrossRef] [Green Version]
- Lelieveld, J.; Evans, J.S.; Fnais, M.; Giannadaka, D.; Pozzer, A. The contribution of outdoor air pollution sources to premature mortality on a global scale. Nature 2015, 525, 367–371. [Google Scholar] [CrossRef]
- Chung, Y.; Dominici, F.; Wang, Y.; Coull, B.A.; Bell, M.L. Associations between Long-Term Exposure to Chemical Constituents of Fine Particulate Matter (PM2.5) and Mortality in Medicare Enrollees in the Eastern United States. Environ. Health Perspect. 2015, 123, 467–474. [Google Scholar] [CrossRef] [PubMed] [Green Version]
- Kelly, F.J.; Fussell, J.C. Size, source and chemical composition as determinants of toxicity attributable to ambient particulate matter. Atmos. Environ. 2012, 60, 504–526. [Google Scholar] [CrossRef]
- Munoz-Pizza, D.M.; Villada-Canela, M.; Rivera-Castaneda, P.; Reyna-Carranza, M.A.; Osornio-Vargas, A.; Martínez-Cruz, A.L. Stated benefits from air quality improvement through urban afforestation in an arid city—A contingent valuation in Mexicali, Baja California, Mexico. Urban For. Urban Green. 2020, 55, 126854. [Google Scholar] [CrossRef]
- Xing, Y.; Brimblecombe, P. Trees and parks as “the lungs of cities”. Urban For. Urban Green. 2020, 48, 126552. [Google Scholar] [CrossRef]
- Wu, J.S.; Luo, K.Y.; Wang, Y.; Wang, Z.Y. Urban road greenbelt configuration: The perspective of PM2.5 removal and air quality regulation. Environ. Int. 2021, 157, 106786. [Google Scholar] [CrossRef]
- Vos, P.E.J.; Maiheu, B.; Vankerkom, J.; Janssen, S. Improving local air quality in cities: To tree or not to tree? Environ. Pollut. 2013, 183, 113–122. [Google Scholar] [CrossRef]
- Abhijith, K.V.; Kumar, P.; Gallagher, J.; McNabola, A.; Baldauf, R.; Pilla, F.; Broderick, B.; Di Sabatino, S.; Pulvirenti, B. Air pollution abatement performances of green infrastructure in open road and built-up street canyon environments—A review. Atmos. Environ. 2017, 162, 71–86. [Google Scholar] [CrossRef]
- Sgrigna, G.; Baldacchini, C.; Dreveck, S.; Cheng, Z.; Calfapietra, C. Relationships between air particulate matter capture efficiency and leaf traits in twelve tree species from an Italian urban-industrial environment. Sci. Total Environ. 2020, 718, 137310. [Google Scholar] [CrossRef]
- Han, D.H.; Shen, H.L.; Duan, W.B.; Chen, L.X. A review on particulate matter removal capacity by urban forests at different scales. Urban For. Urban Green. 2020, 48, 126565. [Google Scholar] [CrossRef]
- Jeanjean, A.P.R.; Monks, P.S.; Leigh, R.J. Modelling the effectiveness of urban trees and grass on PM2.5 reduction via dispersion and deposition at a city scale. Atmos. Environ. 2016, 147, 1–10. [Google Scholar] [CrossRef] [Green Version]
- Wroblewska, K.; Jeong, B.R. Effectiveness of plants and green infrastructure utilization in ambient particulate matter removal. Environ. Sci. Eur. 2021, 33, 110. [Google Scholar] [CrossRef] [PubMed]
- Escobedo, F.J.; Nowak, D.J. Spatial heterogeneity and air pollution removal by an urban forest. Landsc. Urban Plan. 2009, 90, 102–110. [Google Scholar] [CrossRef]
- Nowak, D.J.; Crane, D.; Stevens, J.; Hoehn, R.; Walton, J.; Bond, J. A ground based method of assessing the urban forest structure and ecosystem services. Arboric. Urban For. 2008, 34, 347–358. [Google Scholar] [CrossRef]
- Barmpadimos, I.; Hueglin, C.; Keller, J.; Henne, S.; Prévôt, A.S.H. Influence of meteorology on PM10 trends and variability in Switzerland from 1991 to 2008. Atmos. Chem. Phys. 2011, 11, 1813–1835. [Google Scholar] [CrossRef] [Green Version]
- Liu, W.J.; Han, Y.X.; Li, J.X.; Tian, X.R.; Liu, Y.G. Factors affecting relative humidity and its relationship with the long-term variation of fog-haze events in the Yangtze River Delta. Atmos. Environ. 2018, 193, 242–250. [Google Scholar] [CrossRef]
- Elminir, H.K. Dependence of urban air pollutants on meteorology. Sci. Total Environ. 2005, 350, 225–237. [Google Scholar] [CrossRef]
- Lin, L.; Chen, G.j.; Yan, J.L.; Tang, R.L.; Yuan, X.; Yin, Z.; Zhang, R. A factor analysis of landscape metrics of particles deposited on leaf surface. Environ. Sci. Pollut. Res. 2018, 25, 28391–28402. [Google Scholar] [CrossRef]
- Nurmamat, K.; Halik, U.; Baidourela, A.; Nasirdin, N. Characterization and valuation of dust retention of the main species of strect trees in Aksu City. Sci. Silvae Sin. 2017, 53, 101–106. (In Chinese) [Google Scholar]
- Jayasooriya, V.M.; Ng, A.W.M.; Muthukumaran, S.; Perera, B.J.C. Green infrastructure practices for improvement of urban air quality. Urban For. Urban Green. 2017, 21, 34–47. [Google Scholar] [CrossRef]
- Riondata, E.; Pilla, F.; Basu, A.S.; Basu, B. Investigating the effect of trees on urban quality in Dublin by combining air monitoring with i-Tree Eco model. Sustain. Cities Soc. 2020, 61, 102356. [Google Scholar] [CrossRef]
- Raum, S.; Hand, K.L.; Hall, C.; Edwards, D.M.; O’Brien, L.; Doick, K.J. Achieving impact from ecosystem assessment and valuation of urban greenspace: The case of i-Tree Eco in Great Britain. Landsc. Urban Plan. 2019, 190, 103590. [Google Scholar] [CrossRef]
- Tan, X.; Hirabayashi, S.; Shibata, S. Estimation of Ecosystem Services Provided by Street Trees in Kyoto, Japan. Forests 2021, 12, 311. [Google Scholar] [CrossRef]
- Beijing Gardening and Greening Bureau. Available online: http://yllhj.beijing.gov.cn/ggfw/gyfjqyl/cs/ (accessed on 30 October 2021). (In Chinese)
- Bonilla-Duarte, S.; González, C.C.; Rodríguez, L.C.; Jáuregui-Haza, U.J.; García-García, A. Contribution of Urban Forests to the Ecosystem Service of Air Quality in the City of Santo Domingo, Dominican Republic. Forests 2021, 12, 1249. [Google Scholar] [CrossRef]
- Morgenroth, J.; Nowak, D.J.; Koeser, A.K. DBH Distributions in America’s Urban Forests—An Overview of Structural Diversity. Forests 2020, 11, 135. [Google Scholar] [CrossRef] [Green Version]
- USDA Forest Service. i-Tree Eco: Application Overview. Available online: https://www.itreetools.org/tools/i-tree-eco (accessed on 30 October 2021).
- Hirabayashi, S.; Kroll, C.N.; Nowak, D.J. i-Tree Eco Dry Deposition Model Descriptions. 2015. Available online: https://www.itreetools.org/documents/60/iTree_Eco_Dry_Deposition_Model_Descriptions.pdf (accessed on 30 October 2021).
- Wang, K.; Zhang, Y.; Liu, X. Modeled particulate matters removal by urban green lands in Beijing. Environ. Sci. Technol. 2020, 43, 121–129. (In Chinese) [Google Scholar]
- Xu, Y.; Xu, W.; Mo, L.; Heal, M.R.; Xu, X.; Yu, X. Quantifying particulate matter accumulated on leaves by 17 species of urban trees in Beijing, China. Environ. Sci. Pollut. Res. 2018, 25, 12545–12556. [Google Scholar] [CrossRef] [Green Version]
- Chen, G.; Lin, L.; Hu, Y.; Zhang, Y.; Ma, K. Net particulate matter removal ability and efficiency of ten plant species in Beijing. Urban For. Urban Green. 2021, 63, 127230. [Google Scholar] [CrossRef]
- Zhang, Z.; Yang, X.; Liu, J. Distribution and rejuvenation technology of ancient and famous tree in Beijing. Vegetos 2013, 26, 188–195. [Google Scholar] [CrossRef]
- Zhu, Y.; Feng, Z.; Lu, J.; Liu, J. Estimation of Forest Biomass in Beijing (China) Using Multisource Remote Sensing and Forest Inventory Data. Forests 2020, 11, 163. [Google Scholar] [CrossRef] [Green Version]
- Xiao, Y.; Wang, S.; Li, N.; Xie, G.; Lu, C.; Zhang, B.; Zhang, C. Atmospheric PM2.5 removal by green spaces in Beijing. Resour. Sci. 2015, 37, 1149–1155. (In Chinese) [Google Scholar]
- Towers, P.C.; Strever, A.; Poblete-Echeverría, C. Comparison of Vegetation Indices for Leaf Area Index Estimation in Vertical Shoot Positioned Vine Canopies with and without Grenbiule Hail-Protection Netting. Remote Sens. 2019, 11, 1073. [Google Scholar] [CrossRef] [Green Version]
- Gitelson, A.A.; Viña, A.; Arkebauer, T.J.; Rundquist, D.C.; Keydan, G.P.; Leavitt, B. Remote estimation of leaf area index and green leaf biomass in maize canopies. Geophys. Res. Lett. 2003, 30, 1248. [Google Scholar] [CrossRef] [Green Version]
- He, C.; Qiu, K.; Alalmad, A.; Pott, R. Particulate matter capturing capacity of roadside evergreen vegetation during the winter season. Urban For. Urban Green. 2020, 48, 126510. [Google Scholar] [CrossRef]
- Meier, I.C.; Leuschner, C. Leaf size and leaf area index in Fagus sylvatica forests: Competing effects of precipitation, temperature, and nitrogen availability. Ecosystems 2008, 11, 655–669. [Google Scholar] [CrossRef] [Green Version]
- Yang, J.; McBride, J.; Zhou, J.; Sun, Z. The urban forest in Beijing and its role in air pollution reduction. Urban For. Urban Green. 2005, 3, 65–78. [Google Scholar] [CrossRef]
- Wu, J.; Wang, Y.; Qiu, S.; Peng, J. Using the modified i-Tree Eco model to quantify air pollution removal by urban vegetation. Sci. Total Environ. 2019, 688, 673–683. [Google Scholar] [CrossRef]
- Zhang, X.; Du, J.; Huang, T.; Zhang, L.; Gao, H.; Zhao, Y.; Ma, J. Atmospheric removal of PM2.5 by man-made Three Northern Regions Shelter Forest in Northern China estimated using satellite retrieved PM2.5 concentration. Sci. Total Environ. 2017, 593–594, 713–721. [Google Scholar] [CrossRef]
Figure 1.
Locations of the sample plots in Beijing, China: regions of study shown in grey, magnification to show the sampling sites as red dots.
Figure 1.
Locations of the sample plots in Beijing, China: regions of study shown in grey, magnification to show the sampling sites as red dots.

Figure 2.
PM2.5 retention per tree for broad-leaved and coniferous species.

Figure 3.
PM2.5 retention of the sample plots in the 7 districts: a, b, c: Different letters indicate significant differences at a 0.05 level (2-tailed).
Figure 3.
PM2.5 retention of the sample plots in the 7 districts: a, b, c: Different letters indicate significant differences at a 0.05 level (2-tailed).


Table 1.
Main characteristics of trees in the sample plots.
| Attributes | Mean | Range | SE | 95% Confidence Interval | Broad-Leaved Trees (Mean) | Conifers (Mean) |
|---|---|---|---|---|---|---|
| DBH (cm) | 16.89 | 4–92 | 0.145 | 16.61–17.17 | 20.02 a | 17.50 a |
| Height (m) | 9.10 | 2–36 | 0.076 | 8.95–9.25 | 10.04 a | 7.88 b |
| Crown base height (m) | 2.38 | 0–18 | 0.029 | 2.32–2.43 | 2.44 a | 1.38 b |
| Crown diameter N–S (m) | 4.71 | 1–22 | 0.036 | 4.64–4.78 | 6.13 a | 4.51 b |
| Crown diameter E–W (m) | 4.42 | 1–22 | 0.039 | 4.34–4.49 | 5.96 a | 4.25 b |
a, b: Differences between different letters are significant at a 0.05 level (2-tailed).
Table 2.
Stepwise regression analysis of green space structural parameters and PM2.5 retention.
| Dependent Variable | Independent Variables | Significance | Standardized Coefficients | Adjusted R2 of Model |
|---|---|---|---|---|
| PM2.5 retention | Tree coverage | 0.004 | 0.171 | 0.637 |
| Tree species richness | 0.000 | 0.252 | ||
| Mean tree height | 0.000 | 0.589 | ||
| Mean crown width | 0.000 | 0.274 | ||
| Number of trees | 0.000 | 0.248 |
Table 3.
Mean value of structural parameters and the corresponding PM2.5 retention of the three types of green space represented in Groups 1–3.
Table 3.
Mean value of structural parameters and the corresponding PM2.5 retention of the three types of green space represented in Groups 1–3.
| Group | Tree Coverage (%) | Shrub Coverage (%) | Grass Coverage (%) | Tree Richness | Mean Height (m) | Mean DBH (m) | Mean Crown Width (m) | Number of Trees | PM2.5 Retention (g) |
|---|---|---|---|---|---|---|---|---|---|
| 1 | 65.51 a | 12.41 a | 62.87 a | 2.77 a | 13.98 a | 28.41 a | 6.88 a | 12.92 a | 70,484.49 a |
| 2 | 79.11 b | 5.02 a | 60.55 a | 2.85 a | 8.32 b | 15.47 b | 4.32 b | 26.79 b | 34,170.32 b |
| 3 | 33.28 c | 29.15 b | 84.98 b | 2.33 a | 8.50 b | 17.69 b | 4.67 b | 14.08 a | 21,027.34 c |
a, b, c: Differences between different letters are significant at a 0.05 level (2-tailed).
Table 4.
Optimization of the green space structure using 48 broad-leaved and 8 coniferous tree species.
Table 4.
Optimization of the green space structure using 48 broad-leaved and 8 coniferous tree species.
| Species Richness | Number of Trees | PM2.5 Retention (g) | ||||||||||||
|---|---|---|---|---|---|---|---|---|---|---|---|---|---|---|
| 1 | PT1 × 5 | LC × 1 | AC × 1 | PL × 2 | PO1 × 1 | SC × 2 | 6 | 12 | 82,778.22 | |||||
| 2 | PT1 × 4 | GB × 1 | AA × 1 | PA × 1 | SO × 2 | PL × 4 | 6 | 13 | 81,873.4 | |||||
| 3 | PT1 × 3 | PS × 3 | AC × 2 | PA × 1 | 4 | 9 | 81,286.84 | |||||||
| 4 | PT1 × 5 | LC × 1 | AC × 1 | CY × 1 | SO × 2 | PT2 × 1 | 6 | 11 | 80,938.47 | |||||
| 5 | PT1 × 4 | AN × 1 | YS × 2 | SC × 3 | SO × 3 | EU × 1 | PO2 × 1 | QV × 1 | PA × 1 | 9 | 17 | 80,648.55 | ||
| 6 | PT1 × 5 | AM × 1 | QV × 1 | SO × 1 | 4 | 8 | 80,440.14 | |||||||
| 7 | PT1 × 4 | AC × 1 | PO2 × 1 | PA × 2 | SO × 1 | FC × 1 | GB × 1 | QV × 1 | PO2 × 1 | MS × 1 | SC × 1 | 11 | 15 | 80425.78 |
| 8 | PT1 × 4 | DL × 1 | AC × 2 | AN × 1 | SO × 1 | QV × 1 | PO2 × 1 | UP × 1 | 8 | 12 | 80,348.86 | |||
| 9 | PT1 × 5 | AN × 1 | SJ × 1 | JF × 1 | SO × 2 | PO1 × 1 | PT2 × 1 | SC × 1 | 8 | 13 | 79,957.29 | |||
| 10 | PT1 × 2 | AC × 4 | PC × 1 | PA × 1 | SO × 1 | FC × 1 | MG × 1 | GB × 1 | PL × 1 | 9 | 13 | 79,947.99 |
PT1: Populus tomentosa; LC: Liriodendron chinense; AC: Aesculus chinensis; PL: Populus lasiocarpa; PO1: Platanus orientalis; SC: Sabina chinensis; GB: Ginkgo biloba; AA: Ailanthus altissima; PA: Populus alba; SO: Syringa oblata; PS: Populus simonii; CY: Cerasus yedoensis; PT2: Pinus tabuliformis; AN: Acer negundo; EU: Eucommia ulmoides; PO2: Platycladus orientalis; YS: Yulania soulangeana; QV: Quercus variabilis; AM: Acer mono; FS: Fraxinus chinensis; MS: Malus spectabilis; DL: Diospyros lotus; UP: Ulmus pumila; JF: Juniperus formosana; SJ: Sophora japonica; PC: Prunus cerasifera; MG: Metasequoia glyptostroboides.
Table 5.
Optimization of green space structure using 8 coniferous tree species.
| PO2 | SB | PT2 | JF | PI | CD | PB | PA | Species Richness | Number of Trees | PM2.5 Retention (g) | |
|---|---|---|---|---|---|---|---|---|---|---|---|
| 1 | 7 | 18 | 3 | 5 | 1 | 0 | 4 | 1 | 7 | 39 | 56,568.99 |
| 2 | 10 | 11 | 2 | 11 | 3 | 0 | 2 | 0 | 6 | 39 | 56,156.71 |
| 3 | 11 | 14 | 3 | 7 | 3 | 0 | 0 | 1 | 6 | 39 | 55,246.62 |
| 4 | 7 | 19 | 1 | 4 | 5 | 1 | 1 | 1 | 8 | 39 | 54,213.1 |
| 5 | 4 | 15 | 3 | 7 | 1 | 0 | 6 | 1 | 7 | 37 | 53,986.39 |
PO2: Platycladus orientalis; SB: Sabina chinensis; PT2: Pinus tabuliformis; JF: Juniperus formosana; PI: Picea wilsonii; CD: Cedrus deodara; PB: Pinus bungeana; PA: Pinus armandii.
Publisher’s Note: MDPI stays neutral with regard to jurisdictional claims in published maps and institutional affiliations. |
© 2022 by the authors. Licensee MDPI, Basel, Switzerland. This article is an open access article distributed under the terms and conditions of the Creative Commons Attribution (CC BY) license (https://creativecommons.org/licenses/by/4.0/).
Share and Cite
MDPI and ACS Style
Yin, Z.; Zhang, Y.; Ma, K. Evaluation of PM2.5 Retention Capacity and Structural Optimization of Urban Park Green Spaces in Beijing. Forests 2022, 13, 415. https://0-doi-org.brum.beds.ac.uk/10.3390/f13030415
AMA Style
Yin Z, Zhang Y, Ma K. Evaluation of PM2.5 Retention Capacity and Structural Optimization of Urban Park Green Spaces in Beijing. Forests. 2022; 13(3):415. https://0-doi-org.brum.beds.ac.uk/10.3390/f13030415
Chicago/Turabian StyleYin, Zhe, Yuxin Zhang, and Keming Ma. 2022. "Evaluation of PM2.5 Retention Capacity and Structural Optimization of Urban Park Green Spaces in Beijing" Forests 13, no. 3: 415. https://0-doi-org.brum.beds.ac.uk/10.3390/f13030415
Note that from the first issue of 2016, this journal uses article numbers instead of page numbers. See further details here.