
Genetic Diversity Maximization as a Strategy for Resilient Forest Ecosystems: A Case Study on Norway Spruce


Faculty of Forestry and Wood Sciences, Czech University of Life Sciences Prague, Kamýcká 129, 165 00 Prague, Czech Republic
*
Author to whom correspondence should be addressed.
Forests 2022, 13(3), 489; https://0-doi-org.brum.beds.ac.uk/10.3390/f13030489
Submission received: 11 February 2022
/
Revised: 15 March 2022
/
Accepted: 18 March 2022
/
Published: 21 March 2022
(This article belongs to the Special Issue Importance of Genetic Diversity for Forest and Landscape Restoration)
Abstract
:Norway spruce, economically and ecologically one of the most important European forest tree species, rapidly declines due to massive bark beetle outbreaks across many countries. As a prerequisite of ecosystem stability facing climate changes of uncertain predictions, the reforestation management promoting locally adapted resources of broad genetic diversity should be prioritized, especially in nature conservation areas. In our case study carried out in the national park, Krkonoše Mountains (the Giant Mountains, the Czech Republic), we demonstrated a tree breeding strategy aiming at maximizing genetic diversity. More than four hundred unique Norway spruce accessions were genotyped on 15 microsatellite loci (Ne = 5.764, I = 1.713 and He = 0.685). Two core collection selection approaches were proposed to establish a new deployment population providing local gene sources of high genetic diversity. Namely, the Core Hunter selection algorithm, with average entry-to-nearest-entry distance (EN) optimization, was applied to identify the most diverse core collection set with the highest genetic diversity parameters obtained for 57 selected individuals (Ne = 6.507, I = 1.807, and He = 0.731). The latter core collection method proposed is innovative, based on choosing appropriate genotypes from a clustered heatmap. For simplicity, we demonstrated the principle of selection strategy on a reduced dataset. It is vital to promote panmixia of a newly established production population from a core collection to complete the conservation breeding effort. Thus, we demonstrated the utilization of the Optimum Neighborhood Algorithm (ONA) deployment that outperformed other deployment algorithms, especially in the case of balanced clone representation and uneven shapes of planting plots. We believe that the case study presented can be generalized and considered as a guideline for analogical tree breeding intentions.
1. Introduction
Norway spruce, one of the economically most important tree species in Central Europe, currently faces a significant decline, mainly due to bark beetle outbreaks [1,2,3,4]. As a consequence, there is an increased demand for artificial reforestation, but forest reproductive material used should be chosen appropriately, with caution. In the Krkonoše Mountains, Norway spruce has significant importance from both economic and ecological points of view. In the second half of the 20th century, local forest ecosystems were widely exposed to intense human pressure and intensive air pollution. An effort has been made to rescue the valuable indigenous populations, consisting of potentially stress-tolerant and phenotypically superior individuals in the conservation breeding program [5,6].
Thus, the autochthonous gene pool that has undergone a long-term selection and adaptation process should be prioritized, and it is desirable to convey the maximal proportion of the genetic diversity into the next generations of forest. Maintaining a broad genetic base will make the ecosystem more resilient to forthcoming climate change. Moreover, the high-elevation Norway spruce ecotype has been proven genetically distinctive compared to spruce of other ecotypic forms [7]. Historically, forest stands in higher elevated and less accessible areas were more difficult to exploit. Hence, the autochthonous populations have been able to persist to the present. Nowadays, these areas are under an enhanced protection regime, and the fundamental management is aimed here to preserve the autochthonous, or at least a long-term, locally adapted gene pool [8].
A variety of advanced genotyping methods efficient in revealing the genetic architecture of the studied population are available today. They all have in common the ability to generate large amounts of data in a short time [9,10,11,12,13]. Despite that, microsatellite markers (SSRs) for fundamental genetic diversity analysis are still an effective genotyping tool with several undeniable advantages. Their codominance and elevated levels of polymorphism make them particularly informative for individual identification and for investigating genetic population structure [14,15,16,17]. Moreover, microsatellite genotyping protocols are well established [18,19,20,21,22,23,24] and might be routinely applied in standard-equipped laboratories.
In response to threats arising from biotic and abiotic stresses often accelerated by climate changes, international conservation and breeding programs proposed an establishment of gene banks conserving endangered genotypes. Commonly, it is not feasible to maintain the entire gene pool, therefore, so-called core collections are established [25]. A core collection is defined as a subset of all accessions which represents the diversity of the whole collection with a minimum redundancy [26]. Many various core collections selection methods have been proposed, and each of them differs in defining the selection criteria for a respective core collection establishment. Selection can be based on genotypic or phenotypic data; some core collections methods consider a combination of both [27,28,29]. Molecular data are used for the estimation of allelic richness or pairwise genetic distances. Parameters of phenotypic traits and allele scores are calculated using distance matrices, and the accessions selection is carried out with allocation methods [30,31]. For example, the M-method allows constructing cores with high allelic richness, maximizing the probability to preserve all examined alleles [32].
Methods based on genetic distances between accessions possess the advantage of using all different variables simultaneously [33]. The genetic distance optimization (GDOpt) method was developed to select highly representative core subsets, in which each accession optimally represents accessions not included in the core selection [34]. GenoCore [35] was designed and customized for the high-density data sets. The algorithm selects the most consistent, and most representative core collection from all samples, which is accomplished by repeatedly incorporating a random accession and eliminating all others within a specific sampling radius [36]. Core Hunter [37] was introduced as a method to optimize the variety of different criteria of core collections for particular purposes, using flexible local search algorithms. The program constructs specific core collections and can combine multiple objectives to bring the different perspectives closer together. The latest version of Core Hunter can sample fixed-size cores based on a precomputed distance matrix, molecular marker data, phenotypic traits, or a combination of these [25].
In the past, the deployment schemes for seed orchards were created manually [38]. Nowadays, the modern technology and programming languages allow creation of highly sophisticated designs suitable to different criteria for different seed orchards. For example, MI design [39] minimizes the probability of crossing individuals with a close kinship. R2SCR design [40] is suitable for creating spatially complex schemes. Optimum Neighborhood Algorithm (ONA) design [41] maximizes panmixia, and due to its versatility, it is used for creating optimal spatial schemes.
In the case study, we aimed (1) to reveal the genetic structure of the targeted Norway spruce population from the Krkonoše Mountains; (2) to demonstrate strategies of core collection selection using a sophisticated algorithm, (Core Hunter software) and propose an alternative core collection selection approach based on identification in a clustered heatmap; finally, (3) we recommend a deployment strategy applied on core collection to promote panmixia in a new generation of trees.
2. Materials and Methods
2.1. Origin of the Research Material
We targeted the presumably autochthonous Norway spruce population from the national park, Krkonoše Mountains (50°42′36.0″ N 15°39′00.0″ E). Local Norway spruce previously underwent natural selection processes as trees were exposed to intensive air pollution during the 2nd half of the 20th century. From these surviving trees of high-elevation ecotype [42], seeds from surviving superior trees across the Krkonoše Mountains were collected and planted (1989–1993). The plant material was further vegetatively propagated (by cuttings) and grown in clonal rows on several plots across the mountains. These accessions (unique genotypes) were the subject of our research.
2.2. Sampling, DNA Extraction, and Genotyping
Vegetative buds were sampled in June 2018 (in total from 620 individuals) and stored at −80 °C until further processing. Some clones were sampled in replicates for clonal identity confirmation. For DNA extraction, approximately 60–80 mg of fresh needle tissue was cut, frozen under liquid nitrogen, and grounded in the mixer mill MM400 (Retsch, Haan, Germany) for 3 min at 30 Hz. The genomic DNA was extracted with the DNeasy® Plant Mini Kit (Qiagen, Hilden, Germany), according to the manufacturer’s instructions. DNA concentration was measured using a NanoDropTM 2000 spectrophotometer (Thermo Fisher Scientific, Madison, WI, USA) and then diluted and adjusted to a working concentration of 20 ng/µL.
SSR amplification was carried out in two multiplex polymerase chain reactions [43]. Multiplex I contained primer sequences paGB3 [22], SpAG2 [19], EATC1E03 [21], WS00716.F13 [23], EATC1D02A [21], and Pt71936 [18]. Multiplex II consisted of WS0073.H08, WS0092.A19, WS0023.B03, WS0019.F22 [23], Pa_28, Pa_33, Pa_56 [24], PAAC23, and PAAC3 [20]. In total, 15 primer pairs in a dried form were supplied by Thermo Fisher Scientific. Fluorescently labeled amplicons were analyzed on an 3500 genetic analyzer (Applied Biosystems, Waltham, MA, USA) and scored using the software, Genemarker [44]. Allele binning was verified manually to minimize the level of genotyping errors.
2.3. Data Processing
Prior to the evaluation, multiple genotypes (i.e., individuals with verified clonal identification) and samples with a genotyping failure higher than 30% were excluded. Thus, 408 unique genotypes were entered in the analysis.
Frequency-based statistics such as a total number of alleles (k), observed (Ho) and expected (He) heterozygosity, and the polymorphism information content (PIC) were determined by the CERVUS 3.0 software [45]. GenAlEx (Genetic Analysis in Excel) [46,47] was used to calculate a mean number of alleles (Na), an effective number of alleles (Ne) and Shannon diversity index (I). The null-allele frequencies were determined using the ML-NULLFREQ program [48]. Bruvo’s genetic distance [49] was calculated using R package, poppr [50]. Subsequently, the neighbor-joining dendrogram [51] and a heatmap were created with R package, adegenet [52].
3. Results and Discussion
3.1. Frequency-Based Characteristics of Microsatellite Loci
GeneMarker software was used to analyze and detect the polymorphism at fifteen microsatellite loci. In total, 228 allelic variants were revealed across all loci. The number of alleles per locus significantly varied, with the maximum of 44 variants at locus PAAC3, and the minimum number of 5 alleles at locus Pa_56. The mean number of alleles was 15.2 with a standard deviation of 11.346, and a standard error of 2.930 (Table 1).
The mean values of a polymorphic information content, PIC (Table 1), were estimated to be 0.656. Moreover, 4 from the 15 loci showed a PIC higher than 0.85 (with the highest value, 0.943, detected on WS00716.F13). The expected (He) and observed (Ho) heterozygosity significantly corresponded to strongly polymorphic microsatellite loci (Pa_56, PAAC23, WS019.F22, WS0072.H08, and WS0092.A19). The maximum value of Ho was found in the loci WS0092.A19 (0.751), PAAC23 (0.696), SpAG2 (0.682), and WS00716.F13 (0.636), unlike the minimum value of Ho that was found in loci Pa_33 (0.130) and EATC1E03 (0.230).
Many authors have aimed their research to select suitable polymorphic microsatellite markers for the Norway spruce genotyping [53,54]. Our study used two multiplexes previously optimized on Czech Norway spruce populations [43]. Other Czech authors [55] tested nine polymorphic loci assembled into three multiplexes. Frequency-based characteristics generated from 427 individuals originating from 12 areas are comparable to the data obtained in our study. The allelic interval in the PAAC23 locus varies between 266 and 314 bp, similar to our observed data within the same locus (269–315 bp). The results for the WS00716.F13 locus differed most markedly, ranging from 180 to 288 bp in the study cited above, while the amplification found by this study showed values in the range 210 to 245 bp.
Unsurprisingly, the frequency-based characteristics differ significantly among studies when compared datasets are mutually unbalanced in their size or sampling design. For example, our data for observed and expected heterozygosity for the primer Pa_28 (Ho = 0.574; He = 0.633) considerably varied from results (Ho = 0.681; He = 0.700) in the primary study [24]. Observed (Ho) and expected (He) heterozygosity for the primer Pa_56 equaled 0.634 and 0.633 in comparison to the results of 0.625 and 0.655 presented in the original study [24]. Unlike the previous numbers that differed only by hundredths, our values of Ho = 0.130 and He = 0.192 for Pa_33 primer were significantly different from the data observed in the original study [24]: He = 0.957 and He = 0.637. Additionally, our research revealed seven allelic variants, whereas the authors of the original research [24] detected nine different alleles. A wider geographical sampling range can explain the detection of a higher number of alleles in the case of [33]. The original values of Ho = 0.470 and He = 0.570 in primer WS0019.F22 [23], and Ho = 0.652 and He = 0.764 in primer paGB3 [22], differed minimally from the results obtained in this study: Ho = 0.458 and He = 0.521 for the WS0019.F22, and Ho = 0.627 and He = 0.753 for the paGB3. In primary studies on loci EATC1E03 [21] and SpAG2 [29], there was no information about the observed heterozygosity. Nonetheless, a comparison of expected heterozygosity showed a higher value (0.911) at SpAG2 primer in our study than the number 0.893 obtained in the original study [19]. These findings correspond with this locus being more polymorphic (17 allelic variants) in our study.
Regarding the genetic diversity parameters, the number of effective alleles (Ne) for our full dataset (408 accessions) was estimated at 5.555 (SE 1.265), and the Shannon diversity index I = 1.683 (SE 0.207). There is a lack of information on such genetic diversity parameters in other studies, as they usually deal with more than one population, thus preferring to present F-statistics parameters.
3.2. Selection of Core Collection
Ideally, the genetic diversity of the entire gene pool is conveyed to future generations. In effect, the conservation and tree breeding effort, such as establishing a deployment population, required an apriori-defined number of individuals that are accommodated in the gene resources management. Therefore, the decisions on which accessions should be prioritized and maintained (so-called core collection) must be made [26]. Along with genotype diversity, phenotypic appearance might also be the selection criterion [27].
In our study, the selection of the core collection was entirely subordinate to genetic diversity data revealed by microsatellite genotyping. Although the initial selection of trees into the breeding program relied primarily on phenotypic traits (trees survival), their current generation, established by grafting the original one, possesses similar morphological characteristics. In other words, the common breeding issue of optimizing the balance between genetic diversity retained and genetic gain, regarding a particular trait [56], was not followed, but we entirely prioritized the genetic variability of selected accessions.
3.2.1. The Scenario of a Rigorous Selection of the CORE Collection
The precise core collection selection was conducted with Core Hunter 3 [25] under the average entry-to-nearest-entry distance (EN) optimization objective. The algorithm maximizes the average genetic distance between each selected individual and the closest other selected one. Pairwise distances between individuals are computed based on Modified Rogers distance [37]. In order to capture changes in frequency-based characteristics when a particular number of individuals is selected to the core collection, we ran various scenarios, starting with a selection of ten individuals and gradually increasing up to the entire number of accessions available (408 genotypes). For all scenarios, there were frequency-based statistics (Table 2, Core Hunter Selection). For comparison, we also estimated those statistics for the core collections of the corresponding size, chosen from the dataset randomly (Table 2, Random Selection).
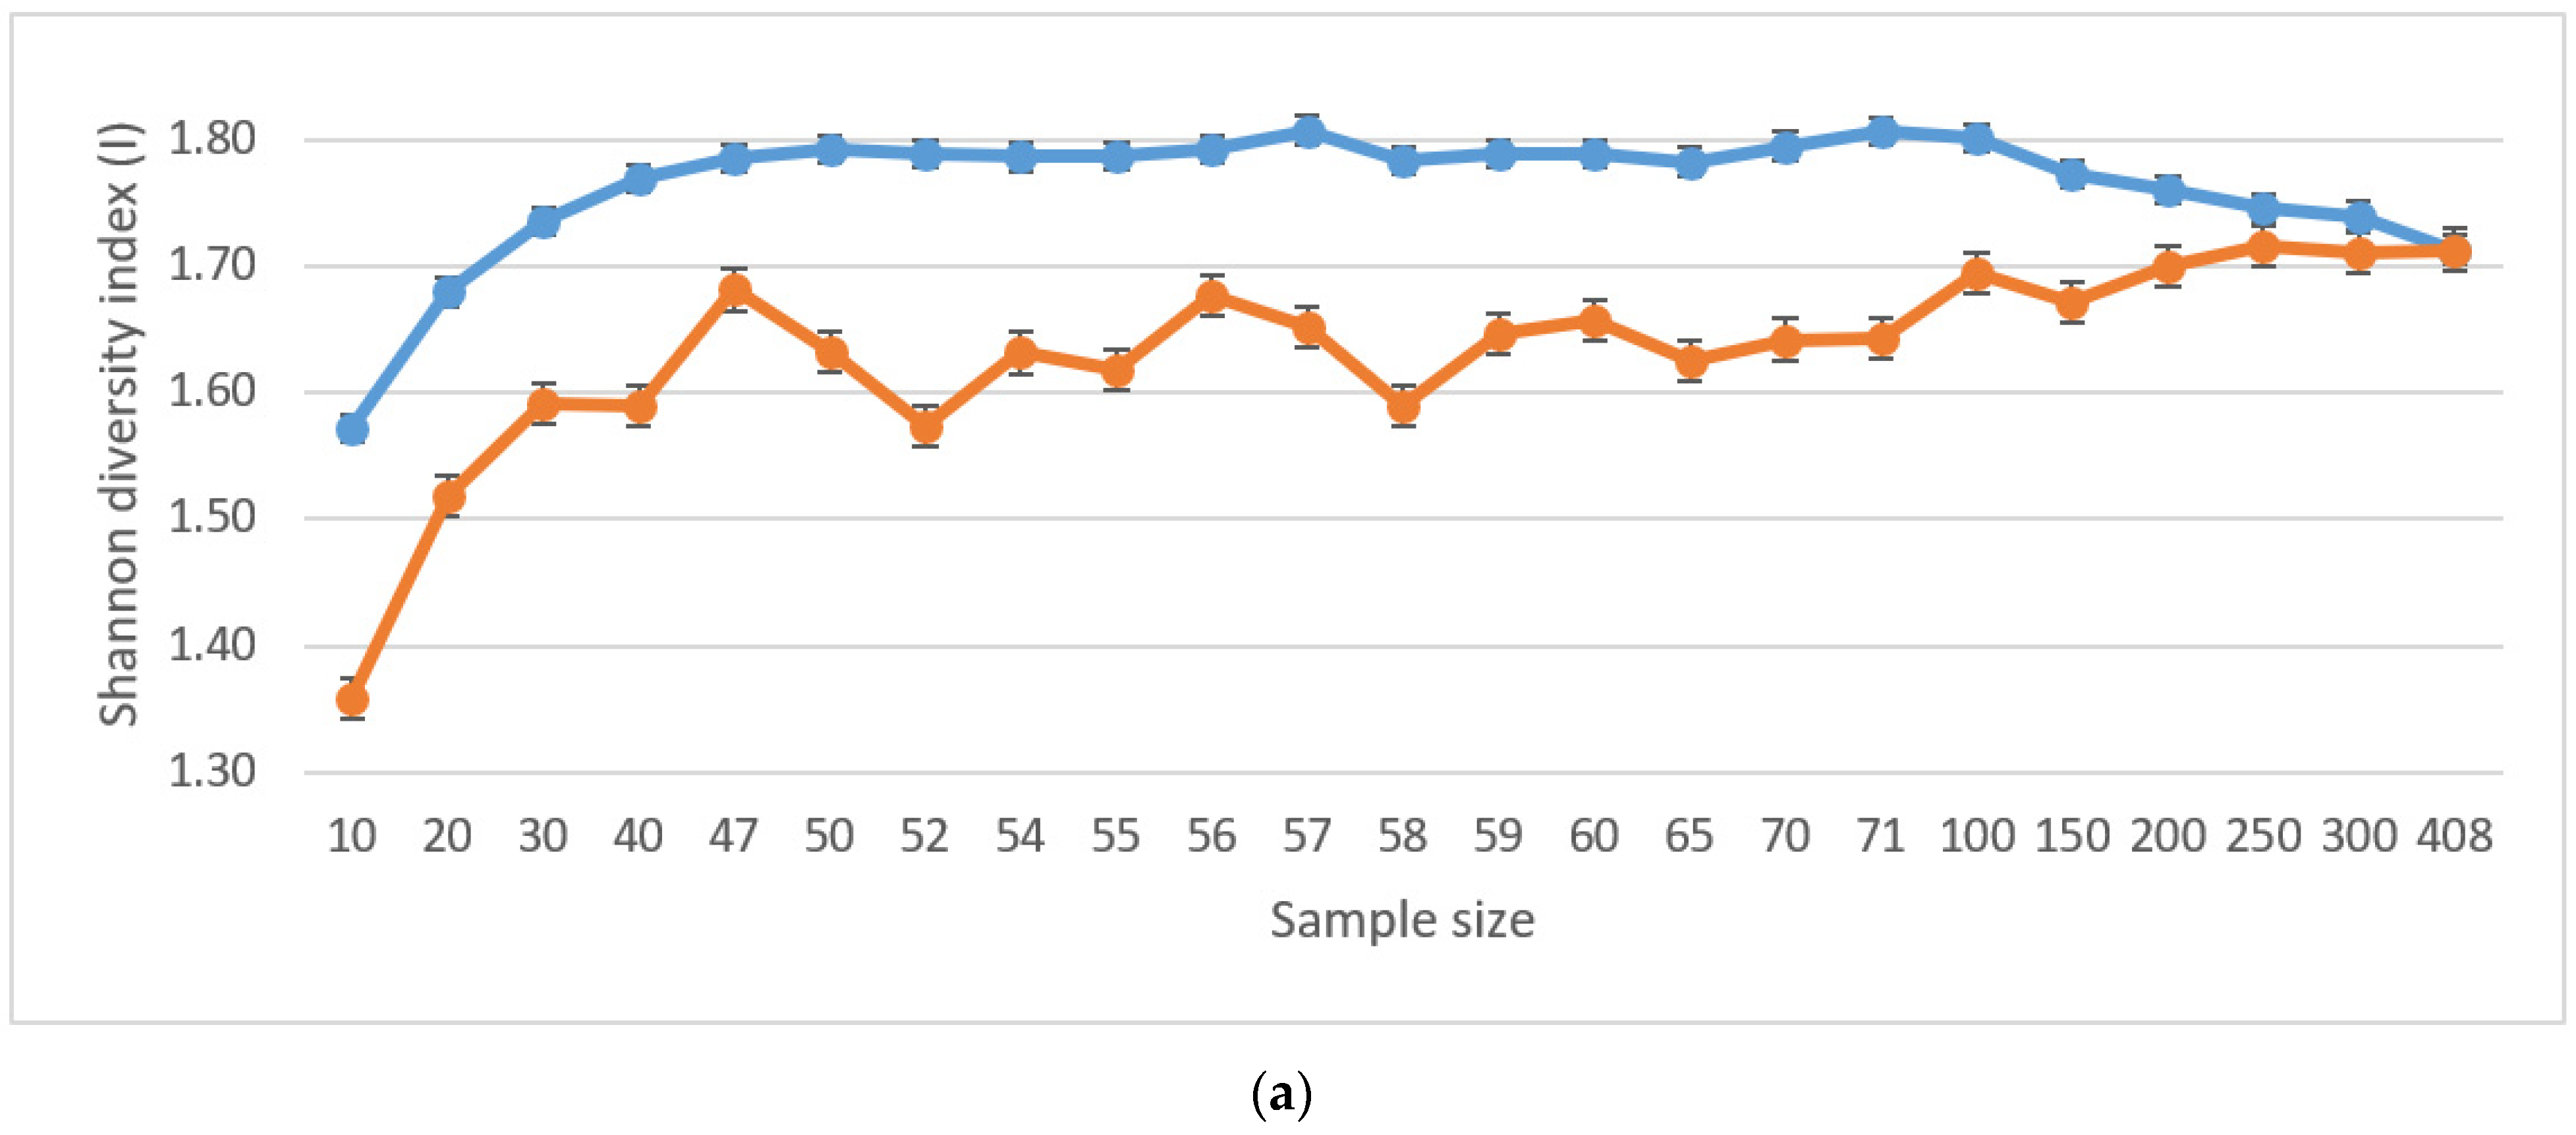
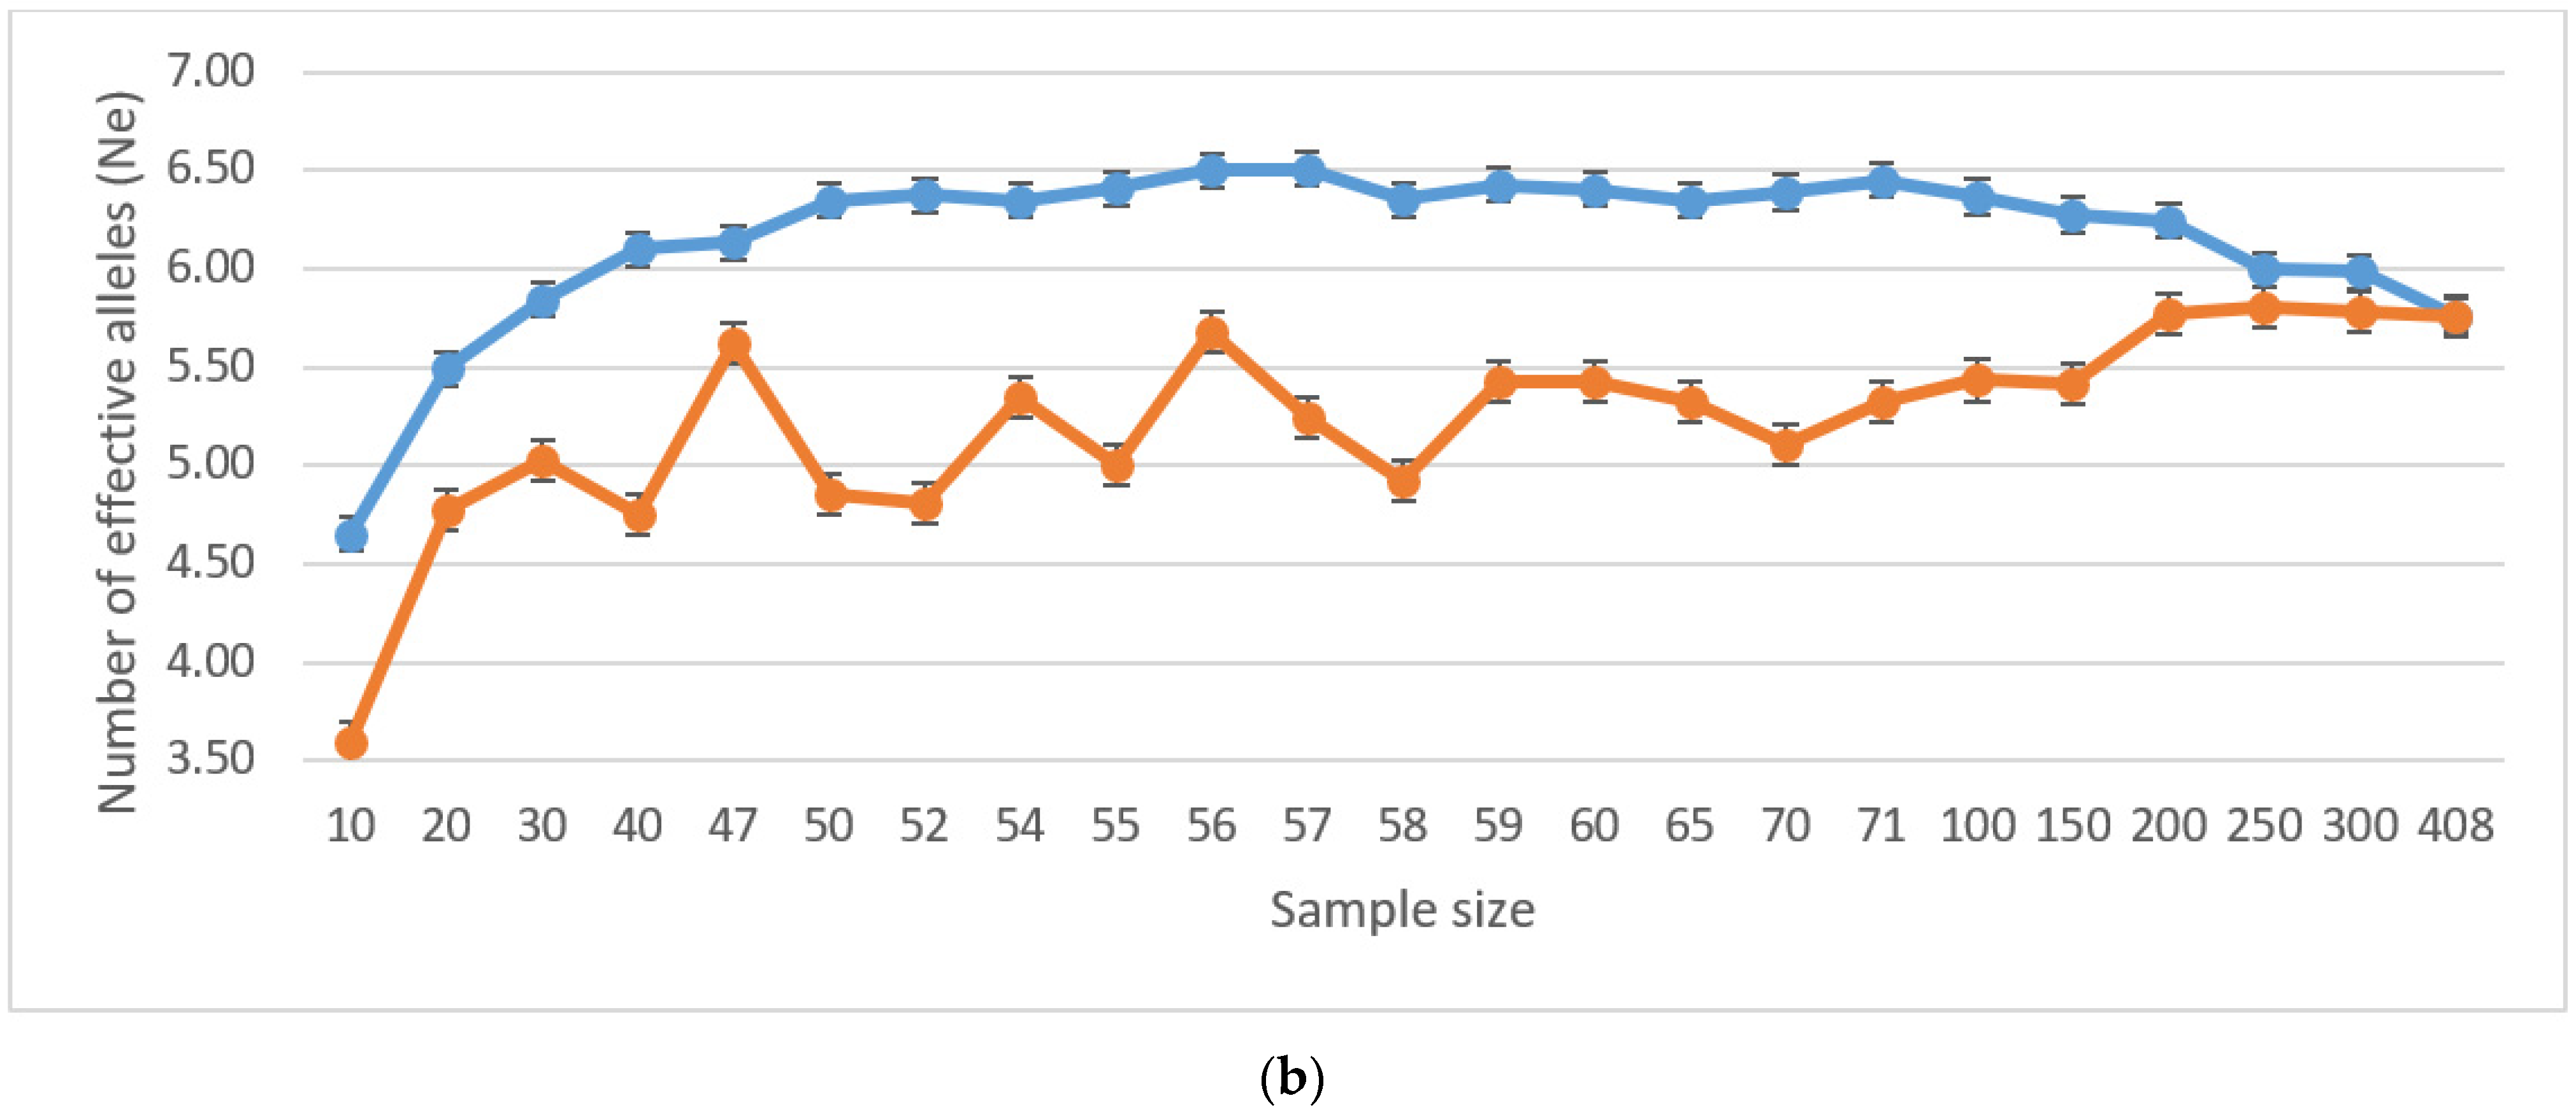
The values of genetic diversity indices (number of effective alleles and Shannon diversity index) are not successive under random selection scenarios. Additionally, none reached values as high as those selected by Core Hunter (Table 2). Thus, the Core Hunter selection algorithm proved the efficiency of selecting the core collection with maximized genetic diversity for all core collection sizes, compared to a random selection of individuals (Figure 1a,b). Indices counted for individuals selected by the Core Hunter algorithm showed lower variability within the range of values, and the maximal peak for both the number of effective alleles (Ne) and the Shannon diversity index (I) was estimated for the size of the core collection, N = 57.
Although the ideal scenario would be to include all accessions into the new deployment population, from the operational point of view, the size of the core collection is usually restricted, mainly due to the size of the planting plot available. As our strategy is genetic diversity maximization, we opted for a subset of 57 accessions, which reported the highest Ne (6.507, SE 1.429) and I (1.807, SE 0.204) values. Our results slightly vary from other core collection studies. For example, a study introducing a new algorithm for Core Hunter II [57] was carried out on 275 sample individuals with the value of Ne (2.937) and I (4.399). These findings correspond closely with the results of Ne (2.734) and I (4.467): a similar study [58] for a selection of a core collection from 521 individuals.
3.2.2. A Relaxed Scenario of Core Collection Selection
Bruvo’s genetic distance algorithm [49], preferred for microsatellite data, was applied to generate the dendrogram. This approach considered mutation processes, providing more precise outputs than other methods [59]. Individuals in the dendrogram were connected step-by-step according to the degree of their mutual kinship, and formed clusters of related individuals (Supplementary Figure S1). As a less organizationally demanding method that provides a wide range for operational adjustment, we suggested a group-based core collection selection approach. Firstly, the dendrogram is dissected into an appropriate number of clonal groups in concordance with the number of essential clades. Subsequently, to prevent a significant reduction of genetic diversity within a selected collection, we suggest choosing individuals equally from each group.
We demonstrated the strategy on a reduced dataset from the original one for simplicity. For example, suppose there are 20 clonal groups, and the task is to select 20 individuals for the core collection. In that case, from each group, one individual will be chosen. If the requirement is, for example, 30 individuals, then from 10 clonal groups, one individual will be selected, and from the other 10 groups, two individuals will be chosen, etc. The selection of a particular genotype within each group is optional to some extent, but the status of genetic diversity among accessions should be inspected using a heatmap. We demonstrated this approach on the subset of 50 genotypes when aimed to select 15 individuals for the core collection. The mutual level of genetic diversity between individuals from adjacent groups of genotypes, as well as within the group, is checked based on the color shade, and individuals with the lower level (more pronounced color) are prioritized (Figure 2). It is worth emphasizing that each white dot in Figure 2 represents two accessions. Accessions are usually targeted twice (or more times), depending on the number of dendrogram clusters defined and the number of individuals aiming to be gathered into the core collection. In other words, the number of dots in the heatmap does not represent the size of the core collection.
Using this selection scenario, the core collection of 15 selected accessions indicated the following parameters of genetic diversity: I = 1.567 (SE 0.177) and Ne = 5.011 (SE 0.876). In opposition, the random selection of 15 individuals (based on bootstrapping, N = 20) from this dataset reported I = 1.455 (SE 0.009) and Ne = 4.344 (SE 0.059). Nevertheless, it needs to be recognized that the core collection selection based on Core Hunter algorithm promotes diversity more effectively: I = 2.134 (SE 0.112) and Ne = 7.383 (SE 0.847).
Unquestionably, the selection approach based on a sophisticated software algorithm provided the most effective core collection selection. On the other hand, the alternative method that relies on selection from kinship groups might be readily applicable in operational conditions, e.g., when the breeder is not able to propagate particular genotypes, often due to the high mortality rate of individual grafts and a need for an operative change of selected clones. We proved that the method of group-based selection effectively eliminates the risk of considerable genetic diversity narrowing in the selected subset of individuals.
3.3. Deployment Schemes
Before the development of modern technology, the deployment schemes for seed orchards were created manually [38]. Their main disadvantages comprise the lower accuracy and sophistication. These deficiencies were eliminated within the years of computer technologies development that have provided us with more sophisticated designs using various programming languages. COOL design [60] is suitable for irregularly shaped seed orchards, whereas MI design [39] uses optimization of distances of individual ramets to minimize the probability of crossing related individuals. For the seed orchards in need of spatially complex schemes, R2SCR design [40] with the use of random clonal rows is very suitable. Most of the designs mentioned above focus primarily on minimizing mutual crossing within ramets of the same clone using a suitable spatial distribution of clones. Yang et al. [61] also consider a genetic distance between clones to be one of the most important factors affecting the minimization of possible inbreeding.
Optimum Neighborhood Algorithm (ONA) design [41] has appeared to be optimal. The algorithm has fulfilled the requirements of the research, and besides, it has taken into account the requirement of maximizing panmictic crossing. Versatility is another advantage of ONA—it can be used to optimize both the distribution of clones for different shapes of seed orchards, as well as different proportions of clones and their ramets.
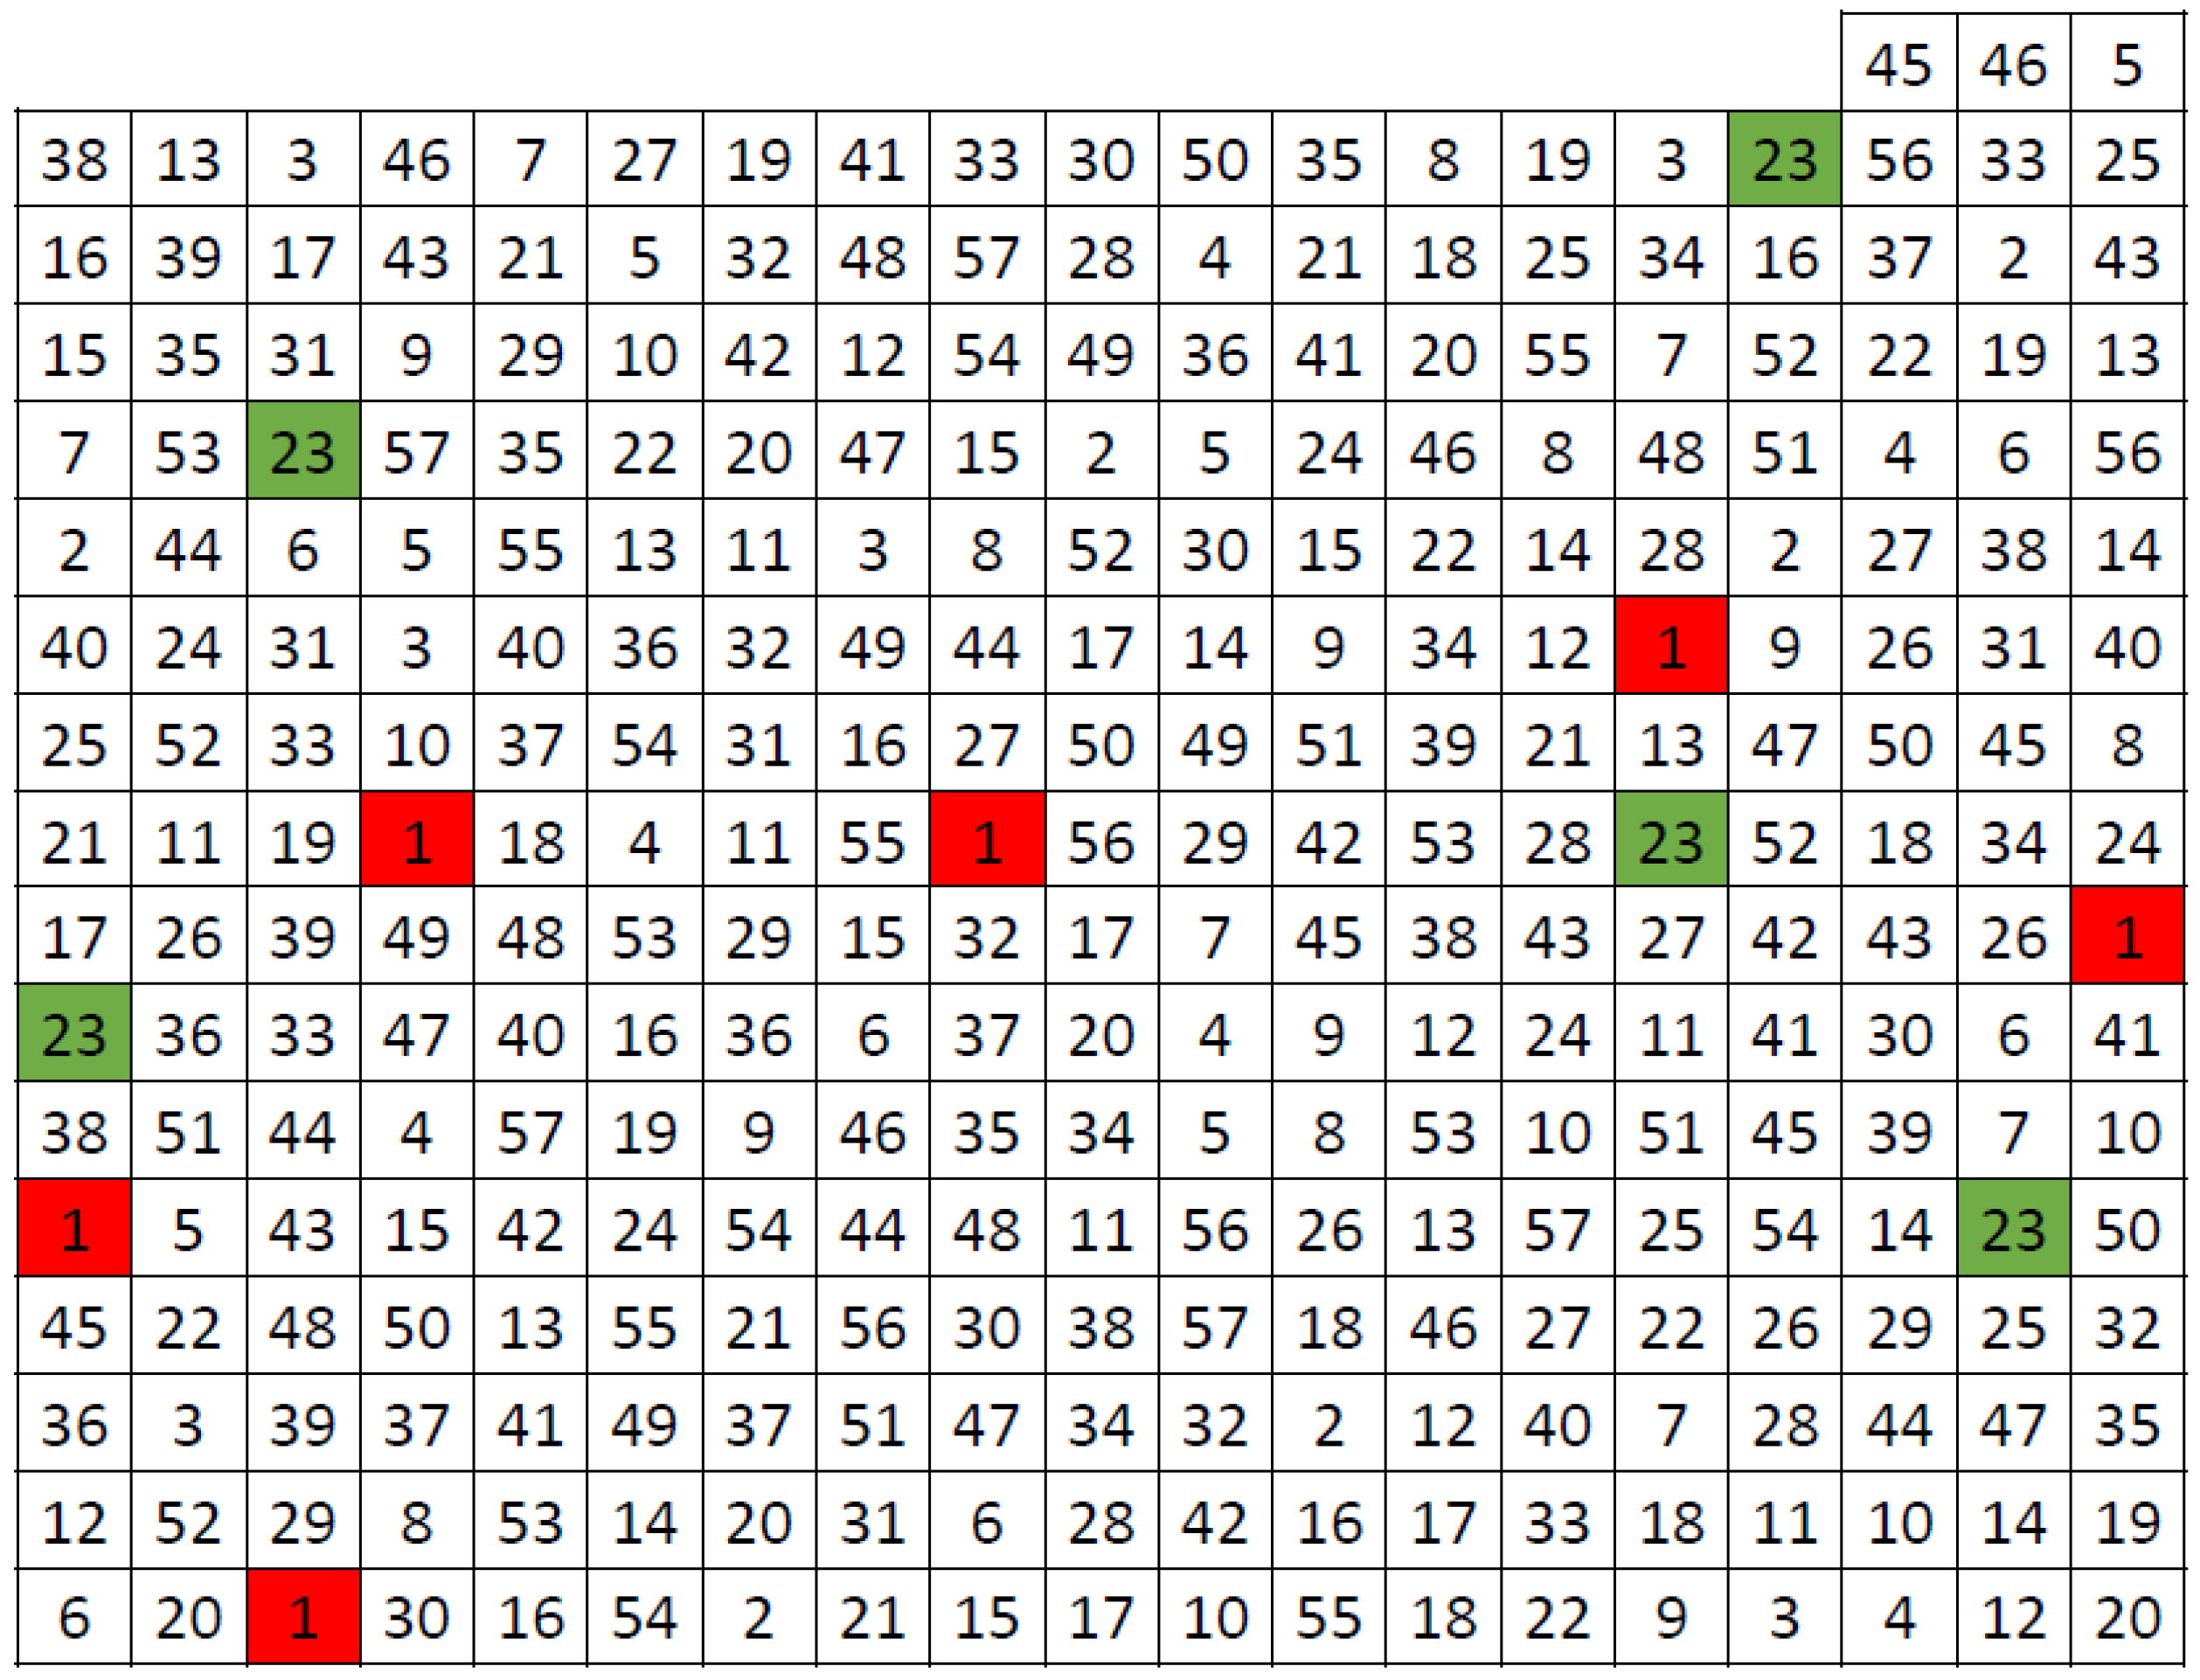
From the operational point of view, the size of the core collection was restricted by the area available for seed orchard establishment. With 4 × 4 m spacing, the 0.58 ha plot can accommodate 307 individuals. The requirement for the number of replicates (ramets) is the equal representation of ramets per clone. Optimum Neighborhood Seed Orchard Design [45] was used for creating the deployment schemes of proposed seed orchards with the quasi-equal number of ramets per clone, six (clones nr. 1–22) and five (clones nr. 23–57), respectively. The final seed orchard layout (Figure 3) is an output of 1000 iterations and maximizes panmixia by minimizing the variance in the number of direct neighbors among all clones (σ2min = 0.275).
4. Conclusions
Although various studies aimed to identify provenances of potentially best performance under predicted climate shifts (assisted migration), the keystone for resilient and resistant forest ecosystems is that the broad genetic diversity is maintained. The wide genetic variation forms a buffer for natural selection under somewhat uncertain trends in climate change. Moreover, especially in nature conservation areas such as national parks, autochthonous genetic resources are prioritized and even enforced by legislative regulations.
Following this logic, we presented the conservation breeding program of Norway spruce in the national park, Krkonoše, based on microsatellite genotyping. The highly informative SSR data enabled the estimation of the genetic diversity parameters of the entire targeted population, as well as various subpopulations theoretically assembled during different evaluation scenarios. Besides confirming the high efficiency of the selection algorithm implemented in Core Hunter software, we also proposed the innovative approach of core collection identification based on a heatmap selection within groups determined by dendrogram clusters. Although this approach, by its very nature, did not identify just one unique core collection subset with the highest genetic diversity indexes, it provides above-average, diverse collections preventing a significant loss of diversity.
It is essential to point out that an optimal deployment strategy must follow a core collection selection if a newly established production population is supposed to produce seeds of desired genetic diversity. We believe that procedures applied in our case study could be generalized and utilized in other conservation programs with analogical tree breeding objectives.
Supplementary Materials
The following supporting information can be downloaded at: www.mdpi.com/article/10.3390/f13030489/s1. Figure S1: Dendrogram based on Bruvo’s genetic distance. The red horizontal line defined the clonal clusters; individuals in green circles are examples of such clusters.
Author Contributions
Conceptualization, J.K.; methodology, R.K. and J.K.; software, R.K.; validation, J.K.; formal analysis, R.K.; investigation, R.K.; resources, J.D.; writing—original draft preparation, R.K.; writing—review and editing, J.K. and J.D.; visualization, J.D.; supervision, J.K.; funding acquisition, J.K. All authors have read and agreed to the published version of the manuscript.
Funding
This work was funded by the National Agency of Agriculture research, Czech Republic (NAZV) (grant number QK1910480).
Institutional Review Board Statement
Not applicable.
Informed Consent Statement
Not applicable.
Data Availability Statement
The data presented in this study are available on request from the corresponding author.
Conflicts of Interest
The authors declare no conflict of interest.
References
- Hlásny, T.; Turčáni, M. Persisting bark beetle outbreak indicates the unsustainability of secondary Norway spruce forests: Case study from Central Europe. Ann. For. Sci. 2013, 70, 481–491. [Google Scholar] [CrossRef] [Green Version]
- Hlásny, T.; König, L.; Krokene, P.; Lindner, M.; Montagné-Huck, C.; Müller, J.; Qin, H.; Raffa, K.F.; Schelhaas, M.-J.; Svoboda, M.; et al. Bark Beetle Outbreaks in Europe: State of Knowledge and Ways Forward for Management. Curr For. Rep. 2021, 7, 138–165. [Google Scholar] [CrossRef]
- Fernandez-Carrillo, A.; Patočka, Z.; Dobrovolný, L.; Franco-Nieto, A.; Revilla-Romero, B. Monitoring Bark Beetle Forest Damage in Central Europe. A Remote Sensing Approach Validated with Field Data. Remote Sens. 2020, 12, 3634. [Google Scholar] [CrossRef]
- Hlásny, T.; Zimová, S.; Merganičová, K.; Štěpánek, P.; Modlinger, R.; Turčáni, M. Devastating outbreak of bark beetles in the Czech Republic: Drivers, impacts, and management implications. For. Ecol. Manag. 2021, 490, 119075. [Google Scholar] [CrossRef]
- Schwarz, O. Záchrana Genofondu Krkonošského Smrku. Monitoring, Výzkum a Management Ekosystémů na Území Krkonošského Národního Parku. Sborník Příspěvků z Mezinárodní Konference, VÚLHM-VS, Opočno, pp. 125–132. 1996. Available online: https://www.vulhm.cz/zachrana-genofondu-krkonosskeho-smrku/ (accessed on 5 April 2021).
- Schwarz, O.; Vašina, V. Záchrana genofondu geograficky původních druhů lesních dřevin v Krkonoších. Pr. Mater. Správy KRNAP 1997, 12. [Google Scholar]
- Korecký, J.; Čepl, J.; Stejskal, J.; Faltinová, Z.; Dvořák, J.; Lstibůrek, M.; El-Kassaby, Y.A. Genetic diversity of Norway spruce ecotypes assessed by GBS-derived SNPs. Sci. Rep. 2021, 11, 23119. [Google Scholar] [CrossRef] [PubMed]
- Jansen, S.; Konrad, H.; Geburek, T. The extent of historic translocation of Norway spruce forest reproductive material in Europe. Ann. For. Sci. 2017, 74, 56. [Google Scholar] [CrossRef]
- Hartwell, L.H.; Goldberg, M.L.; Fisher, J.A.; Hood, L. Genetics: From Genes to Genomes, 6th ed.; McGraw-Hill Education: New York, NY, USA, 2018. [Google Scholar]
- Slatko, B.E.; Gardner, A.F.; Ausubel, F.M. Overview of Next-Generation Sequencing Technologies. Curr. Protoc. Mol. Biol. 2018, 122. [Google Scholar] [CrossRef]
- Sandmann, S.; de Graaf, A.O.; Karimi, M.; van der Reijden, B.A.; Hellström-Lindberg, E.; Jansen, J.H.; Dugas, M. Evaluating Variant Calling Tools for Non-Matched Next-Generation Sequencing Data. Sci. Rep. 2017, 7, 43169. [Google Scholar] [CrossRef] [Green Version]
- Lu, H.; Giordano, F.; Ning, Z. Oxford Nanopore MinION Sequencing and Genome Assembly. Genom. Proteom. Bioinform. 2016, 14, 265–279. [Google Scholar] [CrossRef] [Green Version]
- Jain, M.; Olsen, H.E.; Paten, B.; Akeson, M. The Oxford Nanopore MinION: Delivery of nanopore sequencing to the genomics community. Genome Biol. 2016, 17, 239. [Google Scholar] [CrossRef] [PubMed] [Green Version]
- Schlötterer, C. Evolutionary dynamics of microsatellite DNA. Chromosoma 2000, 109, 365–371. [Google Scholar] [CrossRef]
- Ellegren, H. Microsatellites: Simple sequences with complex evolution. Nat. Rev. Genet. 2004, 5, 435–445. [Google Scholar] [CrossRef] [PubMed]
- Jones, A.G.; Small, C.M.; Paczolt, K.A.; Ratterman, N.L. A practical guide to methods of parentage analysis. Mol. Ecol. Resour. 2010, 10, 6–30. [Google Scholar] [CrossRef] [PubMed]
- Kim, K.S.; Sappington, T.W. Microsatellite Data Analysis for Population Genetics. Microsattelites. Methods Mol. Biol. 2013, 1006, 271–295. [Google Scholar] [CrossRef] [Green Version]
- Vendramin, G.G.; Lelli, L.; Rossi, P.; Morgante, M. A set of primers for the amplification of 20 chloroplast microsatellites in Pinaceae. Mol. Ecol. 1996, 595–598. [Google Scholar] [CrossRef] [PubMed]
- Pfeiffer, A.; Olivieri, A.M.; Morgante, M. Identification and characterization of microsatellites in Norway spruce (Picea abies K.). Genome 1997, 40, 411–419. [Google Scholar] [CrossRef] [PubMed]
- Scotti, I.; Magni, F.; Fink, R.; Powell, W.; Binelli, G.; Hedley, P.E. Microsatellite repeats are not randomly distributed within Norway spruce (Picea abies K.) expressed sequences. Genome 2000, 43, 41–46. [Google Scholar] [CrossRef]
- Scotti, I.; Magni, F.; Paglia, G.; Morgante, M. Trinucleotide microsatellites in Norway spruce (Picea abies): Their features and the development of molecular markers. Theor. Appl. Genet. 2002, 106, 40–50. [Google Scholar] [CrossRef]
- Besnard, G.; Acheré, V.; Faivre Rampant, P.; Favre, J.M.; Jeandroz, S. A set of cross-species amplifying microsatellite markers developed from DNA sequence databanks in Picea (Pinaceae). Mol. Ecol. Notes 2003, 3, 380–383. [Google Scholar] [CrossRef]
- Rungis, D.; Bérubé, Y.; Zhang, J.; Ralph, S.; Ritland, C.E.; Ellis, B.E.; Douglas, C.; Bohlmann, J.; Ritland, K. Robust simple sequence repeat markers for spruce (Picea spp.) from expressed sequence tags. Theor. Appl. Genet. 2005, 109, 283–1294. [Google Scholar] [CrossRef] [PubMed]
- Fluch, S.; Burg, A.; Kopecky, D.; Homolka, A.; Spiess, N.; Vendramin, G.G. Characterization of variable EST SSR markers for Norway spruce (Picea abies L.). BMC Res. Notes 2011, 4, 401. [Google Scholar] [CrossRef] [PubMed] [Green Version]
- De Beukelaer, H.; Davenport, G.F.; Fack, V. Core Hunter 3: Flexible core subset selection. BMC Bioinform. 2018, 19, 203. [Google Scholar] [CrossRef] [PubMed]
- Frankel, O.H. Genetic Perspectives of Germplasm Conservation. In Genetic Manipulation: Impact on Man and Society; Cambridge University Press: Cambridge, UK, 1984. [Google Scholar]
- Wang, J.-C.; Hu, J.; Liu, N.-N.; Xu, H.-M.; Zhang, S. Investigation of Combining Plant Genotypic Values and Molecular Marker Information for Constructing Core Subsets. J. Integr. Plant Biol. 2006, 48, 1371–1378. [Google Scholar] [CrossRef]
- Franco, J.; Crossa, J.; Desphande, S. Hierarchical Multiple-Factor Analysis for Classifying Genotypes Based on Phenotypic and Genetic Data. Crop Sci. 2010, 50, 105–117. [Google Scholar] [CrossRef] [Green Version]
- Borrayo, E.; Machida-Hirano, R.; Takeya, M.; Kawase, M.; Watanabe, K. Principal components analysis—K-means transposon element based foxtail millet core collection selection method. BMC Genet. 2016, 17, 42. [Google Scholar] [CrossRef] [PubMed] [Green Version]
- Brown, A.H.D. Core collections: A practical approach to genetic resources management. Genome 1989, 31, 818–824. [Google Scholar] [CrossRef]
- Franco, J.; Crossa, J.; Taba, S.; Shands, H. A Sampling Strategy for Conserving Genetic Diversity when Forming Core Subsets. Crop Sci. 2006, 45, 1035–1044. [Google Scholar] [CrossRef]
- Schoen, D.J.; Brown, A.H. Conservation of allelic richness in wild crop relatives is aided by assessment of genetic markers. Proc. Natl. Acad. Sci. USA 1993, 90, 10623–10627. [Google Scholar] [CrossRef] [Green Version]
- Odong, T.L.; Jansen, J.; van Eeuwijk, F.A.; van Hintum, T.J.L. Quality of core collections for effective utilisation of genetic resources review, discussion and interpretation. Theor. Appl. Genet. 2013, 126, 289–305. [Google Scholar] [CrossRef] [Green Version]
- Odong, T.L.; van Heerwaarden, J.; Jansen, J.; van Hintum, T.J.L.; van Eeuwijk, F.A. Statistical Techniques for Defining Reference Sets of Accessions and Microsatellite Markers. Crop Sci. 2011, 51, 2401–2411. [Google Scholar] [CrossRef]
- Jeong, S.; Kim, J.-Y.; Jeong, S.-C.; Kang, S.-T.; Moon, J.-K.; Kim, N. GenoCore: A simple and fast algorithm for core subset selection from large genotype datasets. PLoS ONE 2017, 12, e0181420. [Google Scholar] [CrossRef] [Green Version]
- Jansen, J.; van Hintum, T. Genetic distance sampling: A novel sampling method for obtaining core collections using genetic distances with an application to cultivated lettuce. Theor. Appl. Genet. 2007, 114, 421–428. [Google Scholar] [CrossRef] [PubMed]
- Thachuk, C.; Crossa, J.; Franco, J.; Dreisigacker, S.; Warburton, M.; Davenport, G.F. Core Hunter: An algorithm for sampling genetic resources based on multiple genetic measures. BMC Bioinform. 2009, 10, 243. [Google Scholar] [CrossRef] [PubMed] [Green Version]
- Freeman, G.H. Complete Latin Squares and Related Experimental Designs. J. R. Stat. Soc. Ser. B 1979, 41, 253–262. [Google Scholar] [CrossRef]
- Lstibůrek, M.; El-Kassaby, Y.A. Minimum-Inbreeding Seed Orchard Design. For. Sci. 2010, 56, 603–608. [Google Scholar]
- El-Kassaby, Y.A.; Fayed, M.; Klápště, J.; Lstibůrek, M. Randomized, replicated, staggered clonal-row (R2SCR) seed orchard design. Tree Genet. Genomes 2014, 10, 555–563. [Google Scholar] [CrossRef]
- Chaloupková, K.; Stejskal, J.; El-Kassaby, Y.A.; Lstibůrek, M. Optimum neighborhood seed orchard design. Tree Genet. Genomes 2016, 12, 105. [Google Scholar] [CrossRef]
- Morgenstern, E.K. Geographic Variation in Forest Trees; UBC Press: Vancouver, BC, Canada, 1996. [Google Scholar]
- Bínová, Z.; Korecký, J.; Dvořák, J.; Bílý, J.; Zádrapová, D.; Jansa, V.; Lstibůrek, M. Genetic Structure of Norway Spruce Ecotypes Studied by SSR Markers. Forests 2020, 11, 110. [Google Scholar] [CrossRef] [Green Version]
- Hulce, D.; Li, X.; Snyder-Leiby, T.; Liu, C.J. GeneMarker® genotyping software: Tools to increase the statistical power of DNA fragment analysis. J. Biomol. Tech. 2011, 22, S35. [Google Scholar]
- Kalinowski, S.T.; Taper, M.L.; Marshall, T.C. Revising how the computer program cervus accommodates genotyping error increases success in paternity assignment. Mol. Ecol. 2007, 16, 1099–1106. [Google Scholar] [CrossRef] [PubMed]
- Peakall, R.; Smouse, P.E. Genalex 6: Genetic analysis in Excel. Population genetic software for teaching and research. Mol. Ecol. Notes 2006, 6, 288–295. [Google Scholar] [CrossRef]
- Peakall, R.; Smouse, P.E. GenAlEx 6.5: Genetic analysis in Excel. Population genetic software for teaching and research—An update. Gene. Popula. Anal. 2012, 2537–2539. [Google Scholar] [CrossRef] [PubMed] [Green Version]
- Kalinowski, S.T.; Taper, M.L. Maximum likelihood estimation of the frequency of null alleles at microsatellite loci. Conserv. Genet. 2006, 7, 991–995. [Google Scholar] [CrossRef]
- Bruvo, R.; Michiels, N.K.; D’Souza, T.G.; Schulenburg, H. A simple method for the calculation of microsatellite genotype distances irrespective of ploidy level. Mol. Ecol. 2004, 13, 2101–2106. [Google Scholar] [CrossRef]
- Kamvar, Z.N.; Tabima, J.F.; Grünwald, N.J. Poppr: An R package for genetic analysis of populations with clonal, partially clonal, and/or sexual reproduction. PeerJ 2014, 2, e281. [Google Scholar] [CrossRef] [PubMed] [Green Version]
- Saitou, N.; Nei, M. The neighbor-joining method: A new method for reconstructing phylogenetic trees. Mol. Biol. Evol. 1987, 4, 406–425. [Google Scholar] [CrossRef] [PubMed]
- Jombart, T. Adegenet: A R package for the multivariate analysis of genetic markers. Bioinformatics 2008, 24, 1403–1405. [Google Scholar] [CrossRef] [Green Version]
- Varshney, R.K.; Graner, A.; Sorrells, M.E. Genic microsatellite markers in plants: Features and applications. Trends Biotechnol. 2005, 23, 48–55. [Google Scholar] [CrossRef]
- Selkoe, K.A.; Toonen, R.J. Microsatellites for ecologists: A practical guide to using and evaluating microsatellite markers. Ecol. Lett. 2006, 9, 615–629. [Google Scholar] [CrossRef]
- Cvrčková, H.; Máchová, P. Genetická charakterizace smrku ztepilého pomocí mikrosatelitových markerů. Lesn. Průvodce 2015, 8, 243–249. [Google Scholar]
- Funda, T.; El-Kassaby, Y.A. Seed orchard genetics. Plant Sci. Rev. 2013, 21–43. [Google Scholar] [CrossRef]
- De Beukelaer, H.; Smýkal, P.; Davenport, G.F.; Fack, G.F. Core Hunter II: Fast core subset selection based on multiple genetic diversity measures using Mixed Replica search. BMC Bioinform. 2012, 13, 312. [Google Scholar] [CrossRef] [PubMed] [Green Version]
- Franco, J.; Crossa, J.; Warburton, M.L.; Taba, S. Sampling Strategies for Conserving Maize Diversity When Forming Core Subsets Using Genetic Markers. Crop Sci. 2006, 46, 854–864. [Google Scholar] [CrossRef]
- Otter, K.A.; Stewart, I.R.K.; McGregor, P.K.; Terry, A.M.R.; Dabelsteen, T.; Burke, T. Extra-pair paternity among Great Tits Parus major following manipulation of male signals. J. Avian Biol. 2011, 32, 338–344. [Google Scholar] [CrossRef]
- Bell, G.D.; Fletcher, A.M. Computer organized orchard layouts (COOL) based on the permutated neighborhood design concept. Silvae Genet. 1978, 27, 223–225. [Google Scholar]
- Yang, B.; Sun, H.; Qi, J.; Niu, S.; El-Kassaby, Y.A.; Li, W. Improved genetic distance-based spatial deployment can effectively minimize inbreeding in seed orchard. For. Ecosyst. 2020, 7, 10. [Google Scholar] [CrossRef] [Green Version]
Figure 1.
(a). Shannon diversity index (I) for various core collection sample sizes under random selection (red line), and Core Hunter entry-to-nearest-entry distance (EN) optimization objective (blue line). (b). Number of effective alleles (Ne) for various core collection sample sizes under random selection (red line), and Core Hunter entry-to-nearest-entry distance (EN) optimization objective (blue line).


Figure 2.
Heatmap of 50 accessions; 15 individuals are selected for the core collection (white dots). Shades of orange color indicated the level of genetic similarity among individuals, determined from identity (light beige) to the lowest similarity (dark orange).
Figure 2.
Heatmap of 50 accessions; 15 individuals are selected for the core collection (white dots). Shades of orange color indicated the level of genetic similarity among individuals, determined from identity (light beige) to the lowest similarity (dark orange).

Figure 3.
The layout of ONA seed orchard deployment. The Green and red coloring of cells illustratively emphasizes the spatial distribution of ramets belonging to two clones.
Figure 3.
The layout of ONA seed orchard deployment. The Green and red coloring of cells illustratively emphasizes the spatial distribution of ramets belonging to two clones.


Table 1.
Frequency-based statistics on analyzed loci.
| Locus | k | Ho | He | PIC | HW | F(Null) |
|---|---|---|---|---|---|---|
| Pa_56 | 5 | 0.634 | 0.633 | 0.562 | NS | 0 |
| Pa_28 | 7 | 0.574 | 0.633 | 0.587 | NS | 0.05 |
| Pa_33 | 7 | 0.13 | 0.192 | 0.186 | ND | 0.092 |
| PAAC3 | 44 | 0.532 | 0.904 | 0.895 | *** | 0.242 |
| PAAC23 | 19 | 0.696 | 0.674 | 0.652 | NS | 0 |
| WS0019.F22 | 11 | 0.458 | 0.521 | 0.482 | * | 0.046 |
| WS0023.B03 | 21 | 0.542 | 0.913 | 0.906 | *** | 0.252 |
| WS0073.H08 | 7 | 0.641 | 0.654 | 0.585 | NS | 0.012 |
| WSA0092.A19 | 12 | 0.751 | 0.774 | 0.749 | NS | 0.017 |
| paGB3 | 9 | 0.627 | 0.753 | 0.716 | *** | 0.069 |
| SpAG2 | 17 | 0.682 | 0.911 | 0.903 | *** | 0.142 |
| Pt71936 | 7 | 0.327 | 0.621 | 0.583 | *** | 0.264 |
| EATC1D02A | 20 | 0.418 | 0.805 | 0.787 | *** | 0.274 |
| WS00716.F13 | 35 | 0.636 | 0.946 | 0.943 | ND | 0.192 |
| EATC1E03 | 7 | 0.23 | 0.335 | 0.311 | *** | 0.155 |
| Mean | 15.200 | 0.525 | 0.685 | 0.656 | – | – |
| SD | 11.346 | 0.180 | 0.215 | 0.221 | – | – |
| SE | 2.930 | 0.046 | 0.056 | 0.057 |
k—number of alleles at each locus; Ho—observed heterozygosity; He—expected heterozygosity; PIC—polymorphic information content; HW—deviations from Hardy-Weinberg equilibrium; level of significance: *** α = 0.001; * α = 0.05; NS—not significant; ND—not done; F(Null)—estimation of null allele frequency; SD—standard deviation; SE—standard error.
Table 2.
Frequency-based statistics.
| Core Hunter Selection (EN) | Random Selection | |||||
|---|---|---|---|---|---|---|
| N | Na | Ne | I | Na | Ne | I |
| 10 | 6.643 | 4.652 | 1.572 | 5.714 | 3.597 | 1.358 |
| 20 | 8.714 | 5.492 | 1.680 | 7.571 | sd4.771 | 1.518 |
| 30 | 9.786 | 5.843 | 1.736 | 8.714 | 5.031 | 1.591 |
| 40 | 10.643 | 6.097 | 1.769 | 9.143 | 4.757 | 1.590 |
| 47 | 11.286 | 6.134 | 1.786 | 10.000 | 5.623 | 1.681 |
| 50 | 11.429 | 6.345 | 1.793 | 10.500 | 4.858 | 1.632 |
| 52 | 11.429 | 6.373 | 1.789 | 9.929 | 4.803 | 1.574 |
| 54 | 11.286 | 6.347 | 1.786 | 10.214 | 5.345 | 1.631 |
| 55 | 11.286 | 6.409 | 1.786 | 10.429 | 5.008 | 1.618 |
| 56 | 11.357 | 6.500 | 1.793 | 11.000 | 5.684 | 1.676 |
| 57 | 11.429 | 6.507 | 1.807 | 10.571 | 5.241 | 1.651 |
| 58 | 11.286 | 6.351 | 1.783 | 10.357 | 4.921 | 1.589 |
| 59 | 11.429 | 6.424 | 1.788 | 10.286 | 5.427 | 1.647 |
| 60 | 11.429 | 6.401 | 1.788 | 11.214 | 5.423 | 1.657 |
| 65 | 11.571 | 6.346 | 1.782 | 10.786 | 5.329 | 1.625 |
| 70 | 12.286 | 6.388 | 1.795 | 11.071 | 5.107 | 1.642 |
| 71 | 12.286 | 6.450 | 1.806 | 11.429 | 5.328 | 1.644 |
| 100 | 12.786 | 6.365 | 1.801 | 12.214 | 5.432 | 1.694 |
| 150 | 13.929 | 6.272 | 1.773 | 12.786 | 5.418 | 1.671 |
| 200 | 14.571 | 6.244 | 1.760 | 13.286 | 5.765 | 1.700 |
| 250 | 15.000 | 5.997 | 1.746 | 14.000 | 5.810 | 1.716 |
| 300 | 15.500 | 5.985 | 1.740 | 14.786 | 5.787 | 1.711 |
| 408 | 15.857 | 5.764 | 1.713 | 15.857 | 5.764 | 1.713 |
N—sample size; Na—number of different alleles; Ne—number of effective alleles; I—Shannon diversity index.
Publisher’s Note: MDPI stays neutral with regard to jurisdictional claims in published maps and institutional affiliations. |
© 2022 by the authors. Licensee MDPI, Basel, Switzerland. This article is an open access article distributed under the terms and conditions of the Creative Commons Attribution (CC BY) license (https://creativecommons.org/licenses/by/4.0/).
Share and Cite
MDPI and ACS Style
Kelblerová, R.; Dvořák, J.; Korecký, J. Genetic Diversity Maximization as a Strategy for Resilient Forest Ecosystems: A Case Study on Norway Spruce. Forests 2022, 13, 489. https://0-doi-org.brum.beds.ac.uk/10.3390/f13030489
AMA Style
Kelblerová R, Dvořák J, Korecký J. Genetic Diversity Maximization as a Strategy for Resilient Forest Ecosystems: A Case Study on Norway Spruce. Forests. 2022; 13(3):489. https://0-doi-org.brum.beds.ac.uk/10.3390/f13030489
Chicago/Turabian StyleKelblerová, Radka, Jakub Dvořák, and Jiří Korecký. 2022. "Genetic Diversity Maximization as a Strategy for Resilient Forest Ecosystems: A Case Study on Norway Spruce" Forests 13, no. 3: 489. https://0-doi-org.brum.beds.ac.uk/10.3390/f13030489
Note that from the first issue of 2016, this journal uses article numbers instead of page numbers. See further details here.