Article

Gross Primary Production of Dwarf Bamboo, Sasa senanensis, in Cool-Temperate Secondary Forests with Different Canopy Structures

1
Graduate School of Science and Technology, University of Tsukuba, Ibaraki 305-8577, Japan
2
School of Life and Environmental Science, University of Tsukuba, Ibaraki 305-8577, Japan
3
Faculty of Education, Shinshu University, Nagano 380-8544, Japan
*
Author to whom correspondence should be addressed.
Submission received: 1 March 2022 / Revised: 24 March 2022 / Accepted: 28 March 2022 / Published: 1 April 2022

Abstract

:
Secondary forest accounts for almost 60% of the forest area in Japan. Dwarf bamboo (Sasa senanensis) grows widely in the understory of such forest and could make a significant contribution to the overall CO2 sink function (gross primary production, GPP) of forest ecosystems. It is, therefore, necessary to evaluate the GPP of Sasa in various forests and estimate its controlling factors. In this study, we estimated the Sasa GPP at the community level by using a chamber system in an evergreen coniferous forest, a mixed forest, and a deciduous broadleaved forest. We hypothesized that (1) the seasonal trends of Sasa community GPP and Sasa annual GPP would differ in different forest types, (2) in addition to light intensity, the seasonal changes of the Sasa community GPP would be controlled by different factors in the different forest types. As a result, although the seasonal trends of the Sasa GPP and the controlling factors differed among the three forests, the annual Sasa GPP was almost the same for the three forests. This study reveals the possible effect of forest type on the seasonal trends of Sasa GPP and its controlling factors; however, for the annual Sasa GPP, the length of the growing periods would also be an important factor.

1. Introduction

Forests that develop after coppicing from the stumps of felled trees and from buried seeds after both artificial and natural disturbances are defined as secondary forest [1]. In Japan, forests constitute almost 70% of the land area, and around 60% of them are secondary [2]. In general, forests can fix CO2 even at their climax stage, as extremely old-growth forests, though the amount of CO2 fixation is thought to be less in older forests than in younger forests [3]. Since large parts of the secondary forests have not reached such climax stage as compared to primary forests, they may contribute substantially to the global uptake of CO2 [4].
The gross uptake of CO2 through photosynthesis is defined as the gross primary production (GPP), which is the largest CO2 flux between the atmosphere and terrestrial ecosystems [5]. In addition to the absolute size of GPP, it is important to accurately estimate it in secondary forests, as GPP is a source of energy for all organisms. Elucidation of the factors that control it is also important t for the prediction of GPP under climate change. GPP is often estimated by meteorological techniques, such as the Eddy Covariance (EC) method, in forest ecosystems [6]. The EC method can not only estimate the GPP of an entire forest, but also identify the factors that control it [7,8]. However, a forest structure is highly complex, both vertically and horizontally, and is characterized by several distinct layers with very different functional properties [9]. Therefore, to better understand the GPP of forest ecosystems, it is important to evaluate the GPP of each layer, especially that of the understory vegetation, which is reported to possibly contribute to a large extent to the overall GPP of a forest [10,11,12]. However, it is difficult to estimate the GPP of each layer and to identify the factors that control it by the EC method [9]. In the forest understory layer, in particular, it is usually not practical to use the EC method alone because low wind speeds and intermittent turbulence can reduce data reliability [9,13,14].
Dwarf bamboo species of the genus Sasa are dominant in the understory of many secondary forests in Japan, especially in snow-covered areas [12,15]. The exclusive dominance of Sasa decreases the amount of light that reaches the ground, leading to lower survival rates and densities of seedlings and saplings [16,17]. Therefore, the abundant growth of Sasa can prevent forest regeneration in Japan [18]. Moreover, it also has a negative effect on forest function through the reduction of understory biodiversity [19]. However, recent studies demonstrated that Sasa, which was previously thought to only hinder forest regeneration and functions, contributed 16% to 25% of the forest GPP in an old-growth beech forest [12]. In addition, Cai et al. (2021) demonstrated that the seasonal dynamics of Sasa GPP and its controlling factors, as well as the annual Sasa GPP, differed between sites covered by tree canopy and gaps created by large disturbances in the same forest [12]. Thus, Sasa GPP and its controlling factors could be influenced by the structure of the forest canopy, both temporally and spatially, which would create different environmental conditions on the forest floor. Since Sasa is widely distributed in forests in Japan and could contribute significantly to forest ecosystem GPP, it is of importance to accurately estimate its GPP and its seasonal trends under different canopy structure. In addition, understanding the factors that control the seasonal changes of Sasa GPP in these forests is essential for predicting how Sasa GPP will change under global warming.
This study was conducted in three types of secondary forests: deciduous broadleaved, evergreen coniferous, and mixed forest consisting of both coniferous and deciduous trees. These three types of forest were chosen because they are the typical forest with Sasa-dominated understory. By combining data of the vegetation distribution (data of vegetation survey conducted by the Ministry of the Environment in Japan) and the data of the distribution of Sasa senanensis [20], the targeted dwarf bamboo species in this study, it appeared that deciduous broadleaved forest, mixed forest, and evergreen coniferous forest occupy 43.8%, 2.2%, and 24.4%, respectively. Even though the ratio of mixed forest was relatively low, it was higher than that of other types of forest, i.e., deciduous coniferous forest and evergreen broadleaved forest. These three forests have different canopy structures both temporally and spatially, which could largely influence the understory environment. In the deciduous broadleaved forest dominated by mature beech trees, there were two areas where the forest floor environment was significantly different, so we established two study areas: a closed-canopy area and a canopy gap area (canopy area and gap area, [12]). In this study, we tested two hypotheses: (1) the seasonal trends of Sasa community GPP and Sasa annual GPP would differ among forest types, (2) in addition to light intensity, the seasonal changes of Sasa community GPP would be controlled by different factors in different forest types.

2. Materials and Methods

2.1. Study Area

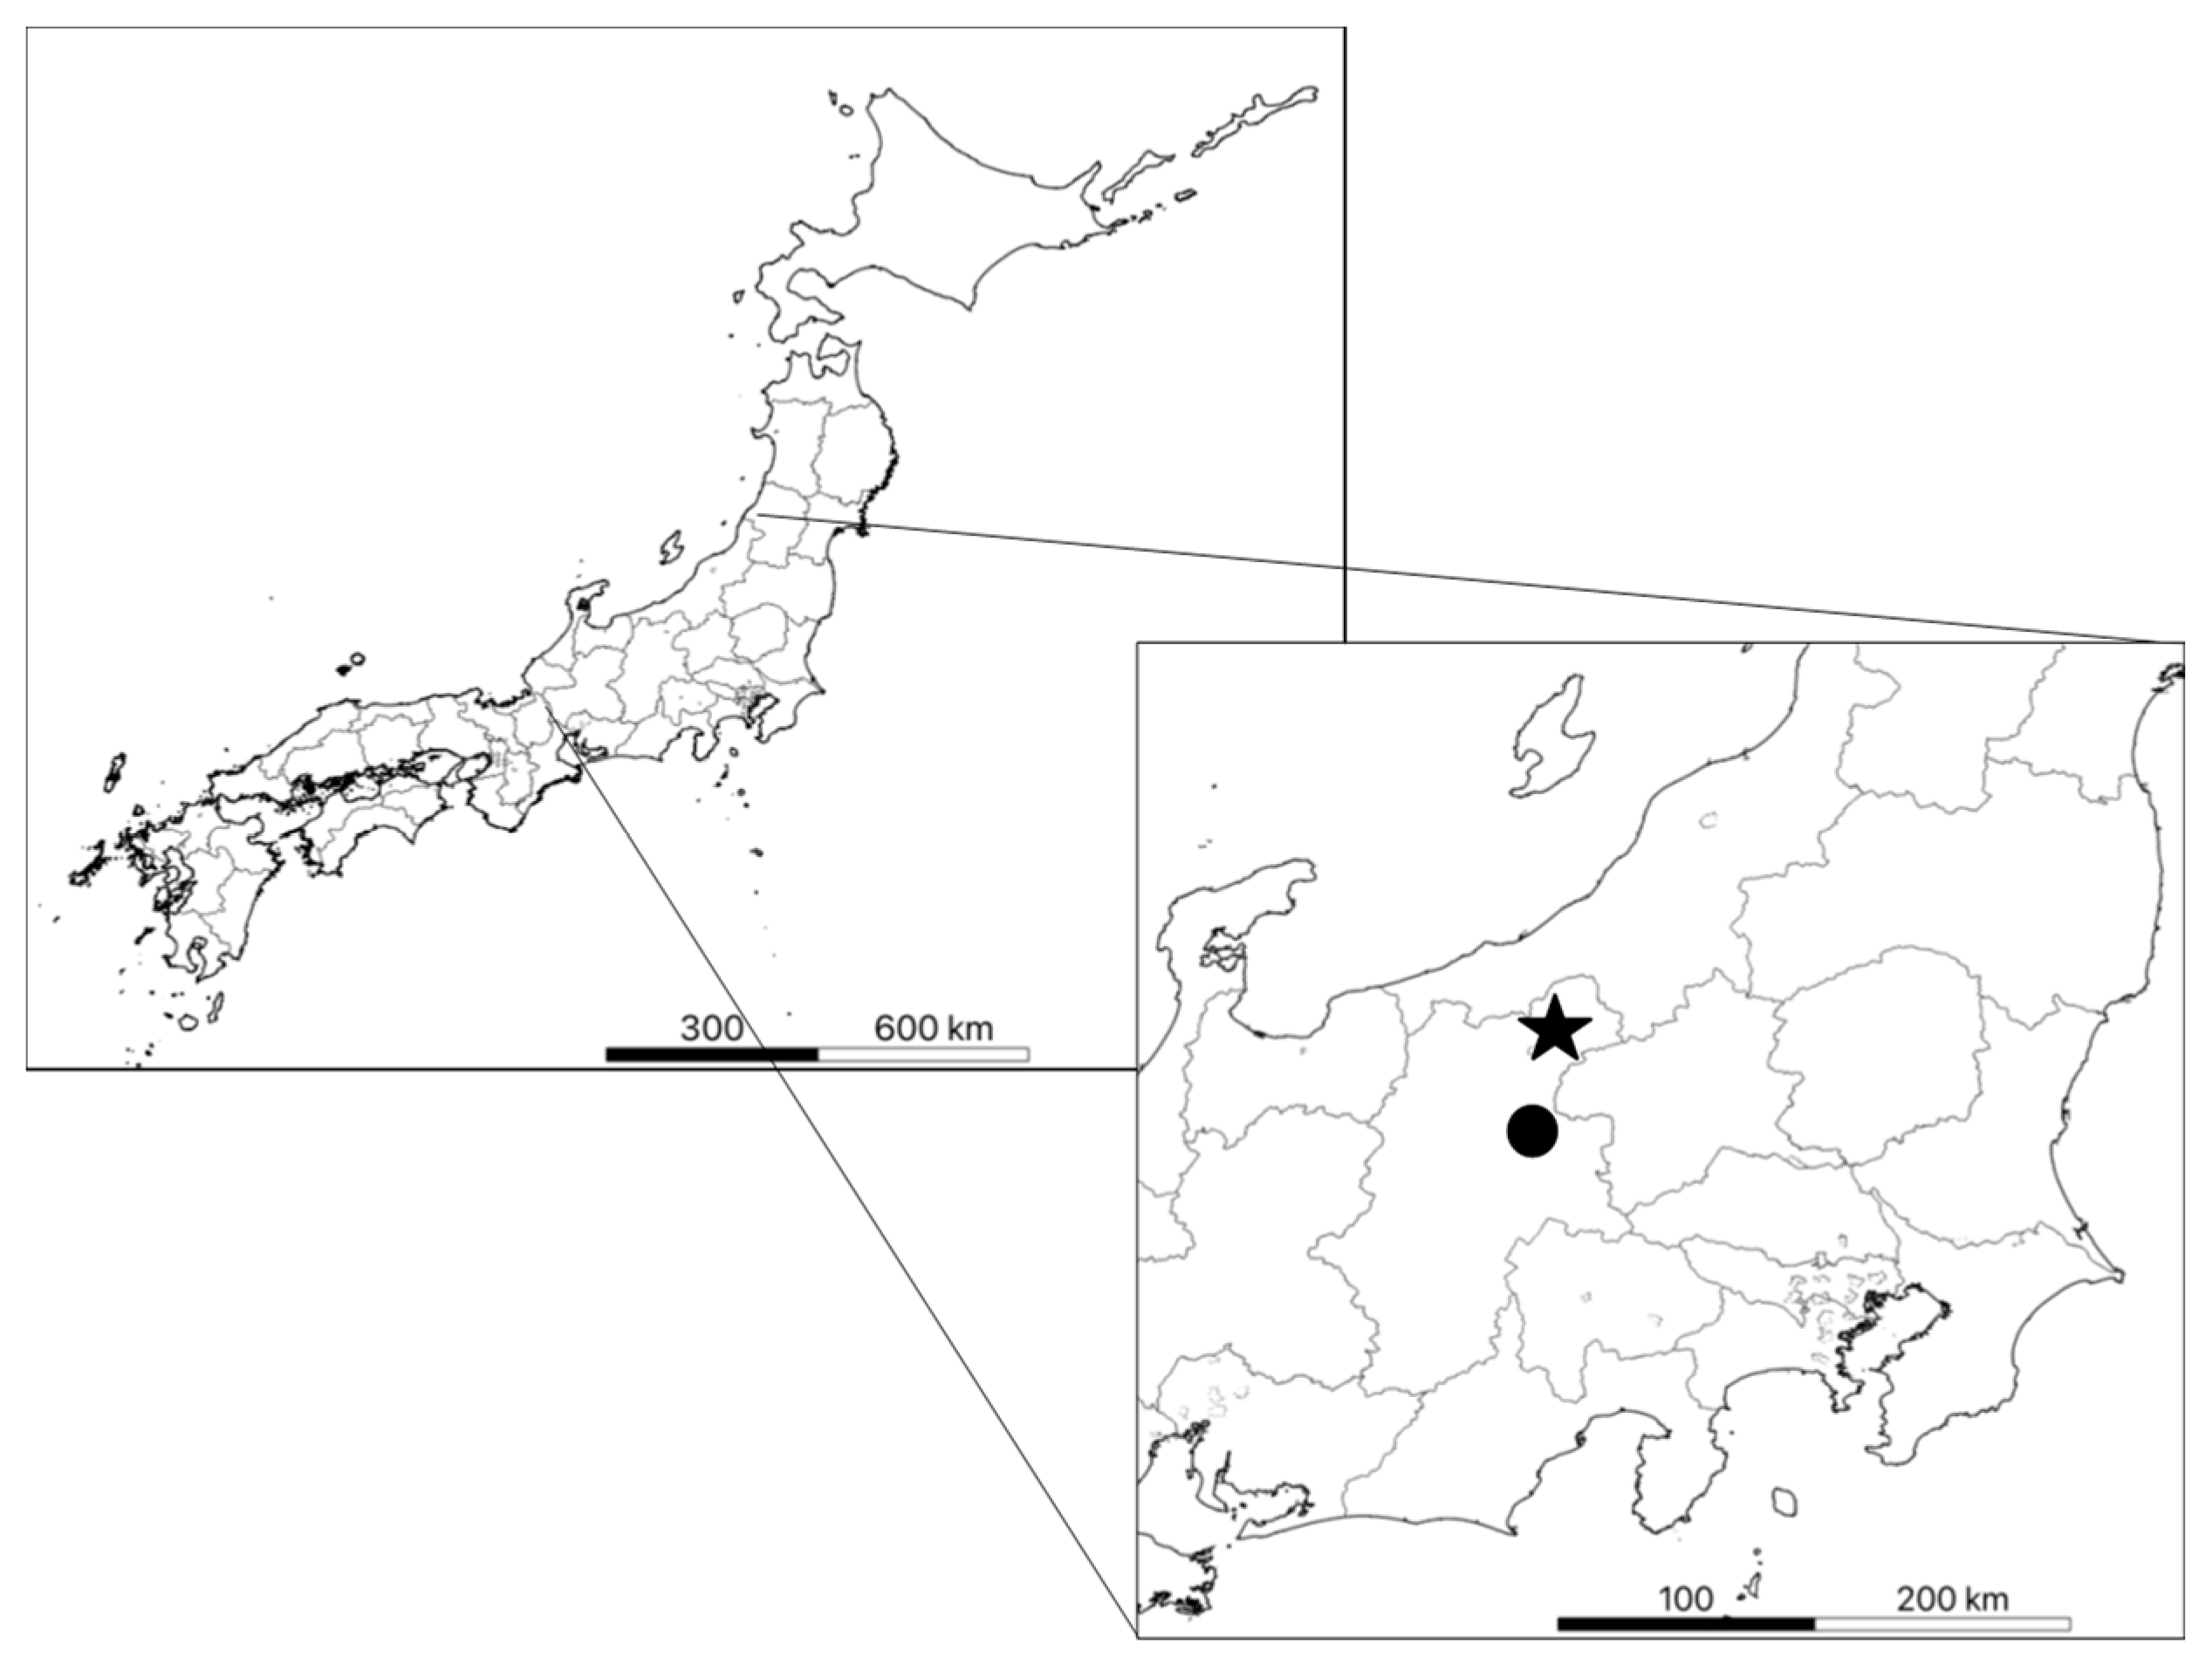
The three secondary forests were an evergreen coniferous forest (about 60 years old), a mixed forest with coniferous and deciduous trees (about 90 years old), both at the Sugadaira Montane Research Center (SMRC), University of Tsukuba, Nagano (36°31′ N, 138°21′ E, 1315 m elevation; [21]), and a deciduous broadleaved forest (more than 300 years old), in Kayanodaira, Nagano (36°50′ N, 138°30′ E, 1495 m elevation; [22]; Figure 1). Observations were carried out in a 1 ha permanent monitoring site in each forest. The two 1 ha sites (200 m × 50 m) at SMRC (evergreen coniferous forest and mixed forest) were established in 2007, and the 1 ha site (100 m × 100 m) at Kayanodaira in 2005 (this is one of the Japanese Ministry of the Environment’s “Monitoring Sites 1000” program sites; [23]). Each plot was divided into 10 m × 10 m sub-plots. At each site, in addition to the annual survey of diameter at breast height (DBH) and survival status of all target trees with DBH ≥ 5 cm, litter fall was recorded monthly. The dominant species were Fagus crenata in the deciduous broadleaved forest, Pinus densiflora in the evergreen coniferous forest, and Quercus crispula and P. densiflora in the mixed forest. The stand density was 2400 ha−1, 984 ha−1, and 1210 ha−1 in the evergreen coniferous forest, mixed forest, and deciduous forest, respectively, and there was no forest management for at least 70 years. The forest understory at all sites was dominated by Sasa senanensis [21,22], with a mean height of around 2 m. The mean annual temperature and average precipitation from 1981 to 2010 were 4.9 °C and 1678 mm year−1 at Kayanodaira [22] and 6.6 °C and 1343 mm year−1 at SMRC (https://www.sugadaira.tsukuba.ac.jp/nature/weather.html; accessed date: 28 February 2022). The maximum snow depth was 4 m at Kayanodaira and 1 m at SMRC. Hereinafter, the sites in this paper indicate canopy area and gap area in the deciduous broadleaved forest, evergreen coniferous forest, and mixed forest.

2.2. Measurement of Metrological Variables

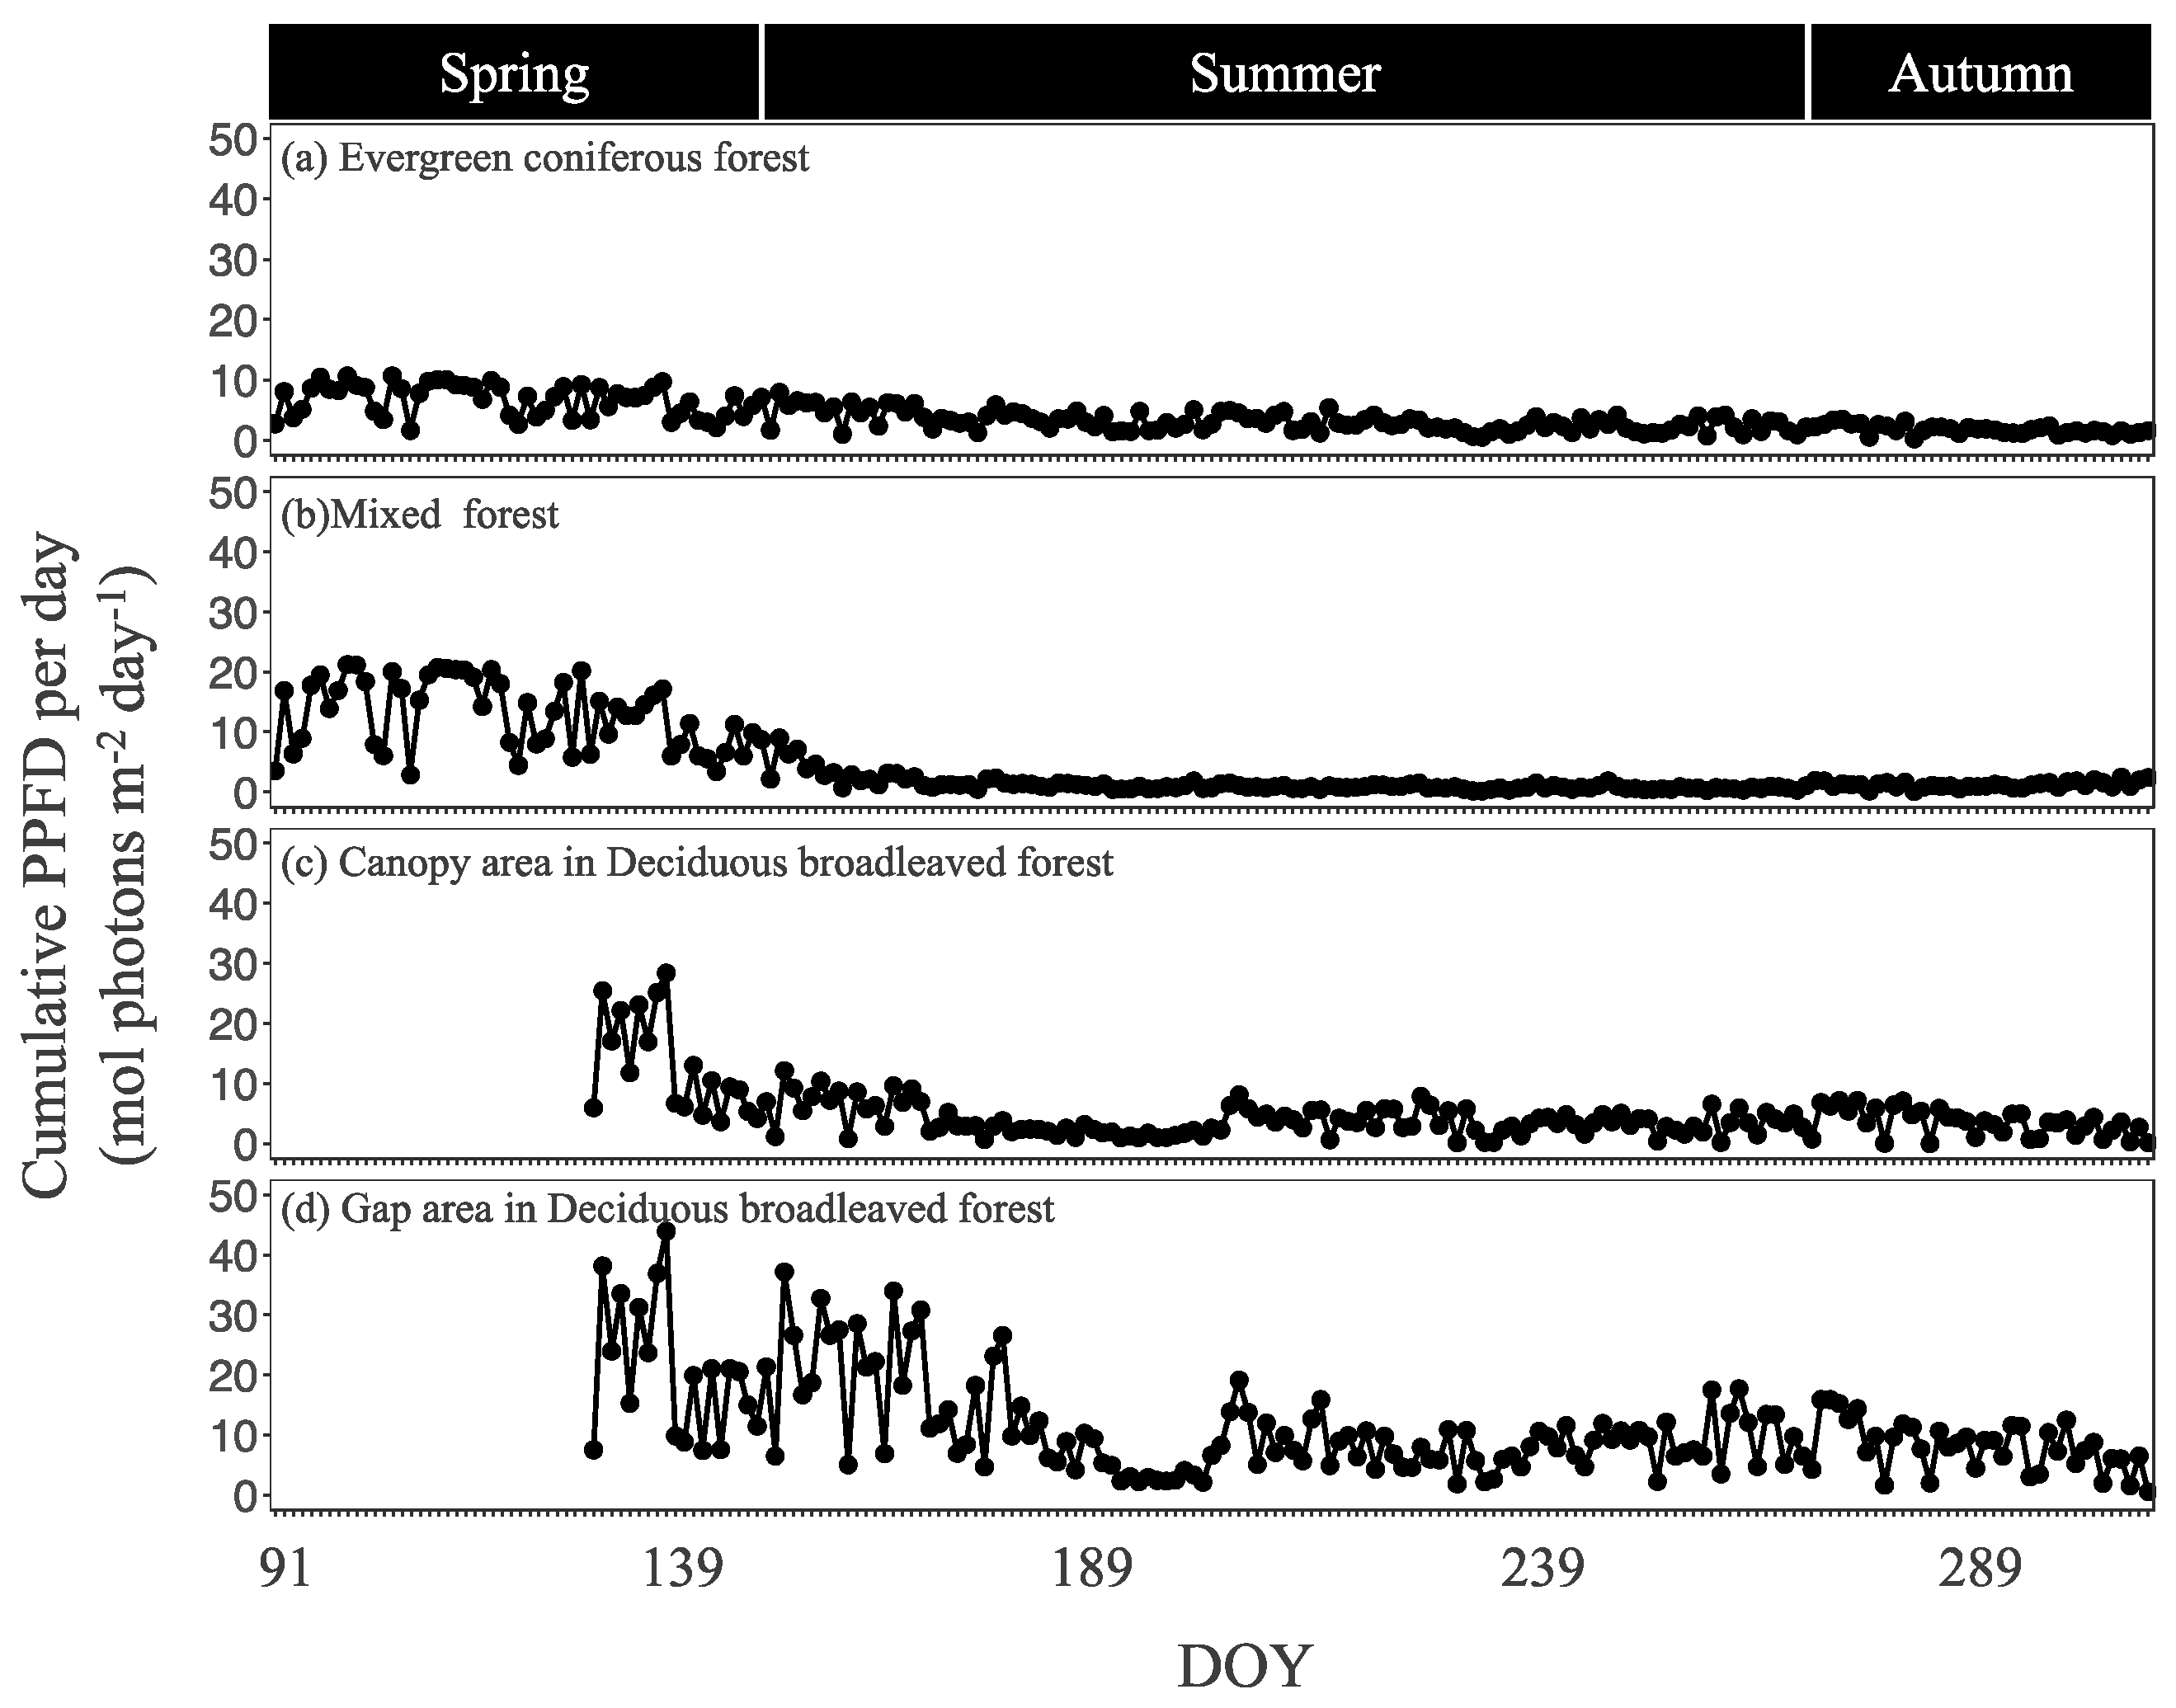
Photosynthetic photon flux density (PPFD), air temperature (TA), relative humidity (RH) at 2 m above the ground, soil temperature (TS) at 5 cm depth, and soil water content (SWC) at 10 cm depth were measured from 2 April to 29 October in the evergreen coniferous forest and mixed forest and from 7 May to 25 October in the deciduous broadleaved forest. PPFD was measured at 5 min intervals, and other factors at 30 min intervals. All measurements in the deciduous broadleaved forest were conducted in both canopy and gap areas. PPFD was measured with a quantum sensor (SE-SQ110, Apogee Electronics, Santa Monica, CA, USA), TA and RH with a temperature sensor and an RH datalogger (HOBO MX2300, Onset Computer, Bourne, MA, USA), TS with temperature dataloggers (HOBO MX2204, Onset Computer), and SWC with a soil moisture sensor (SM150, Delta-T, Cambridge, UK). A solar radiation shield (RS3-B, Onset Computer) shaded the TA and RH sensor from direct sunlight. The quantum sensor in the deciduous broadleaved forest canopy area broke immediately after installation, so we used data acquired from a sensor built into a leaf area index analyzer (MIJ-15LAI/P, Environmental Measurement Japan, Co., Ltd., Fukuoka, Japan) established 2 m above the ground from 7 May.

2.3. CO2 Flux Measurement and Calculation

The CO2 flux of the 
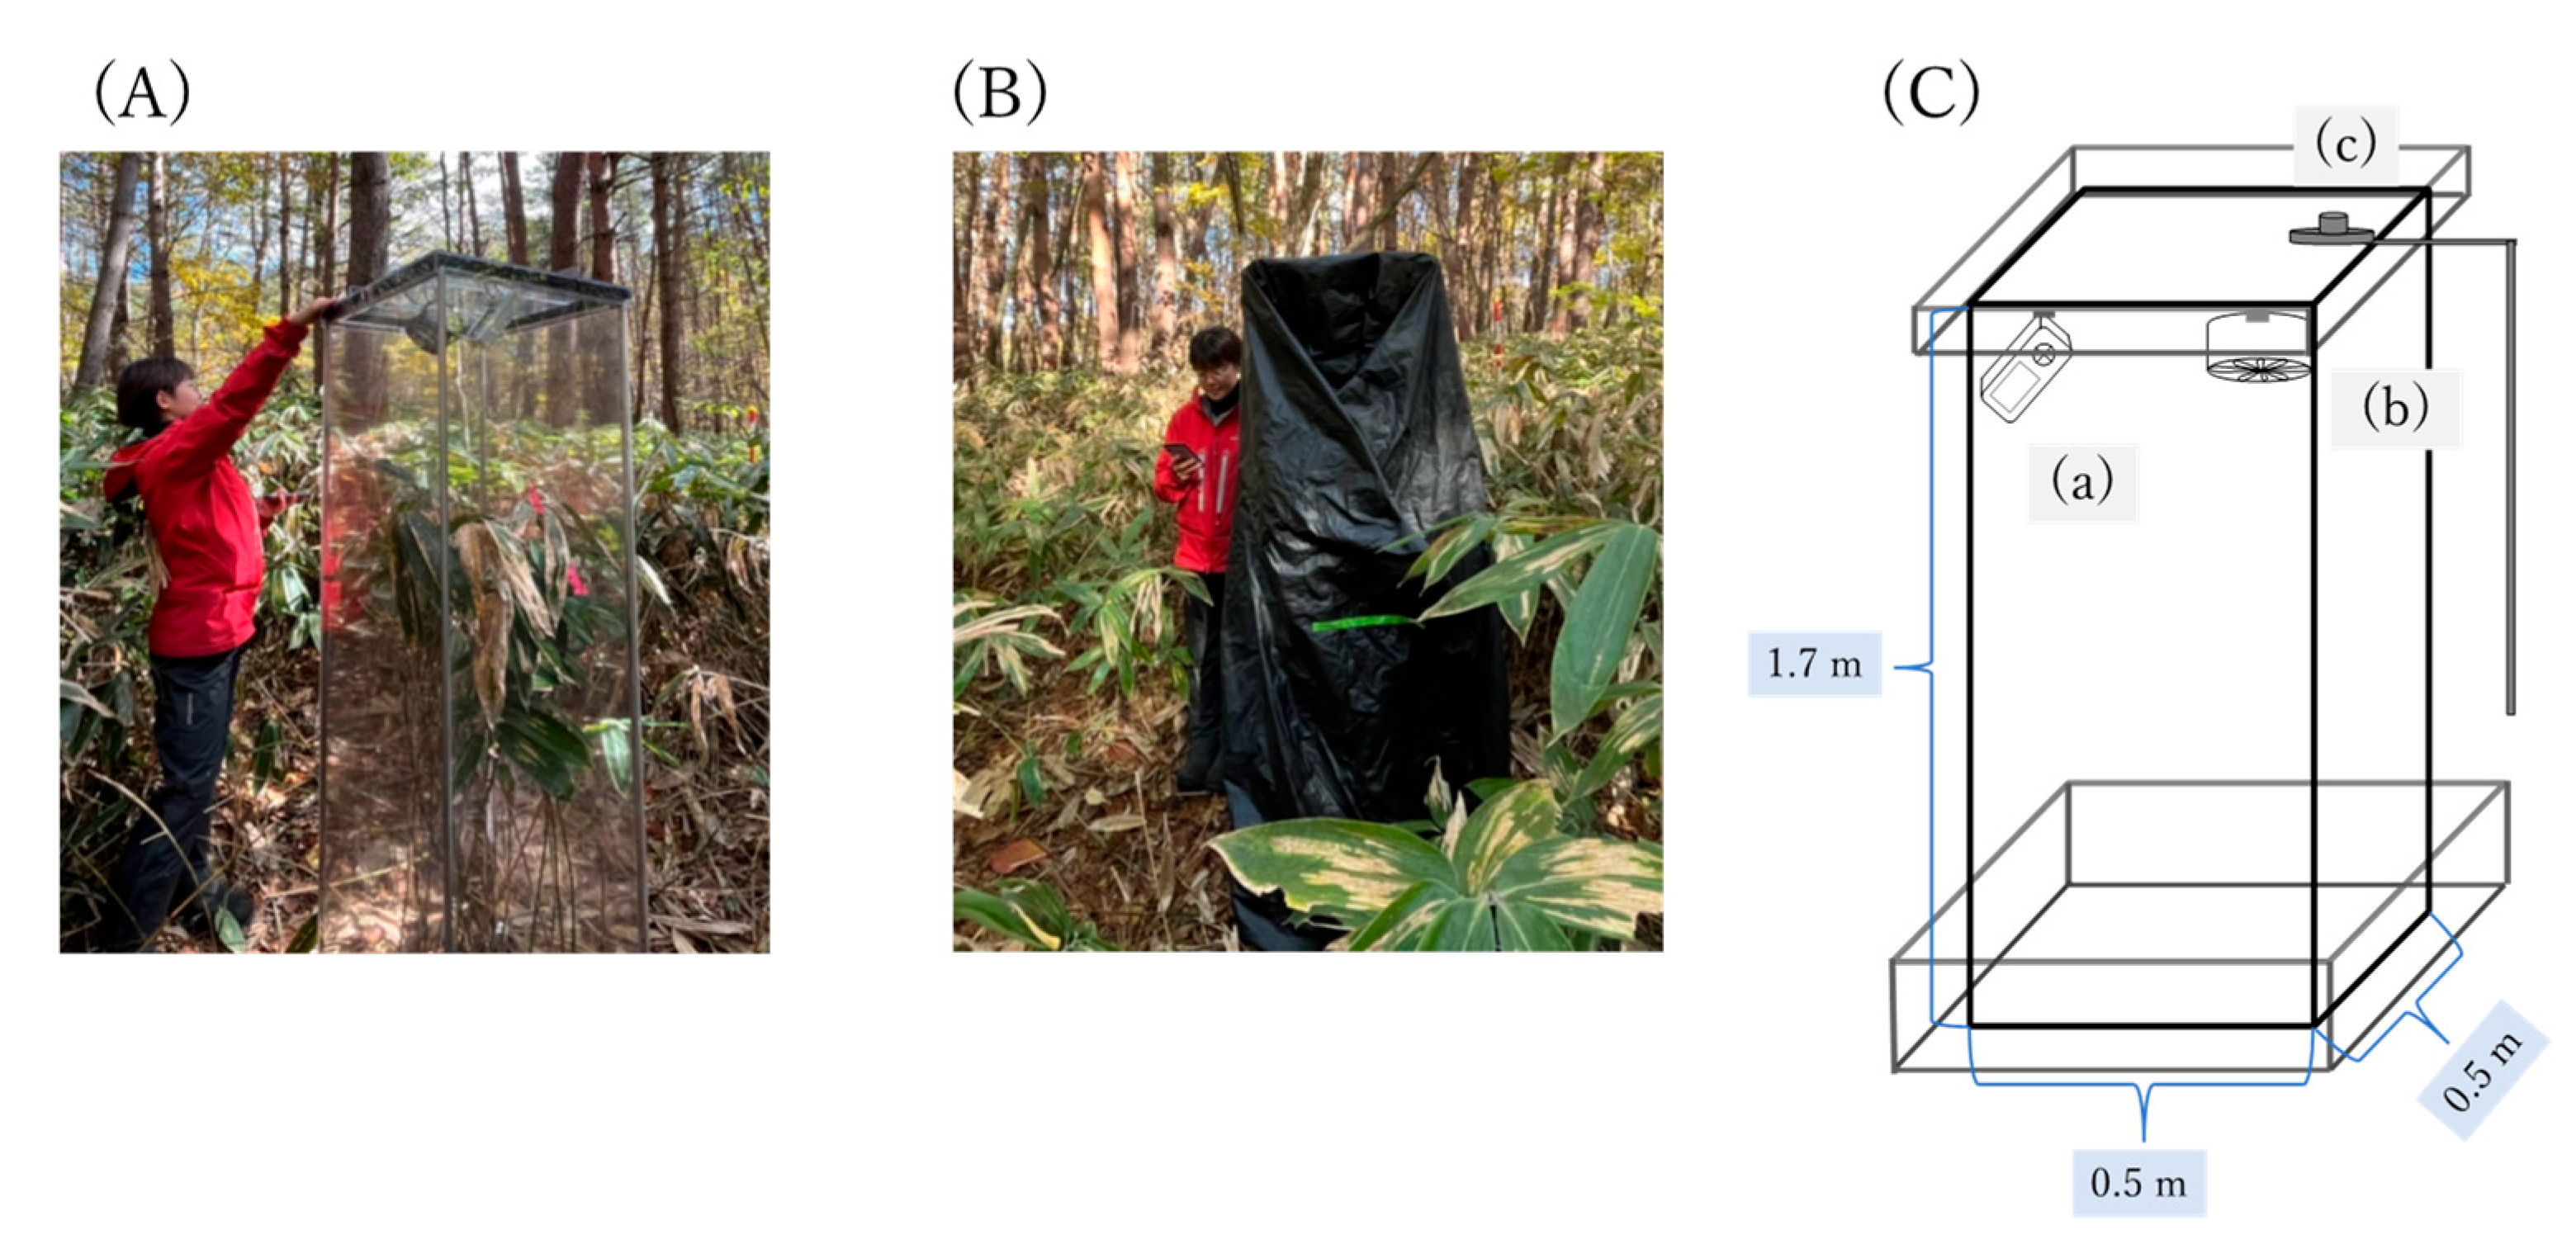
S. senanensis community was measured by using a static chamber system (Figure 2) at four measurement points at each site. The chamber system is described in detail in Cai et al. (2021). In brief, it consists of a lid, a body, and a bottom frame (Figure 2). We used a new small multiple sensors for CO2, temperature, and RH with a datalogger (HOBO MX1102A, Onset Computer), whose measurement accuracy and response time were verified beforehand. The bottom frame was set into the soil right after the snow melted at each site (2 April in the evergreen coniferous forest and mixed forest, 7 May in the canopy area and gap area in the deciduous broadleaved forest), and the lid and body were placed only during CO2 flux measurement.
CO2 uptake from the atmosphere within the chamber was defined as positive, and emission as negative. To estimate the GPP at the community scale and to obtain GPP-light response curves at each measurement point, right after we measured the CO2 flux under 100% light (CO2Flight), we measured it under 0% light (CO2Fdark) by placing a black plastic sheet over the chamber and measuring PPFD outside the chamber. All data were stored at 2 s intervals, and each measurement took 3 to 5 min to hold the increase of TA within 2 °C during the measurements. To maintain data quality, we excluded measurements in which TA increased by <2 °C or decreased or RH decreased. We calculated CO2Flight and CO2Fdark (μmol CO2 m−2 s−1) as [12]:
CO2Flight or CO2Fdark = ΔCO2/Δt × (P/(R(273.15 + T)))V/A
where ΔCO2/Δt is the slope of the chamber CO2 concentration against time (μmol CO2 mol−1 s−1), P is the atmospheric pressure held constant (kPa), R is the gas constant (8.314 kPa m−2 K−1 mol−1), T is the average temperature during the measurement (°C), V is the chamber volume (m3), and A is the surface area under the chamber (m2). The slope (S = ΔCO2/Δt) was obtained by fitting a linear model (C = St + b) to the sampling data, where C is the momentary CO2 concentration (μmol mol−1) at time t, and b is the intercept.
Measurements were taken from 28 April to 2 May (spring), 31 August to 3 September (summer), and 26 to 29 October (autumn) in 2021 in the evergreen coniferous forest and mixed forest, and from 22 to 25 May, 28 to 31 July, and 22 to 25 October in the canopy area and gap area in the deciduous broadleaved forest.

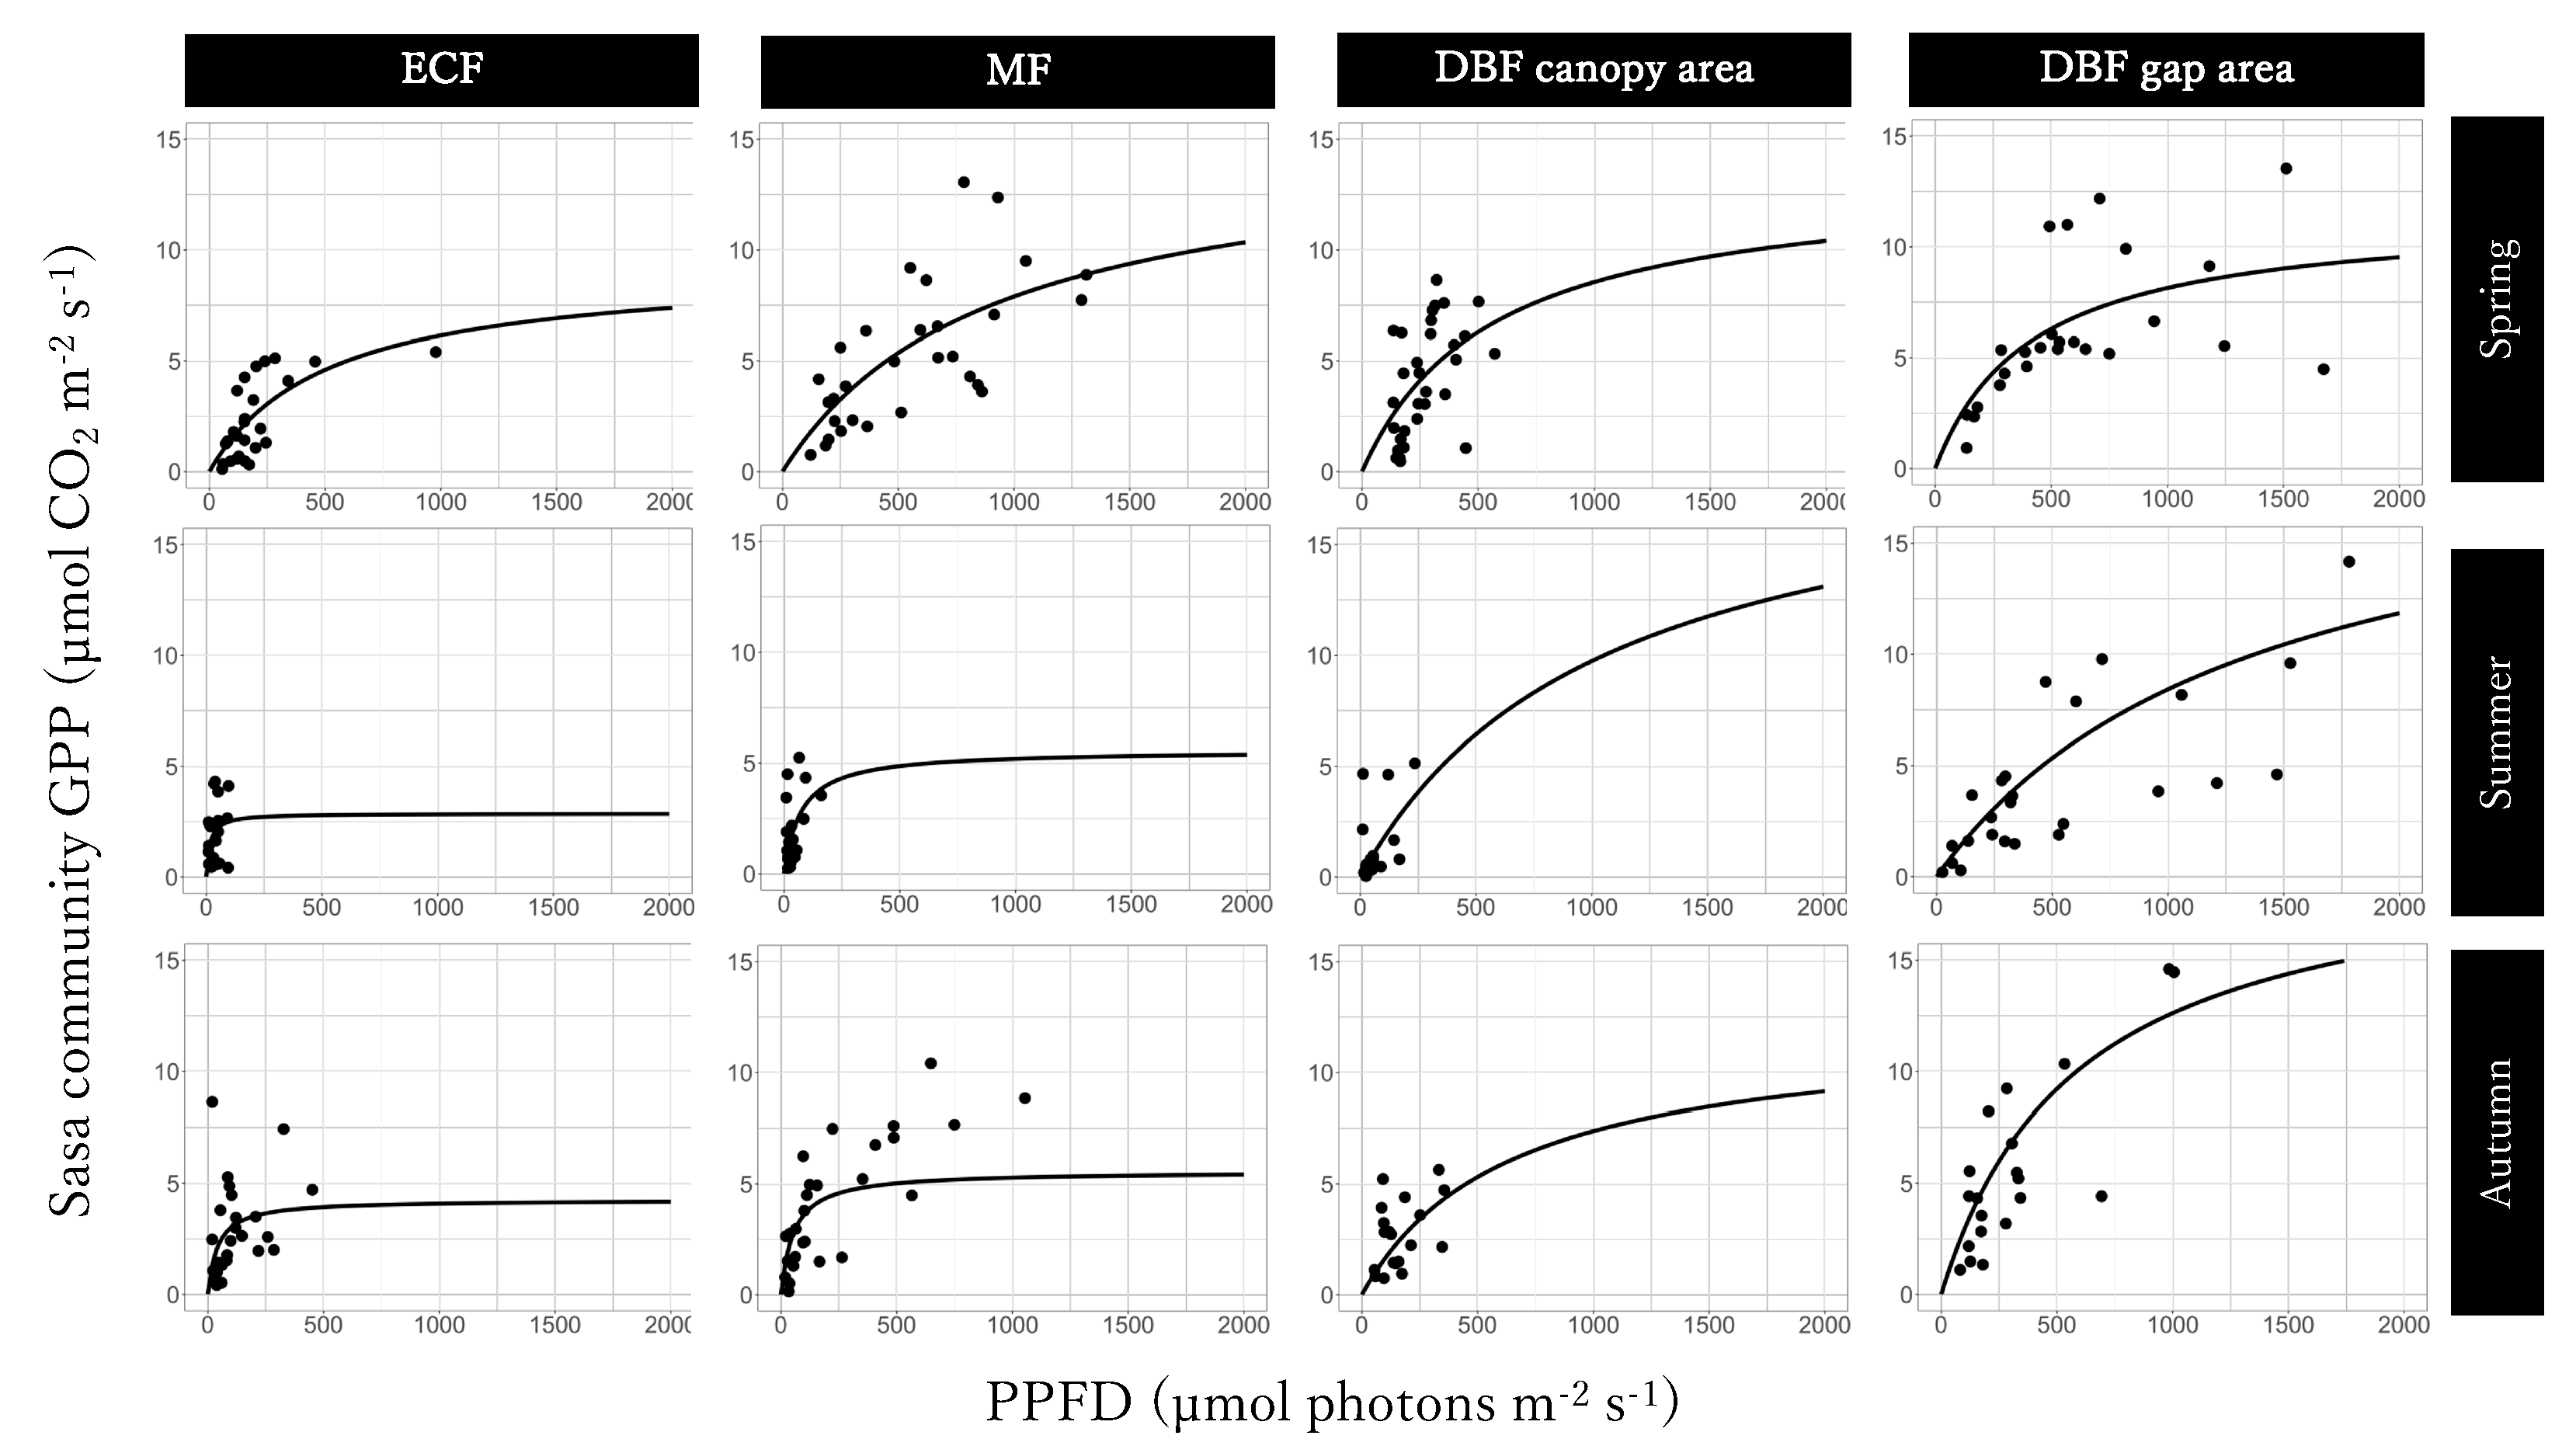
2.4. Sasa Senanensis GPP at the Community Scale and its Relationship with PPFD

The GPP of S. senanensis at the community scale (μmol CO2 m−2 s−1) was estimated as [12]:
GPPSasa-community = CO2Flight − CO2Fdark
To depict the relationship with PPFD, we drew GPP–light response curves as a rectangular hyperbola [12,24]:
GPPSasa-community = (α × PPFD × GPPmax)/(α × PPFD + GPPmax)
where α is the initial slope of the rectangular hyperbola (also called the apparent quantum yield of GPP), and GPPmax is the maximum GPP under light saturation. These parameters were calculated separately at each site in each season.
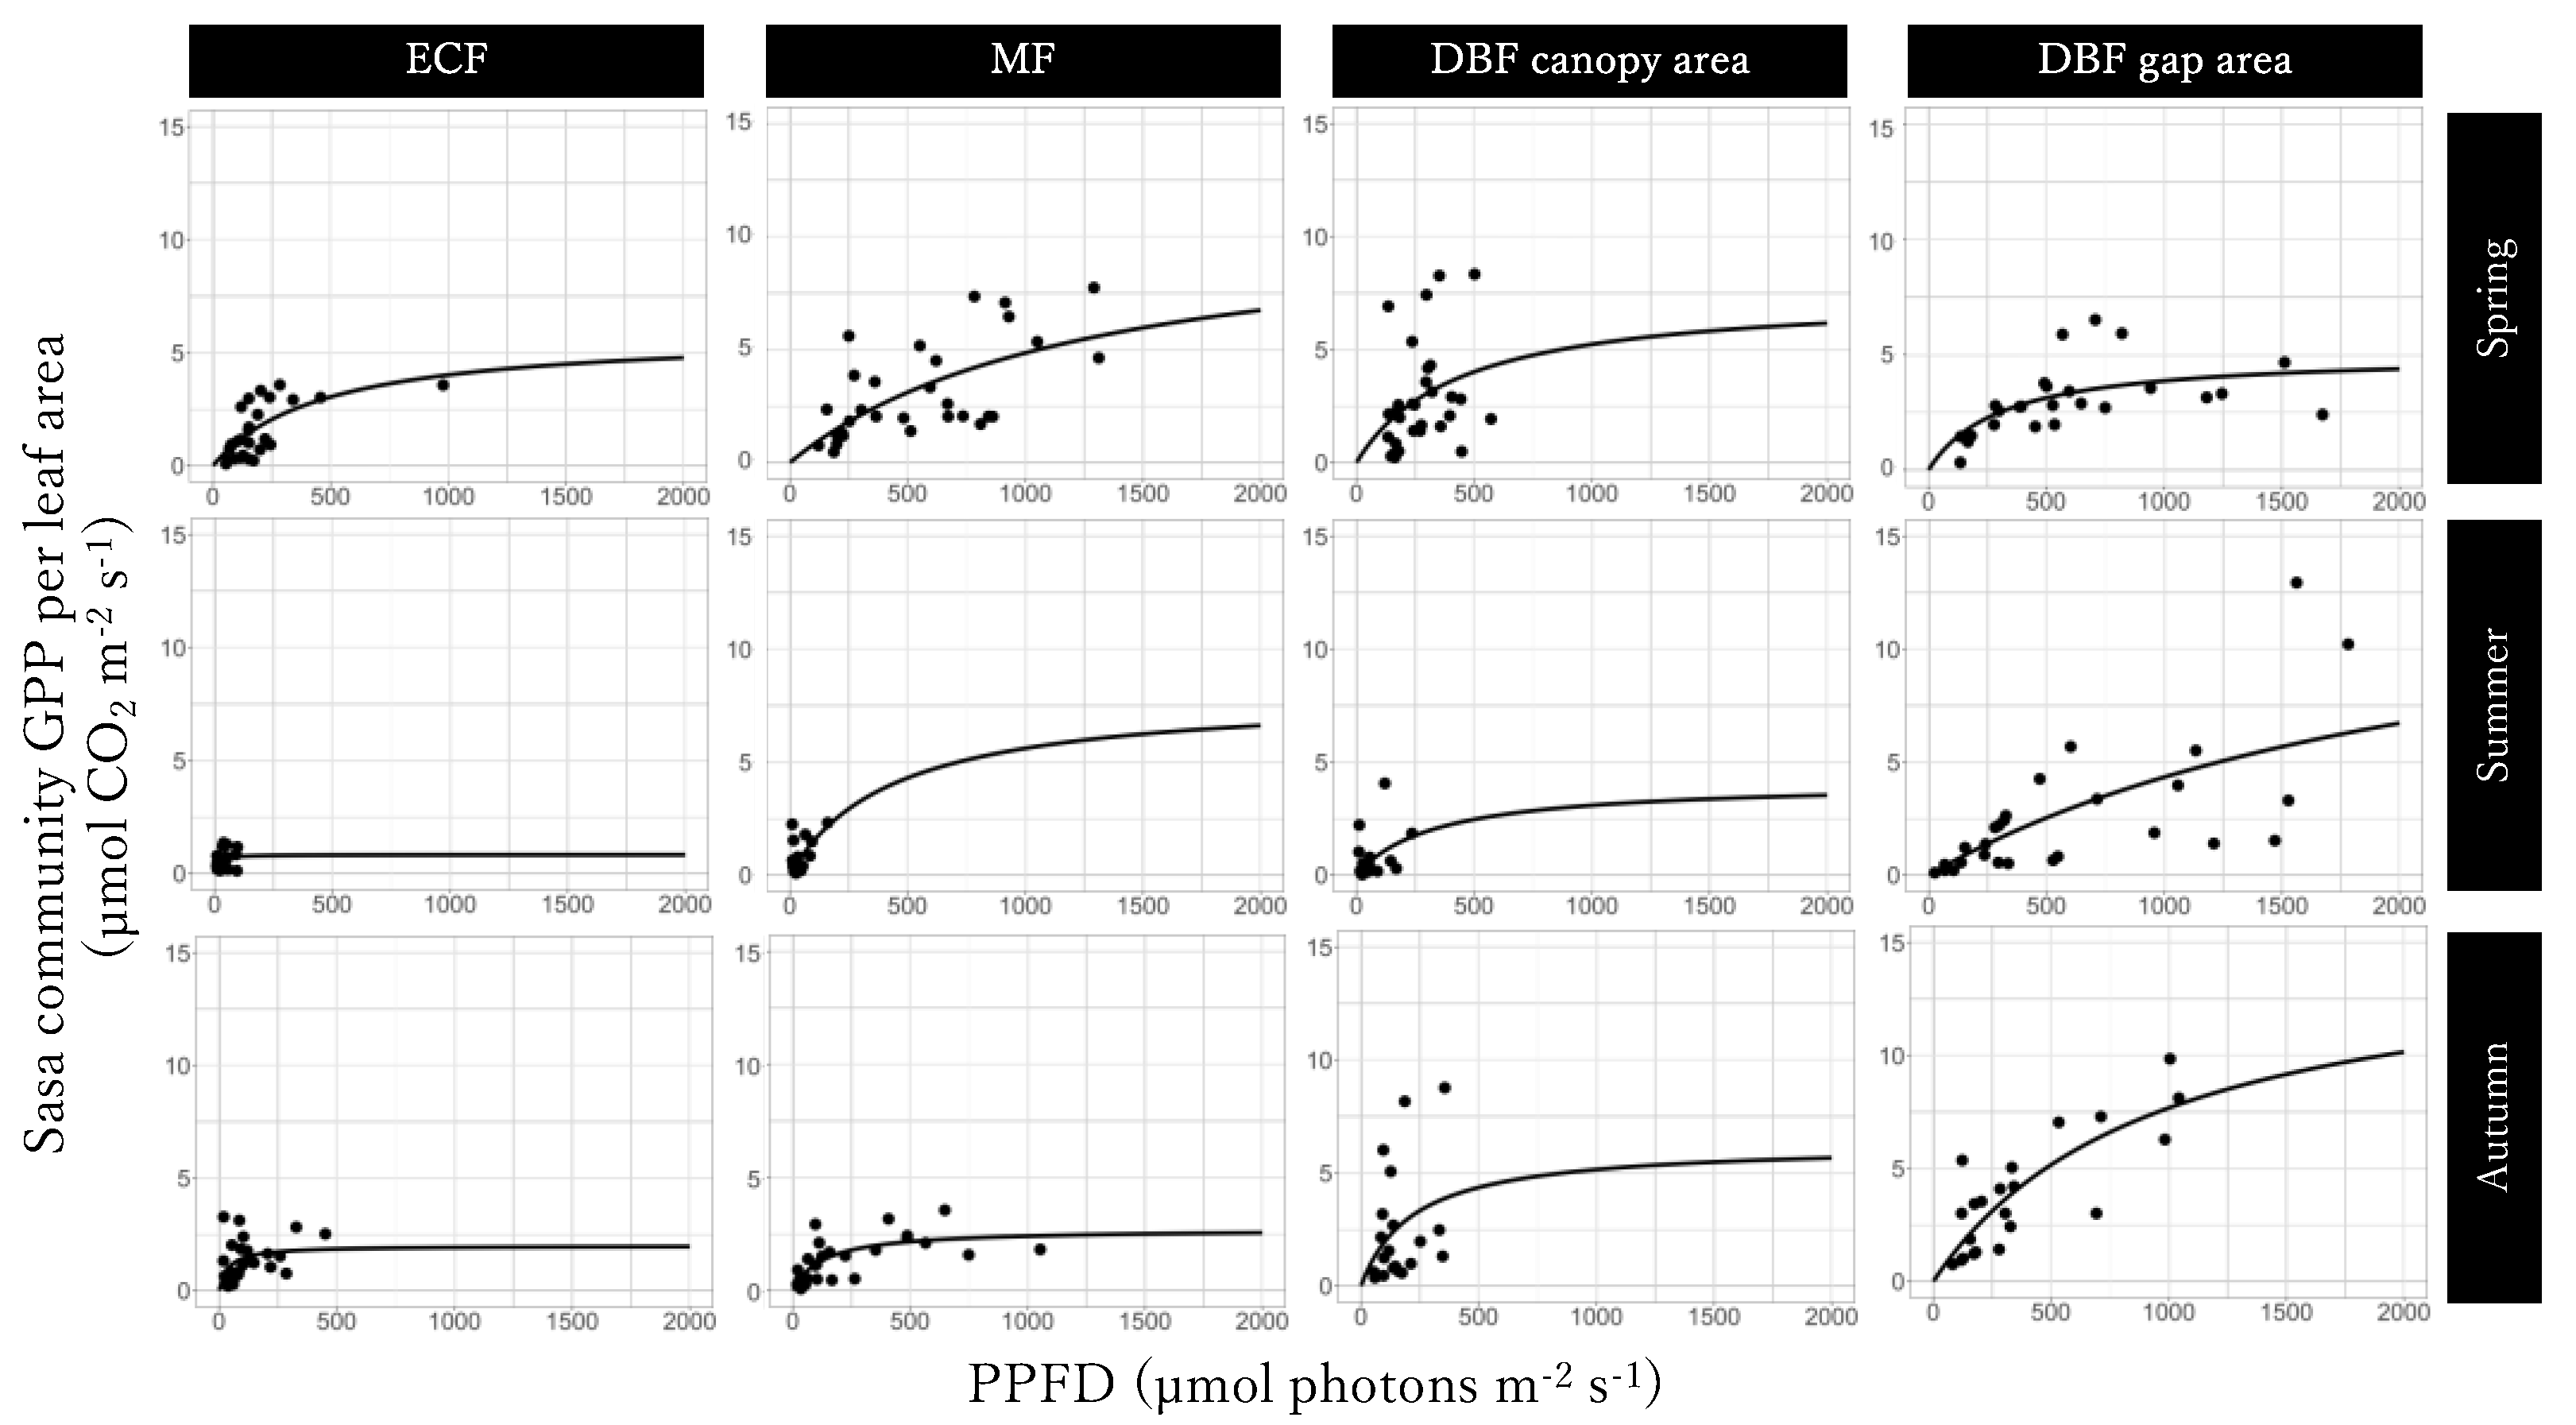
Furthermore, we calculated an index of photosynthetic ability of Sasa by dividing the obtained GPPSasa-community by the Sasa community leaf area (see Section 2.5 as follows).

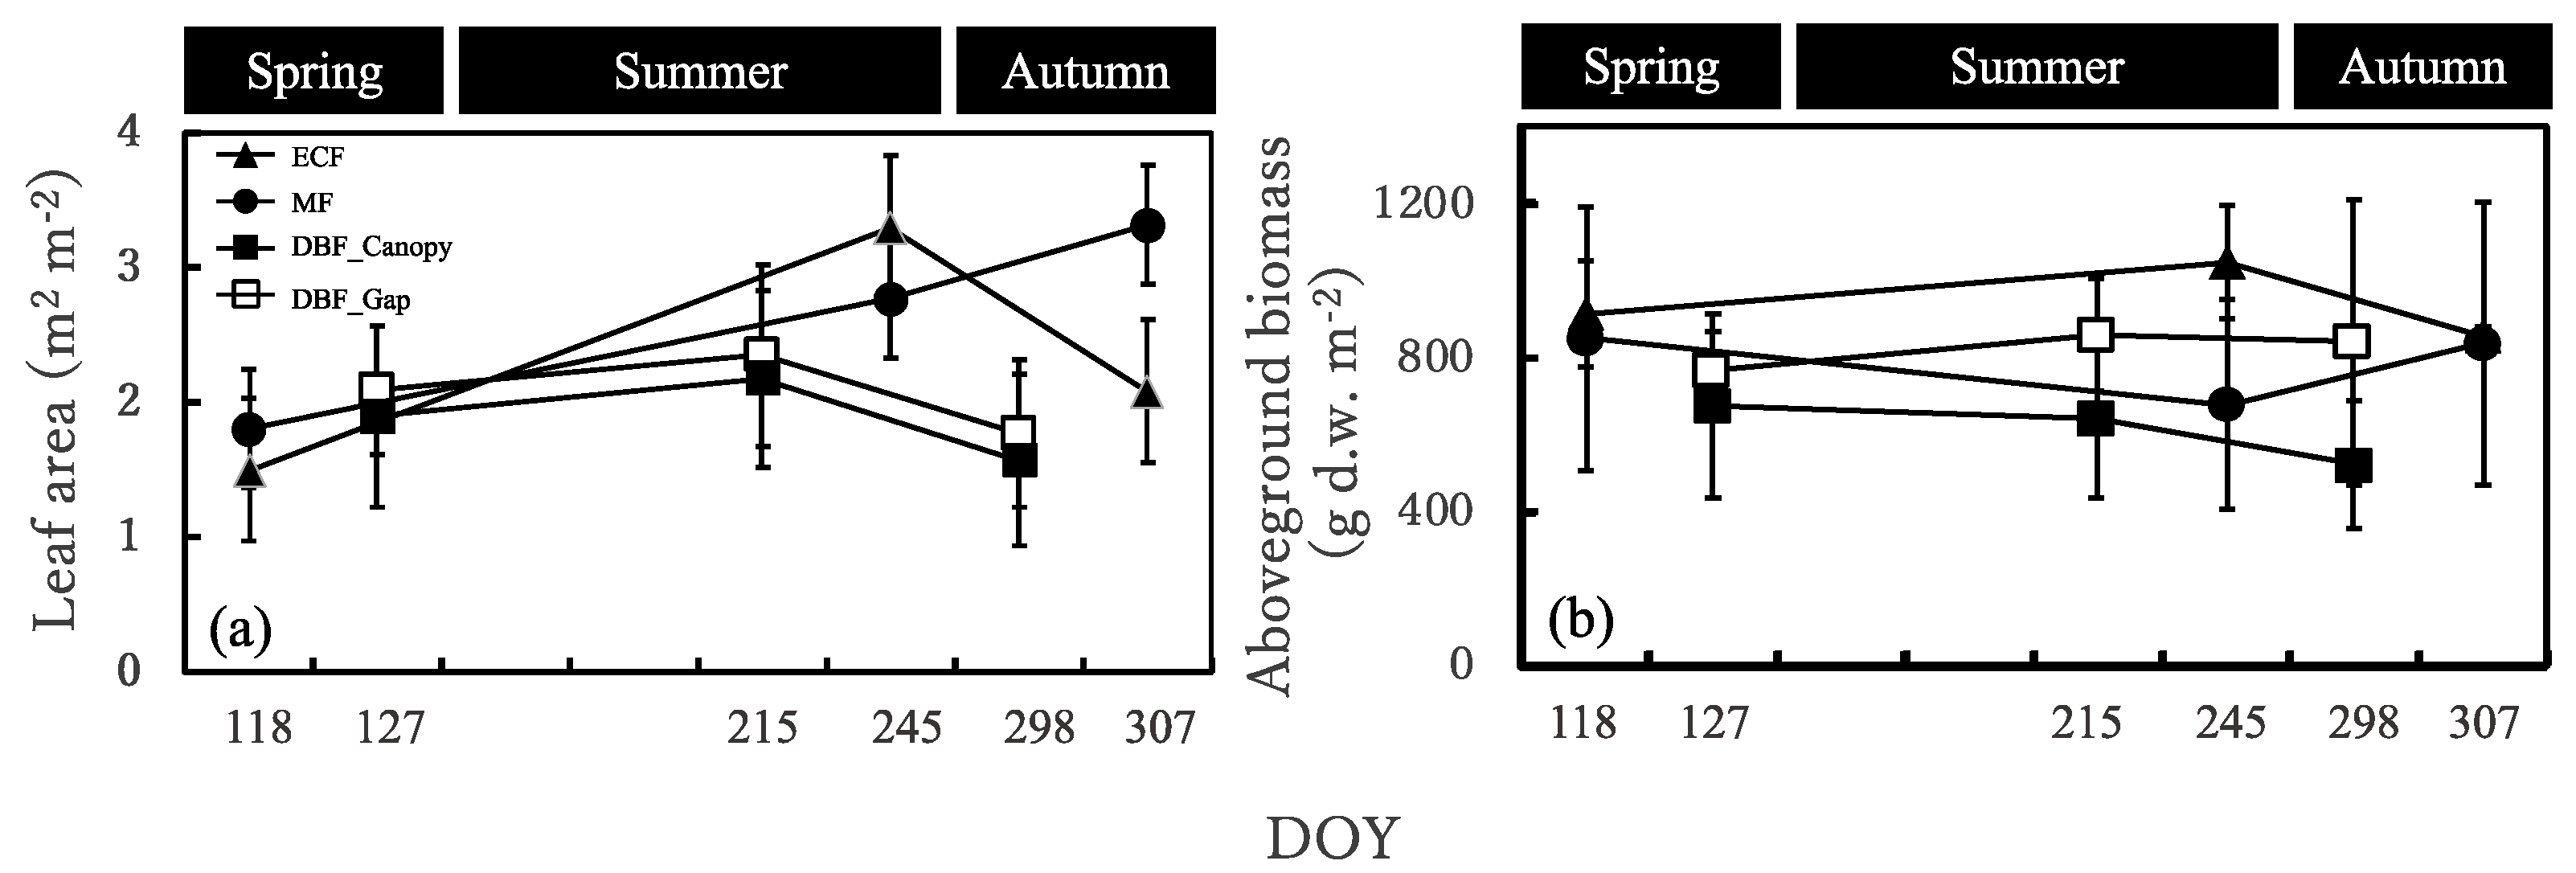
2.5. Biomass and Leaf Area of S. senanensis

Allometric equations relating the length of each culm to its dry weight, the number of leaves per shoot to their biomass, and the number of leaves per shoot to their leaf area were estimated at each site in each season. For this, at least 15 shoots were harvested each time. After we measured the shoot length, leaf number, and leaf area per shoot, we oven-dried the samples for 48 h at 75 °C and then weighed culms and leaves separately. The leaf areas were measured using a potable leaf area meter (LI-3000CAP, LI-COR, Lincoln, NE, USA). The allometric equations were all significant at the 0.01 level (data not shown). They were then used to non-destructively estimate the biomass and leaf area of the S. senanensis community within each chamber.

2.6. Sasa GPP at the Forest Ecosystem Scale and Its Contribution to Forest GPP

To scale the Sasa GPP from the community scale up to the forest ecosystem scale, we assumed that Sasa was distributed evenly in the evergreen coniferous forest and mixed forest after visually checking its distribution. In the deciduous broadleaved forest, we took the area proportions of the canopy area (64.2%) and gap area (35.8%) into consideration [12].
To estimate the contribution of Sasa GPP to the forest ecosystem GPP, we estimated the tree GPP in each forest using the same procedure as in our previous study [12]. First, we used the relationship between the net primary production (NPP) of trees and the GPP of trees [25,26]. Since we had access to an annual survey of DBH and litterfall in each forest, it was possible to calculate NPP as the sum of the increase of tree biomass and litterfall [27]. The biomass of trees, both above and below ground, was calculated with an allometric formula [28]. Second, we used the relationship between annual mean TA and GPP of trees [29,30].

2.7. Statistical Analysis

To elucidate the factors that control the seasonal dynamics of the Sasa community GPP, we conducted multiple linear regressions with daily cumulative Sasa community GPP as the response variable and PPFD, TA, RH, TS, SWC, and leaf area of the Sasa community GPP as the explanatory variables. All data were standardized, and variance inflation factors (VIFs) were calculated to detect collinearity among explanatory variables. We thereby excluded TS and SWC from the analysis of the evergreen coniferous forest, TA and TS from the analysis of mixed forest, canopy area from the analysis of the deciduous broadleaved forest, and TS and leaf area from the analysis of the deciduous broadleaved forest gap area (VIFs of other parameters <10). All analyses were performed in R (v. 4.0.3 software [31]).

3. Results

3.1. Seasonal Dynamics in Light Intensity and Other Environmental Factors

The seasonal trends of daily cumulative PPFD differed among the four sites (Figure 3). There was no notable seasonal dynamics in the evergreen coniferous forest. On the other hand, PPFD was highest in spring and then decreased in summer in the mixed forest and deciduous broadleaved forest, most sharply in the deciduous broadleaved forest canopy area. The cumulative PPFD during the whole growing period was 800.6 mol photons m−2 in the evergreen coniferous forest, 904.8 mol m−2 in the mixed forest, 819.3 mol m−2 in the deciduous broadleaved forest canopy area, and 1943.1 mol m−2 in the deciduous broadleaved forest gap area.
TA and TS had similar seasonal changes in the evergreen coniferous forest, mixed forest, and deciduous broadleaved forest, being highest in summer and low in both spring and autumn. SWC did not show any remarkable seasonal changes in the evergreen coniferous forest, mixed forest, or deciduous broadleaved forest. The average SWC during the growing period was 32.2 vol.% in the evergreen coniferous forest, 37.8 vol.% in the mixed forest, 52.1 vol.% in the deciduous broadleaved forest canopy area, and 86.9 vol.% in the deciduous broadleaved forest gap area.

3.2. Seasonal Dynamics in the Sasa Community Leaf Area and Aboveground Biomass

The leaf area was similar in the evergreen coniferous forest, mixed forest, and deciduous broadleaved forest in spring and was larger in the evergreen coniferous forest and mixed forest in summer and autumn (Figure 4a). It increased from spring to summer and then decreased in autumn in the evergreen coniferous forest and deciduous broadleaved forest, while it increased from spring till the end of the growing season in the mixed forest. The seasonal changes in leaf area were greater in the evergreen coniferous forest and mixed forest than in the deciduous broadleaved forest.
The aboveground biomass was the largest in the evergreen coniferous forest in spring and summer and in the evergreen coniferous forest and mixed forest in autumn and was the smallest in the deciduous broadleaved forest canopy area in spring, summer, and autumn (Figure 4b). It increased from spring to summer and decreased in autumn in the evergreen coniferous forest and deciduous broadleaved forest, but decreased from spring to summer and increased in autumn in the mixed forest.

3.3. Light-GPPSasa-community Curves

The GPPmax of Light-GPPSasa-community curves was the largest in the mixed forest in spring and in the gap area in the deciduous broadleaved forest in summer and autumn and the smallest in the gap area in the deciduous broadleaved forest in spring, in summer, and autumn (Figure 5; Table 1). The value of α of the Light-GPPSasa-community curves was larger for the deciduous broadleaved forest than for the evergreen coniferous forest and mixed forest in spring and was the largest for the evergreen coniferous forest and the smallest for the the gap area in the deciduous broadleaved forest in summer and autumn. Seasonal dynamics were also observed in both GPPmax and α of Light-GPPSasa-community curves in each site. GPPmax was the largest in spring in the evergreen coniferous forest, mixed forest, and in canopy area in the deciduous broadleaved forest and was the smallest in summer in the evergreen coniferous forest and mixed forest and in autumn in the canopy area in the deciduous broadleaved forest. On the other hand, GPPmax was the largest in both summer and autumn and was the smallest in spring in the gap area in the deciduous broadleaved forest.

3.4. Light-GPPSasa-community Curves per Leaf Area

The GPPSasa-community y per leaf area represents the photosynthesis ability of a Sasa community. The GPPmax of Light-GPPSasa-community curves per leaf area was the largest in the mixed forest in spring and in the gap area in the deciduous broadleaved forest in summer and autumn and was the smallest in the gap area in the deciduous broadleaved forest in spring and in the evergreen coniferous forest in summer and autumn (Figure 6; Table 2), similar to what we observed for the Light-GPPSasa-community curves. The value of α of the Light-GPPSasa-community curves per leaf area was the largest in the canopy area in the deciduous broadleaved forest in spring and in the evergreen coniferous forest in summer and autumn and was the smallest in the mixed forest in spring and in the gap area in the deciduous broadleaved forest in summer and autumn. Seasonal dynamics was also observed in the GPPmax and α of the Light-GPPSasa-community curves per leaf area, which were different from the Light-GPPSasa-community curves in some sites.

3.5. Seasonal Dynamics in the Sasa Community GPP and Its Controlling Factors

Seasonal dynamics varied widely in the mixed forest and deciduous broadleaved forest but not in the evergreen coniferous forest (Figure 7). In the mixed forest and deciduous broadleaved forest, the 10-day cumulative GPPSasa-community was largest in spring, decreased in summer, and then increased again in autumn (Figure 7b–d). This was similar to the 10-day cumulative PPFD (Figure 3). The last 10-day cumulative GPPSasa-community in the deciduous broadleaved forest was remarkably small because it only covered 2 days. The first 10-day cumulative GPPSasa-community was largest in the canopy area in the deciduous broadleaved forest. After that, the value was largest in the gap area in the deciduous broadleaved forest throughout the growing season.
PPFD positively controlled GPPSasa-community in all forests (p < 0.001; Table 3). Leaf area also had a positive effect in the evergreen coniferous forest and mixed forest (Table 3a,b, p < 0.001) but not in the deciduous broadleaved forest (Table 3c,d). TA had a positive effect in the mixed forest and a negative effect in the deciduous broadleaved forest gap area (Table 3b,d, p < 0.001). RH had a negative effect in the deciduous broadleaved forest canopy area (Table 3c, p < 0.01). Since the multiple linear regression analyzed standardized variables, PPFD clearly had the greatest control of GPPSasa-community in the evergreen coniferous forest, mixed forest, and deciduous broadleaved forest.

3.6. Annual Sasa GPP and Community GPP at the Forest Scale for Each Forest Type

The annual GPPSasa-community was similar for the evergreen coniferous forest, mixed forest, and canopy area in the deciduous broadleaved forest, but much greater in the gap area in the deciduous broadleaved forest (Table 4). The annual Sasa GPP at the forest scale was also similar for the evergreen coniferous forest, mixed forest, and canopy area in the deciduous broadleaved forest, but much greater in the gap area in the deciduous broadleaved forest (Table 5). However, when considering the ratio of canopy area and gap area in the deciduous broadleaved forest, the annual Sasa GPP was 2.1 t C ha−1 yr−1 in the deciduous broadleaved forest, which was similar to those of the other two forest types. The contribution of Sasa GPP to the forest ecosystem GPP ranged from 11.2% for the deciduous broadleaved forest to 19.1% for the mixed forest (Table 5). Since the annual Sasa GPP was almost the same for each forest type, the difference in the contributions was caused by the difference in the GPP of trees.

4. Discussion

4.1. Photosynthetic Ability of the Sasa Community

The GPPmax was the highest and α was the lowest in the gap area in the deciduous broadleaved forest compared to the other sites during summer and autumn (Figure 7; Table 1 and Table 2). Since the Sasa community received much more light in the gap area in the deciduous broadleaved forest, its photosynthetic rate would be most enhanced under saturated light there. The photosynthetic rate of leaves of Sinarundinaria nitida, another bamboo species, was 52% greater under saturated light at a site with strong light than at a site with weak light [32]. On the other hand, the GPPmax was the lowest and α was the highest in the evergreen coniferous forest compared to the other forest areas during summer and autumn (Table 1 and Table 2). Because the Sasa community in the evergreen coniferous forest received only very weak light, improving the efficiency of light absorbance would improve photosynthesis rate even under weak light condition. These results make it clear that Sasa in the gap area in the deciduous broadleaved forest may have sun leaves, whereas Sasa in the evergreen coniferous forest may have shade leaves. In addition, the Sasa leaves differed physiologically to a certain extent between the canopy and the gap areas in the deciduous broadleaved forest: the GPPmax was higher in the gap area, and α was higher in the canopy area throughout the growing period (Table 1 and Table 2), as reported previously [33]. These results indicate that Sasa can change the physiological properties of its leaves to adapt to different environments in different forest types and within the same forest according to its seasonal dynamics.

4.2. Seasonal Dynamics in Sasa Community GPP and Annual Sasa GPP

The seasonal trends differed between the evergreen coniferous forest and the other forests (Figure 7), partly consistent with our hypothesis. The 10-day cumulative Sasa community GPP in the evergreen coniferous forest did not fluctuate greatly, even though the 10-day cumulative PPFD decreased from spring to autumn. This can be explained by the higher light use efficiency in summer and autumn than in spring in the evergreen coniferous forest (Table 1 and Table 2). The 10-day cumulative Sasa community GPP was the lowest in summer in both deciduous broadleaved forest and mixed forest because of the low light intensity in both forests and the high TA in the gap area in the deciduous broadleaved forest. Moreover, since the solar elevation was lower in autumn, much more sun light was blocked by the branches and trunks of trees. This explains why the 10-day cumulative Sasa community GPP was higher in spring than in autumn.
The results that PPFD mostly influenced the Sasa community GPP in all sites, but different factors additionally influenced the Sasa community GPP at each site (Table 3) agree with our second hypothesis. Although Sasa in the gap area in the deciduous broadleaved forest received a relatively large amount of light, still less light reached the forest floor than the forest canopy [34,35]. This explains why PPFD was still the most important factor that controlled the Sasa community GPP in the gap area in the deciduous broadleaved forest. Plant photosynthetic rate decreases with increasing TA above a certain level [36]; that of Sasa decreases above a TA of 20–25 °C [37]. Direct light in gap areas can sharply increase TA there [38]. A TA of >30 °C during CO2 measurement within the chamber was recorded in the gap area in the deciduous broadleaved forest, and the Sasa community GPP was lower when TA was higher at the same PPFD. These facts could explain why the Sasa community GPP in the deciduous broadleaved forest gap area was reduced by TA (Table 3d). High RH restricts the transpiration of plant leaves and the CO2 absorption from the leaves. Since the deciduous broadleaved forest was located in Kayanodaira where fog tends to form easily and to dissolve hardly because of the landform, RH became one of the controlling factors of the Sasa community GPP in the canopy area. The leaf area strongly influences the GPP [5]. Although it affected the Sasa community GPP in the evergreen coniferous forest and mixed forest, it did not do so in the deciduous broadleaved forest (Table 3) on account of the small fluctuations of the Sasa community leaf area there (Figure 4a). In this manner, the Sasa community GPP was influenced by various controlling factors brought by the inherent understory environment. Therefore, one more aspect needs to be considered, i.e., that those biotic and abiotic factors controlling Sasa community GPP may not only be influenced by the canopy structure but also be influenced by the stand structure, especially stand density or forest management.
The annual Sasa GPP was similar among the three forests (Table 5), contrary to our third hypothesis. Although the photosynthetic ability of the Sasa community and cumulative PPFD during the growing period were higher in the deciduous broadleaved forest, especially in the gap area, than in the evergreen coniferous forest and mixed forest, the growing period for the evergreen coniferous forest and mixed forest was over a month longer than that for the deciduous broadleaved forest, and the leaf area was larger in the evergreen coniferous forest and mixed forest too (Figure 4a). These results indicate that the forest canopy structure can indirectly influence the seasonal dynamics of the Sasa community GPP and its controlling factors through both biotic and abiotic factors, but for the annual Sasa GPP, the length of the growing periods may be more influential.

4.3. Annual Changes in Sasa GPP

We compared our estimate of the annual Sasa GPP in our previous study [12] with that obtained here for the same beech forest to determine the annual change. The annual Sasa GPP in the whole forest was much smaller in this study than in the previous one (Table 6). The annual Sasa GPP in the gap area decreased greatly here, but there was no difference in canopy area (Table 6). The large difference in annual Sasa GPP in the gap area could be due to the decrease in Sasa leaf biomass from 286 g DW m−2 to 154 g DW m−2, a decrease of almost a half. The cumulative PPFD during the growing period was also notably higher in the previous study (2309 mol photons m−2 yr−1) than in the present one (1943 mol photons m−2 yr−1). Regardless of the higher cumulative PPFD during the growing period in this study (819 mol photons m−2 yr−1) than in previous study (432 mol photons m−2 yr−1) in the canopy area, no difference was observed in the annual Sasa GPP (Table 6). One possible reason to explain this result is the decrease in Sasa leaf biomass from 152 g DW m−2 to 128 g DW m−2. A high amount of rainfall during the growing periods in this study compared to the usual yearly amount was another reason, because high RH could restrict the Sasa GPP in the canopy area in the deciduous broadleaved forest (Table 3).

5. Conclusions

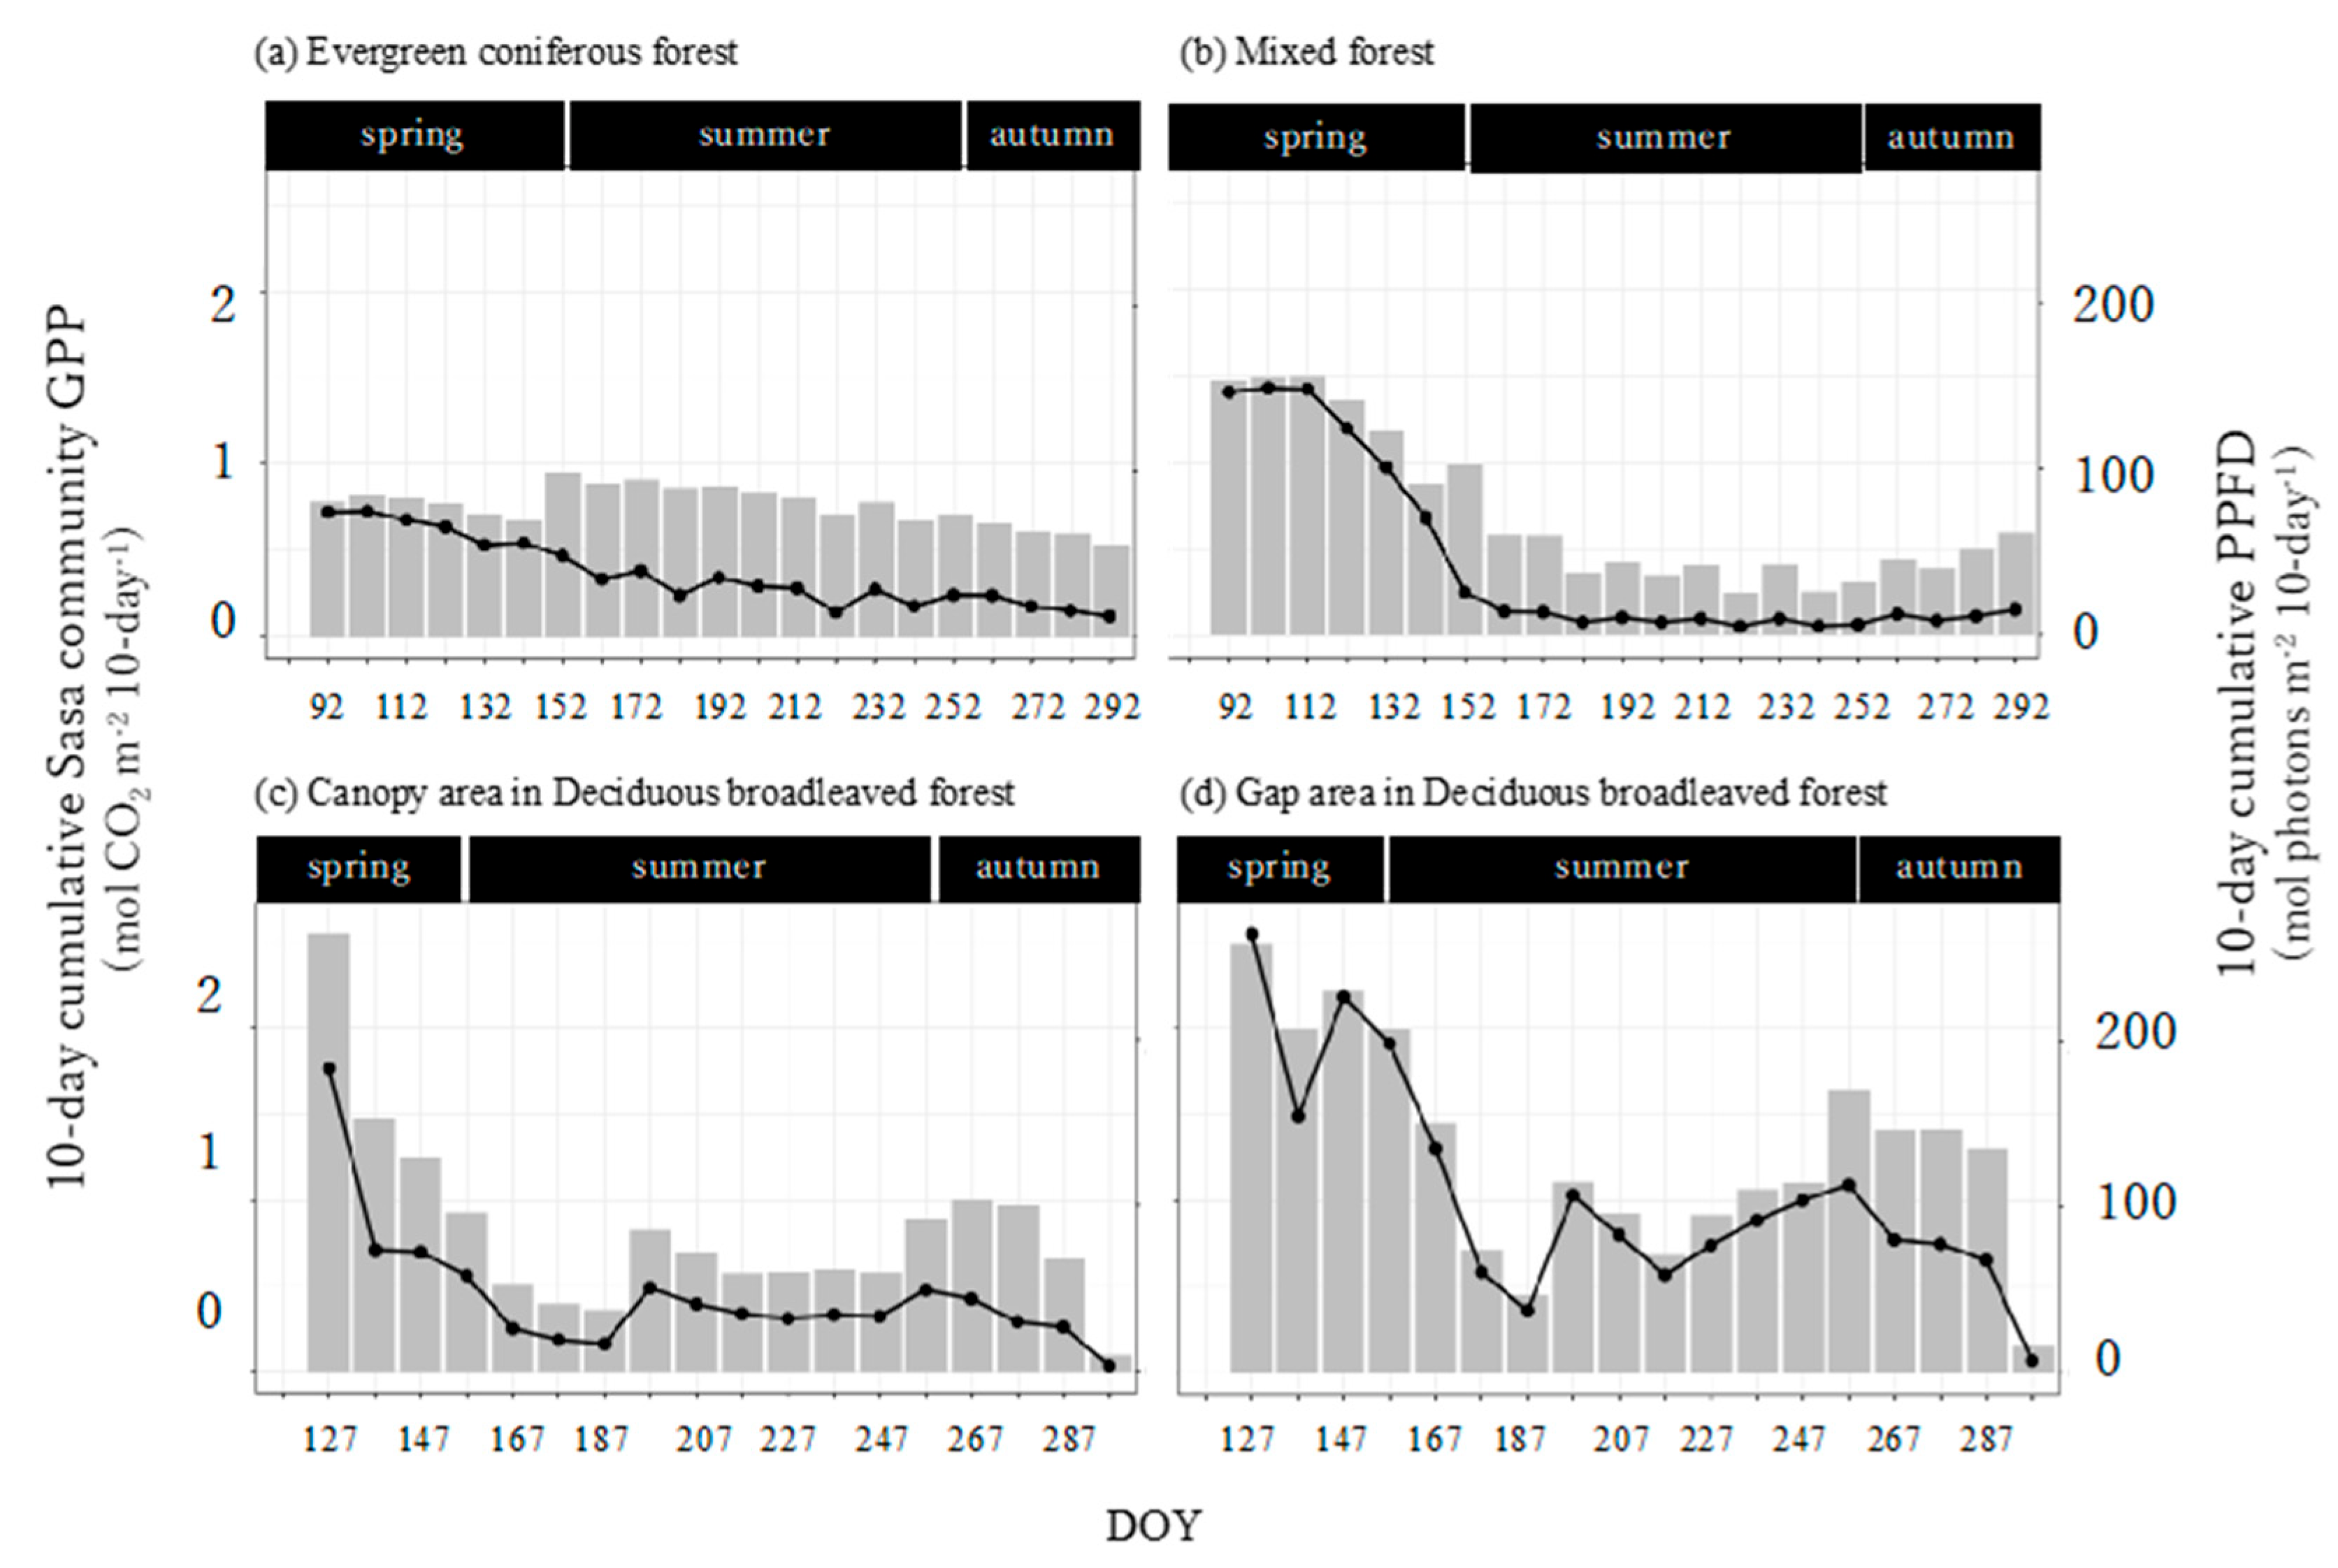
The seasonal trends of the Sasa community GPP and its controlling factors were different in the evergreen coniferous forest, mixed forest, and canopy and gap areas of the deciduous broadleaved forest. Further research is necessary, also taking into consideration stand structure and forest management, in addition to canopy structure.
The annual Sasa GPP was almost similar for evergreen coniferous forest, mixed forest, and deciduous broadleaved forest, which was different from what we expected. It also turned out that the annual Sasa GPP would be influenced not only by the understory environment or the photosynthesis ability of the Sasa community, but also by the length of the growing periods. Since Sasa dominates the understory of many secondary forests in Japan and could contribute greatly to the GPP, further research on annual changes in Sasa GPP is necessary.

Author Contributions

Conceptualization, Y.C. and M.H.; methodology, Y.C. and M.H.; software, Y.C.; validation, Y.C. and M.H.; formal analysis, Y.C.; investigation, Y.C., R.K., T.U., H.S., Y.H., R.S., M.Y., and M.H.; resources, H.I.; data curation, Y.C.; writing—original draft preparation, Y.C.; writing—review and editing, H.I. and M.H.; visualization, Y.C. and M.H.; supervision, M.H.; project administration, M.H.; funding acquisition, Y.C. All authors have read and agreed to the published version of the manuscript.

Funding

This work was supported by a Sasakawa Scientific Research Grant (Grant No. 2021–5002) from the Japan Science Society and by a Kakenhi (Grant No. 19H02999) from JSTS.

Data Availability Statement

Not applicable.

Acknowledgments

This study was also partly supported by a master’s degree program of the Department of Mountain Studies, University of Tsukuba, the Japanese Ministry of the Environment’s Monitoring Sites 1000 Project.

Conflicts of Interest

The authors declare no conflict of interest.

References

  1. Chokkalingam, U.; De Jong, W. Secondary forests: A working definition and typology. Int. For. Rev. 2001, 3, 19–26. [Google Scholar]
  2. Sugiura, K.; Sonohara, W. Application of an Adaptive Forest Management Simulation Model Based on Zoning in a Man-Made Forest. Forests 2019, 10, 482. [Google Scholar] [CrossRef] [Green Version]
  3. Luyssaert, S.; Schulze, E.-D.; Börner, A.; Knohl, A.; Hessenmöller, D.; Law, B.; Ciais, P.; Grace, J. Old-growth forests as global carbon sinks. Nature 2008, 455, 213–215. [Google Scholar] [CrossRef] [PubMed]
  4. IPCC. Climate Change 2013: The Physical Science Basis; Contribution of Working Group I to the Fifth Assessment Report of the Intergovernmental Panel on Climate Change; Cambridge University Press: Cambridge, UK, 2013. [Google Scholar]
  5. Chapin, F.S.; Matson, P.A.; Mooney, H.A. Principles of Terrestrial Ecosystem Ecology, 2nd ed.; Springer: New York, NY, USA, 2011. [Google Scholar]
  6. Desai, A.R.; Richardson, A.D.; Moffat, A.M.; Kattge, J.; Hollinger, D.Y.; Barr, A.; Falge, E.; Noormets, A.; Papale, D.; Reichstein, M.; et al. Cross-site evaluation of eddy covariance GPP and RE decomposition techniques. Agric. For. Meteorol. 2008, 148, 821–838. [Google Scholar] [CrossRef]
  7. Mäkelä, A.; Kolari, P.; Karimäki, J.; Nikinmaa, E.; Perämäki, M.; Hari, P. Modelling five years of weather-driven variation of GPP in a boreal forest. Agric. For. Meteorol. 2006, 139, 382–398. [Google Scholar] [CrossRef]
  8. Croft, H.; Chen, J.M.; Froelich, N.J.; Chen, B.; Staebler, R.M. Seasonal controls of canopy chlorophyll content on forest carbon uptake: Implications for GPP modeling. J. Geophys. Res. Biogeosci. 2015, 120, 1576–1586. [Google Scholar] [CrossRef] [Green Version]
  9. Misson, L.; Baldocchi, D.; Black, T.; Blanken, P.; Brunet, Y.; Yuste, J.C.; Dorsey, J.; Falk, M.; Granier, A.; Irvine, M.; et al. Partitioning forest carbon fluxes with overstory and understory eddy-covariance measurements: A synthesis based on FLUXNET data. Agric. For. Meteorol. 2007, 144, 14–31. [Google Scholar] [CrossRef] [Green Version]
  10. Kolari, P.; Pumpanen, J.; Kulmala, L.; Ilvesniemi, H.; Nikinmaa, E.; Grönholm, T.; Hari, P. Forest floor vegetation plays an important role in photosynthetic production of boreal forests. For. Ecol. Manag. 2006, 221, 241–248. [Google Scholar] [CrossRef]
  11. Sakai, T.; Akiyama, T.; Saigusa, N.; Yamamoto, S.; Yasuoka, Y. The contribution of gross primary production of understory dwarf bamboo, Sasa senanensis, in a cool-temperate deciduous broadleaved forest in central Japan. For. Ecol. Manag. 2006, 236, 259–267. [Google Scholar] [CrossRef]
  12. Cai, Y.; Tanioka, Y.; Kitawaga, T.; Ida, H.; Hirota, M. Gross primary production of dwarf bamboo, Sasa senanensis, in a mature beech forest with a substantial gap-mosaic structure. J. Plant Res. 2021, 134, 209–221. [Google Scholar] [CrossRef]
  13. Baldocchi, D.D.; Law, B.E.; Anthoni, P.M. On measuring and modeling energy fluxes above the floor of a homogeneous and heterogeneous conifer forest. Agric. For. Meteorol. 2000, 102, 187–206. [Google Scholar] [CrossRef]
  14. Launiainen, S.; Rinne, J.; Pumpanen, J.; Kulmala, L.; Kolari, P.; Keronen, P.; Siivola, E.; Pohja, T.; Hari, P.; Vesala, T. Eddy covariance measurements of CO2 and sensible and latent heat fluxes during a full year in a boreal pine forest trunk-space. Boreal Environ. Res. 2005, 10, 569–588. [Google Scholar]
  15. Oshima, Y. Ecological Studies of Sasa Communities I. Productive structure of some of the Sasa communities in Japan. Bot. Mag. Tokyo 1961, 74, 199–210. [Google Scholar] [CrossRef] [Green Version]
  16. Narukawa, Y.; Yamamoto, S. Effects of dwarf bamboo (Sasa sp.) and forest floor microsites on conifer seedling recruitment in a subalpine forest, Japan. For. Ecol. Manag. 2002, 163, 61–70. [Google Scholar] [CrossRef]
  17. Doležal, J.; Matsuki, S.; Hara, T. Effects of dwarf-bamboo understory on tree seedling emergence and survival in a mixed-oak forest in northern Japan: A multi-site experimental study. Community Ecol. 2009, 10, 225–235. [Google Scholar] [CrossRef]
  18. Abe, M.; Izaki, J.; Miguchi, H.; Masaki, T.; Makita, A.; Nakashizuka, T. The effects of Sasa and canopy gap formation on tree regeneration in an old beech forest. J. Veg. Sci. 2002, 13, 565–574. [Google Scholar] [CrossRef]
  19. Cho, S.; Lee, K.; Choung, Y. Distribution, abundance, and effect on plant species diversity of Sasa borealis in Korean forests. J. Ecol. Environ. 2018, 42, 9. [Google Scholar] [CrossRef] [Green Version]
  20. Tsuyama, I.; Matsui, T.; Horikawa, M.; Kominami, Y.; Tanaka, N. Habitat prediction and impact assessment of climate change on dwarf bamboo of the Section Sasa in Japan. Theory Appl. GIS 2008, 16, 99–113. [Google Scholar] [CrossRef] [Green Version]
  21. Suyama, Y.; Obayashi, K.; Hayashi, I. Clonal structure in a dwarf bamboo (Sasa senanensis) population inferred from amplified fragment length polymorphism (AFLP) fingerprints. Mol. Ecol. 2000, 9, 901–906. [Google Scholar] [CrossRef]
  22. Ida, H. Forest structure in a beech (Fagus crenata Blume) stand on a 1-ha permanent plot for the Monitoring Sites 1000 Project in Kayanodaira, central Japanese snowbelt. Bull. Inst. Nat. Educ. Shiga Height. Shinshu Univ. 2013, 50, 33–40. [Google Scholar]
  23. Ishihara, M.; Center, Y.F.E.C.; Suzuki, S.; Nakamura, M.; Enoki, T.; Fujiwara, A.; Hiura, T.; Homma, K.; Hoshino, D.; Hoshizaki, K.; et al. Forest stand structure, composition, and dynamics in 34 sites over Japan. Ecol. Res. 2011, 26, 1007–1008. [Google Scholar] [CrossRef]
  24. Thornley, M.N.; Johnson, I.R. Plant and Crop Modeling: A Mathematical Approach to Plant and Crop Physiology; Clarendon Press: Oxford, UK, 1990. [Google Scholar]
  25. Waring, R.H.; Landsberg, J.J.; Williams, M. Net primary production of forests: A constant fraction of gross primary production? Tree Physiol. 1998, 18, 129–134. [Google Scholar] [CrossRef]
  26. DeLucia, E.H.; Drake, J.; Thomas, R.B.; Gonzalez-Meler, M. Forest carbon use efficiency: Is respiration a constant fraction of gross primary production? Glob. Chang. Biol. 2007, 13, 1157–1167. [Google Scholar] [CrossRef] [Green Version]
  27. Otsuka, T. Carbon cycling at Takayama Forest: Results from intensive studies in the last decade, and further studies for a next decade. Jpn. J. Ecol. 2012, 62, 31–44. [Google Scholar]
  28. Komiyama, A.; Nakagawa, M.; Kato, S. The Static Model of Plant Form, the Pipe Model. Ter. Mikaelian Korzukhin 2011, 31, 220225. [Google Scholar]
  29. Kato, T.; Tang, Y. Spatial variability and major controlling factors of CO2 sink strength in Asian terrestrial ecosystems: Evidence from eddy covariance data. Glob. Chang. Biol. 2008, 14, 2333–2348. [Google Scholar] [CrossRef]
  30. Saigusa, N.; Li, S.-G.; Kwon, H.; Takagi, K.; Zhang, L.-M.; Ide, R.; Ueyama, M.; Asanuma, J.; Choi, Y.-J.; Chun, J.H.; et al. Dataset of CarboEastAsia and uncertainties in the CO2 budget evaluation caused by different data processing. J. For. Res. 2013, 18, 41–48. [Google Scholar] [CrossRef]
  31. R Development Core Team. R: A Language and Environment for Statistical Computing; R Foundation for Statistical Computing: Vienna, Austria, 2021. [Google Scholar]
  32. Yang, S.-J.; Sun, M.; Zhang, Y.-J.; Cochard, H.; Cao, K.-F. Strong leaf morphological, anatomical, and physiological responses of a subtropical woody bamboo (Sinarundinaria nitida) to contrasting light environments. Plant Ecol. 2014, 215, 97–109. [Google Scholar] [CrossRef]
  33. Tsunoda, Y.; Furukawa, S.; Mizunaga, H. How does the longevity of Sasa kurilensis ramets respond to a light gradient? An analysis of ontogenetic changes to hydraulic resistance and carbon budget within a ramet. Ecol. Res. 2017, 32, 117–128. [Google Scholar] [CrossRef]
  34. Messier, C.; Parent, S.; Bergeron, Y. Effects of overstory and understory vegetation on the understory light environment in mixed boreal forests. J. Veg. Sci. 1998, 9, 511–520. [Google Scholar] [CrossRef]
  35. Vierling, L.A.; Wessman, C.A. Photosynthetically active radiation heterogeneity within a monodominant Congolese rain forest canopy. Agric. For. Meteorol. 2000, 103, 265–278. [Google Scholar] [CrossRef]
  36. Yamori, W.; Hikosaka, K.; Way, D. Temperature response of photosynthesis in C3, C4, and CAM plants: Temperature acclimation and temperature adaptation. Photosynth. Res. 2014, 119, 101–117. [Google Scholar] [CrossRef] [PubMed]
  37. Kudo, G.; Aoshima, Y.; Miyata, R.; Winkler, D.E. Altered morphologies and physiological compensation in a rapidly expanding dwarf bamboo in alpine ecosystems. Arctic Antarct. Alp. Res. 2018, 50, e1463733. [Google Scholar] [CrossRef] [Green Version]
  38. Muscolo, A.; Bagnato, S.; Sidari, M.; Mercurio, R. A review of the roles of forest canopy gaps. J. For. Res. 2014, 25, 725–736. [Google Scholar] [CrossRef]
Figure 1. Location of the study sites. ★: Kayanodaira; ●: Sugadaira Montane Research Center (SMRC).
Forests 13 00564 g001
Figure 2. Measurement of the Sasa community GPP under (A) 100% light and (B) 0% light. (C) Schematic illustration of the static chamber system: (a) sensor for CO2 concentration, temperature, and relative humidity with data logger, (b) mini-fan, and (c) quantum sensor.
Forests 13 00564 g002
Figure 3. Daily cumulative photosynthetic photon flux density (PPFD) in the four sites during the growing period. DOY, day of year.
Forests 13 00564 g003
Figure 4. (a) Leaf area and (b) aboveground biomass of the Sasa community in the four sites. DOY, day of year. ECF, MF, DBF_Canopy and DBF_Gap in the graph indicate evergreen coniferous forest, mixed forest, and canopy area in the broadleaved deciduous forest and gap area in the deciduous broadleaved forest, respectively.
Forests 13 00564 g004
Figure 5. Light-Sasa community GPP curve in the evergreen coniferous forest (ECF), mixed forest (MF), deciduous broadleaved forest (DBF) canopy area, and DBF gap area in each season.
Forests 13 00564 g005
Figure 6. Light-Sasa community GPP per leaf area in the evergreen coniferous forest (ECF), mixed forest (MF), DBF canopy area, and deciduous broadleaved forest (DBF) gap area in each season.
Forests 13 00564 g006
Figure 7. Seasonal trends of the 10-day cumulative Sasa community GPP (bars) and photosynthetic photon flux density (PPFD, lines) in the four sites. The 10-day cumulative Sasa community GPP and PPFD indicate integrated values of 10-day Sasa community GPP and PPFD.
Forests 13 00564 g007
Table 1. Parameters of the light-Sasa community GPP curve in the four sites.
(a) Evergreen coniferous e forest
seasonGPPmaxPαPResidual SE
µmol m−2 s−1 µmol m−2 s−1
spring9.26*0.018***1.26
summer2.87*0.20 1.36
autumn4.25**0.10 2.06
(b) Mixed forest
seasonGPPmaxPαPResidual SE
µmol m−2 s−1 µmol m−2 s−1
spring15.57*0.016**2.35
summer5.57 0.077 1.44
autumn9.93***0.048***1.67
(c) Canopy area in Deciduous broadleaved forest
seasonGPPmaxPαPResidual SE
µmol m−2 s−1 µmol m−2 s−1
spring13.31*0.024*2.16
summer8.00 0.023 1.33
autumn4.90*0.041 1.45
(d) Gap area in Deciduous broadleaved forest
seasonGPPmaxPαPResidual SE
µmol m−2 s−1 µmol m−2 s−1
spring11.50***0.028*2.50
summer20.00*0.015*3.27
autumn20.00**0.034**3.12
GPPmax, Sasa community GPP under light-saturated conditions; α, initial slope; SE, standard error; p, p value (* p < 0.05, ** p < 0.01, *** p < 0.001).
Table 2. Parameters of light–Sasa community GPP per leaf area curve in the four sites.
(a) Evergreen coniferous forest
seasonGPPmaxPαPResidual SE
µmol m−2 s−1 µmol m−2 s−1
spring5.90*0.013***1.26
summer0.80 0.071*1.36
autumn1.99***0.051 2.06
(b) Mixed forest
seasonGPPmaxPαPResidual SE
µmol m−2 s−1 µmol m−2 s−1
spring11.06 0.0086*2.35
summer8.07 0.018*1.44
autumn2.72***0.021*1.67
(c) Canopy area in Deciduous broadleaved forest
seasonGPPmaxPαPResidual SE
µmol m−2 s−1 µmol m−2 s−1
spring7.51 0.017 2.16
summer4.13 0.012 1.33
autumn6.30 0.028 1.45
(d) Gap area in Deciduous broadleaved forest
seasonGPPmaxPαPResidual SE
µmol m−2 s−1 µmol m−2 s−1
spring5.06***0.016*2.50
summer20.00 0.0055*3.27
autumn15.36*0.016***3.12
GPPmax, Sasa community GPP under light-saturated conditions; α, initial slope; SE, standard error; p, p value (* p < 0.05, *** p < 0.001).
Table 3. Results of multiple regression analysis to elucidate factors that control the seasonal trends of the Sasa community GPP in the four sites.
(a) Evergreen coniferous forest
Estimate p Value
intercept−0.49 <0.001
PPFD1.15 <0.001
SWC0.077 0.38
Leaf area0.56 <0.001
TA−0.11 0.090
RH0.048 0.55
Adjusted R20.85p value<0.001
(b) Mixed forest
Estimate p Value
intercept−0.75 <0.001
PPFD1.31 <0.001
Leaf area 0.56 <0.001
TA0.34 <0.001
RH−0.071 0.32
Adjusted R20.75p value<0.001
(c) Canopy area in Deciduous broadleaved forest
Estimate p Value
intercept0.18 <0.01
PPFD0.92 <0.001
Leaf area−0.056 0.097
TA−0.081 0.14
RH−0.47 <0.01
Adjusted R20.75 p value<0.001
(d) Gap area in Deciduous broadleaved forest
Estimate p Value
intercept0.023 <0.01
PPFD0.96 <0.001
Leaf area−0.048 0.11
TA−0.21 <0.001
RH−0.058 0.095
Adjusted R20.92p value<0.001
PPFD, photosynthetic photon flux density; SWC, soil water content; TA, air temperature; RH, relative humidity. R2 was adjusted by the degrees of freedom.
Table 4. Annual Sasa community GPP per leaf area and Sasa community GPP in the four sites.
Sasa Community GPP per LeafSasa Community GPP
g C m−2 yr−1g C m−2 yr−1
Evergreen coniferous forest83.2 190.8
Mixed forest 80.7176.8
Canopy area in Deciduous broadleaved forest93.2178.6
Gap area in Deciduous broadleaved forest130.8276.7
Table 5. Annual Sasa GPP and tree GPP at the forest ecosystem scale in the four sites and contribution of the Sasa GPP to the forest ecosystem GPP.
Annual Sasa GPPTree GPPContribution
t C ha−1 yr−1t C ha−1 yr−1%
Evergreen coniferous forest1.9 11.2 ± 1.3 13.1 ± 1.3
Mixed forest1.88.4 ± 4.0 19.1 ± 6.9
Deciduous broadleaved forest2.116.8 ± 1.7 11.2 ± 0.9
Canopy area1.8--
Gap area2.8--
Table 6. Annual change of the annual Sasa GPP in the deciduous broadleaved forest and in the canopy and gap areas in that forest.
Annual Sasa GPPCumulative PPFDLeaf Biomass
t C ha−1 yr−1mol photons m−2 yr−1g DW m−2
Cai et al. 2021DBF3.7--
Canopy area1.9432152
Gap area7.02309286
This studyDBF2.1--
Canopy area1.8819128
Gap area2.81943154
Publisher’s Note: MDPI stays neutral with regard to jurisdictional claims in published maps and institutional affiliations.

