
Impact of Forest Harvesting Intensity and Water Table on Biodegradability of Dissolved Organic Carbon in Boreal Peat in an Incubation Experiment

 , , ,
, , , 
Abstract
:1. Introduction
2. Materials and Methods
2.1. Soil Column Collection and Experiment Set-Up
2.2. Sampling and Analysis
2.3. Calculations
2.4. Statistics
3. Results
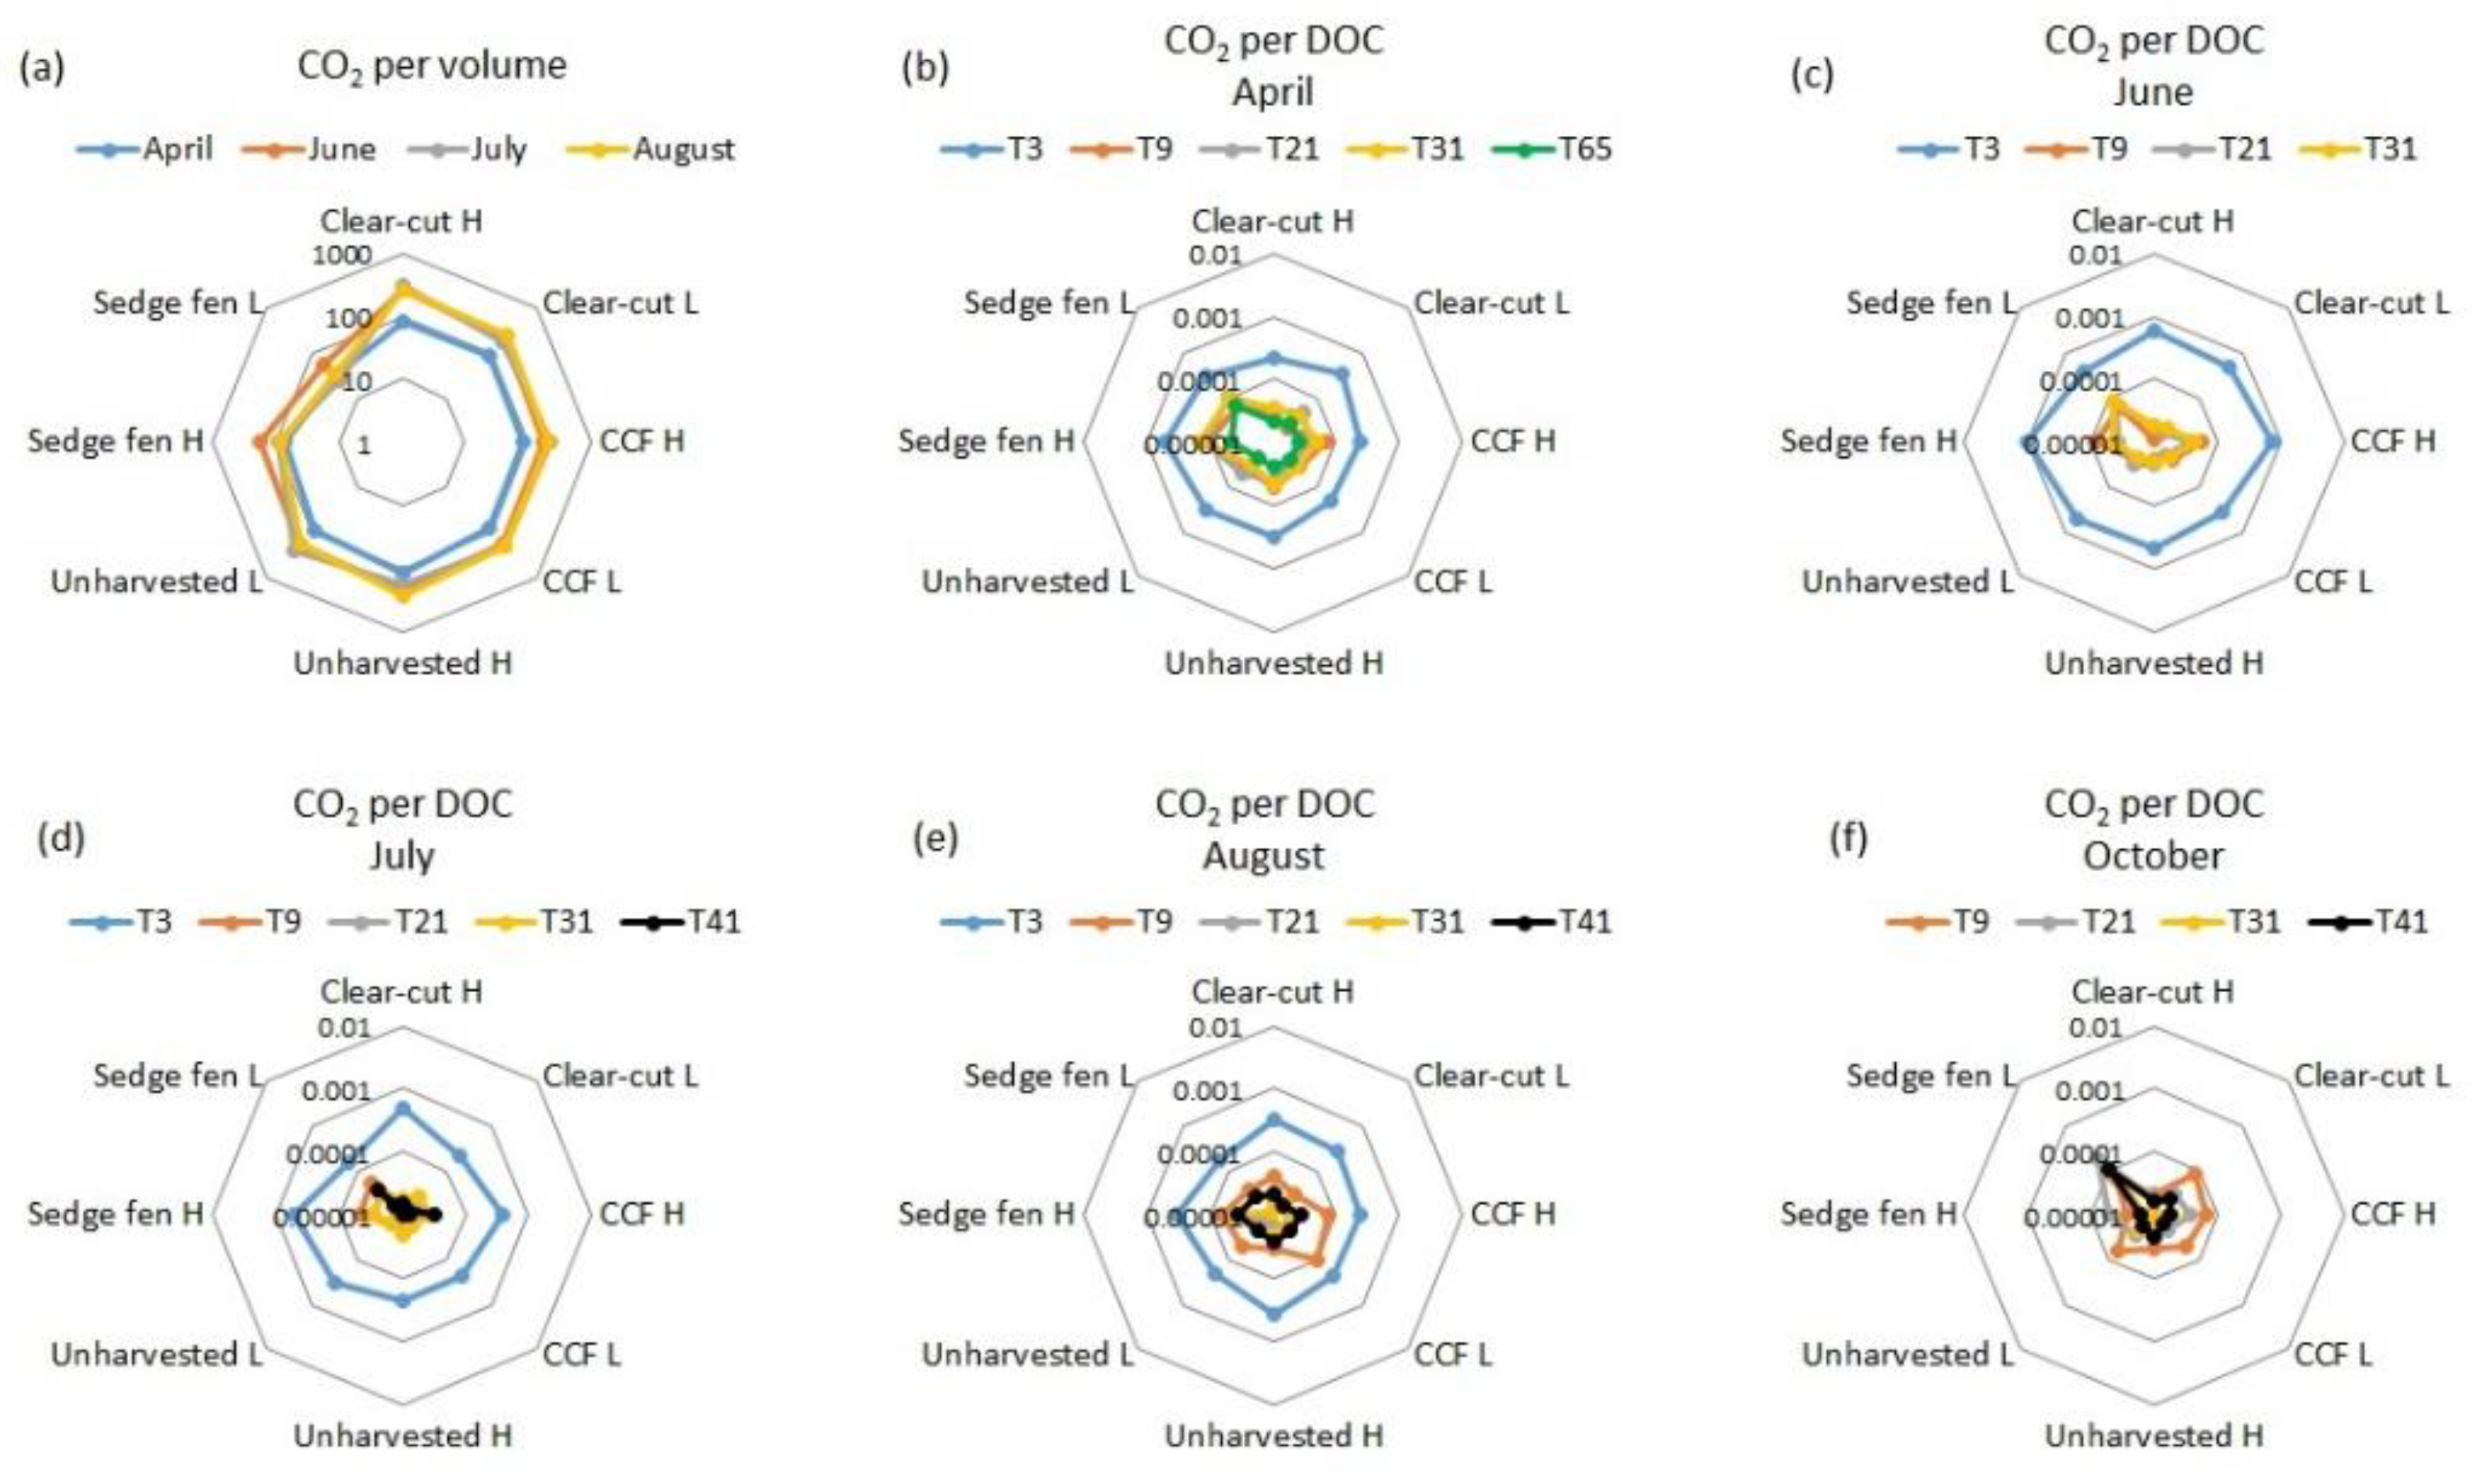
3.1. Biodegradation
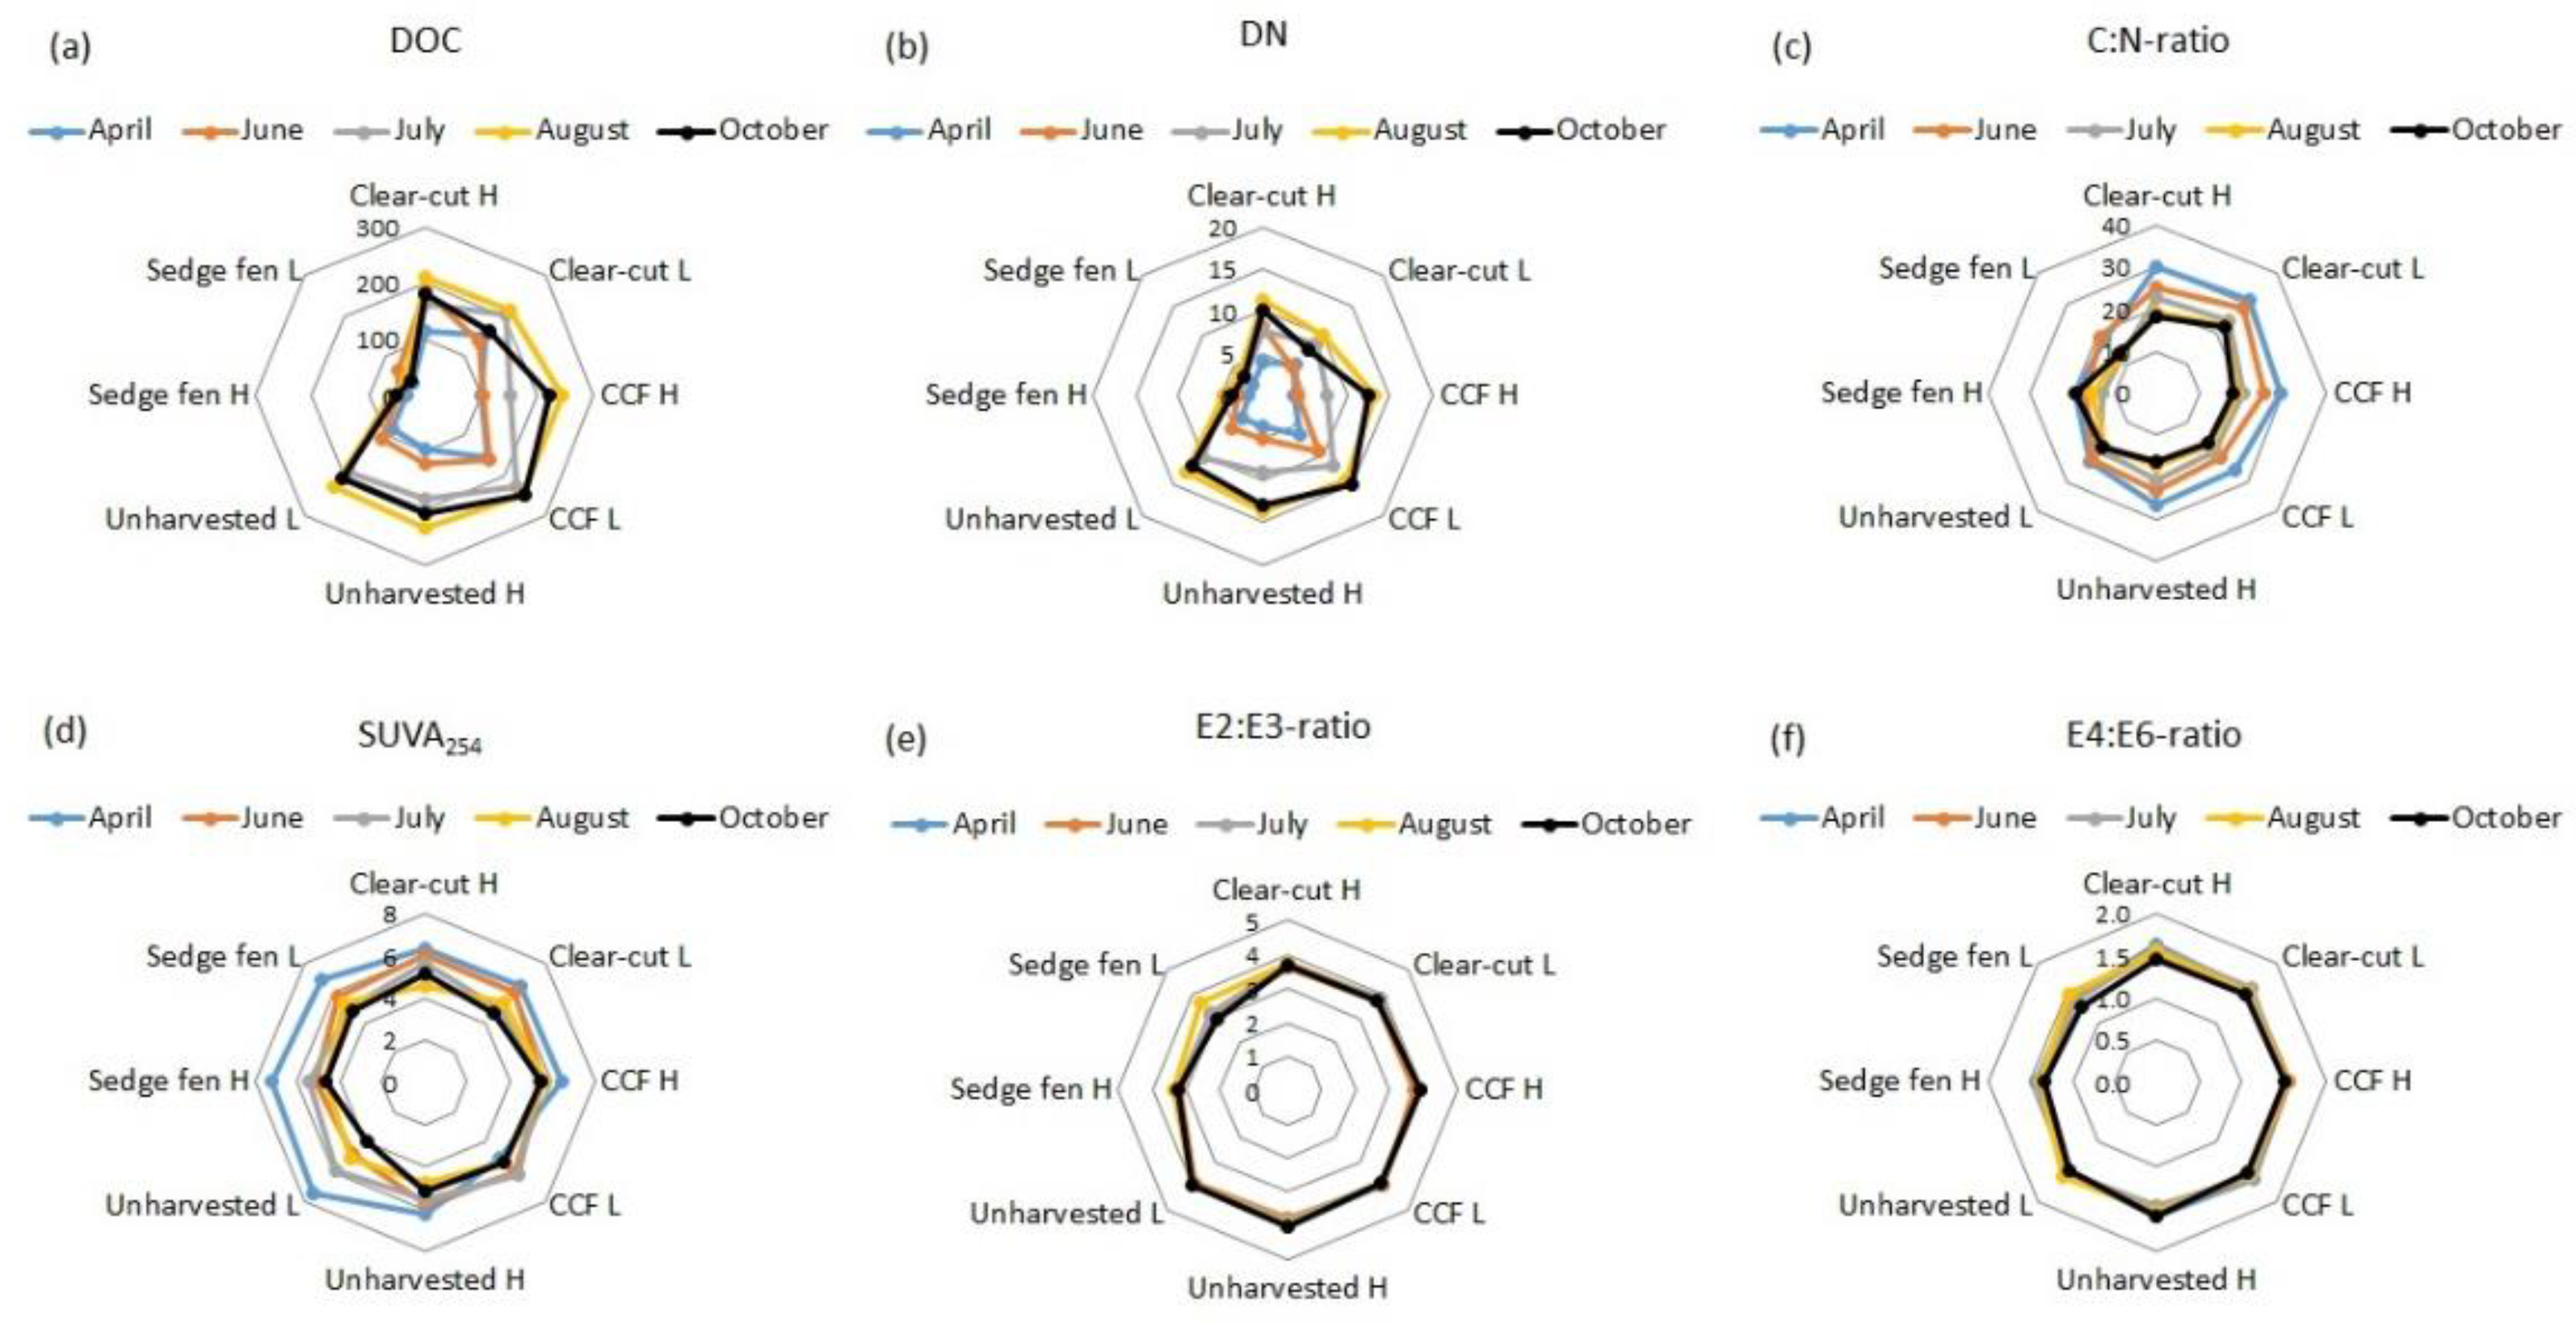
3.2. Pore Water Quality
3.3. Peat Properties and Biomass on Columns
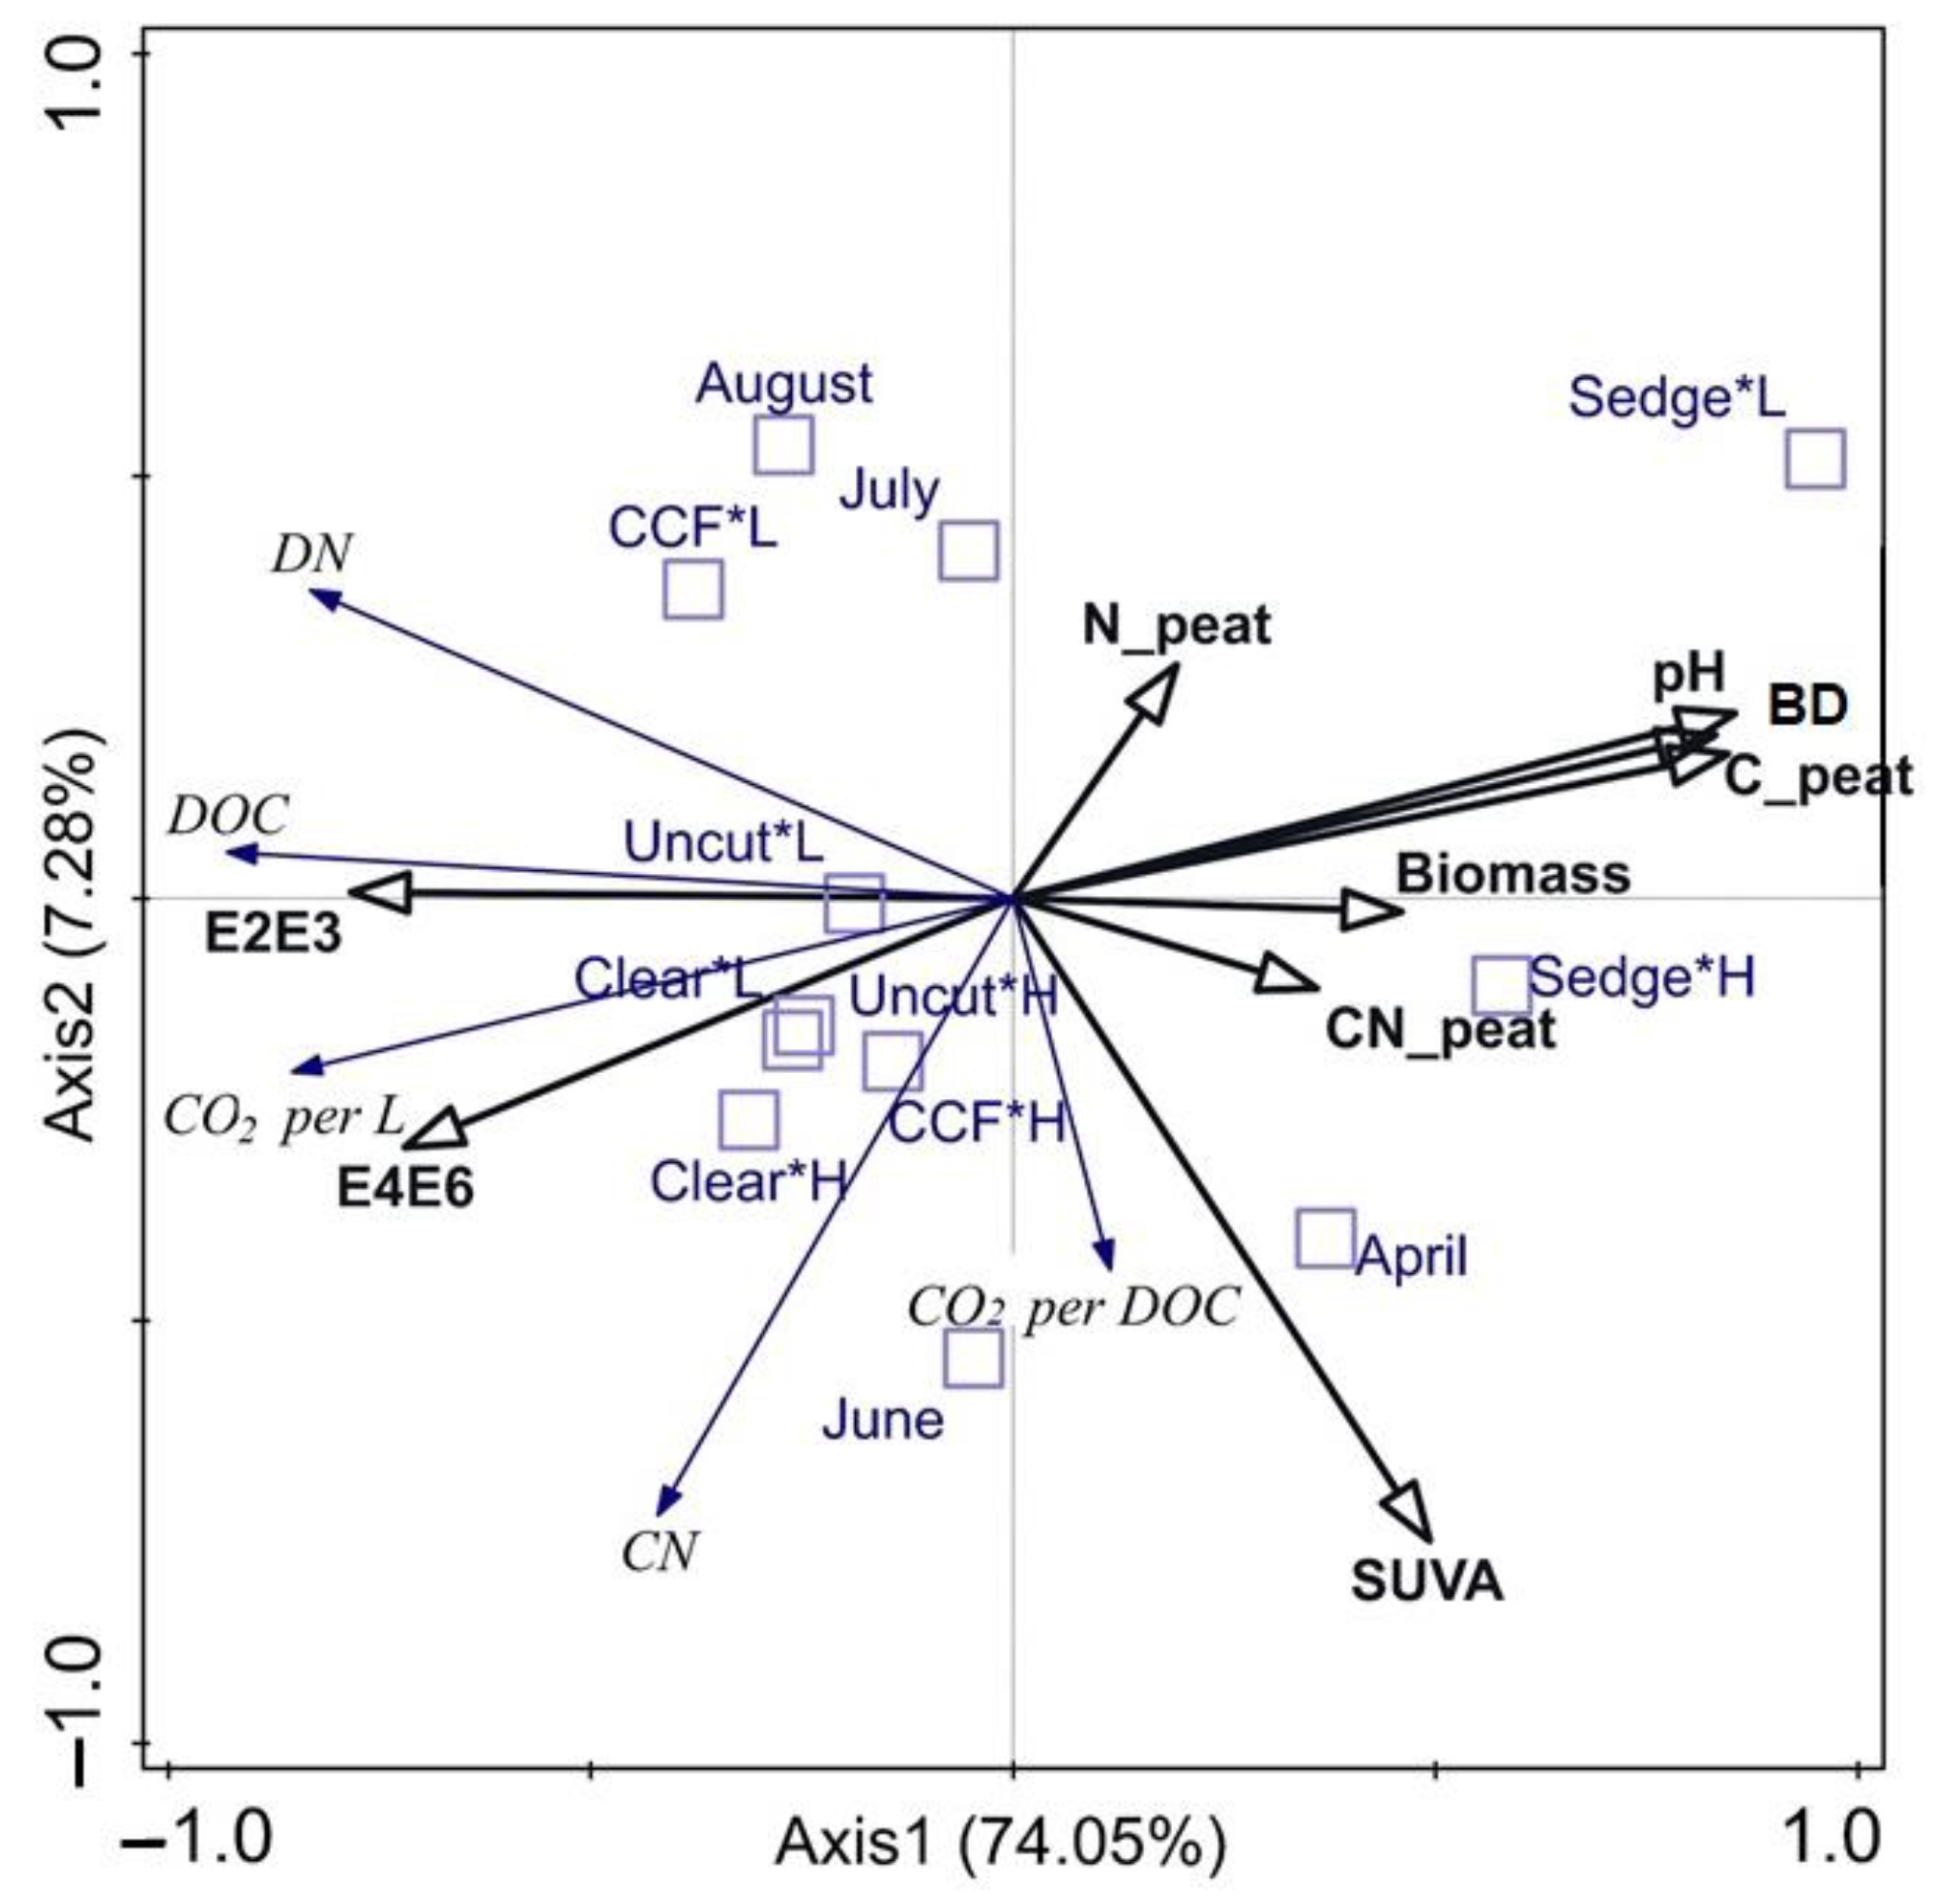
3.4. Summarising the Patterns Describing Pore Water Quality
4. Discussion
5. Conclusions
- Peat, per se, does not cause detectable differences in DOC production or biodegradability between different forest management operations in peatland forests drained decades ago.
- Ground vegetation can be a relevant source of DOC [24,35,68]. Our results indicate that the biodegradability of DOC in pore water is linked to high vegetation biomass, for example, in primary succession after clear-cutting. Therefore, the effects of the ground vegetation and its succession, and logging residues that are known to increase soil C pools and DOC concentrations in pore water [30,69], should be studied as potential sources of easily biodegradable C into watercourses. With time, the ground vegetation succession and decomposition processes affect the properties of old peat and formation of new peat [33], which may drive peat properties differently depending on the management.
- High WT can reduce decomposition and formation of recalcitrant DOC, but it can also provide a pathway especially for labile DOC to groundwater.
Supplementary Materials
Author Contributions
Funding
Institutional Review Board Statement
Informed Consent Statement
Data Availability Statement
Conflicts of Interest
References
- Gorham, E. Northern Peatlands: Role in the Carbon Cycle and Probable Responses to Climatic Warming. Ecol. Appl. 1991, 1, 182–195. [Google Scholar] [CrossRef] [PubMed]
- Wieder, R.K.; Vitt, D.H.; Benscoter, B.W. Peatlands and the Boreal Forest. In Boreal Peatlands and Ecosystems; Springer: Berlin/Heidelberg, Germany, 2006; pp. 1–8. [Google Scholar] [CrossRef]
- Bradshaw, C.J.A.; Warkentin, I.G. Global Estimates of Boreal Forest Carbon Stocks and Flux. Glob. Planet. Change 2015, 128, 24–30. [Google Scholar] [CrossRef]
- Nichols, J.E.; Peteet, D.M. Rapid Expansion of Northern Peatlands and Doubled Estimate of Carbon Storage. Nat. Geosci. 2019, 12, 917–921. [Google Scholar] [CrossRef]
- Leifeld, J.; Menichetti, L. The Underappreciated Potential of Peatlands in Global Climate Change Mitigation Strategies. Nat. Commun. 2018, 9, 1071. [Google Scholar] [CrossRef] [PubMed] [Green Version]
- Strack, M.; Waddington, J.M.; Bourbonniere, R.A.; Buckton, E.L.; Shaw, K.; Whittington, P.; Price, J.S. Effect of Water Table Drawdown on Peatland Dissolved Organic Carbon Export and Dynamics. Hydrol. Process. 2008, 22, 3373–3385. [Google Scholar] [CrossRef]
- Koehler, A.K.; Sottocornola, M.; Kiely, G. How Strong Is the Current Carbon Sequestration of an Atlantic Blanket Bog? Glob. Chang. Biol. 2011, 17, 309–319. [Google Scholar] [CrossRef] [Green Version]
- Huotari, J.; Ojala, A.; Peltomaa, E.; Nordbo, A.; Launiainen, S.; Pumpanen, J.; Rasilo, T.; Hari, P.; Vesala, T. Long-Term Direct CO2 Flux Measurements over a Boreal Lake: Five Years of Eddy Covariance Data. Geophys. Res. Lett. 2011, 38, 1–5. [Google Scholar] [CrossRef]
- Cook, S.; Peacock, M.; Evans, C.D.; Page, S.E.; Whelan, M.J.; Gauci, V.; Kho, L.K. Quantifying Tropical Peatland Dissolved Organic Carbon (DOC) Using UV-Visible Spectroscopy. Water Res. 2017, 115, 229–235. [Google Scholar] [CrossRef] [Green Version]
- Dinsmore, K.J.; Skiba, U.M.; Billett, M.F.; Rees, R.M. Effect of Water Table on Greenhouse Gas Emissions from Peatland Mesocosms. Plant Soil 2009, 318, 229–242. [Google Scholar] [CrossRef] [Green Version]
- Kritzberg, E.S. Centennial-Long Trends of Lake Browning Show Major Effect of Afforestation. Limnol. Oceanogr. Lett. 2017, 2, 105–112. [Google Scholar] [CrossRef] [Green Version]
- Nieminen, M.; Sarkkola, S.; Laurén, A. Impacts of Forest Harvesting on Nutrient, Sediment and Dissolved Organic Carbon Exports from Drained Peatlands: A Literature Review, Synthesis and Suggestions for the Future. For. Ecol. Manag. 2017, 392, 13–20. [Google Scholar] [CrossRef]
- Gandois, L.; Hoyt, A.M.; Mounier, S.; Le Roux, G.; Harvey, C.F.; Claustres, A.; Nuriman, M.; Anshari, G. From Canals to the Coast: Dissolved Organic Matter and Trace Metal Composition in Rivers Draining Degraded Tropical Peatlands in Indonesia. Biogeosciences 2020, 17, 1897–1909. [Google Scholar] [CrossRef] [Green Version]
- Finér, L.; Lepistö, A.; Karlsson, K.; Räike, A.; Härkönen, L.; Huttunen, M.; Joensuu, S.; Kortelainen, P.; Mattsson, T.; Piirainen, S.; et al. Drainage for Forestry Increases N, P and TOC Export to Boreal Surface Waters. Sci. Total Environ. 2021, 762, 144098. [Google Scholar] [CrossRef] [PubMed]
- Kalbitz, K.; Schmerwitz, J.; Schwesig, D.; Matzner, E. Biodegradation of Soil-Derived Dissolved Organic Matter as Related to Its Properties. Geoderma 2003, 113, 273–291. [Google Scholar] [CrossRef]
- Roth, V.N.; Lange, M.; Simon, C.; Hertkorn, N.; Bucher, S.; Goodall, T.; Griffiths, R.I.; Mellado-Vázquez, P.G.; Mommer, L.; Oram, N.J.; et al. Persistence of Dissolved Organic Matter Explained by Molecular Changes during Its Passage through Soil. Nat. Geosci. 2019, 12, 755–761. [Google Scholar] [CrossRef]
- Tfaily, M.M.; Hamdan, R.; Corbett, J.E.; Chanton, J.P.; Glaser, P.H.; Cooper, W.T. Investigating Dissolved Organic Matter Decomposition in Northern Peatlands Using Complimentary Analytical Techniques. Geochim. Cosmochim. Acta 2013, 112, 116–129. [Google Scholar] [CrossRef]
- Marschner, B.; Kalbitz, K. Controls of Bioavailability and Biodegradability of Dissolved Organic Matter in Soils. Geoderma 2003, 113, 211–235. [Google Scholar] [CrossRef]
- Moore, T.R.; Dalva, M. Some Controls on the Release of Dissolved Organic Carbon by Plant Tissued and Soils. Soil. Sci. 2001, 166, 38–47. [Google Scholar] [CrossRef] [Green Version]
- Novak, M.; Buzek, F.; Jackova, I.; Cejkova, B.; Stepanova, M.; Curik, J.; Veselovsky, F.; Bohdalkova, L.; Prechova, E.; Adamova, M. Isotope Composition of Dissolved Organic Carbon in Runoff and Peat Leachates from a Central European Wetland: Temporal and Spatial Variability in DOC Sources. Catena 2019, 173, 217–225. [Google Scholar] [CrossRef]
- Zhong, Y.; Jiang, M.; Middleton, B.A. Effects of Water Level Alteration on Carbon Cycling in Peatlands. Ecosyst. Heal. Sustain. 2020, 6, 1806113. [Google Scholar] [CrossRef]
- Clark, J.M.J.M.; Lane, S.N.S.N.; Chapman, P.J.P.J.; Adamson, J.K.J.K. Link between DOC in near Surface Peat and Stream Water in an Upland Catchment. Sci. Total Environ. 2008, 404, 308–315. [Google Scholar] [CrossRef] [PubMed]
- Jager, D.F.; Wilmking, M.; Kukkonen, J.V.K. The Influence of Summer Seasonal Extremes on Dissolved Organic Carbon Export from a Boreal Peatland Catchment: Evidence from One Dry and One Wet Growing Season. Sci. Total Environ. 2009, 407, 1373–1382. [Google Scholar] [CrossRef] [PubMed]
- Strack, M.; Tóth, K.; Bourbonniere, R.; Waddington, J.M. Dissolved Organic Carbon Production and Runoff Quality Following Peatland Extraction and Restoration. Ecol. Eng. 2011, 37, 1998–2008. [Google Scholar] [CrossRef]
- Hribljan, J.A.; Kane, E.S.; Pypker, T.G.; Chimner, R.A. The Effect of Long-Term Water Table Manipulations on Dissolved Organic Carbon Dynamics in a Poor Fen Peatland. J. Geophys. Res. Biogeosciences 2014, 119, 577–595. [Google Scholar] [CrossRef]
- Zhang, Y.; Shi, F.X.; Mao, R. Alnus Sibirica Encroachment Promotes Dissolved Organic Carbon Biodegradation in a Boreal Peatland. Sci. Total Environ. 2019, 695, 133882. [Google Scholar] [CrossRef]
- Liu, H.; Xu, H.; Wu, Y.; Ai, Z.; Zhang, J.; Liu, G.; Xue, S. Effects of Natural Vegetation Restoration on Dissolved Organic Matter (DOM) Biodegradability and Its Temperature Sensitivity. Water Res. 2021, 191, 116792. [Google Scholar] [CrossRef]
- Wickland, K.P.; Aiken, G.R.; Butler, K.; Dornblaser, M.M.; Spencer, R.G.M.; Striegl, R.G. Biodegradability of Dissolved Organic Carbon in the Yukon River and Its Tributaries: Seasonality and Importance of Inorganic Nitrogen. Glob. Biogeochem. Cycles 2012, 26, 1–14. [Google Scholar] [CrossRef]
- Sarkkola, S.; Nieminen, M.; Ahti, E.; Hökkä, H.; Koivusalo, H.; Päivänen, J.; Laine, J. Role of Tree Stand Evapotranspiration in Maintaining Satisfactory Drainage Conditions in Drained Peatlands. Can. J. For. Res. 2010, 40, 1485–1496. [Google Scholar] [CrossRef]
- Palviainen, M.; Peltomaa, E.; Laurén, A.; Kinnunen, N.; Ojala, A.; Berninger, F.; Zhu, X.; Pumpanen, J. Water Quality and the Biodegradability of Dissolved Organic Carbon in Drained Boreal Peatland under Different Forest Harvesting Intensities. Sci. Total Environ. 2022, 806, 150919. [Google Scholar] [CrossRef]
- Kiikkilä, O.; Kanerva, S.; Kitunen, V.; Smolander, A. Soil Microbial Activity in Relation to Dissolved Organic Matter Properties under Different Tree Species. Plant Soil 2014, 377, 169–177. [Google Scholar] [CrossRef]
- Nieminen, M.; Sarkkola, S.; Sallantaus, T.; Hasselquist, E.M.; Laudon, H. Peatland Drainage—A Missing Link behind Increasing TOC Concentrations in Waters from High Latitude Forest Catchments? Sci. Total Environ. 2021, 774, 145150. [Google Scholar] [CrossRef] [PubMed]
- Straková, P.; Penttilä, T.; Laine, J.; Laiho, R. Disentangling Direct and Indirect Effects of Water Table Drawdown on Above- and Belowground Plant Litter Decomposition: Consequences for Accumulation of Organic Matter in Boreal Peatlands. Glob. Chang. Biol. 2012, 18, 322–335. [Google Scholar] [CrossRef]
- Straková, P.; Anttila, J.; Spetz, P.; Kitunen, V.; Tapanila, T.; Laiho, R. Litter Quality and Its Response to Water Level Drawdown in Boreal Peatlands at Plant Species and Community Level. Plant Soil 2010, 335, 501–520. [Google Scholar] [CrossRef]
- Mastný, J.; Kaštovská, E.; Bárta, J.; Chroňáková, A.; Borovec, J.; Šantrůčková, H.; Urbanová, Z.; Edwards, R.K.; Picek, T. Quality of DOC Produced during Litter Decomposition of Peatland Plant Dominants. Soil Biol. Biochem. 2018, 121, 221–230. [Google Scholar] [CrossRef]
- Smolander, A.; Kitunen, V. Soil Microbial Activities and Characteristics of Dissolved Organic C and N in Relation to Tree Species. Soil Biol. Biochem. 2002, 34, 651–660. [Google Scholar] [CrossRef]
- Hansson, K.; Olsson, B.A.; Olsson, M.; Johansson, U.; Kleja, D.B. Differences in Soil Properties in Adjacent Stands of Scots Pine, Norway Spruce and Silver Birch in SW Sweden. For. Ecol. Manag. 2011, 262, 522–530. [Google Scholar] [CrossRef]
- Camino-Serrano, M.; Gielen, B.; Luyssaert, S.; Ciais, P.; Vicca, S.; Guenet, B.; Vos, B.D.; Cools, N.; Ahrens, B.; Altaf Arain, M.; et al. Linking Variability in Soil Solution Dissolved Organic Carbon to Climate, Soil Type, and Vegetation Type. Glob. Biogeochem. Cycles 2014, 28, 497–509. [Google Scholar] [CrossRef]
- Kritzberg, E.S.; Hasselquist, E.M.; Škerlep, M.; Löfgren, S.; Olsson, O.; Stadmark, J.; Valinia, S.; Hansson, L.A.; Laudon, H. Browning of Freshwaters: Consequences to Ecosystem Services, Underlying Drivers, and Potential Mitigation Measures. Ambio 2020, 49, 375–390. [Google Scholar] [CrossRef] [Green Version]
- Pennock, D.J.; Van Kessel, C. Clear-Cut Forest Harvest Impacts on Soil Quality Indicators in the Mixedwood Forest of Saskatchewan, Canada. Geoderma 1997, 75, 13–32. [Google Scholar] [CrossRef]
- Brais, S.; Harvey, B.D.; Bergeron, Y.; Messier, C.; Greene, D.; Belleau, A.; Paré, D. Testing Forest Ecosystem Management in Boreal Mixedwoods of Northwestern Quebec: Initial Response of Aspen Stands to Different Levels of Harvesting. Can. J. For. Res. 2004, 34, 431–446. [Google Scholar] [CrossRef] [Green Version]
- Thiffault, E.; Paré, D.; Bé Langer, N.; Munson, A.; Marquis, F. Harvesting Intensity at Clear-Felling in the Boreal Forest. Soil Sci. Soc. Am. J. 2006, 70, 691–701. [Google Scholar] [CrossRef]
- Prescott, C.E. The Influence of the Forest Canopy on Nutrient Cycling. Tree Physiol. 2002, 22, 1193–1200. [Google Scholar] [CrossRef] [PubMed] [Green Version]
- Pommerening, A.; Murphy, S.T. A Review of the History, Definitions and Methods of Continuous Cover Forestry with Special Attention to Afforestation and Restocking. Forestry. 2004, 77, 27–44. [Google Scholar] [CrossRef] [Green Version]
- Nieminen, M.; Hökkä, H.; Laiho, R.; Juutinen, A.; Ahtikoski, A.; Pearson, M.; Kojola, S.; Sarkkola, S.; Launiainen, S.; Valkonen, S.; et al. Could Continuous Cover Forestry Be an Economically and Environmentally Feasible Management Option on Drained Boreal Peatlands? For. Ecol. Manag. 2018, 424, 78–84. [Google Scholar] [CrossRef]
- Kreutzweiser, D.P.; Hazlett, P.W.; Gunn, J.M. Logging Impacts on the Biogeochemistry of Boreal Forest Soils and Nutrient Export to Aquatic Systems: A Review. Environ. Rev. 2008, 16, 157–179. [Google Scholar] [CrossRef]
- Laurila, T.; Aurela, M.; Hatakka, J.; Hotanen, J.; Jauhiainen, J.; Korkiakoski, M.; Korpela, L.; Koskinen, M.; Laiho, R.; Lehtonen, A.; et al. Set-up and Instrumentation of the Greenhouse Gas (GHG) Measurements on Experimental Sites of Continuous Cover Forestry. In Natural Resources and Bioeconomy Studies; Natural Resources Institute Finland: Helsinki, Finland, 2021; pp. 1–51. [Google Scholar]
- Weishaar, J.L.; Aiken, G.R.; Bergamaschi, B.A.; Fram, M.S.; Fujii, R.; Mopper, K. No Title. Environ. Sci. Technol. 2003, 37, 4702–4708. [Google Scholar] [CrossRef] [PubMed]
- Peacock, M.; Evans, C.D.; Fenner, N.; Freeman, C.; Gough, R.; Jones, T.G.; Lebron, I. UV-Visible Absorbance Spectroscopy as a Proxy for Peatland Dissolved Organic Carbon (DOC) Quantity and Quality: Considerations on Wavelength and Absorbance Degradation. Environ. Sci. Process. Impacts 2014, 16, 1445–1461. [Google Scholar] [CrossRef] [Green Version]
- McDonald, S.; Bishop, A.G.; Prenzler, P.D.; Robards, K. Analytical Chemistry of Freshwater Humic Substances. Anal. Chim. Acta 2004, 527, 105–124. [Google Scholar] [CrossRef]
- Von Post, L.; Granlund, E. Södra Sveriges Torvtillgångar; Swedish Geological Survey: Stockholm, Sweden, 1926. [Google Scholar]
- Pastor, J.; Solin, J.; Bridgham, S.D.; Updegraff, K.; Harth, C.; Weishampel, P.; Dewey, B.; Bridgham, J.; Harth, K.; Dewey, P.; et al. Global Warming and the Export of Dissolved Organic Carbon from Boreal Peatlands. Oikos 2003, 100, 380–386. [Google Scholar] [CrossRef]
- Tunaley, C.; Tetzlaff, D.; Lessels, J.; Soulsby, C. Linking High-Frequency DOC Dynamics to the Age of Connected Water Sources. Water Resour. Res. 2016, 52, 5232–5247. [Google Scholar] [CrossRef] [Green Version]
- Bernard-Jannin, L.; Binet, S.; Gogo, S.; Leroy, F.; Défarge, C.; Jozja, N.; Zocatelli, R.; Perdereau, L.; Laggoun-Défarge, F. Hydrological Control of Dissolved Organic Carbon Dynamics in a Rehabilitated Sphagnum-Dominated Peatland: A Water-Table Based Modelling Approach. Hydrol. Earth Syst. Sci. 2018, 22, 4907–4920. [Google Scholar] [CrossRef] [Green Version]
- Tahvanainen, T. Seasonal Variation of Water Chemical Gradients in Three Boreal Fens. Ann. Bot. Fenn. 2003, 40, 345–355. [Google Scholar]
- Laine, A.M.; Mäkiranta, P.; Laiho, R.; Mehtätalo, L.; Penttilä, T.; Korrensalo, A.; Minkkinen, K.; Fritze, H.; Tuittila, E.S. Warming Impacts on Boreal Fen CO2 Exchange under Wet and Dry Conditions. Glob. Change Biol. 2019, 25, 1995–2008. [Google Scholar] [CrossRef] [PubMed] [Green Version]
- Venäläinen, A.; Lehtonen, I.; Laapas, M.; Ruosteenoja, K.; Tikkanen, O.P.; Viiri, H.; Ikonen, V.P.; Peltola, H. Climate Change Induces Multiple Risks to Boreal Forests and Forestry in Finland: A Literature Review. Glob. Change Biol. 2020, 26, 4178–4196. [Google Scholar] [CrossRef] [PubMed]
- Qualls, R.G.; Richardson, C.J. Factors Controlling Concentration, Export, and Decomposition of Dissolved Organic Nutrients in the Everglades of Florida. Biogeochemistry 2003, 62, 197–229. [Google Scholar] [CrossRef]
- Clark, J.M.; Ashley, D.; Wagner, M.; Chapman, P.J.; Lane, S.N.; Evans, C.D.; Heathwaite, A.L. Increased Temperature Sensitivity of Net DOC Production from Ombrotrophic Peat Due to Water Table Draw-Down. Glob. Change Biol. 2009, 15, 794–807. [Google Scholar] [CrossRef]
- Laudon, H.; Berggren, M.; Ågren, A.; Buffam, I.; Bishop, K.; Grabs, T.; Jansson, M.; Köhler, S. Patterns and Dynamics of Dissolved Organic Carbon (DOC) in Boreal Streams: The Role of Processes, Connectivity, and Scaling. Ecosystems 2011, 14, 880–893. [Google Scholar] [CrossRef]
- Zhang, B.; Shan, C.; Hao, Z.; Liu, J.; Wu, B.; Pan, B. Transformation of Dissolved Organic Matter during Full-Scale Treatment of Integrated Chemical Wastewater: Molecular Composition Correlated with Spectral Indexes and Acute Toxicity. Water Res. 2019, 157, 472–482. [Google Scholar] [CrossRef]
- Fenner, N.; Williams, R.; Toberman, H.; Hughes, S.; Reynolds, B.; Freeman, C. Decomposition “hotspots” in a Rewetted Peatland: Implications for Water Quality and Carbon Cycling. Hydrobiologia 2011, 674, 51–66. [Google Scholar] [CrossRef]
- Mao, R.; Zhang, X.H.; Li, S.Y.; Song, C.C. Long-Term Phosphorus Addition Enhances the Biodegradability of Dissolved Organic Carbon in a Nitrogen-Limited Temperate Freshwater Wetland. Sci. Total Environ. 2017, 605–606, 332–336. [Google Scholar] [CrossRef]
- Spencer, R.G.M.; Bolton, L.; Baker, A. Freeze/Thaw and PH Effects on Freshwater Dissolved Organic Matter Fluorescence and Absorbance Properties from a Number of UK Locations. Water Res. 2007, 41, 2941–2950. [Google Scholar] [CrossRef] [PubMed]
- Peacock, M.; Freeman, C.; Gauci, V.; Lebron, I.; Evans, C.D. Investigations of Freezing and Cold Storage for the Analysis of Peatland Dissolved Organic Carbon (DOC) and Absorbance Properties. Environ. Sci. Process. Impacts 2015, 17, 1290–1301. [Google Scholar] [CrossRef] [PubMed] [Green Version]
- Gogo, S.; Laggoun-Défarge, F.; Delarue, F.; Lottier, N. Invasion of a Sphagnum-Peatland by Betula Spp and Molinia Caerulea Impacts Organic Matter Biochemistry. Implications for Carbon and Nutrient Cycling. Biogeochemistry 2011, 106, 53–69. [Google Scholar] [CrossRef] [Green Version]
- Laurén, A.; Lappalainen, M.; Kieloaho, A.J.; Karhu, K.; Palviainen, M. Temperature Sensitivity Patterns of Carbon and Nitrogen Processes in Decomposition of Boreal Organic Soils—Quantification in Different Compounds and Molecule Sizes Based on a Multifactorial Experiment. PLoS ONE 2019, 14, e0223446. [Google Scholar] [CrossRef] [PubMed]
- Dieleman, C.M.; Lindo, Z.; McLaughlin, J.W.; Craig, A.E.; Branfireun, B.A. Climate Change Effects on Peatland Decomposition and Porewater Dissolved Organic Carbon Biogeochemistry. Biogeochemistry 2016, 128, 385–396. [Google Scholar] [CrossRef]
- Johnson, D.W.; Curtis, P.S. Effects of Forest Management on Soil C and N Storage: Meta Analysis. For. Ecol. Manag. 2001, 140, 227–238. [Google Scholar] [CrossRef]


Publisher’s Note: MDPI stays neutral with regard to jurisdictional claims in published maps and institutional affiliations. |
© 2022 by the authors. Licensee MDPI, Basel, Switzerland. This article is an open access article distributed under the terms and conditions of the Creative Commons Attribution (CC BY) license (https://creativecommons.org/licenses/by/4.0/).
Share and Cite
Peltomaa, E.; Könönen, M.; Palviainen, M.; Laurén, A.; Zhu, X.; Kinnunen, N.; Aaltonen, H.; Ojala, A.; Pumpanen, J. Impact of Forest Harvesting Intensity and Water Table on Biodegradability of Dissolved Organic Carbon in Boreal Peat in an Incubation Experiment. Forests 2022, 13, 599. https://0-doi-org.brum.beds.ac.uk/10.3390/f13040599
Peltomaa E, Könönen M, Palviainen M, Laurén A, Zhu X, Kinnunen N, Aaltonen H, Ojala A, Pumpanen J. Impact of Forest Harvesting Intensity and Water Table on Biodegradability of Dissolved Organic Carbon in Boreal Peat in an Incubation Experiment. Forests. 2022; 13(4):599. https://0-doi-org.brum.beds.ac.uk/10.3390/f13040599
Chicago/Turabian StylePeltomaa, Elina, Mari Könönen, Marjo Palviainen, Annamari (Ari) Laurén, Xudan Zhu, Niko Kinnunen, Heidi Aaltonen, Anne Ojala, and Jukka Pumpanen. 2022. "Impact of Forest Harvesting Intensity and Water Table on Biodegradability of Dissolved Organic Carbon in Boreal Peat in an Incubation Experiment" Forests 13, no. 4: 599. https://0-doi-org.brum.beds.ac.uk/10.3390/f13040599