
Rapidly Quantifying Interior Greenery Using 360° Panoramic Images


1
Fenner School of Environment and Society, Australian National University, Canberra, ACT 2601, Australia
2
High Resolution Plant Phenomics Centre, Commonwealth Scientific and Industrial Research Organization (CSIRO), Plant Industry, Canberra, ACT 2601, Australia
*
Author to whom correspondence should be addressed.
Forests 2022, 13(4), 602; https://0-doi-org.brum.beds.ac.uk/10.3390/f13040602
Submission received: 18 February 2022
/
Revised: 5 April 2022
/
Accepted: 9 April 2022
/
Published: 12 April 2022
(This article belongs to the Special Issue Urban Forestry Measurements)
Abstract
:Many people spend the majority of their time indoors and there is emerging evidence that interior greenery contributes to human wellbeing. Accurately capturing the amount of interior greenery is an important first step in studying its contribution to human well-being. In this study, we evaluated the accuracy of interior greenery captured using 360° panoramic images taken within a range of different interior spaces. We developed an Interior Green View Index (iGVI) based on a K-means clustering algorithm to estimate interior greenery from 360° panoramic images taken within 66 interior spaces and compared these estimates with interior greenery measured manually from the same panoramic images. Interior greenery estimated using the automated method ranged from 0% to 34.19% of image pixels within the sampled interior spaces. Interior greenery estimated using the automated method was highly correlated (r = 0.99) with interior greenery measured manually, although we found the accuracy of the automated method compared with the manual method declined with the volume and illuminance of interior spaces. The results suggested that our automated method for extracting interior greenery from 360° panoramic images is a useful tool for rapidly estimating interior greenery in all but very large and highly illuminated interior spaces.
1. Introduction
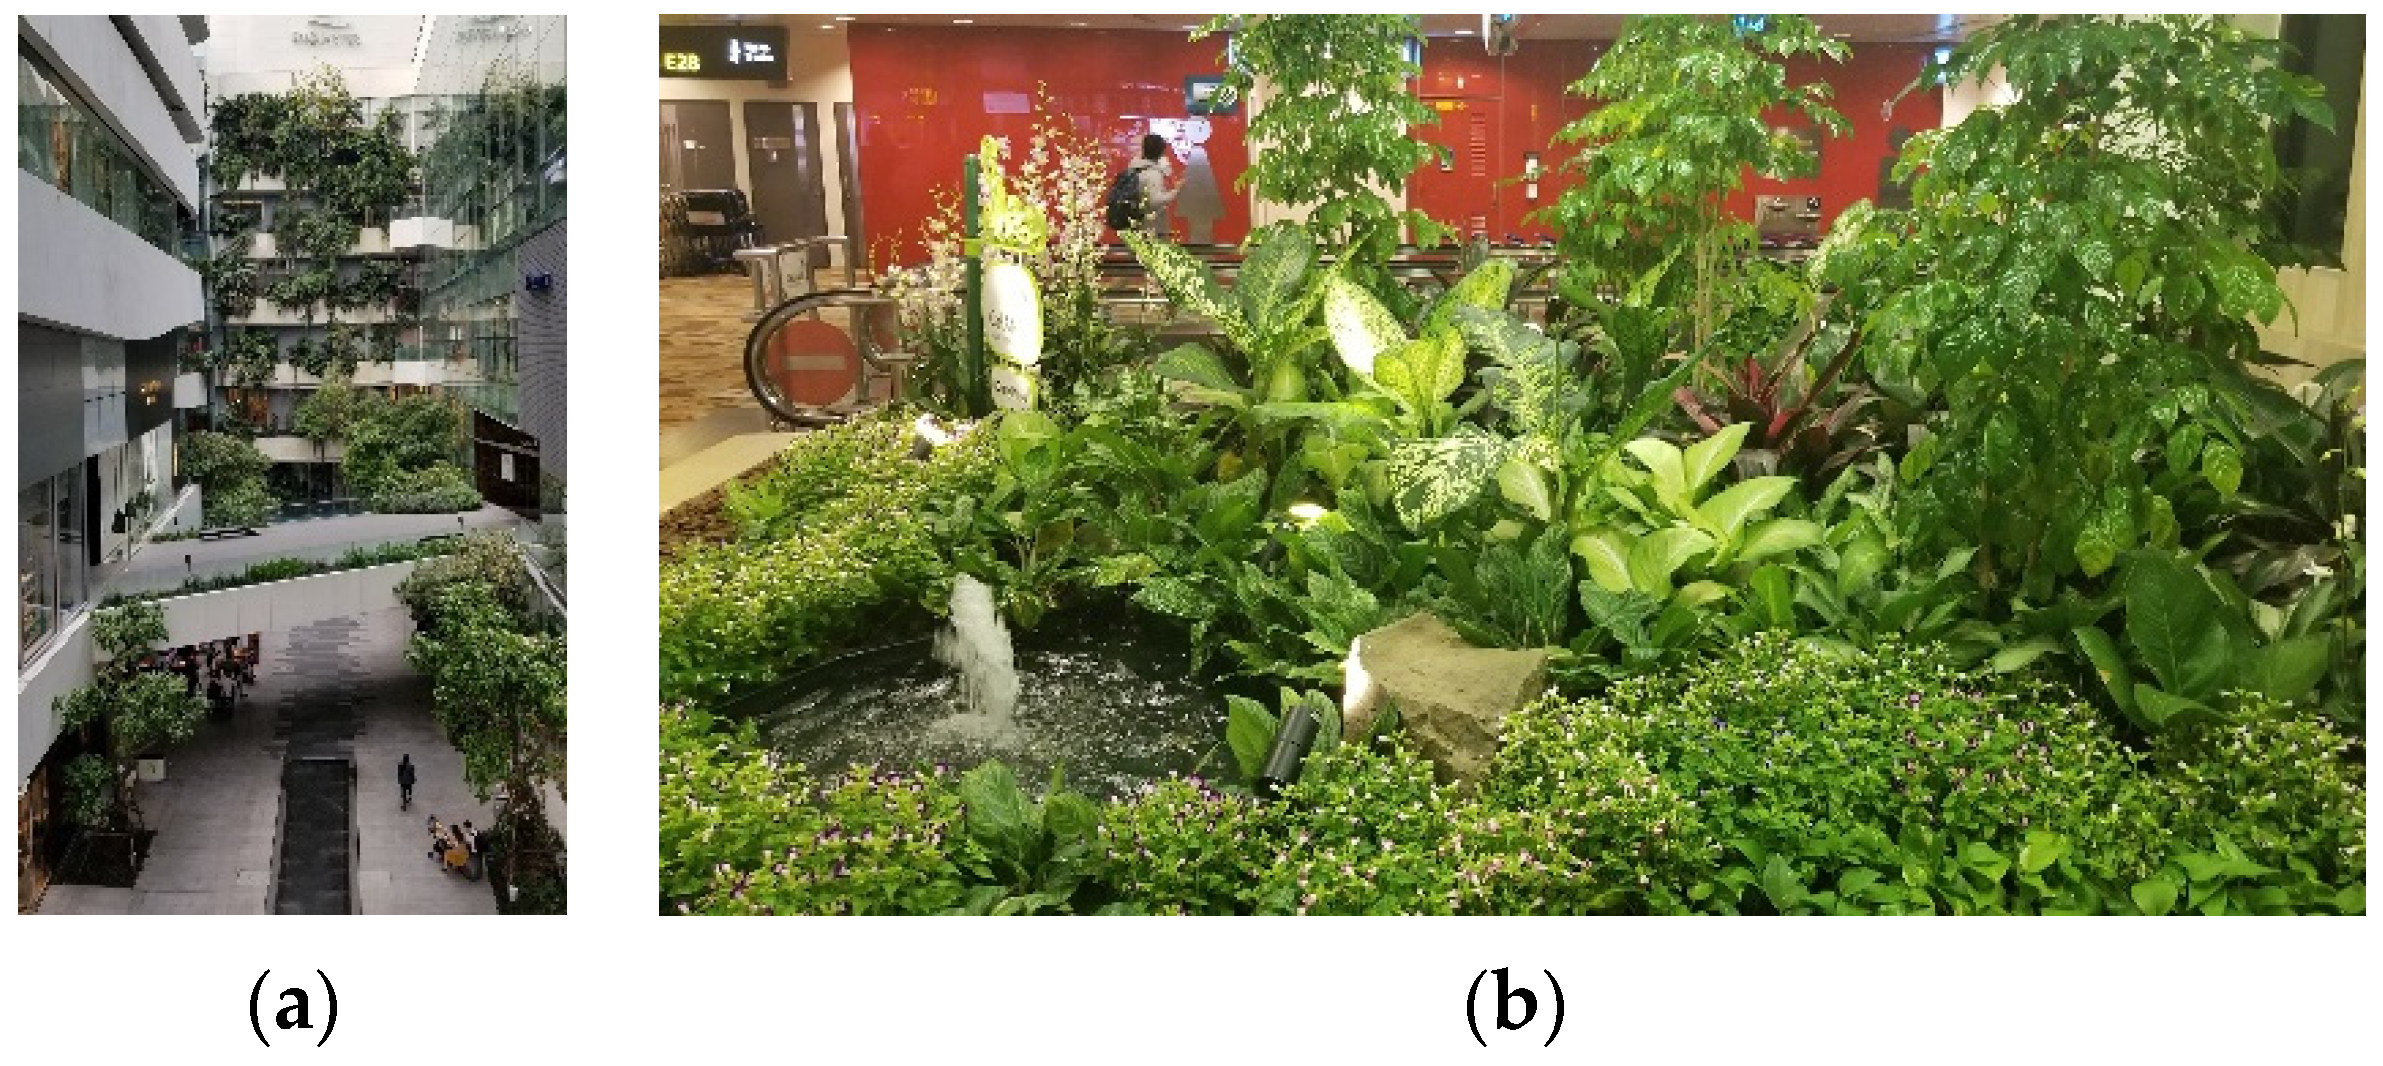
Contact with green space has positive effects on physical and mental health [1,2,3]. Some people (e.g., with limited mobility, living in densely-populated cities, and living in extreme climates) spend the majority of their time indoors [4,5,6,7,8]. For these people, a large proportion of their contact with green space may occur indoors [9,10]. Interior green space (Figure 1) can provide some of the environmental and psychological benefits provided by outdoor green space [11]. For example, interior green space is associated with greater parasympathetic activity (i.e., rest) [12], attention span [13,14], and improved air quality [15,16]. Thus, interior green space has potential to fulfil some of the functions of outdoor green space for those with limited opportunities to access the latter. However, the benefits of interior green space have received relatively little attention compared with the benefits of outdoor green space [17,18].
Vegetation (or greenery) is typically measured using some form of remote sensing. With continual improvement in spatial resolution, airborne remote sensing is the most common method used to capture greenery in outdoor spaces [19]. Airborne remote sensing technology allows large areas to be sampled rapidly in contrast to on-site observation. However, airborne remote sensing instruments are not suitable for capturing indoor greenery. Alternatively, there are a number of hand-held sensors that can potentially be used to capture interior greenery. Terrestrial LiDAR scanners can be used to obtain Leaf Area Density and Leaf Area Index at a high level of accuracy [20]. Previous studies have demonstrated that terrestrial LiDAR can accurately calculate forest structure at the branch level, individual tree level, and plot level [20,21,22]. However, LiDAR instruments are expensive [23] and the processing of large amounts of point cloud data that LiDAR produces can be challenging [24,25]. Using conventional RGB images for capturing greenery is a cost-effective method in some circumstances [26]. Yang et al. [27] used RGB images taken in cardinal directions to evaluate the visibility of greenery at the street level and Yu et al. [28] used RGB images to evaluate greenery in urban parks.
Several methods have been developed to extract indoor greenery from RGB imagery captured using conventional RGB cameras. These are based on calculating the area of greenery [29,30] or the ratio of greenery relative to other features [31]. Choi et al. [11] developed an index of greenness based on the percentage of plant leaf area within the total area captured in RGB images. Salamone et al. [32] introduced an index that indicates the fraction of green area on the surface of a hemisphere centered on the point of analysis using RGB imagery captured with a fisheye lens. However, past methods for capturing interior greenery have involved processing multiple images [33,34].
The use of 360° panoramic images may represent an alternative for capturing the way that humans experience interior greenery. As the name suggests, 360° panoramic images can capture plants in all cardinal, horizontal, and vertical directions in one continuous image from a single, ground-based point, and thus have the potential to be an effective method for measuring interior greenery in a cost-effective way. The aims of this study are therefore to: (a) develop an automated method to extract interior greenery from 360° panoramic RGB images; (b) evaluate the accuracy of this method within interior spaces with different dimensions.
2. Materials and Methods
2.1. Selection of Interior Spaces
In this study, we focused on sampling interior spaces within public buildings used primarily for work or study (i.e., university buildings, offices, and libraries) and shopping, leisure, or accommodation (i.e., museums, shopping centers, and hotels). In order to sample interior spaces with a range of dimensions, we stratified interior spaces into 3 types (i.e., atriums, corridors, and meeting rooms) and sampled an approximately even number of each type of interior spaces. Only interior spaces that contained at least some greenery were sampled (i.e., planted flowers, trees, flower beds, green walls, and indoor gardens). In total, we sampled 66 interior spaces from 33 public buildings. All sampling occurred in June and July 2021 and all buildings were located in the city of Canberra, Australia (35.2809° S, 149.1300° E).
2.2. Panoramic Imagery Captured within Interior Spaces
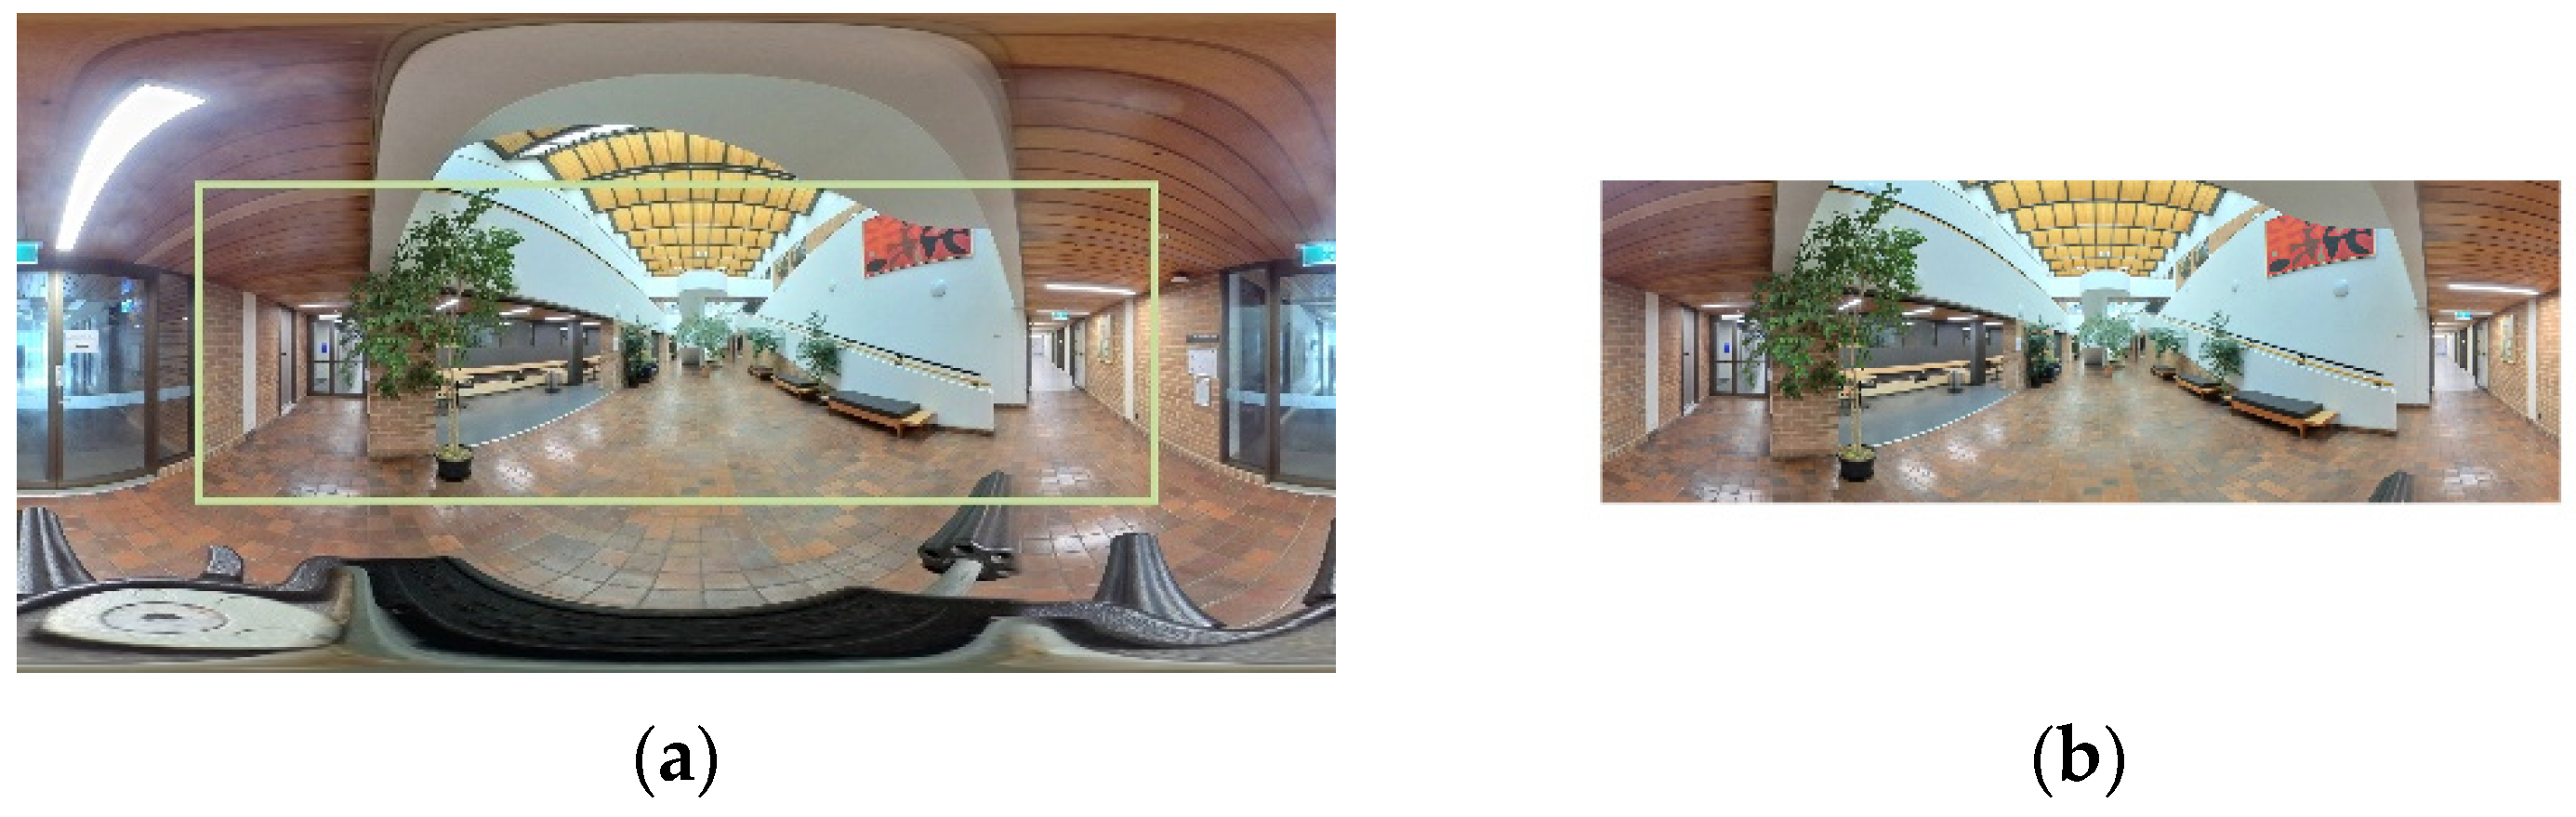
One 360° panoramic image was captured in the center of each of the 66 sampled interior spaces using an Insta360 One R camera. The dual lens of the camera can capture 360-degrees simultaneously with 5.7 K resolution (Figure 2). Each image was captured with the camera positioned 1.7 m above the ground. 360° panoramic images were generated from Insta360 Studio 2021 software, which is the photo-stitching software provided with the Insta360 One R camera (Figure 2a). Distortions in the upper and lower part of 360° panoramic images can affect the quality of the image [35]. Tsai et al. [36] indicated that only the center section of panoramic images has relatively low distortion. Yin et al. [37] and Ki et al. [38] overcame this by cropping the top and bottom of the image to match a viewer’s perspective. We used the same method (i.e., we cropped the central part of each 360° panoramic image) to simulate the viewer’s perspective (Figure 2b).
2.3. Automated Greenery Extraction from Panoramic Images
Green vegetation extraction from remote sensing images has been studied for almost four decades [39]. Green vegetation can be easily detected using remote sensing because of its high reflectance and high absorption characteristics at the near-infrared and red parts of the electromagnetic spectrum. 360° panoramic images contain no near-infrared bands but red, green, and blue bands. We chose a K-means clustering algorithm to extract greenery from the 360° panoramic images. Images were uploaded to an image processing script tool (Image Color Summarizer) [40], which is an open-source online tool developed by Michael Smith Genome Sciences Centre. The processing time for the K-means clustering algorithm to evaluate 360° panoramic images is under 30 s with very high level of precision (200 px). Finally descriptive color statistics were computed using every pixel in panoramic image.
A K-means clustering algorithm was utilized for the partitioning of images into clusters. Key steps are followed:
- Assign the pixels to each cluster that restrict the partition between the pixel and the cluster center;
- Calculate the color border of the cluster by the average value of its pixels.
The K-means clustering algorithm segments areas of interest from the background using an unsupervised pixel-based classification method [41,42] with high computational efficiency [43].
Calculating the Amount of Interior Greenery from 360° Panoramic Images
Previous approaches for calculating greenery from RGB imagery are based on combining data from multiple images. Yang et al. [27] proposed a Green View Index (GVI) to extract greenery from RGB imagery in urban forests. Their GVI was defined as the ratio of green pixels to the total pixels captured in photos taken in four cardinal directions using the following equation:
where is the green pixels of the photo taken in theth cardinal direction, andis all pixels of the photo taken in the th cardinal direction. Dong et al. [44] proposed a GVI to estimate greenery using different horizontal and vertical directions at each sample site as:
where is the green pixels of the photo taken in the horizontal direction and the vertical direction for each sample site, and is the whole pixels of the photo in the horizontal direction and the vertical direction. Parameters and represent the numbers of horizontal and vertical directions, respectively.
Because a 360° panoramic image represents all cardinal, horizontal and vertical directions in one continuous image, we calculated interior greenery using a simplified Interior Green View Index (iGVI) from 360° panoramic images as:
where is the number of pixels representing greenery in each 360° panoramic image, and is the total pixels of the 360° panoramic image.
2.4. Evaluation of the Interior Green View Index
To evaluate the accuracy of our automated method for extracting interior greenery from 360° panoramic images, we compared our estimates of greenery for each interior space derived from the K-means clustering algorithm and iGVI with reference data extracted manually from the same 360° panoramic images. Adobe Photoshop CC 2020 software was used to extract greenery from the 360° panoramic images manually. We used the quick selection tool from Adobe Photoshop to select the area of greenery in each image. Although we were unable to validate the accuracy of this method, greenery within the imagery is clearly visible and can be captured at a high spatial accuracy given the images are captured at 5.7 K resolution. The number of selected pixels representing the greenery of an image can be read directly from the histogram toolbox in the Adobe Photoshop package. The selected pixels were divided by the total pixels of an image to calculate the iGVI for each 360° panoramic image. This process took up to 4 min for each image. The discrepancy in the percent of greenery estimated for each interior space between the K-means methods, and the manual method was used to evaluate the accuracy of the former.
To examine which variables affect differences between observed values of interior greenery (using the manual extraction method) and predicted values of interior greenery (using the automated extraction method), we measured seven variables (covariates) for each interior space where 360° panoramic images were captured (Table 1). We collected illuminance (lux) at each camera position using the ambient light sensor on a smartphone and Light Meter application [45] and the dimensions (length, width, height, area, and volume) of each sampled interior space using a laser rangefinder. Differences between observed and predicted iGVI values were used as the response variable in 14 linear regression models in which we fit different combinations of the seven covariates (Table 2). We used Akaike’s Information Criterion (AICc) adjusted for small sample sizes to rank the 14 models in Table 2 [46]. We calculated Variance Inflation Factors (VIF) for each variable in the top-ranked model as a check for collinearity. All statistical analyses were undertaken using R software [47].
3. Results
We sampled 66 interior spaces from 33 public buildings. We sampled 23 atriums, 21 corridors, and 21 meeting rooms. Interior spaces had lengths, widths, and heights (to the ceiling) that ranged from 5.5 to 92.1 m, 1.7 to 55.4 m, and 2.0 to 20.3 m, respectively. Interior areas ranged from 19 to 3933 m2 and interior volumes ranged from 58 to 78,275 m3. Illuminances ranged from 1 to 1632 lux.
3.1. Interior Greenery Estimates
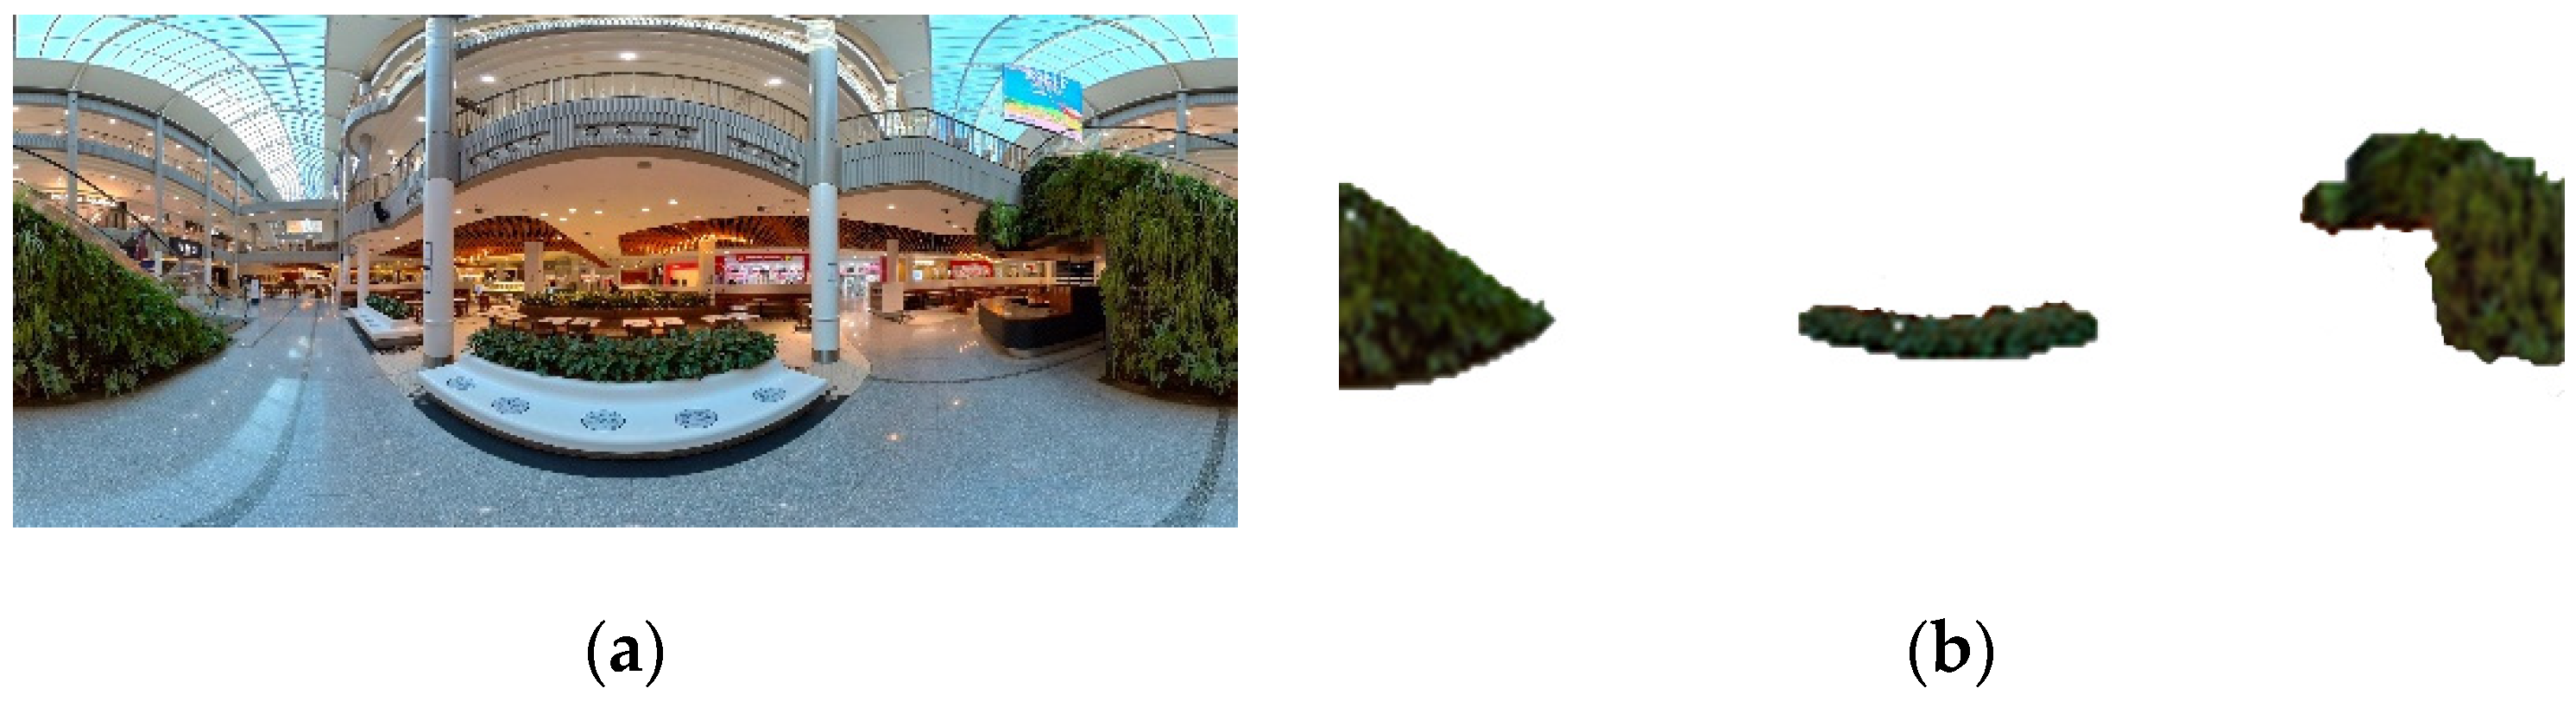
Interior greenery was estimated for each of the 66 interior spaces using the manual and automated methods. Figure 3 illustrates a 360° panoramic image for one interior space (Figure 3a), greenery extracted using the automated method (Figure 3b), and greenery extracted using the manual method (Figure 3c). The estimated percent greenery for the 66 interior spaces extracted using the automated method ranged from 0% to 34.19% cover (mean = 2.3%).
3.2. Differences between Observed and Predicted Greenery for Interior Spaces
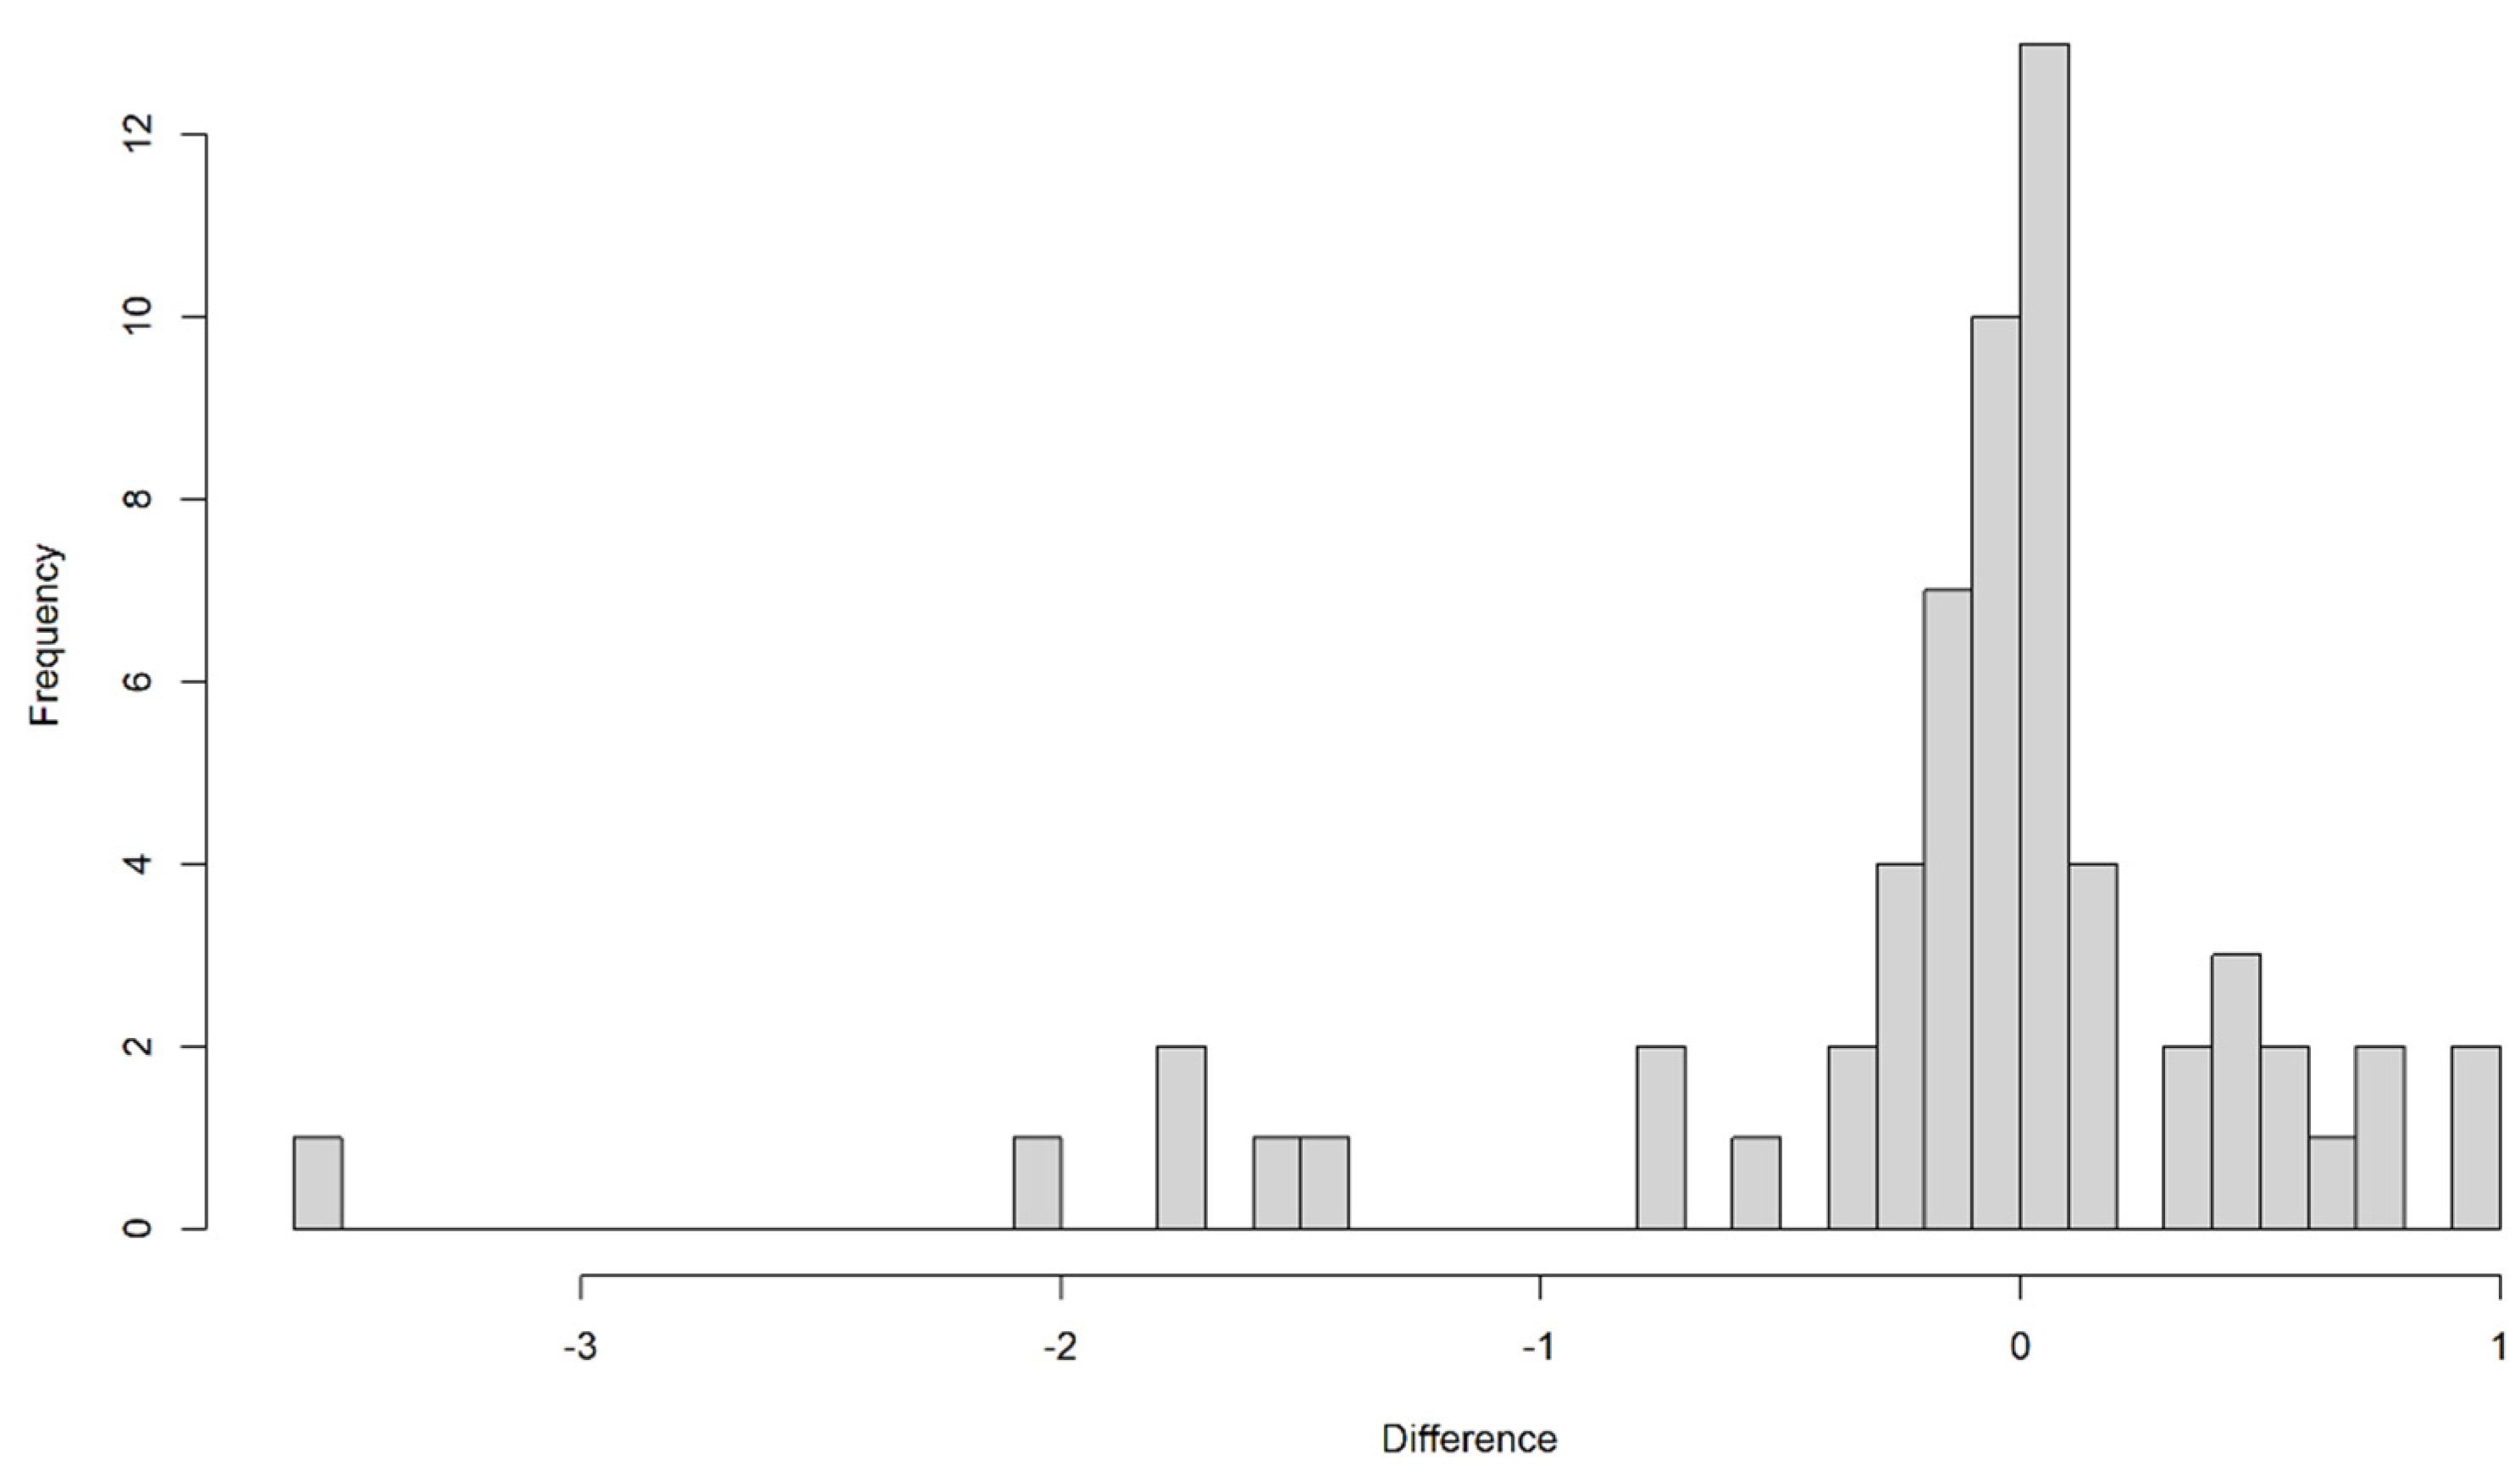
All of the 66 360° panoramic images were used to analyze the automated extraction results using K-means clustering algorithm. There was a strong correlation (r = 0.99, Pearson correlation coefficient) between the amount of greenery estimated for the 66 interior spaces manually and the amount of greenery estimated for these interior spaces using the automated method (Figure 4). However, there were some differences between greenery estimated using the manual and automated methods (Figure 5).
From the fourteen linear regression models we fitted, Model 11, which contained illuminance and interior volume, received the lowest AIC value, indicating the strongest empirical support. This model had an AIC weight of 0.19, indicating there was a 19% chance this was the strongest model selected. However, a further four models had empirical support (i.e., ∆AICc ≤ 2) (Table 3). Predictions from Model 11 indicated that the automated method was more likely to over-predict greenery within interior spaces with larger volume and higher illuminance, although there is greater uncertainty in our predictions (i.e., wider confidence limits) for interior spaces with very large volumes and very high illuminance because of a small number of samples at extreme values for these variables (Figure 6).
4. Discussion
The aims of this study were to develop an automated method to extract interior greenery from 360° panoramic images and evaluate the accuracy of this method. Our results indicate that 360° panoramic images can be used to estimate greenery within interior spaces spanning a range of dimensions with a high level of accuracy.
4.1. The Accuracy of Extraction Results
Our results indicated that there is a strong correlation (r = 0.99) between interior greenery estimated manually and interior greener estimated using a K-means clustering algorithm. However, our results indicated that the accuracy of the automated method declines with the volume and illuminance of interior spaces. This could be because the distance between the camera and greenery affects boundary pixels of greenery during image processing [48], which suggests that the noise increases due to the color mixing of the greenery boundary.
We found that interior spaces with higher illuminance cause greater differences between the two methods. Previous studies [49] have shown that high illuminance can change the appearance of colors in the image-capturing stage. Such color constancy problems in images might relate to shadows, indoor artificial lights, and direct sunlight. However, K-means image segmentation, which is a simple automatically unsupervised classification, tends to lack robustness to illuminance changes [50]. Therefore, when assessing interior greenery with this method, researchers should choose a cloudy day and switch lights off to capture the 360° panoramic images in order to reduce the influence caused by sharp contrasts in illuminance.
4.2. Strengths and Limitations
There are several strengths of our research. First, we focus on the assessment of greenery in interior space from a pedestrian’s perspective, which is not the case for most studies of urban green space [27,38,51]. We established a reliable interior green view index, which could be a comparable parameter measured in future studies with similar aims. Second, it is efficient and affordable to use 360° panoramic images to quantify interior greenery compared with some other methods [52,53,54]. Other conventional electronic devices, such as digital cameras, tablets, and smartphones, usually overlap multiple rectangle images into one panoramic image. This easily produces visible seams due to changes in scene illumination of single rectangle images or spatial alignment errors [55]. The Insta360 One R camera we used makes it less challenging to blend images with seamless edges. Moreover, the K-means clustering algorithm we used to extract greenery from the images was relatively simple and efficient. Considering that artificial green features are hard to distinguish, deep learning algorithms based on a greater number of training datasets could be included as part of the interior greenery segmentation process [56].
However, there are still several concerns that need to be addressed. A 360° panoramic image does not capture greenery from all sites in an interior space. That is, greenery captured by a 360° panoramic image is limited to the greenery that can be seen from a central point. The second issue is the absence of near-infrared bands on RGB images [51]. Different plant species, which can have different effects on wellbeing, cannot be distinguished using RGB imagery. For example, the amount of volatile organic compounds removed by interior greenery varies widely by plant species [57]. These issues could be overcome by capturing interior greenery using near-infrared sensors [58], although these are more expensive than a panoramic camera. Third, we captured 360° panoramic images at a specific time rather than over a period of time. However, this may not be an issue when capturing interior vegetation given its spectral properties are less variables than outdoor vegetation [32].
4.3. Future Directions
Our method for capturing interior greenery has applications for assessing and monitoring greenery within interior spaces. There is increasing interest in how the use of interior greenery may influence human wellbeing [52,59]. Many previous studies have focused on counting the number of plants or leaf area, which does not consider the relationship between the interior greenery and space [60]. Our approach can be used as a tool to help researchers and others to quantify interior greenery accurately and cost-effectively, which is an important first step for exploring associations between interior greenery and human wellbeing.
5. Conclusions
In this study we used 360° panoramic images with a newly proposed iGVI, which are closer to the viewer’s perspective, to assess greenery in interior spaces and compared an automated method for estimating greenery with a manual method. The estimated percent greenery for the 66 interior spaces extracted using the automated method ranged from 0% to 34.2% (mean = 2.3%). There was a high correlation (r = 0.99) between the amount of greenery estimated manually and the amount of greenery estimated for these interior spaces using the automated method. The results indicated that 360° panoramic images classified using an automated method based on the K-means clustering algorithm, can capture interior greenery efficiently and accurately which, in turn, could be employed to monitor or research interior greenery and its association with human wellbeing.
Author Contributions
Conceptualization, J.J., P.G. and C.B.; methodology, J.J. and P.G; data acquisition, J.J.; formal analysis, J.J. and P.G.; writing—original draft preparation, J.J.; writing—review and editing, J.J., P.G. and R.C.; supervision, C.B., P.G. and R.C. All authors have read and agreed to the published version of the manuscript.
Funding
This work was funded by the China Scholarship Council (CSC), grant number 201806510038.
Institutional Review Board Statement
Not applicable.
Informed Consent Statement
Not applicable.
Data Availability Statement
Not applicable.
Acknowledgments
We would like to thank the anonymous reviewers for their thoughtful comments on this manuscript.
Conflicts of Interest
We declare that we have no conflict of interest.
References
- Takano, T.; Nakamura, K.; Watanabe, M. Urban residential environments and senior citizens’ longevity in megacity areas: The importance of walkable green spaces. J. Epidemiol. Community Health 2002, 56, 913–918. [Google Scholar] [CrossRef] [PubMed] [Green Version]
- Ulrich, R.S.; Simons, R.F.; Losito, B.D.; Fiorito, E.; Miles, M.A.; Zelson, M. Stress recovery during exposure to natural and urban environments. J. Environ. Psychol. 1991, 11, 201–230. [Google Scholar] [CrossRef]
- Van den Berg, A.E.; Maas, J.; Verheij, R.A.; Groenewegen, P.P. Green space as a buffer between stressful life events and health. Soc. Sci. Med. 2010, 70, 1203–1210. [Google Scholar] [CrossRef] [PubMed] [Green Version]
- Hayes, S. Estimating the effect of being indoors on total personal exposure to outdoor air pollution. JAPCA 1989, 39, 1453–1461. [Google Scholar] [CrossRef]
- Anand, A.; Phuleria, H.C. Assessment of indoor air quality and housing, household and health characteristics in densely populated urban slums. Environ. Dev. Sustain. 2021. Available online: https://0-link-springer-com.brum.beds.ac.uk/article/10.1007/s10668-021-01923-x (accessed on 10 February 2022).
- Soga, M.; Evans, M.J.; Cox, D.T.; Gaston, K.J. Impacts of the COVID-19 pandemic on human–nature interactions: Pathways, evidence and implications. People Nat. 2021, 3, 518–527. [Google Scholar] [CrossRef]
- Nordin, S.; McKee, K.; Wallinder, M.; von Koch, L.; Wijk, H.; Elf, M. The physical environment, activity and interaction in residential care facilities for older people: A comparative case study. Scand. J. Caring Sci. 2017, 31, 727–738. [Google Scholar] [CrossRef]
- Höppe, P. Different aspects of assessing indoor and outdoor thermal comfort. Energy Build. 2002, 34, 661–665. [Google Scholar] [CrossRef]
- Wong, N.H.; Tan, A.Y.K.; Tan, P.Y.; Sia, A.; Wong, N.C. Perception studies of vertical greenery systems in Singapore. J. Urban Plan. Dev. 2010, 136, 330–338. [Google Scholar] [CrossRef]
- Moya, T.A.; van den Dobbelsteen, A.; Ottele, M.; Bluyssen, P.M. A review of green systems within the indoor environment. Indoor Built Environ. 2019, 28, 298–309. [Google Scholar] [CrossRef]
- Choi, J.-Y.; Park, S.-A.; Jung, S.-J.; Lee, J.-Y.; Son, K.-C.; An, Y.-J.; Lee, S.-W. Physiological and psychological responses of humans to the index of greenness of an interior space. Complementary Ther. Med. 2016, 28, 37–43. [Google Scholar] [CrossRef]
- Ikei, H.; Song, C.; Igarashi, M.; Namekawa, T.; Miyazaki, Y. Physiological and psychological relaxing effects of visual stimulation with foliage plants in high school students. In Advances in Horticultural Science; Torrossa Digital Library: Fiesole, Italy, 2014; pp. 111–116. [Google Scholar]
- Shibata, S.; Suzuki, N. Effects of an indoor plant on creative task performance and mood. Scand. J. Psychol. 2004, 45, 373–381. [Google Scholar] [CrossRef] [PubMed]
- Raanaas, R.K.; Evensen, K.H.; Rich, D.; Sjøstrøm, G.; Patil, G. Benefits of indoor plants on attention capacity in an office setting. J. Environ. Psychol. 2011, 31, 99–105. [Google Scholar] [CrossRef]
- Pegas, P.N.; Alves, C.; Nunes, T.; Bate-Epey, E.; Evtyugina, M.; Pio, C.A. Could houseplants improve indoor air quality in schools? J. Toxicol. Environ. Health Part A 2012, 75, 1371–1380. [Google Scholar] [CrossRef] [PubMed]
- Torpy, F.; Zavattaro, M.; Irga, P. Green wall technology for the phytoremediation of indoor air: A system for the reduction of high CO2 concentrations. Air Qual. Atmos. Health 2017, 10, 575–585. [Google Scholar] [CrossRef]
- Yoo, M.; Lee, E.-H. The Impact of Modulized Interior Landscape on Office Workers’ Psychological Wellbeing-A Pilot Study of Focused on the Office Wall. Korean Inst. Inter. Des. J. 2014, 23, 220–230. [Google Scholar] [CrossRef] [Green Version]
- Smith, A.; Tucker, M.; Pitt, M. Healthy, productive workplaces: Towards a case for interior plantscaping. Facilities 2011, 29, 209–223. [Google Scholar] [CrossRef] [Green Version]
- Qian, Y.; Zhou, W.; Yu, W.; Pickett, S.T. Quantifying spatiotemporal pattern of urban greenspace: New insights from high resolution data. Landsc. Ecol. 2015, 30, 1165–1173. [Google Scholar] [CrossRef]
- Li, S.; Dai, L.; Wang, H.; Wang, Y.; He, Z.; Lin, S. Estimating leaf area density of individual trees using the point cloud segmentation of terrestrial LiDAR data and a voxel-based model. Remote Sens. 2017, 9, 1202. [Google Scholar] [CrossRef] [Green Version]
- Béland, M.; Widlowski, J.-L.; Fournier, R.A. A model for deriving voxel-level tree leaf area density estimates from ground-based LiDAR. Environ. Model. Softw. 2014, 51, 184–189. [Google Scholar] [CrossRef]
- Béland, M.; Widlowski, J.-L.; Fournier, R.A.; Côté, J.-F.; Verstraete, M.M. Estimating leaf area distribution in savanna trees from terrestrial LiDAR measurements. Agric. For. Meteorol. 2011, 151, 1252–1266. [Google Scholar] [CrossRef]
- Moudrý, V.; Gdulová, K.; Fogl, M.; Klápště, P.; Urban, R.; Komárek, J.; Moudrá, L.; Štroner, M.; Barták, V.; Solský, M. Comparison of leaf-off and leaf-on combined UAV imagery and airborne LiDAR for assessment of a post-mining site terrain and vegetation structure: Prospects for monitoring hazards and restoration success. Appl. Geogr. 2019, 104, 32–41. [Google Scholar] [CrossRef]
- Wang, Y.; Weinacker, H.; Koch, B. A lidar point cloud based procedure for vertical canopy structure analysis and 3D single tree modelling in forest. Sensors 2008, 8, 3938. [Google Scholar] [CrossRef] [PubMed] [Green Version]
- Bremer, M.; Rutzinger, M.; Wichmann, V. Derivation of tree skeletons and error assessment using LiDAR point cloud data of varying quality. ISPRS J. Photogramm. Remote Sens. 2013, 80, 39–50. [Google Scholar] [CrossRef]
- Meitner, M.J. Scenic beauty of river views in the Grand Canyon: Relating perceptual judgments to locations. Landsc. Urban Plan. 2004, 68, 3–13. [Google Scholar] [CrossRef]
- Yang, J.; Zhao, L.; Mcbride, J.; Gong, P. Can you see green? Assessing the visibility of urban forests in cities. Landsc. Urban Plan. 2009, 91, 97–104. [Google Scholar] [CrossRef]
- Yu, X.; Qi, W. Measuring vegetation greenery in park using iPhone panoramic image and a new green vegetation extraction index. Urban For. Urban Green. 2021, 65, 127310. [Google Scholar] [CrossRef]
- Abbass, O.A.; Sailor, D.J.; Gall, E.T. Effectiveness of indoor plants for passive removal of indoor ozone. Build. Environ. 2017, 119, 62–70. [Google Scholar] [CrossRef]
- Gunawardena, K.R.; Steemers, K. Living wall influence on microclimates: An indoor case study. In Journal of Physics: Conference Series; IOP Publishing: Bristol, UK, 2019; p. 012188. [Google Scholar]
- Mousavi Samimi, P.; Shahhosseini, H. Evaluation of resident’s indoor green space preferences in residential complexes based on plants’ characteristics. Indoor Built Environ. 2020, 30, 859–868. [Google Scholar] [CrossRef]
- Salamone, F.; Barozzi, B.; Danza, L.; Ghellere, M.; Meroni, I. Correlation between Indoor Environmental Data and Biometric Parameters for the Impact Assessment of a Living Wall in a ZEB Lab. Sensors 2020, 20, 2523. [Google Scholar] [CrossRef]
- Xiao, L.; Wang, W.; Ren, Z.; Fu, Y.; Lv, H.; He, X. Two-city street-view greenery variations and association with forest attributes and landscape metrics in NE China. Landsc. Ecol. 2021, 36, 1261–1280. [Google Scholar] [CrossRef]
- Rzotkiewicz, A.; Pearson, A.L.; Dougherty, B.V.; Shortridge, A.; Wilson, N. Systematic review of the use of Google Street View in health research: Major themes, strengths, weaknesses and possibilities for future research. Health Place 2018, 52, 240–246. [Google Scholar] [CrossRef] [PubMed]
- Berenguel-Baeta, B.; Bermudez-Cameo, J.; Guerrero, J.J. OmniSCV: An omnidirectional synthetic image generator for computer vision. Sensors 2020, 20, 2066. [Google Scholar] [CrossRef] [PubMed] [Green Version]
- Tsai, V.J.; Chang, C.-T. Three-dimensional positioning from Google street view panoramas. IET Image Process. 2013, 7, 229–239. [Google Scholar] [CrossRef] [Green Version]
- Yin, L.; Wang, Z. Measuring visual enclosure for street walkability: Using machine learning algorithms and Google Street View imagery. Appl. Geogr. 2016, 76, 147–153. [Google Scholar] [CrossRef]
- Ki, D.; Lee, S. Analyzing the effects of Green View Index of neighborhood streets on walking time using Google Street View and deep learning. Landsc. Urban Plan. 2021, 205, 103920. [Google Scholar] [CrossRef]
- Xue, J.; Su, B. Significant remote sensing vegetation indices: A review of developments and applications. J. Sens. 2017, 2017, 1353691. [Google Scholar] [CrossRef] [Green Version]
- Krzywinski, M. Image Color Summarizer: RBG, HSV, LCH & Lab Image Color Statistics and Clustering—Simple and Easy. 2018. Available online: http://mkweb.bcgsc.ca/colorsummarizer/?analyze (accessed on 16 June 2021).
- Dhanachandra, N.; Manglem, K.; Chanu, Y.J. Image segmentation using K-means clustering algorithm and subtractive clustering algorithm. Procedia Comput. Sci. 2015, 54, 764–771. [Google Scholar] [CrossRef] [Green Version]
- Hartigan, J.A.; Wong, M.A. Algorithm AS 136: A k-means clustering algorithm. J. R. Stat. Soc. Ser. C (Appl. Stat.) 1979, 28, 100–108. [Google Scholar] [CrossRef]
- Zheng, X.; Lei, Q.; Yao, R.; Gong, Y.; Yin, Q. Image segmentation based on adaptive K-means algorithm. EURASIP J. Image Video Process. 2018, 2018, 68. [Google Scholar] [CrossRef]
- Dong, R.; Zhang, Y.; Zhao, J. How green are the streets within the sixth ring road of Beijing? An analysis based on tencent street view pictures and the green view index. Int. J. Environ. Res. Public Health 2018, 15, 1367. [Google Scholar] [CrossRef] [Green Version]
- Lux Meter (Light Meter). Available online: https://play.google.com/store/apps/details?id=com.tsang.alan.lightmeter&hl=en_US&gl=US (accessed on 10 June 2021).
- Wada, Y.; Kashiwagi, N. Selecting statistical models with information statistics. J. Dairy Sci. 1990, 73, 3575–3582. [Google Scholar] [CrossRef]
- Team, R.C. R: A Language and Environment for Statistical Computing, Version 4.2.0; GBIF: Copenhagen, Denmark, 2013. [Google Scholar]
- Ding, Y.; Fukuda, T.; Yabuki, N.; Michikawa, T.; Motamedi, A. Automatic Measurement System of Visible Greenery Ratio Using Augmented Reality; CumInCAD: Vienna, Austria, 2016. [Google Scholar]
- Bascle, B.; Bernier, O.; Lemaire, V. Learning invariants to illumination changes typical of indoor environments: Application to image color correction. Int. J. Imaging Syst. Technol. 2007, 17, 132–142. [Google Scholar] [CrossRef]
- Valero, E.M.; Nieves, J.L.; Plata, C.; Romero, J. Unsupervised classification algorithms applied to rgb data as a preprocessing step for reflectance estimation in natural scenes. In Proceedings of the Conference on Colour in Graphics, Imaging, and Vision, Terrassa, Spain, 9–13 June 2008; Society for Imaging Science and Technology: Springfield, Virginia, 2008; pp. 523–526. [Google Scholar]
- Li, X.; Zhang, C.; Li, W.; Ricard, R.; Meng, Q.; Zhang, W. Assessing street-level urban greenery using Google Street View and a modified green view index. Urban For. Urban Green. 2015, 14, 675–685. [Google Scholar] [CrossRef]
- Han, K.-T. Effects of indoor plants on the physical environment with respect to distance and green coverage ratio. Sustainability 2019, 11, 3679. [Google Scholar] [CrossRef] [Green Version]
- Yang, D.S.; Son, K.-C.; Kays, S.J. Volatile organic compounds emanating from indoor ornamental plants. HortScience 2009, 44, 396–400. [Google Scholar] [CrossRef] [Green Version]
- Irga, P.; Torpy, F.; Burchett, M. Can hydroculture be used to enhance the performance of indoor plants for the removal of air pollutants? Atmos. Environ. 2013, 77, 267–271. [Google Scholar] [CrossRef]
- Xiong, Y.; Pulli, K. Fast panorama stitching for high-quality panoramic images on mobile phones. IEEE Trans. Consum. Electron. 2010, 56, 298–306. [Google Scholar] [CrossRef] [Green Version]
- Stubbings, P.; Peskett, J.; Rowe, F.; Arribas-Bel, D. A hierarchical urban forest index using street-level imagery and deep learning. Remote Sens. 2019, 11, 1395. [Google Scholar] [CrossRef] [Green Version]
- Liu, Y.-J.; Mu, Y.-J.; Zhu, Y.-G.; Ding, H.; Arens, N.C. Which ornamental plant species effectively remove benzene from indoor air? Atmos. Environ. 2007, 41, 650–654. [Google Scholar] [CrossRef]
- Erickson, S.J.; Godavarty, A. Hand-held based near-infrared optical imaging devices: A review. Med. Eng. Phys. 2009, 31, 495–509. [Google Scholar] [CrossRef]
- Thatcher, A.; Adamson, K.; Bloch, L.; Kalantzis, A. Do indoor plants improve performance and well-being in offices? Divergent results from laboratory and field studies. J. Environ. Psychol. 2020, 71, 101487. [Google Scholar] [CrossRef]
- Persiani, S.G. Benefits of Using Plants in Indoor Environments: Exploring Common Research Gaps. Architecture 2021, 1, 8. [Google Scholar] [CrossRef]
Figure 1.
Views of interior green spaces: (a) a vertical garden in an atrium and (b) an indoor garden in corridors.
Figure 1.
Views of interior green spaces: (a) a vertical garden in an atrium and (b) an indoor garden in corridors.

Figure 2.
360° panoramic image in interior space: (a) original image and (b) cropped image.

Figure 3.
The results of greenery extraction. (a) the original 360° panoramic image, (b) automated extraction results (iGVI = 13.93%) using K-means clustering algorithm, and (c) manual extraction results (iGVI = 12.18%).
Figure 3.
The results of greenery extraction. (a) the original 360° panoramic image, (b) automated extraction results (iGVI = 13.93%) using K-means clustering algorithm, and (c) manual extraction results (iGVI = 12.18%).


Figure 4.
The relationship between the cover of greenery (%) for each interior space estimated manually (x-axis) and estimated using the automated method (y-axis). The solid line represents a perfect correlation (r = 1.0).
Figure 4.
The relationship between the cover of greenery (%) for each interior space estimated manually (x-axis) and estimated using the automated method (y-axis). The solid line represents a perfect correlation (r = 1.0).

Figure 5.
A histogram of differences for estimates of greenery for interior spaces obtained from the manual and automated methods.
Figure 5.
A histogram of differences for estimates of greenery for interior spaces obtained from the manual and automated methods.

Figure 6.
Predicted differences (mean ±95% confidence interval) for greenery within interior spaces estimated from 360° panoramic images using the manual and automated methods with changes in (a) interior volume (m3) and (b) illuminance (lux). Predictions were made using Model 11 in Table 3, which is the linear regression model with the strongest empirical support (i.e., lowest ∆AICc value).


Table 1.
Variables measured for each interior space where 360° panoramic images were captured.
| Variable | Definition |
|---|---|
| length | length of interior space |
| width | width of interior space |
| height | height of interior space |
| area | total floor area of interior space calculated from its interior surfaces |
| volume | measurement of a three-dimensional shape that is enclosed by a closed area |
| illuminance | total luminous flux incident on a surface |
| type | several specific areas or design settings related to social behavior |
Table 2.
Variables included in the 14 linear regression models that we compared to evaluate the automated method we developed to extract interior greenery.
Table 2.
Variables included in the 14 linear regression models that we compared to evaluate the automated method we developed to extract interior greenery.
| Model | Variable |
|---|---|
| 1 | illuminance |
| 2 | width |
| 3 | length |
| 4 | Area |
| 5 | volume |
| 6 | Type |
| 7 | Illuminance + width |
| 8 | Illuminance + width + length |
| 9 | Illuminance + width + length + height |
| 10 | Illuminance + area |
| 11 | illuminance + volume |
| 12 | Illuminance + type |
| 13 | Illuminance + type + width |
| 14 | Illuminance + type + width + length |
Table 3.
Linear regression models with empirical support (i.e., ∆AICc ≤ 2) that were used to predict differences in greenery for interior spaces estimated using manual and automated methods. A “+” symbol indicates the variable was included in the model.
Table 3.
Linear regression models with empirical support (i.e., ∆AICc ≤ 2) that were used to predict differences in greenery for interior spaces estimated using manual and automated methods. A “+” symbol indicates the variable was included in the model.
| Model | Width | Length | Area | Volume | Illuminance | ∆AICc |
|---|---|---|---|---|---|---|
| 11 | + | + | 0 | |||
| 5 | + | 0.3976 | ||||
| 4 | + | 0.7893 | ||||
| 10 | + | + | 1.0351 | |||
| 8 | + | + | + | 1.7755 |
Publisher’s Note: MDPI stays neutral with regard to jurisdictional claims in published maps and institutional affiliations. |
© 2022 by the authors. Licensee MDPI, Basel, Switzerland. This article is an open access article distributed under the terms and conditions of the Creative Commons Attribution (CC BY) license (https://creativecommons.org/licenses/by/4.0/).
Share and Cite
MDPI and ACS Style
Jiang, J.; Brack, C.; Coe, R.; Gibbons, P. Rapidly Quantifying Interior Greenery Using 360° Panoramic Images. Forests 2022, 13, 602. https://0-doi-org.brum.beds.ac.uk/10.3390/f13040602
AMA Style
Jiang J, Brack C, Coe R, Gibbons P. Rapidly Quantifying Interior Greenery Using 360° Panoramic Images. Forests. 2022; 13(4):602. https://0-doi-org.brum.beds.ac.uk/10.3390/f13040602
Chicago/Turabian StyleJiang, Junzhiwei, Cris Brack, Robert Coe, and Philip Gibbons. 2022. "Rapidly Quantifying Interior Greenery Using 360° Panoramic Images" Forests 13, no. 4: 602. https://0-doi-org.brum.beds.ac.uk/10.3390/f13040602
Note that from the first issue of 2016, this journal uses article numbers instead of page numbers. See further details here.