Article

Variation in Soil Bacterial and Fungal Community Composition at Different Successional Stages of a Broad-Leaved Korean Pine Forest in the Lesser Hinggan Mountains

1
Key Laboratory for Sustainable Forest Ecosystem Management-Ministry of Education, School of Forestry, Northeast Forestry University, Harbin 150040, China
2
Pakistan Forest Institute (PFI), Peshawar 25000, Khyber Pakhtunkhwa, Pakistan
*
Author to whom correspondence should be addressed.
Submission received: 21 March 2022 / Revised: 12 April 2022 / Accepted: 14 April 2022 / Published: 16 April 2022
(This article belongs to the Section Forest Ecology and Management)

Abstract

:
Soil microorganisms are an integral part of the soil and are highly sensitive to environmental changes. The shift in plant community and soil properties following forest succession may cause differences in soil bacterial and fungal community composition. Some studies suggested following the succession of the community, the species composition tends to switch from r-strategy groups to k-strategy groups. However, generalization on the changing pattern has not been worked out. Three forests at an early-, intermediate-, and late-stage (ES, IS, LS) of the succession of broad-leaved Korean pine forest in the Lesser Hinggan Mountains were surveyed to study the variation in soil bacterial and fungal community composition as the succession proceeds. Soil microbial community composition and related soil factors were analyzed by systematic sampling. Significant differences in soil microbial community composition were detected between forests at different stages. The bacterial diversity increased, while the fungal diversity decreased (p < 0.05) from the early to the late successional forest. The fungi to bacteria ratio (F/B) and the (Actinobacteria + Acidobacteria) to (Proteobacteria + Bacteroidetes) ratio increased substantially with succession (p < 0.05). At the phylum level, Bacteroidetes, Ascomycota and Mortierellomycota were dominant in the ES forest, while Actinobacteria and Basidiomycota were prevalent in the LS forest. At the class level, Gammaproteobacteria, Acidobacteriia, Bacteroidia, Sordariomycetes and Mortierellomycetes were dominant in the ES forest, whereas Subgroup_6, Agaricomycetes, Geminibasidiomycetes and Tremellomycetes were dominant in the LS forest. Soil water content (SWC) and available phosphorus (AP) had significant effects on the bacterial community composition (p < 0.05). Soil organic carbon (SOC), total nitrogen (TN), the carbon–nitrogen ratio (C/N), total potassium (TK) and SWC had significant effects on the fungal community composition (p < 0.05). SOC and TN were positively correlated with r-strategy groups (p < 0.05) and were significantly negatively correlated with k-strategy groups (p < 0.05). Our results suggest that the soil bacterial and fungal community composition changed significantly in forests across the successional stages, and the species composition switched from r-strategy to k-strategy groups. The bacterial and fungal community diversity variation differed in forests across the successional stages. The changes in soil organic carbon and nitrogen content resulted in the shifting of microbial species with different ecological strategies.

1. Introduction

The term forest succession describes a forest community change on widely different scales in space and time [1,2]. Soil properties and plant community composition evolves dramatically in a forest over time [3,4]. Soil bacterial and fungal communities are essential to soil components and are highly sensitive to environmental changes [5,6]. Thus, the composition of bacterial and fungal communities in a forest may be influenced by forest succession [7,8]. Some studies suggested following the succession of the community as the species composition varies substantially [9,10]. However, the generalization of the changing pattern has not been clear. New insights into ecosystem function and succession mechanism will be gained with a study focusing on the variation of soil microbial community composition and the related factors following forest succession.
Microorganisms may be classified into copiotrophic and oligotrophic groups based on their capability for organic carbon mineralization and growth rate [5,7,11,12], corresponding to r-strategy and k-strategy groups, respectively [8]. Previous studies have shown that bacteria and fungi prefer the r-strategy and k-strategy groups, respectively [13,14]. Based on a meta-analysis, Zhou et al. [9] found that r-strategy groups were dominant in the early successional forests, and k-strategy groups were prevalent in the late successional forests. Bacterial and fungal community composition differs significantly in forests across the successional stages. The soil bacterial groups Actinobacteria, Proteobacteria and Acidobacteria, were essential [15,16,17]. Most Actinobacteria are Gram-positive bacteria and prefer to break down recalcitrant organic matter, e.g., woody debris [18]. Proteobacteria are typical r-strategy bacteria, closely related to the decomposition of simple organic matter [16]. Acidobacteria generally utilizes recalcitrant organic matter, tend to the k-strategy groups, and have acidophilic solid characteristics [11]. Therefore, with the forest succession, the increase in recalcitrant organic matter may reduce the growth of r-strategy communities and promote the development of k-strategy communities in forests [9,10,19]. However, Ren et al. [20], Zhong et al. [21] and Morrissey et al. [7] documented opposite results. In contrast, most studies reported that the fungal community composition switched from r-strategy Ascomycota in the early stages to k-strategy Basidiomycota in the late stages [10,17,22]. Still, some studies believe that the fungal community composition did not change obviously in forests with different successional stages [20,21].
Soil microbial communities are susceptible to environmental changes, and their structure and function vary due to changes in the environment [9,23]. It was reported that the composition and diversity of soil microbial communities are closely related to soil properties [24,25]. Soil nutrient levels, pH and soil texture content were revealed to be the most important elements influencing soil bacterial and fungal communities [8,26,27,28]. Generally, the changes in soil nutrients are the dominant factor determining soil microbial community structure variation in forests [5,8]. Van Der Heijden et al. [29] observed that soil bacterial communities are more sensitive to soil nutrients than fungal communities because fungal communities have high nutrient competitiveness and low nutrient requirements. Secondly, based on the differences in the capability of carbon mineralization, r-strategy species prefer high-quality environments, while k-strategy species are highly competitive in low-quality environments [3,21].
On the other hand, soil pH is the best predictor of changes in Acidobacteria community composition in the largescale geographic studies [30,31]. The content of sand and clay also determines the variation of soil microbial community structure [20,28]. In addition, some particular groups may also be affected by the soil phosphorus [22,28,32] or soil water content [32,33]. Although the change of the soil microbial community composition in forests with different successional stages was widely reported [6,26,34], the key related soil factors influencing soil bacterial and fungal groups are not clear.
The Pinus koraiensis, dominated by broad-leaved trees (known as the broad-leaved Korean pine forest), is the apex plant community in northeast China [35,36,37]. The vast majority of work on forest succession has concentrated on changes in plant composition [36,38], which significantly restricts our knowledge of the succession patterns of bacterial and fungal communities, as well as ecosystem function throughout the forest succession process. This study aimed to investigate the variation in the makeup of soil bacterial and fungal communities and reveal the key influencing factors of the changes in soil bacterial and fungal communities in forests following different successional stages. Considering these two hypotheses, we focus on the following: (1) the composition of soil bacterial and fungal communities switched from r-strategy groups in the early successional forest to k-strategy groups in the late-successional forest, and (2) the soil organic carbon and nitrogen content were the key factors affecting the transformation of r-strategy groups and k-strategy groups.

2. Materials and Methods

2.1. Description of the Study Area

The study was conducted at Liangshui National Nature Reserve for Broad-leaved Korean Pine Forest, Heilongjiang Province, China (128°47′–128°57′ E, 47°6′–47°16′ N). The climate is temperate continental monsoon, with an annual average temperature of −0.3 °C, a high temperature of 34.9 °C, and a minimum temperature of −44.5 °C. The average annual precipitation is 680 mm, mainly from June to August. The main soil is the dark brown forest soil (Haplic Luvisol), which originated from the weathering material of granite and gneiss [38]. Broad-leaved Korean pine forest is a significant forest community, composed of Pinus koraiensis as the dominant tree species, mixed with other species, including Quercus mongolica, Acer mono, Juglans mandshurica, Phellodendron amurense, Picea koraiensis, Fraxinus mandshurica, Tilia amurensis, Abies nephlolepis, Betula costata and Picea jezoensis [37]. Logging disturbance and recovering the original forest in the last century produced second-growth forests in different successional stages. Three forests were chosen based on the successional stage, including the late successional stage forest (dominated by Pinus koraiensis), the intermediate successional stage forest (dominated by Fraxinus manshurica) and the early successional stage forest, i.e., dominated by Populus davidiana and Betula platyphylla.

2.2. Plots Setting, Survey and Sampling

In August 2019, three plots (20 m × 20 m), at least 50 m apart, were set up in each forest stand with different successional stages. Tree species, height and DBH (diameter at breast height) were surveyed. The canopy closure was determined by ocular estimates [39]. The stand age data were from previous works [37,40] (Table 1). In each plot, three subplots (2 m × 2 m), at least 5 m apart, were set up randomly. Before sampling, litter on the soil surface in each subplot was removed, and the soil sampler was cleaned with 95% alcohol. Three samples (0–10 cm in depth) were collected from each subplot, the nine samples from each plot were evenly mixed and a total of 1 kg soil sample was taken. Soil samples were stored in a cooler and brought to the lab. The samples were sieved through a 2 mm sieve to remove debris and gravel. Part of the sample was stored in a refrigerator (−80 °C) for DNA extraction; the other part was air-dried for soil physical, chemical, pH and enzyme activity analysis.

2.3. Soil Characteristics and Enzyme Activity Measurements

A pH meter was used to determine the pH of the soil (where the water to soil ratio was 2.5:1) [41]. The gravimetric method determined soil water content (SWC%). Soil organic carbon (SOC) was assayed using the H2SO4–K2Cr2O7 method [10]. Soil total nitrogen (TN) was measured by dry combustion method using an Elemental Analyzer (Elementer VARIO Macro, Germany). Soil total phosphorus (TP) was measured by the colorimetric method after digestion with H2SO4 and HClO4 [42]. Soil available phosphorus (AP) was extracted with 0.5 mol/L NaHCO3 and then measured colorimetrically at 700 nm [42]. The atomic absorption photometry method measured total soil potassium (TK) [42]. The enzyme activities of sucrase (Suc), urease (Ure) and acid phosphatase (Pho) were determined following a previous study [41,43]. Briefly, Suc activity was measured using the colorimetric method of 3,5-dinitrosalicylic acid (mg glucose g−1 24 h−1). Pho activity was measured by the Phenyldisodium phosphate colorimetric method (mg phenol g−1 24 h−1). Ure activity was assayed by sodium phenol–sodium hypochlorite colorimetric method (mg NH3-N g−1 24 h−1).

2.4. DNA Extraction, PCR Amplification, and Illumina Sequencing

After the manufacturer’s instructions, total genomic DNA samples were extracted with an OMEGA Soil DNA Kit (D5625-01) (Omega Bio-Tek, Norcross, GA, USA). The nanodrop NC-2000 spectrophotometer (Thermo Fisher Scientific, NC-2000, Waltham, MA, USA) and agarose gel electrophoresis (Beijing Liuyi, DYY-6C, Beijing, China) were used for the extraction of DNA in terms of quantity and quality. PCR primers in the V3–V4 region of bacterial and ITS_V1 region of fungi were selected to identify the bacterial and fungal communities in the samples, respectively. We used the forward primer (F: ACTCCTACGGGAGGCAGCA) and the reverse primer (R: GGACTACHVGGGTWTCTAAT) for bacterial 16S rRNA sequencing. In contrast, the forward primer (F: GGAAGTAAAAGTCGTAACAAGG) and the reverse (R: GCTGCGTTCTTCATCGATGC) for fungal ITS sequencing. The amplification was performed as manufacture follows: initial denaturation at 98 °C for 2 min, followed by denaturation 98 °C for 15 s, annealing at 55 °C for 30 s and extension at 72 °C for 30 s, final extension at 72 °C for 5 min, and end at 10 °C hold for 25–30 cycles. The Quant-iT PicoGreen dsDNA Assay Kit (Invitrogen, P7589, New York, NY, USA) was used for PCR amplicons. The Illumina MiSeq sequencing was performed on a Novaseq 6000 (PE250) platform by Shanghai Personal Biotechnology Cp. Ltd. (Shanghai, China). According to the official tutorials, microbiome bioinformatics was performed with QIIME 2 Version 2019.4, and detailed operation steps are consistent with Bolyen et al. [44]. Raw sequence data were generally processed according to Callahan et al. [45]. In addition, the index of Chao1 [46], Observed_species, Shannon [47] and Simpson [48] were used for the alpha-diversity analysis of soil bacterial and fungal communities, which were calculated in QIIME 2 software (Version 2019.4).

2.5. Statistical Analyses

The homogeneity of variance was tested using Levene’s test. The differences in pH, SOC, TN, C: N, TP, TK, AP, Suc, Ure and Pho in the soil in three forests were tested using a one-way analysis of variance (ANOVA) (SPSS 19.0, Chicago, IL, USA). Pearson correlation was used to find the relationships between alpha-diversity metrics and forest soil properties with three successional stages. However, LEfSe, i.e., linear discriminant analysis effect size method, was used to examine the enriched groups of bacterial and fungal communities in forests with three successional stages, with the standard of LDA > 3.5 and p < 0.05 for the bacterial community and LDA > 4 and p < 0.05 for the fungal community (Available online: https://www.genescloud.cn/analysisProcess/differenceanalysis/LEfSe (accessed on 9 April 2022)) [49]. We investigated the relationships between changes in soil microbial populations and soil properties in three forests using redundancy analysis (RDA). RDA was evaluated by the “vegan” package in R (version 4.0.0) [50]. Furthermore, we examine the relationship between soil factors and soil microbial taxonomic composition by Pearson correlation analysis.

3. Results

3.1. Change in Soil Properties in the Forest with Different Successional Phases

The soil physicochemical characteristics and enzyme activity altered dramatically as the successional stages proceeded (Table 2). Soil organic carbon (SOC), nitrogen (TN) and urease (Ure) concentration increased firstly and then decreased significantly from the early to the late successional forest (p < 0.05). In the intermediate successional (IS) forest, SOC, TN and Ure concentration were substantially higher than in other stages (p < 0.05) (Table 2). The carbon to nitrogen ratio (C/N) and total soil phosphorus (TP) concentration in the soil showed a significant decrease (p < 0.05) in the intermediate-stage (Table 2). At the same time, in the early and late successional stages, the C/N significantly increased (p < 0.05), while the TP remained unchanged, respectively (Table 2). However, soil pH, total soil potassium (TK) and sucrase (Suc) concentration increased significantly from the early to the late successional forest (p < 0.05) (Table 2). In contrast, soil water content (SWC) and acid phosphatase concentration (Pho) decreased significantly (p < 0.05) (Table 2). In contrast, soil available phosphorus concentration (AP) did not change considerably in the forest with different successional stages (Table 2).

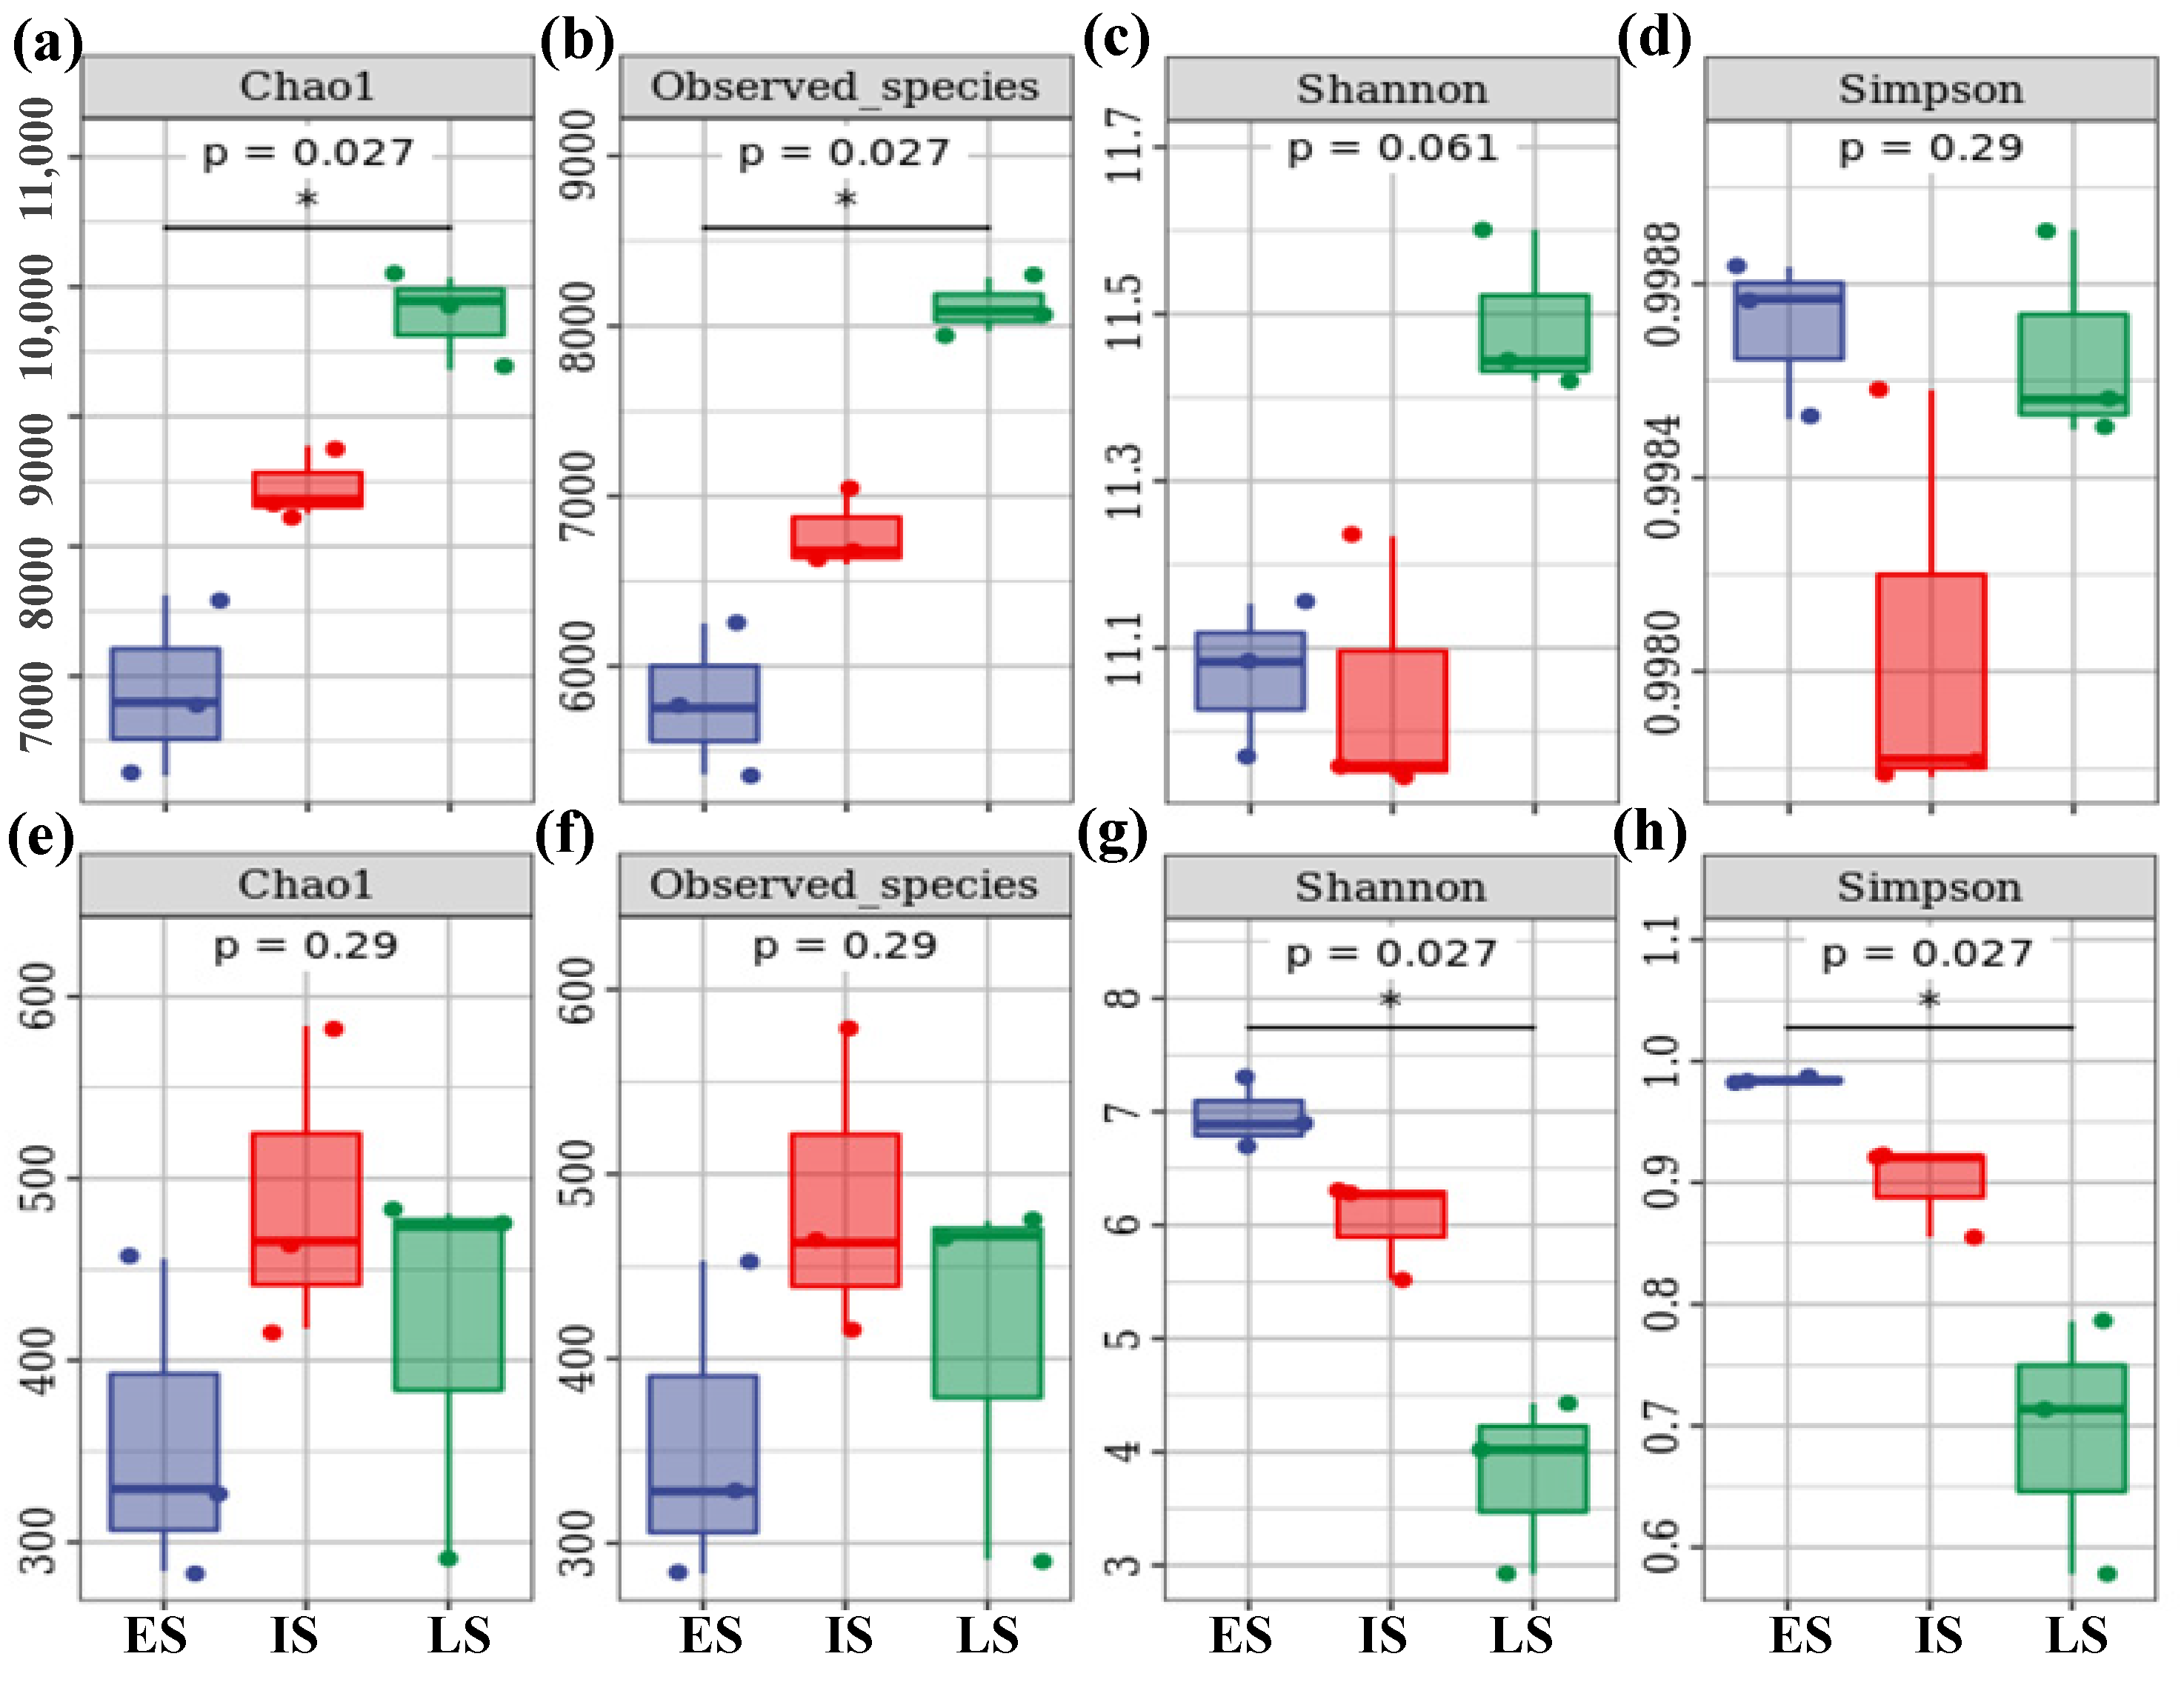
3.2. The Variation in Soil Bacterial and Fungal Alpha-Diversity at Various Successional Phases

The alpha-diversity of soil bacterial and fungal communities varied significantly in the forest with three successional stages (Figure 1). The richness (Chao1 and Observed_species index) of soil bacteria increased dramatically from the early to the late successional forest (p < 0.05) (Figure 1a,b). In contrast, the bacterial diversity (Shannon and Simpson index) had no significant changes in the three forests (p > 0.05) (Figure 1c,d). However, the soil fungal community diversity significantly decreased from the early to the late successional forest (p < 0.05) (Figure 1e,f), while the richness of fungi had no significant changes in the three forests (p > 0.05) (Figure 1g,h).
Soil physicochemical properties and enzyme activities were more closely related to soil bacterial alpha-diversity than that of fungi (Figure 2). The soil bacterial Chao1 and Observed_species index was negatively associated with SOC, TN, SWC and Pho, while it is positively related to soil pH, Suc and TK (p < 0.05) (Figure 2). The soil bacterial Shannon index was negatively correlated to SOC and TN, while it is positively correlated to C/N, TK and soil pH in the three forests (p < 0.05) (Figure 2). The soil bacterial Simpson index was negatively correlated to Ure, while positively correlated to TP in the three forests (p < 0.05) (Figure 2). However, fungal community diversity is positively associated with SOC, TN and SWC (p < 0.05) while negatively related to TK and soil pH in the forests (p < 0.05). At the same time, there was no correlation between fungal richness and soil physicochemical properties (p > 0.05) (Figure 2). In addition, soil enzyme activity did not affect fungal alpha-diversity in the three forests (p > 0.05) (Figure 2).

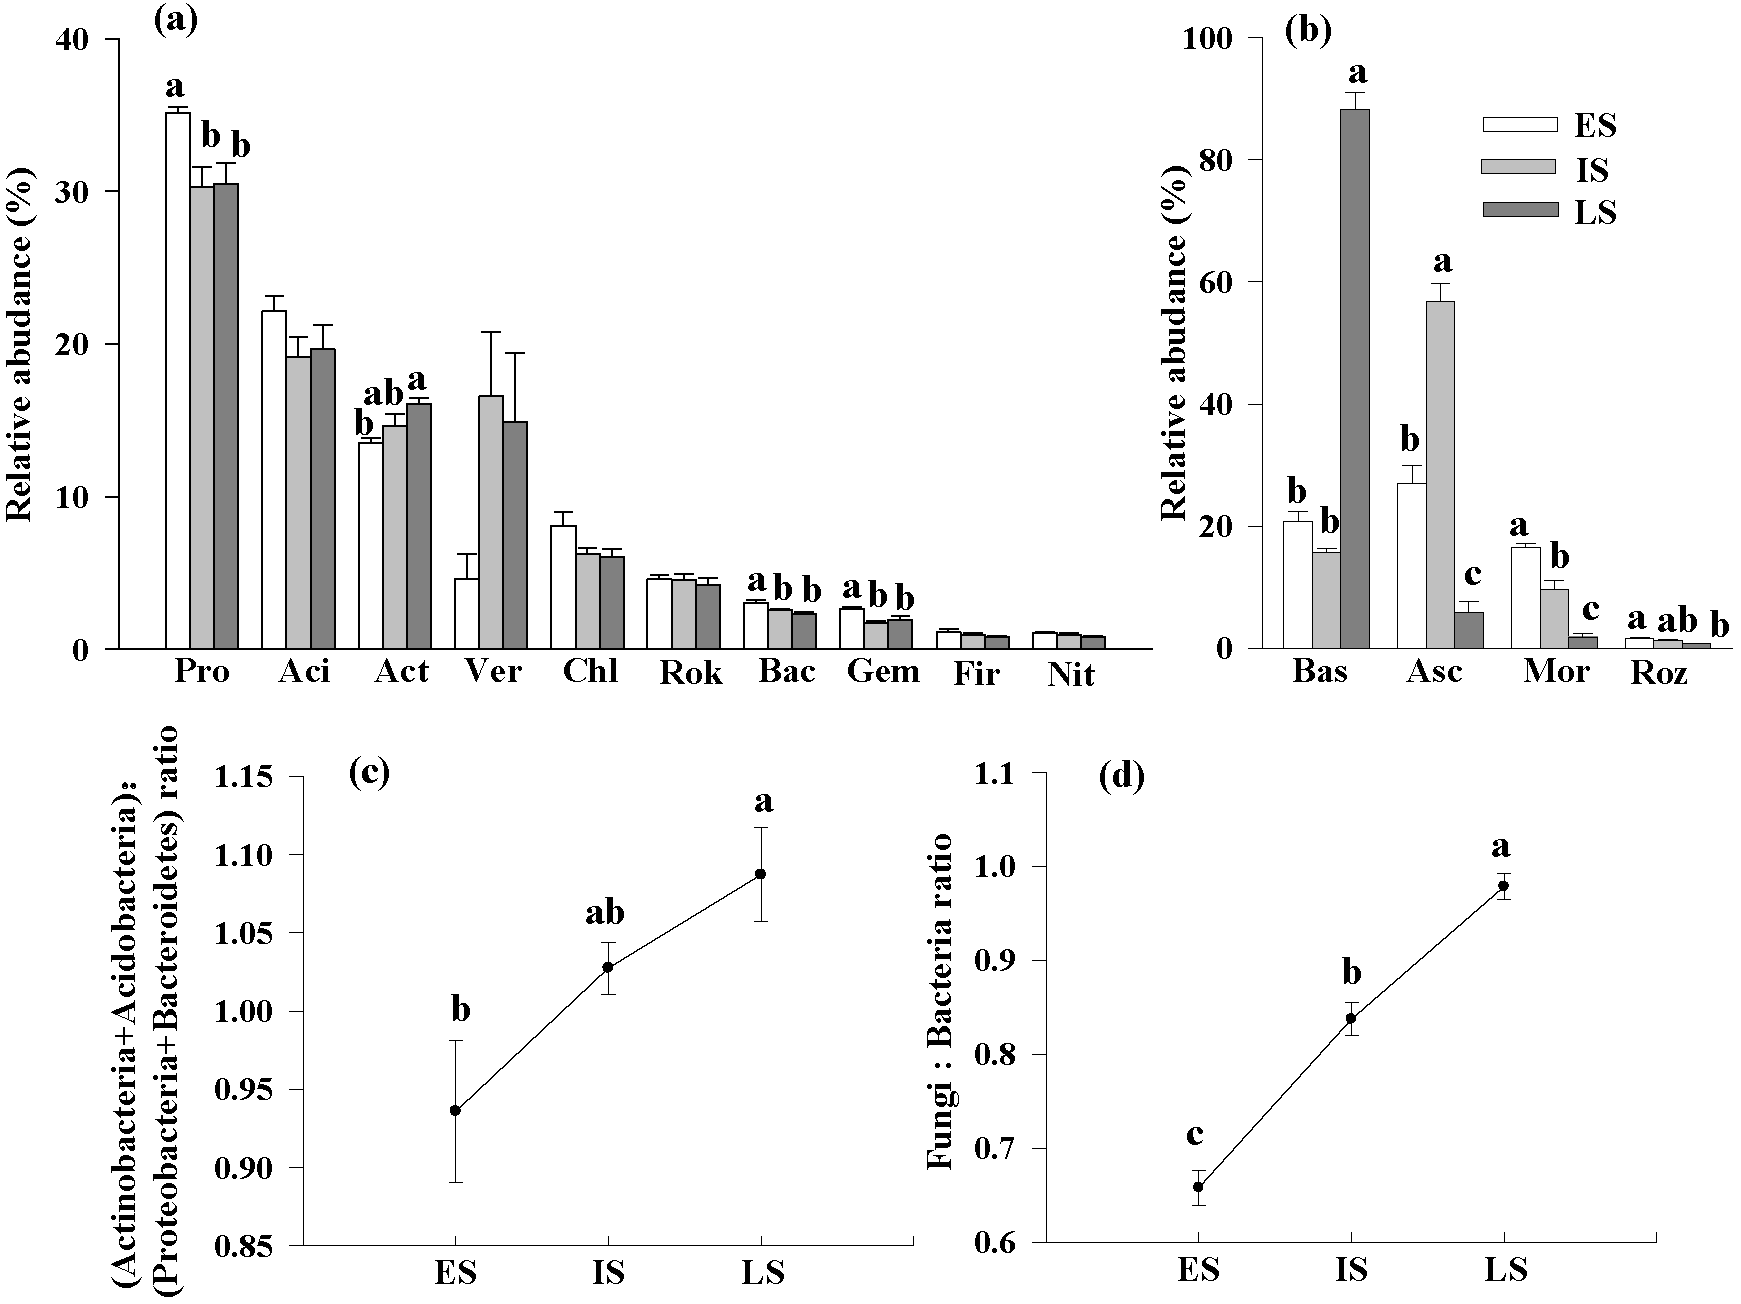
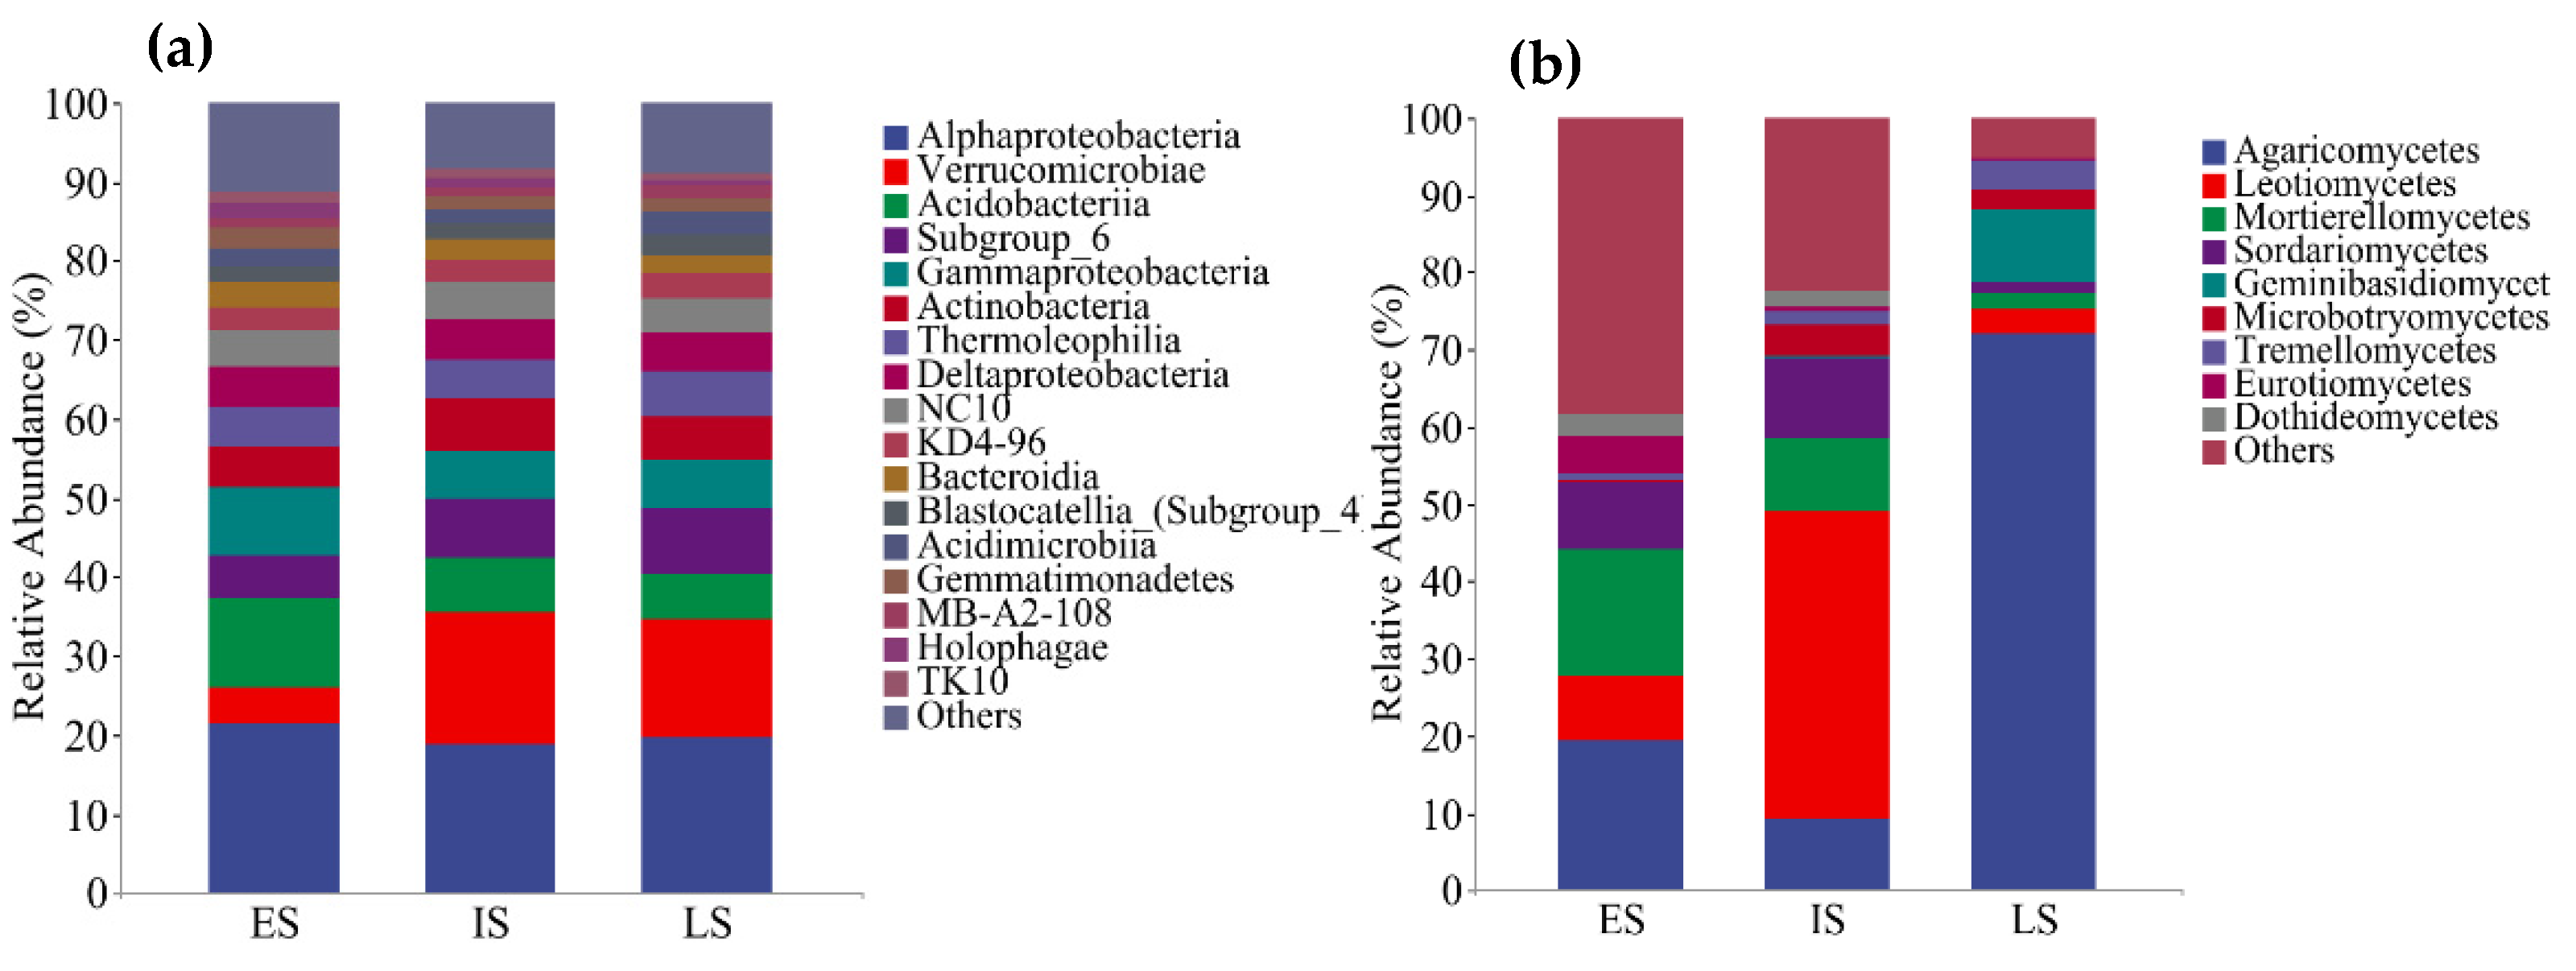
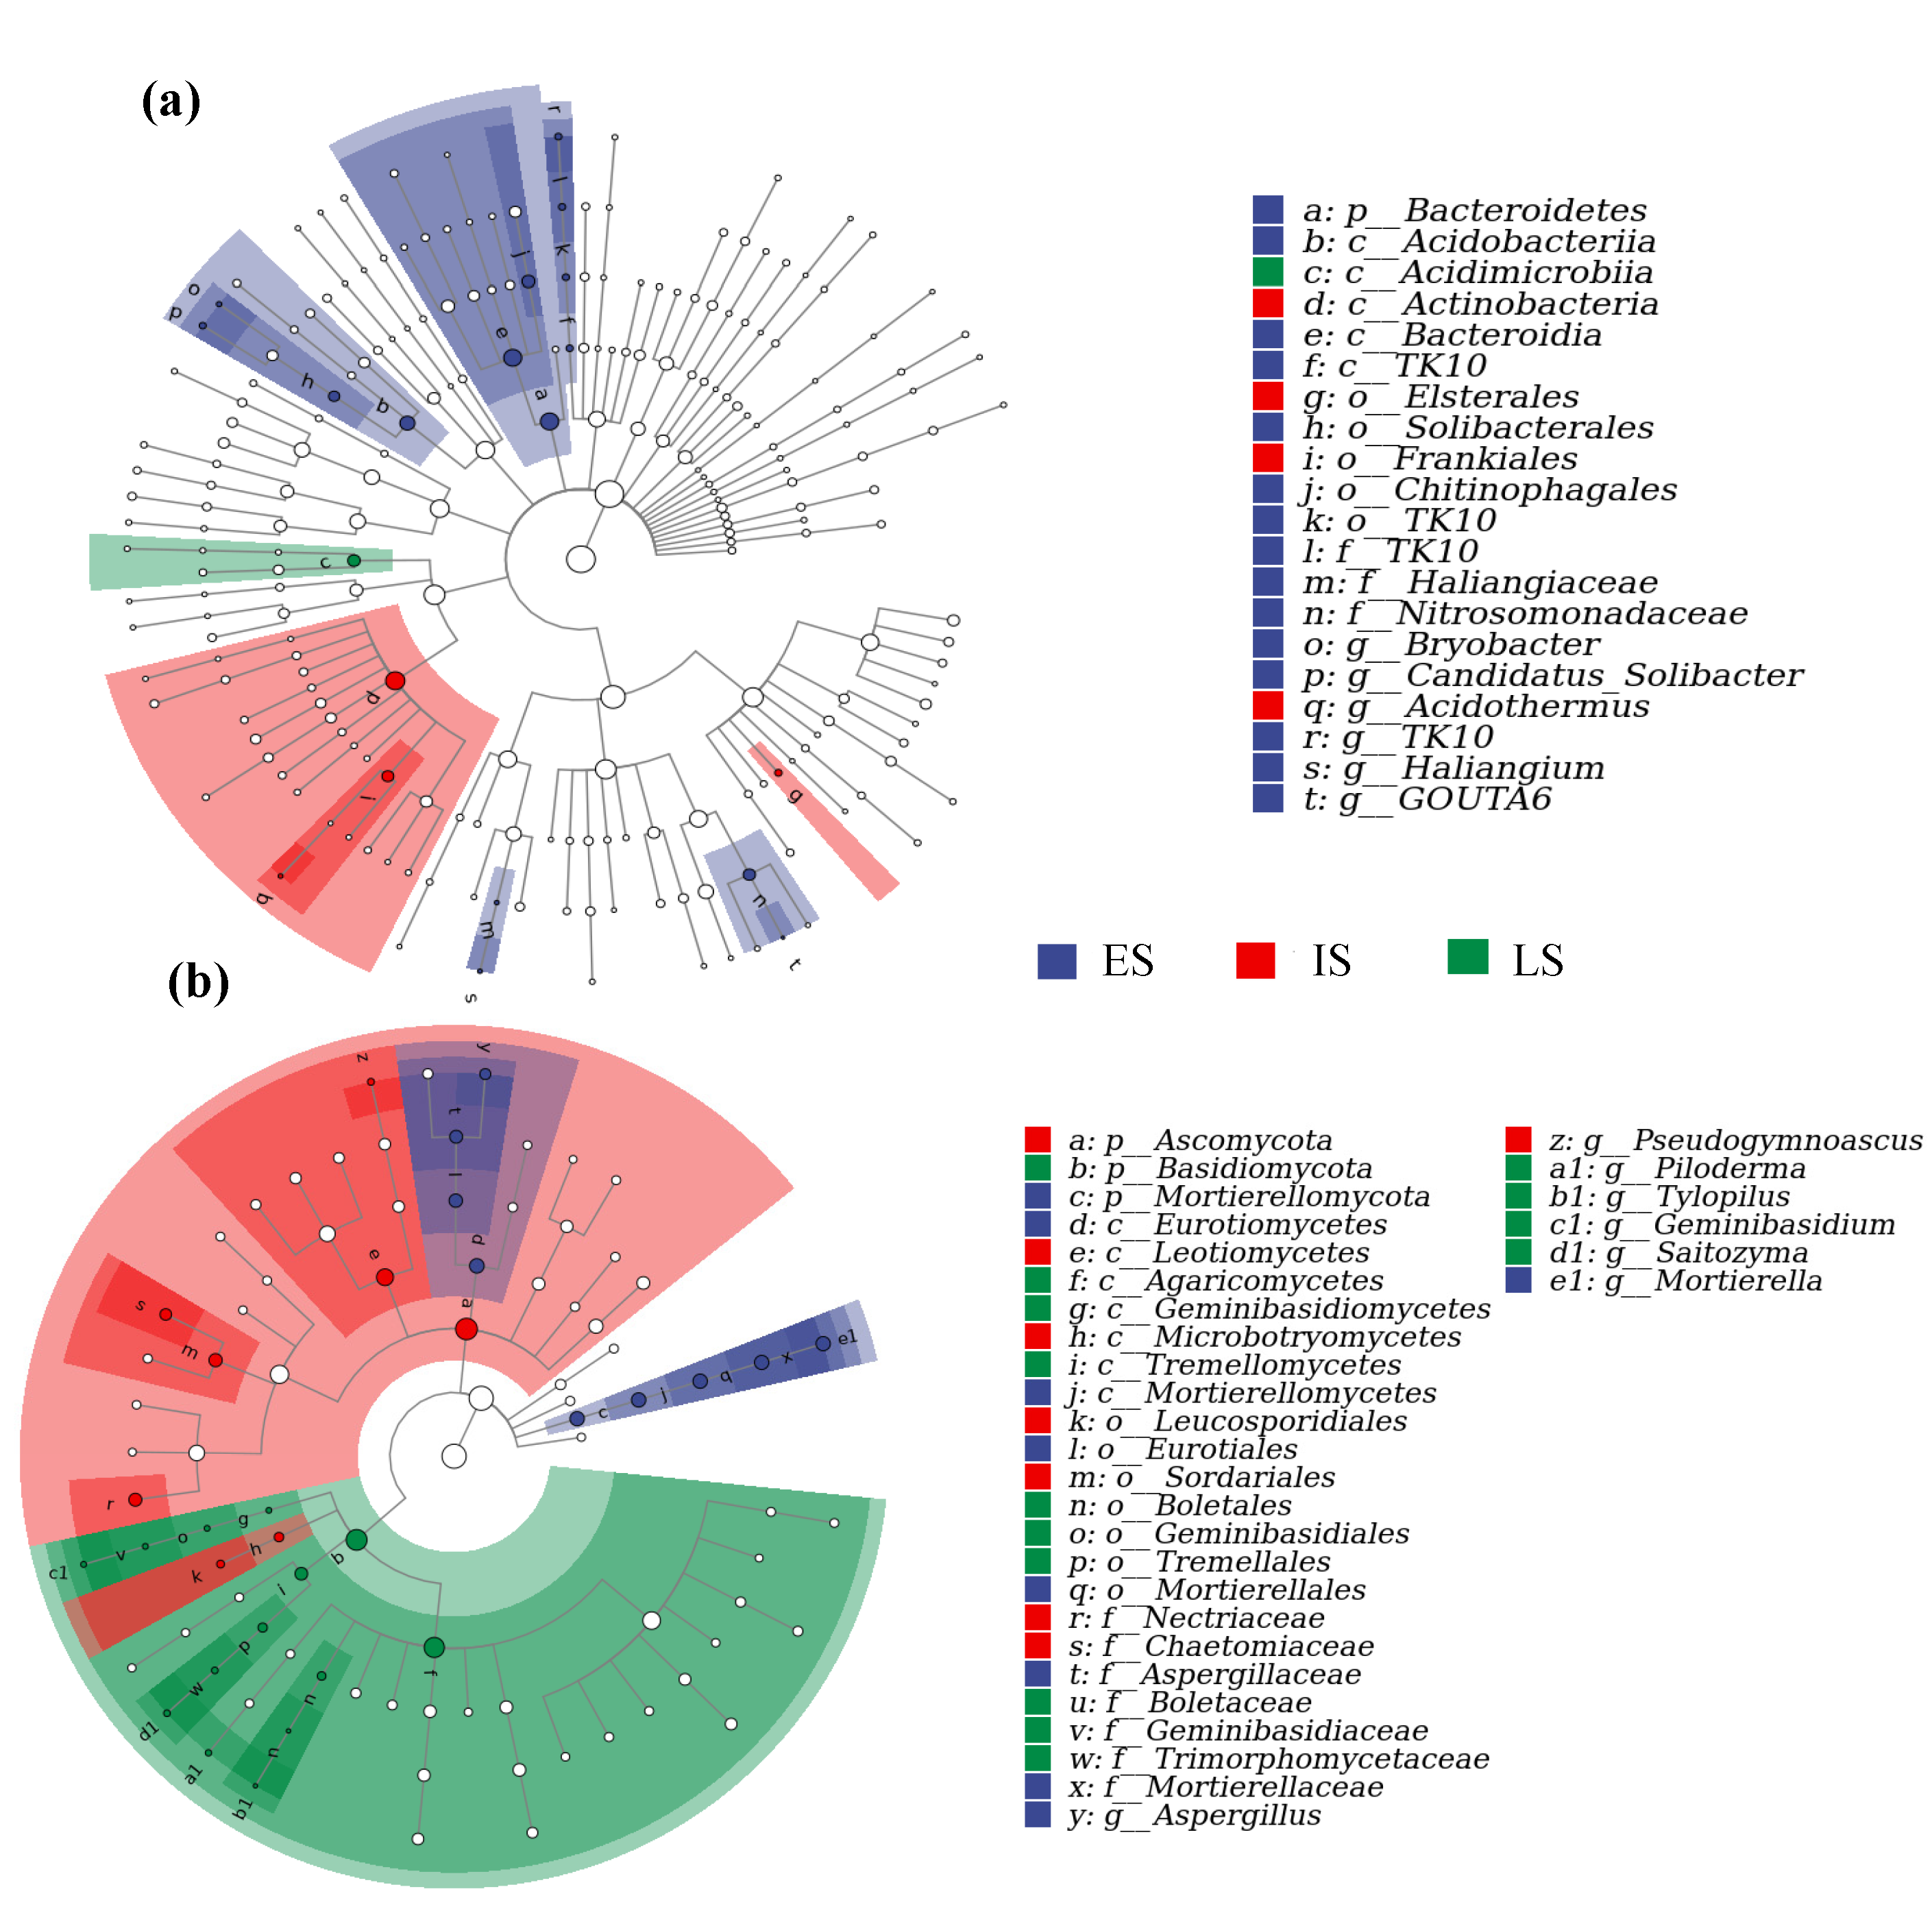
3.3. The Variation in Bacterial and Fungal Community Composition at Various Successional Phases

Bacterial species in 38 phyla and fungal species in 13 phyla were identified in the soil from the three forests. Proteobacteria (31.9% on average relative abundance), Acidobacteria (20.3%), Actinobacteria (14.7%) and Verrucomicrobia (12.0%) were the dominant bacterial phyla in the soil under the three forests, while Chloroflexi (6.8%), Rokubacteria (4.4%), Bacteroidetes (2.6%), Gemmatimonadetes (2.1%), Firmicutes (1.0%) and Nitrospirae (1.0%) were the main bacterial phyla in the three forests. The relative abundance of Proteobacteria, Bacteroidetes and Gemmatimonadetes decreased significantly from the early to the late successional forest (p < 0.05), while that of Actinobacteria was increased significantly (p < 0.05) (Figure 3a). Ascomycota (29.8%), Basidiomycota (41.5%) and Mortierellomycota (9.3%) were the dominant fungal phyla in the soil under the three forests, while Rozellomycota (0.7%) was the main fungal phylum in the three forests. Moreover, the relative abundance of Basidiomycota increased significantly in the late successional (LS) forest (p < 0.05). In contrast, the Mortierellomycota and Rozellomycota relative abundance were substantially decreased from the intermediate to the late successional forest (p < 0.05) (Figure 3b). Ascomycota relative abundance was significantly higher in the IS forest than in the other stages (p < 0.05) (Figure 3b). The relative abundance of Rozellomycota was dramatically decreased in the LS forest (p < 0.05) (Figure 3b). In addition, the (Actinobacteria + Acidobacteria) to (Proteobacteria + Bacteroidetes) ratio and the fungi to bacteria ratio (F/B) increased significantly from the early to the late successional forest (p < 0.05) (Figure 3c,d).
Furthermore, the bacterial and fungal class levels analyses showed 17 bacterial and 9 fungal communities in the soil of the three successional stages, respectively (Figure 4a,b). For bacterial class level, the relative abundance of Gammaproteobacteria (Proteobacteria), Acidobacteriia (Acidobacteria), Holophagae (Acidobacteria), Bacteroidia (Bacteroidetes), Gemmatimonadetes (Gemmatimonadetes) and TK10 (Chloroflexi) decreased significantly as the succession proceeded (p < 0.05) (Figure 4a and Table A1). In contrast, the relative abundance of Subgroup_6 (Acidobacteria) increased considerably in the forests with different successional stages (p < 0.05) (Figure 4a and Table A1). For the fungal class level, the relative abundance of Sordariomycetes (Ascomycota), Eurotiomycetes (Ascomycota) and Mortierellomycetes (Mortierellomycota) decreased significantly as the succession proceeded (p < 0.05) (Figure 4b and Table A1). By comparison, the relative abundance of Agaricomycetes (Basidiomycota), Geminibasidiomycetes (Basidiomycota) and Tremellomycetes (Basidiomycota) increased significantly as the succession proceeded (p < 0.05) (Figure 4b and Table A1).
In addition, there were significant differences in enriched communities of soil bacteria and fungi under the three forests (Figure 5). Specifically, the bacterial and fungal communities have specific groups in the forest with three successional stages at the class and order levels. Soil bacterial groups are mainly enriched in the early successional (ES) forests, while fungal groups are primarily enriched in the LS forests (Figure 5). For bacteria groups, Bacteroidetes (c_Bacteroidia, o_Chitinophagales), Acidobacteria (c_Acidobacteriia, o_Solibacterales) and Chloroflexi (c_TK10, o_TK10) dominated in the ES forest, while Actinobacteria (c_Acidimicrobiia) dominated in the LS forest (Figure 5). For fungal groups, Ascomycota (c_Eurotiomycetes, o_Eurotiales), Mortierellomycota (c_Mortierellomycete, o_Mortierellales) were enriched in the ES forest, whereas Basidiomycota (c_Agaricomycetes, c_Geminibasidiomycetes, c_Tremellomycetes, o_Geminibasidiales, o_Boletales, o_Tremellales) were increased in the LS forest (Figure 5). Furthermore, at the phylum level, Bacteroidetes and Mortierellomycota were prevalent in the ES forest, while Ascomycota dominated in IS forests, and Basidiomycota was prevalent in the LS forest (Figure 5).

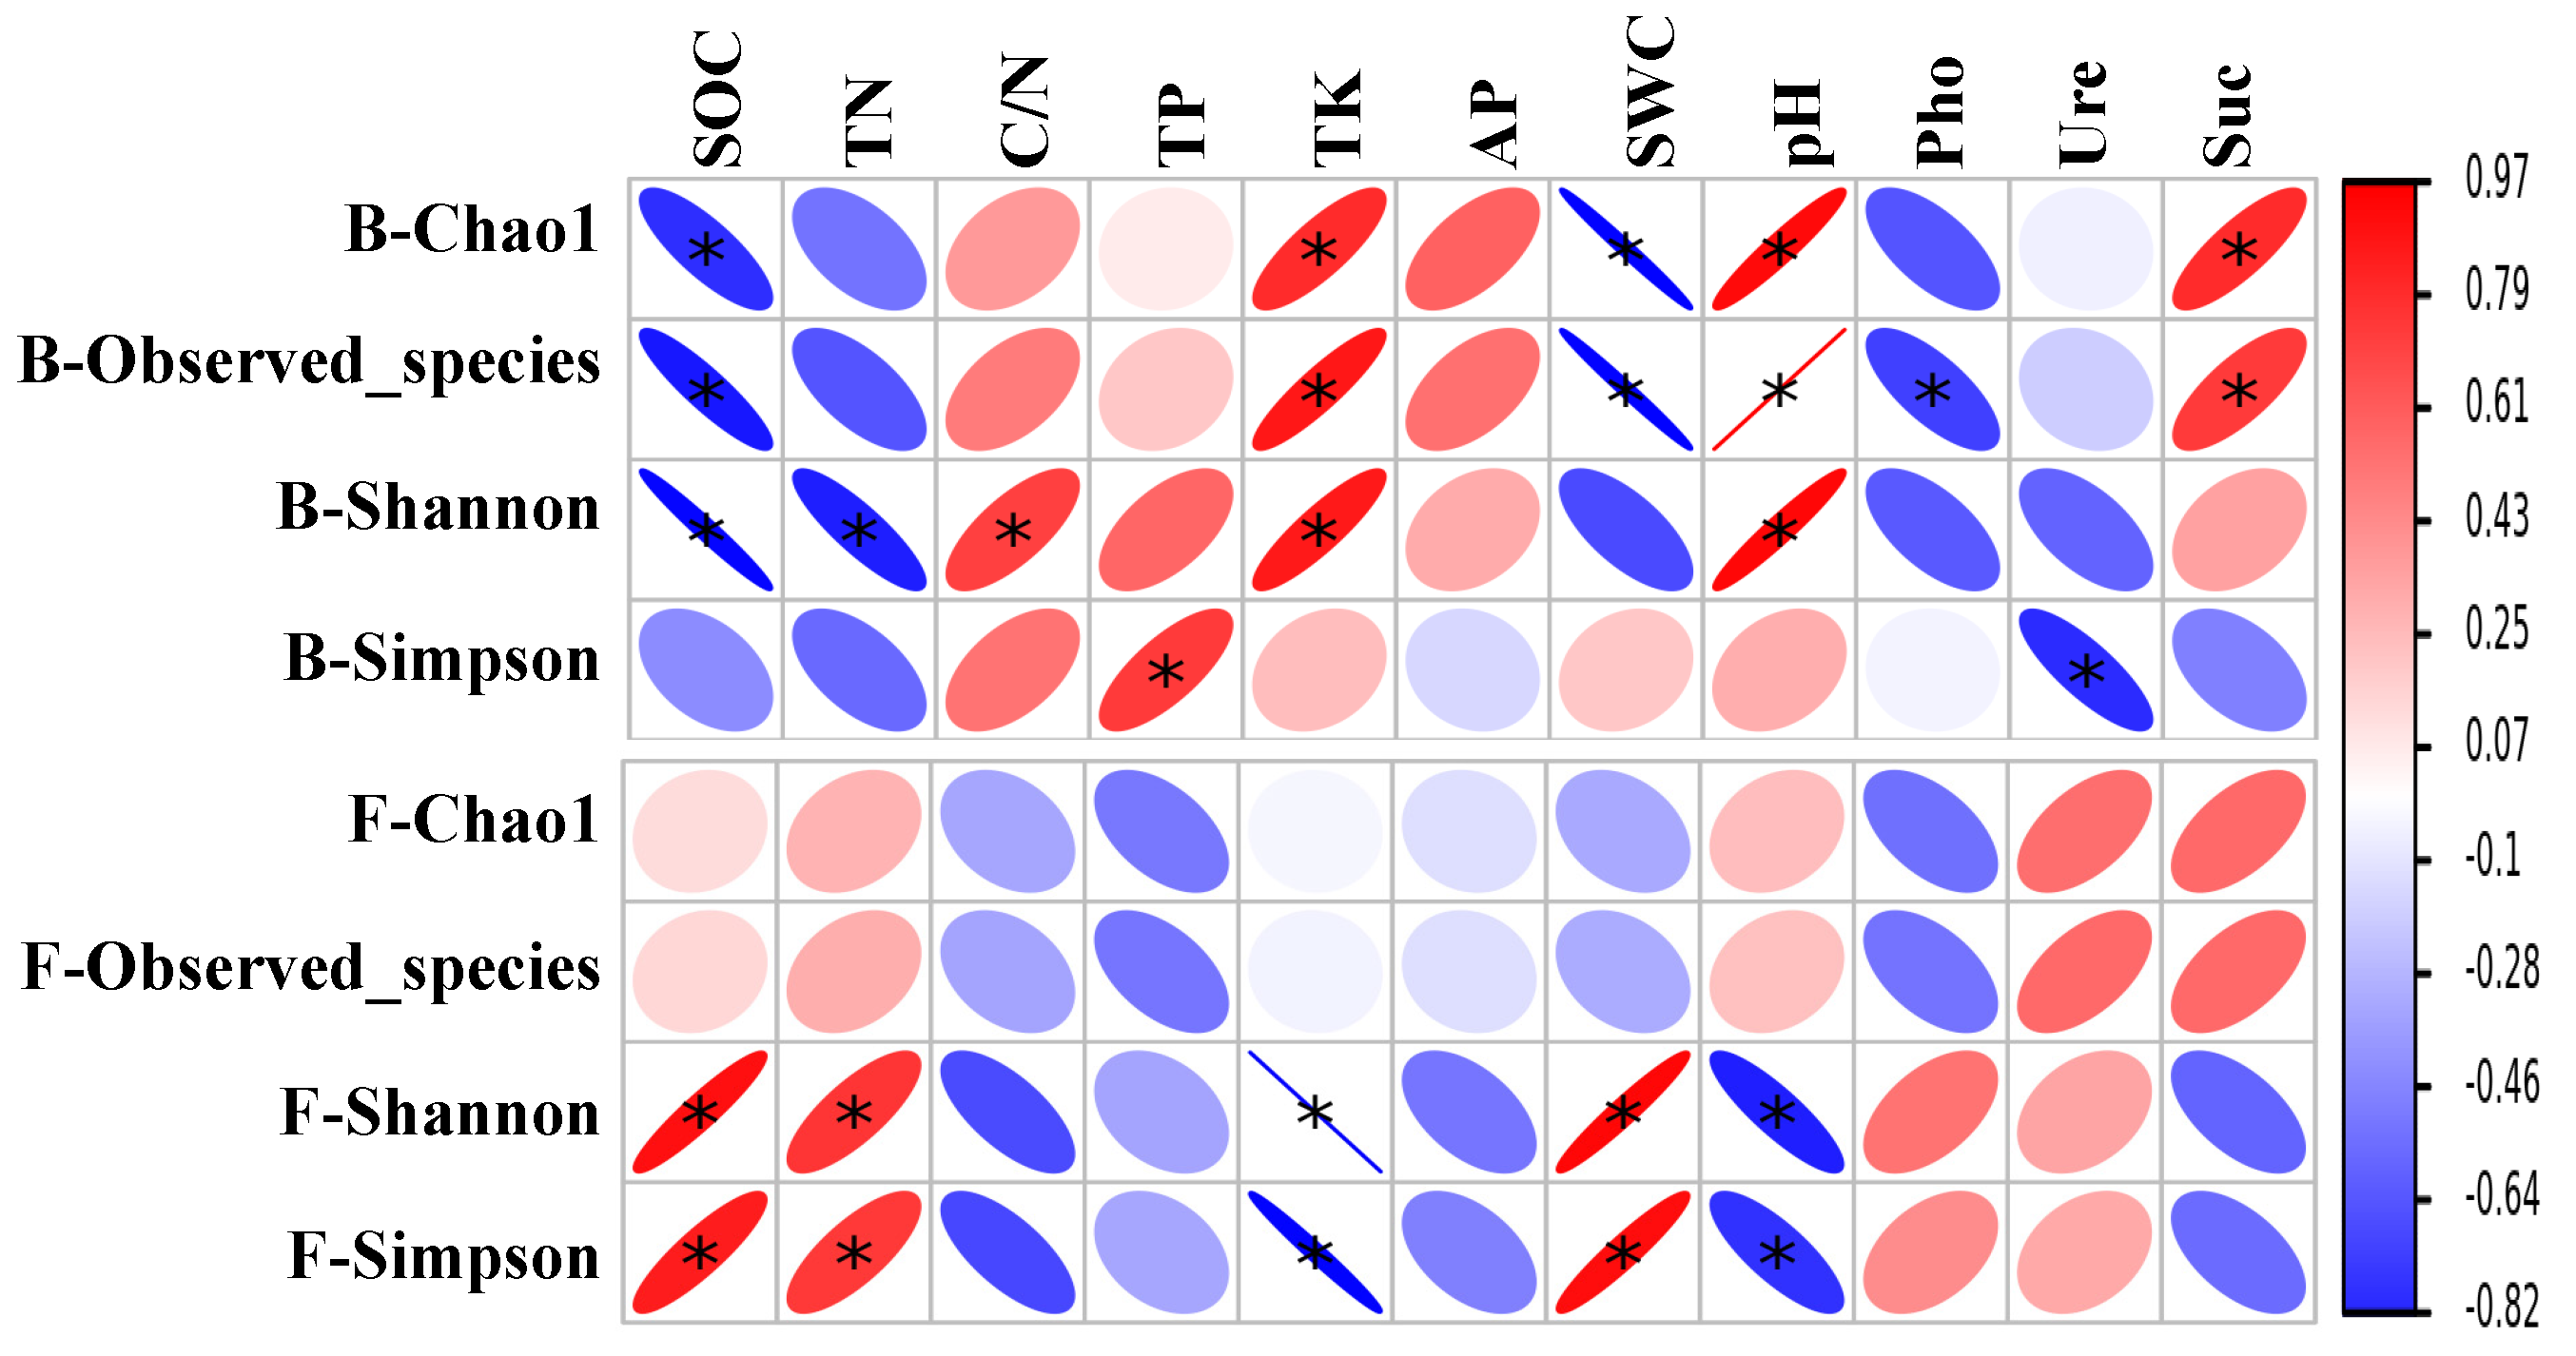
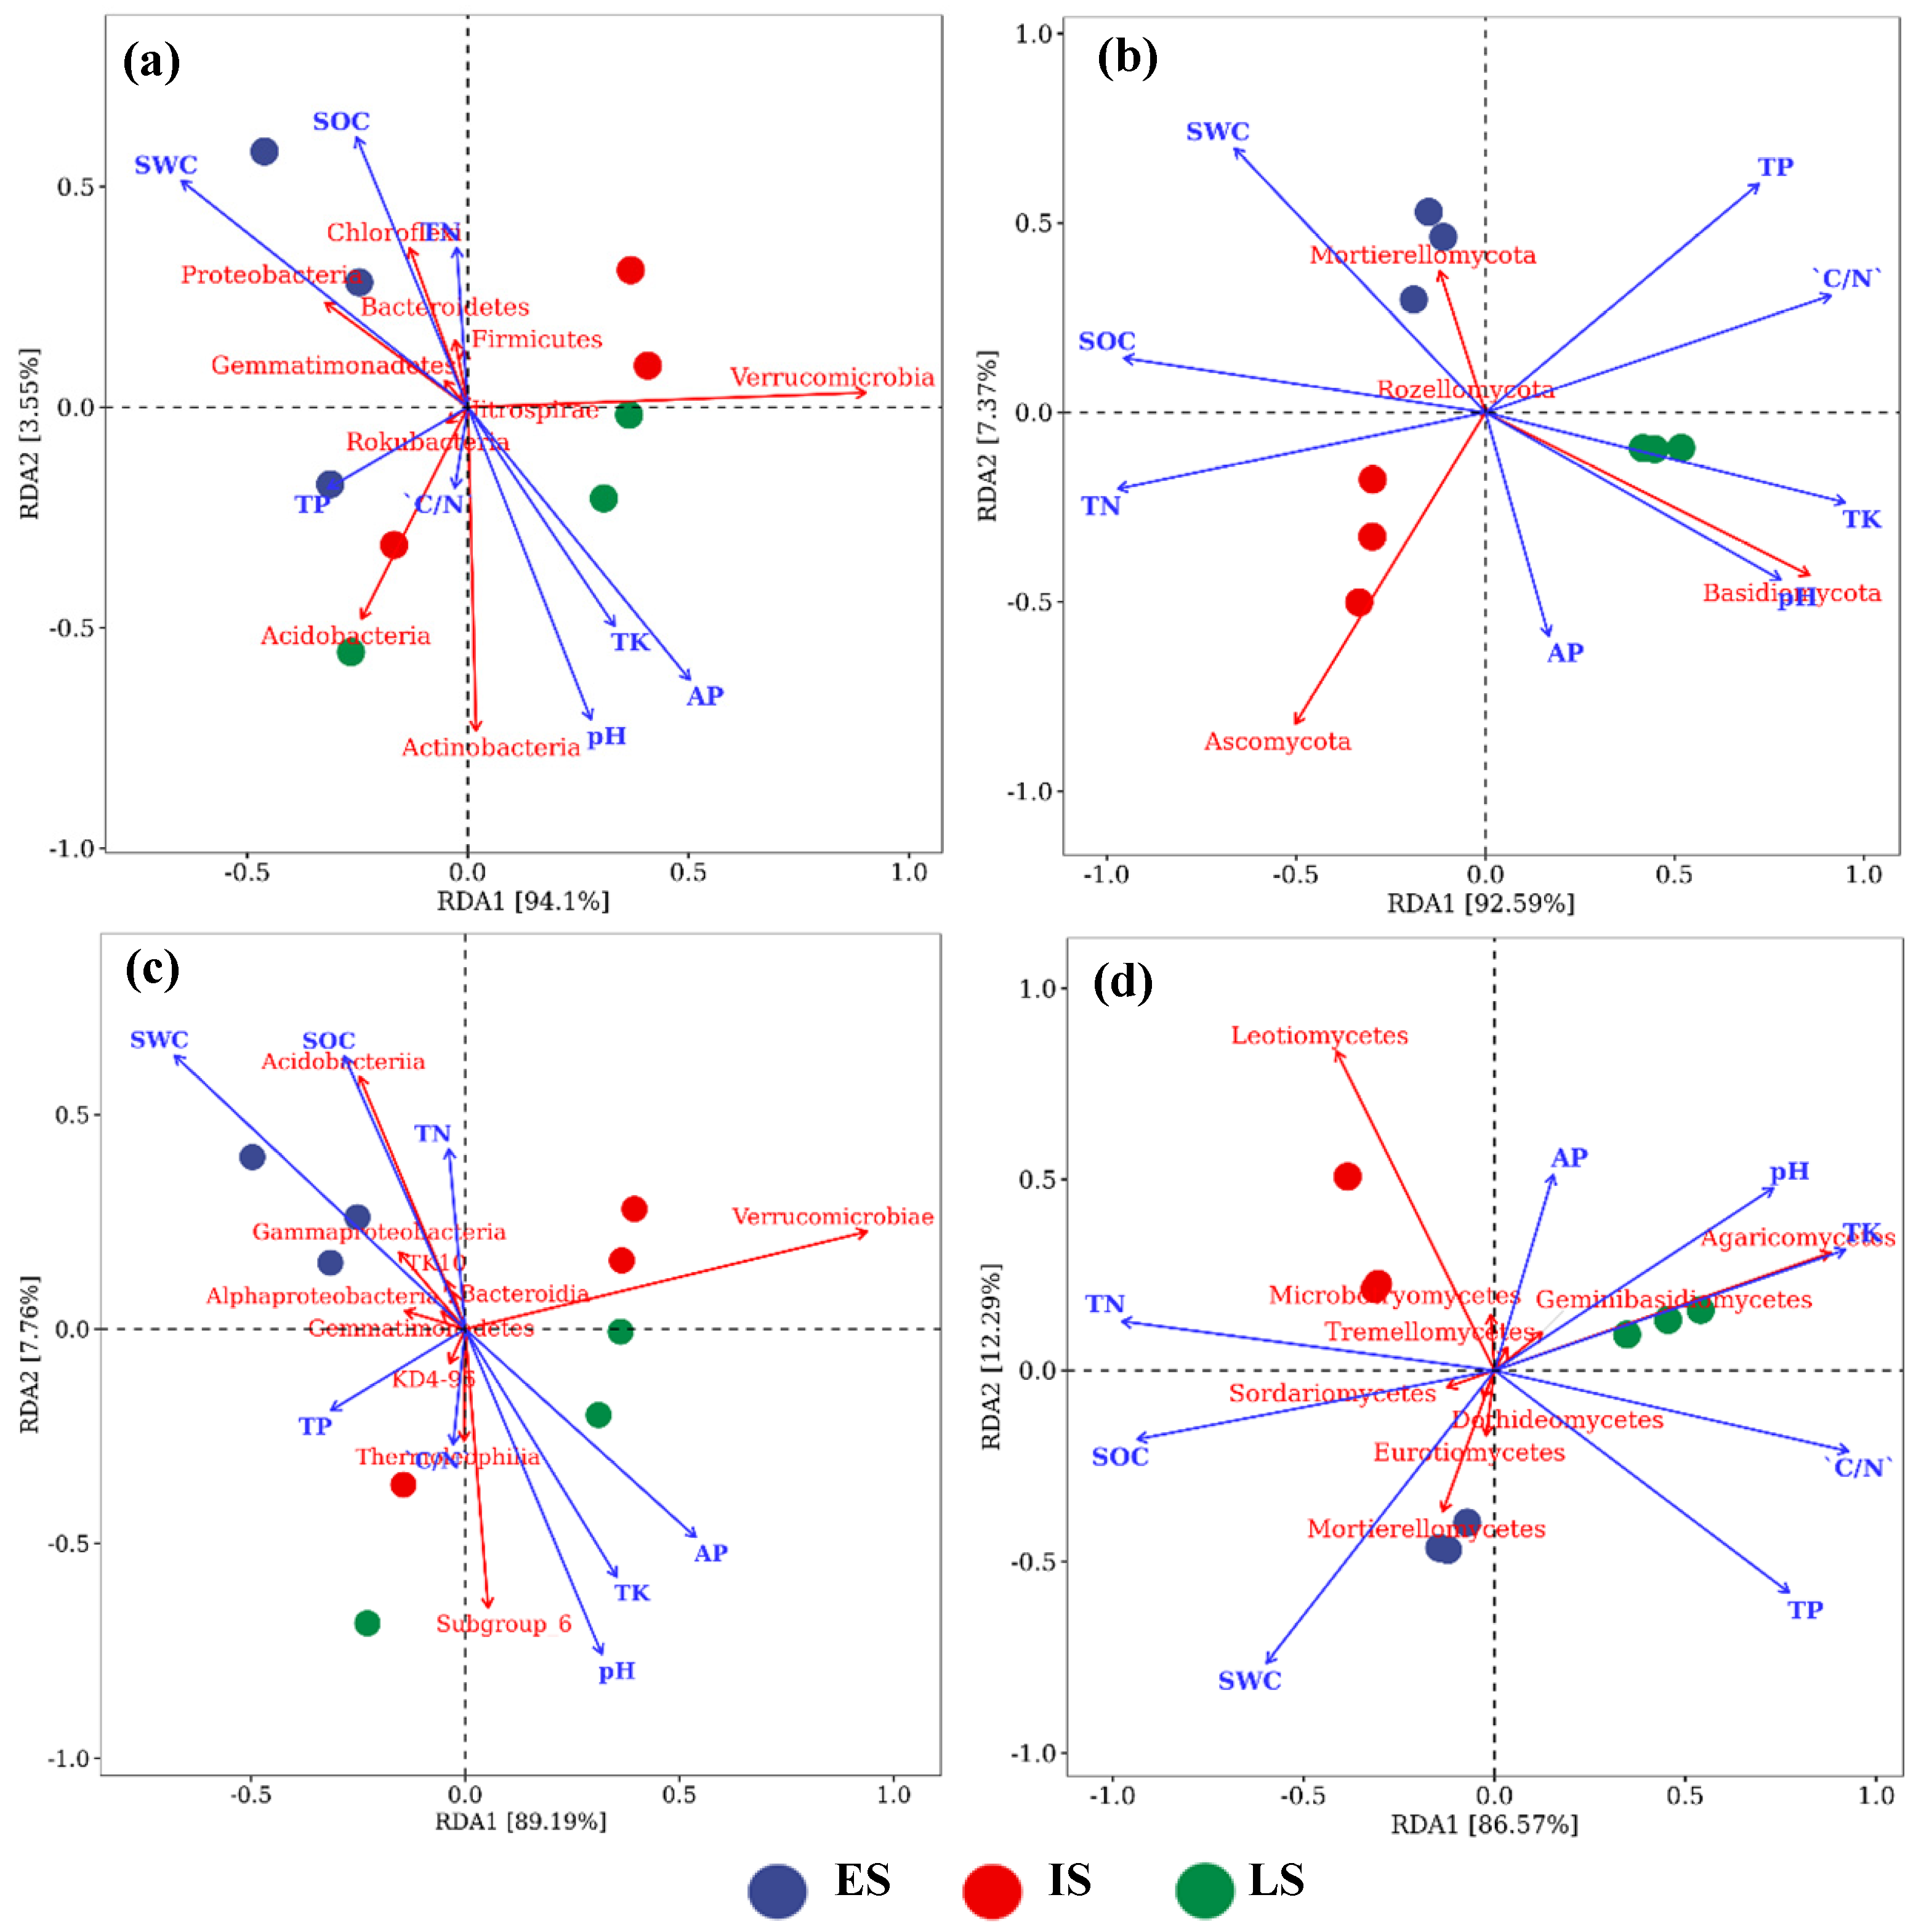
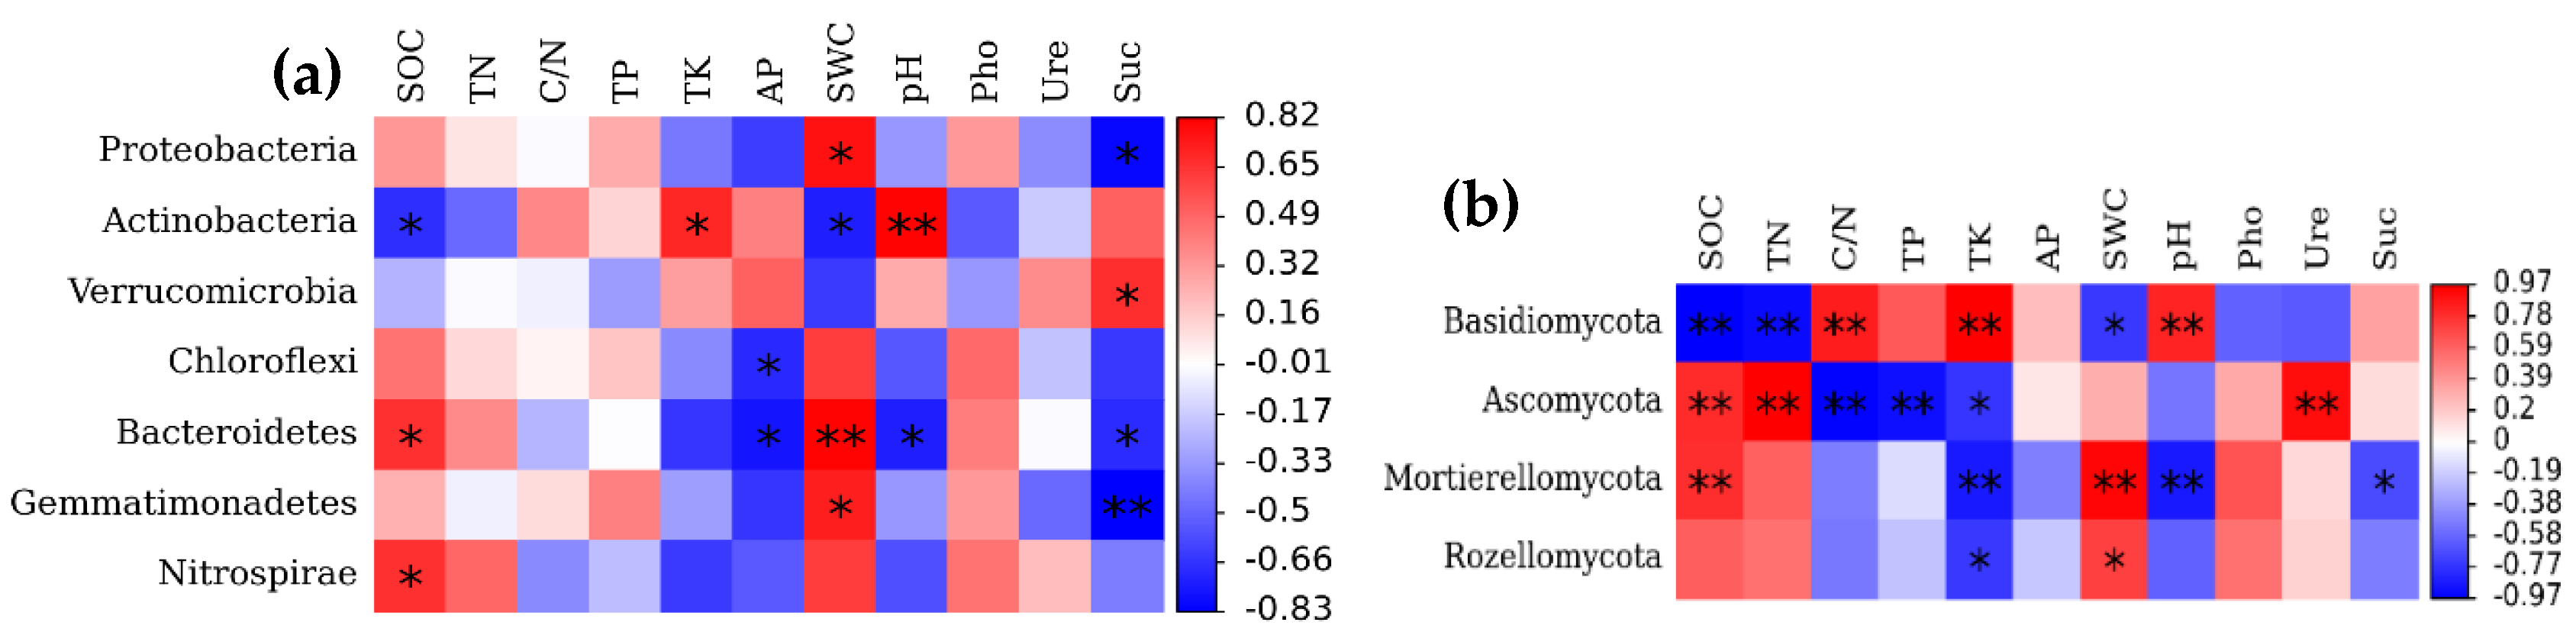
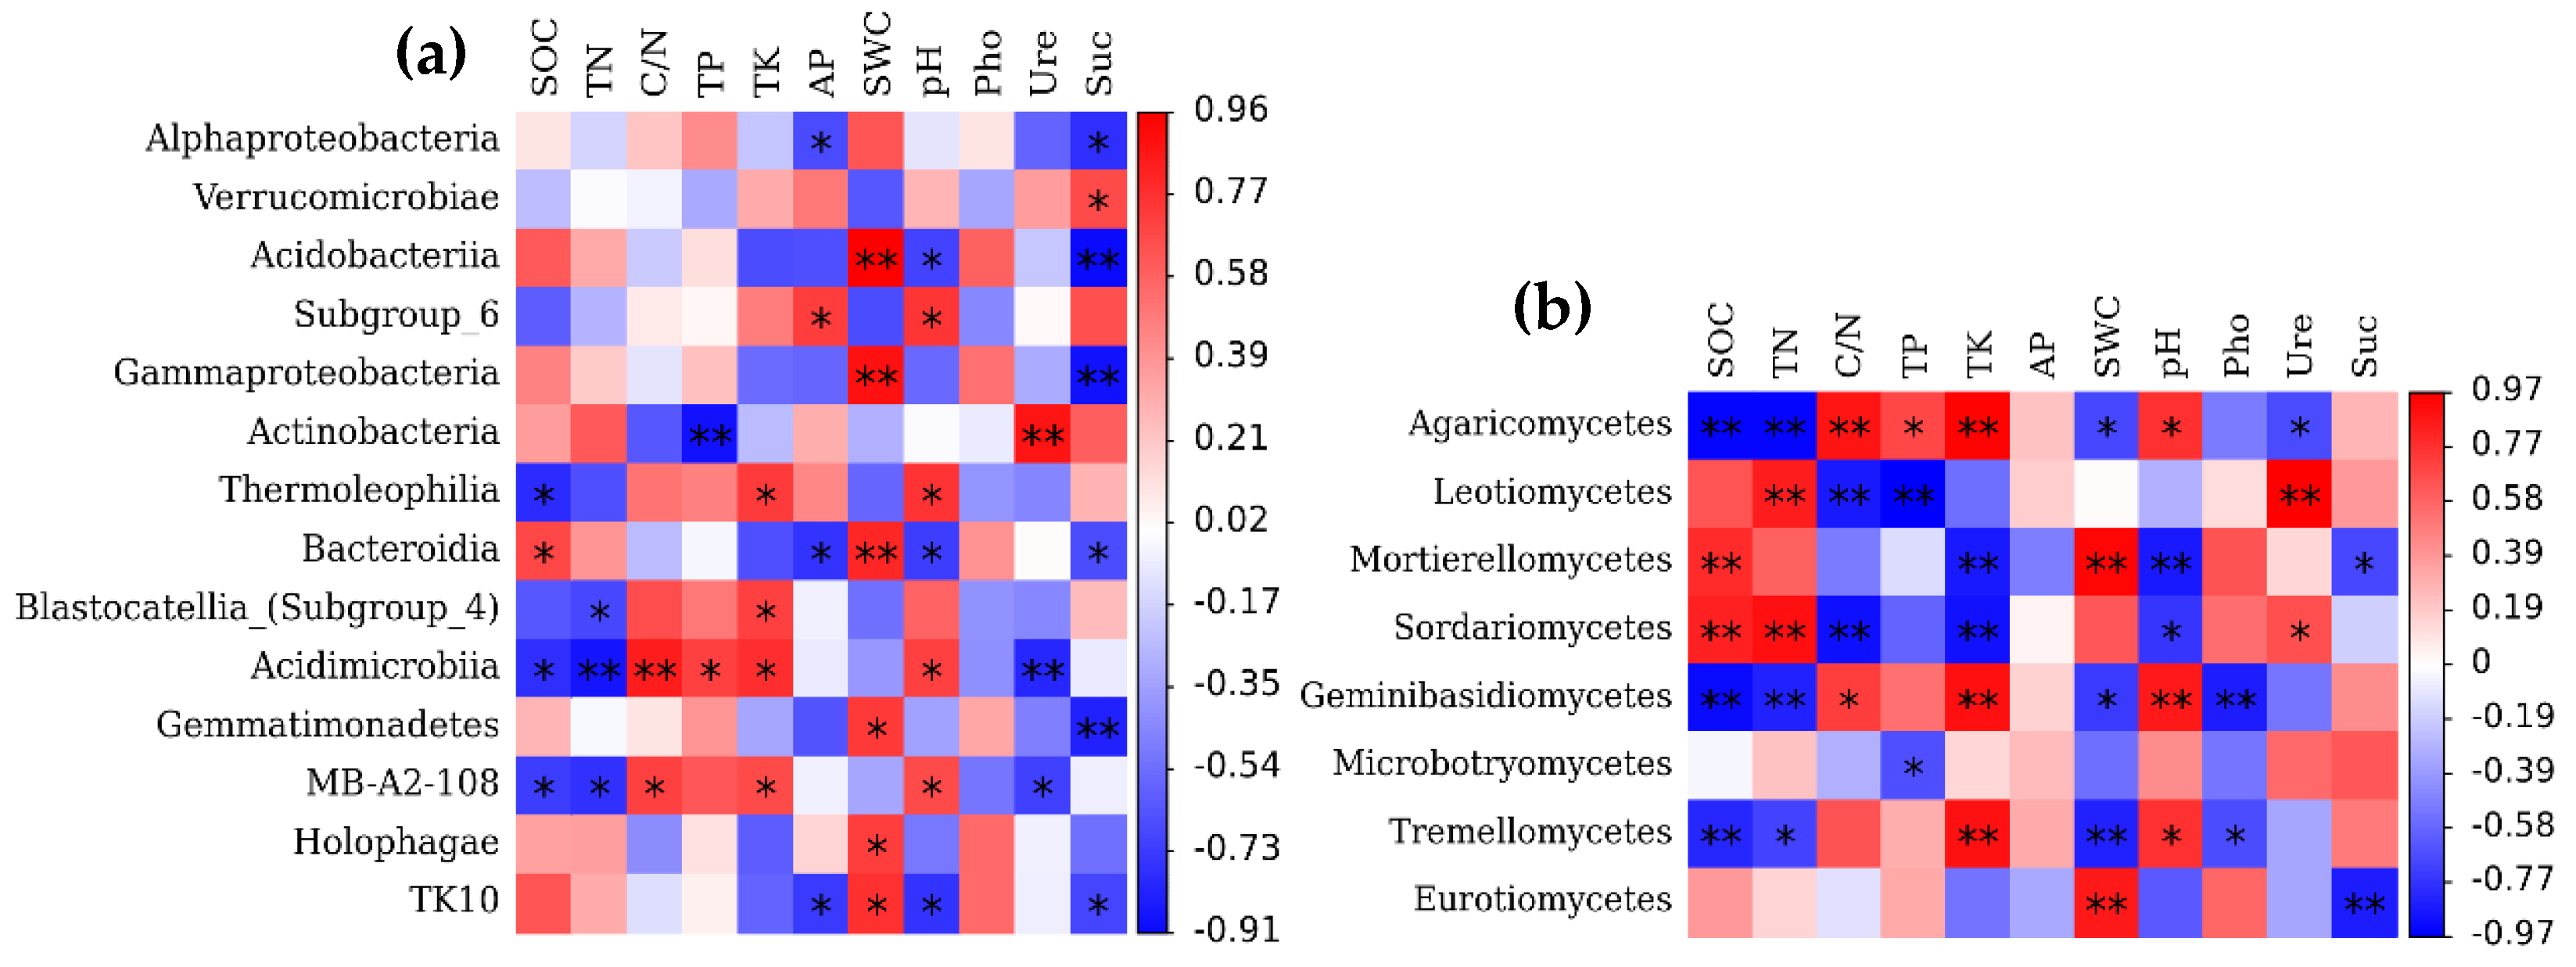
3.4. Effects of Soil Variables on the Makeup of the Bacterial and Fungal Community Composition

Soil physicochemical properties markedly affected the soil bacterial and fungal community composition (Figure 6a,b). Redundancy analysis results showed that the first two axes explained 97.65% and 99.96% of the relationship between soil bacterial and fungal community composition and soil factors, respectively (Figure 6a,b). Among them, SWC and AP were the significant factors for the variation in soil bacterial community composition, which can explain more than 60% of the variation of bacterial groups (Figure 6a). In contrast, SOC, TN, TK, C/N and SWC can explain more than 90% of the changes in soil fungal community composition (Figure 6b). However, soil enzyme activity had no significant effect on the variation of bacterial groups. Only Suc concentration significantly affected the relative abundance of Proteobacteria, Verrucomicrobia, Bacteroidetes and Gemmatimonadetes (p < 0.05) (Figure A1). For fungi, soil enzyme activity had a weak effect on the variation of fungal groups (Figure A1). Suc concentration was negatively correlated with the relative abundance of Mortierellomycota (p < 0.05) and Ure concentration was positively correlated with Ascomycota (p < 0.05). At the same time, Pho was not associated with fungal groups (p > 0.05) (Figure A1).
On the other hand, SOC and TN significantly affected the bacterial and fungal taxonomic composition. SOC and TN were positively associated with Proteobacteria, Bacteroidetes, Ascomycota and Mortierellomycota in the forests (p < 0.05), whereas they were significantly negatively associated with Actinobacteria and Basidiomycota (p < 0.05) (Figure A1). Secondly, for bacterial groups, SWC was more significant for soil bacterial taxonomic composition than the other factors, with a significantly positive correlation to Proteobacteria, Bacteroidetes and Gemmatimonadetes (p < 0.05) and a markedly negative relation to Actinobacteria (p < 0.05) (Figure A1). Moreover, AP was significantly negatively correlated with Chloroflexi and Bacteroidetes (p < 0.05) (Figure A1). For fungal communities, TK was substantially positively correlated to Basidiomycota (p < 0.05) and negatively correlated to Ascomycota, Mortierellomycota and Rozellomycota (p < 0.05) (Figure A1). Additionally, soil pH also contributed to affecting the soil microbial community composition in the forests. In our research, the increase in soil pH significantly promoted the growth of Actinobacteria and Basidiomycota (p < 0.05) while inhibiting the development of Bacteroidetes and Mortierellomycota (p < 0.05) (Figure A1).
Similarly, soil properties also significantly affected the soil bacterial and fungal class-level community structure. The first two axes explained 96.95% and 98.86% of the relationship between bacterial and fungal class-level groups and soil factors, respectively (Figure 6c,d). Soil pH, SWC and AP were the major factors of the variation in bacterial class-level communities (Figure 6c). At the same time, SOC, TN, TK, TP and SWC were the major factors of the variation in the fungal class-level community (Figure 6d). However, soil enzyme activity had a weak effect on the variation of soil fungal and bacterial groups. In addition, SOC and TN content were positively related to Bacteroidia, Sordariomycetes and Mortierellomycetes (p < 0.05), while being negatively related to Thermoleophilia, Acidimicrobiia, MB-A2-108, Agaricomycetes, Geminibasidiomycetes and Tremellomycetes (p < 0.05) (Figure A2). Moreover, the C/N ratio, SWC and TK were also contributing to the changing of bacterial and fungal taxonomic communities (p < 0.05) (Figure A2). For bacteria, SWC significantly promoted the growth of Acidobacteria, Gammaproteobacteria, Bacteroidia, Gemmatimonadetes, Holophagae and TK10 (p < 0.05) (Figure A2). The C/N ratio and TK significantly promoted the growth of Acidmicrobiia and MB-A2-108 (p < 0.05) (Figure A2). For fungi, SWC significantly inhibited the growth of Agaricomycetes, Geminibasidiomycetes and Tremellomycetes but promoted the development of Eurotiomycetes and Mortierellomycetes (p < 0.05) (Figure A2). The C/N ratio and TK significantly promoted the growth of Agaricomycetes and Geminibasidiomycetes and inhibited the development of Sordariomycetes and Leotiomycetes (p < 0.05) (Figure A2).

4. Discussion

4.1. The Variation in Soil Microbial Community Diversity in Forests across Successional Stages

Soil microbial diversity is an important indicator of ecosystem function and it is the primary driver of soil nutrient cycling [10,19]. Previous studies have manifested that forest succession can increase soil porosity and root biomass, thereby improving soil microbial activity and diversity [51,52]. However, our study found the soil bacterial community diversity increased following the forest succession, while the fungal community diversity decreased significantly (Figure 1). This may be caused by the changes in soil properties [17,53] or the different niches of soil bacteria and fungi [4,20]. Generally, high-quality soils can improve the differentiation of microbial niches and thus enhance biodiversity [54]. For example, in our study, SOC and TN were positively correlated with soil fungal community diversity (p < 0.05) (Figure 2). The low soil organic carbon concentration in the LS forest may lead to the fungi groups (k-strategy) increasing significantly and decreasing the soil fungal diversity, e.g., the relative abundance of Basidiomycota varied from 16% in the ES forest to 88% in the LS forest.
Moreover, our study found that soil bacterial community diversity was positively correlated with C/N and negatively correlated with SOC and TN (Figure 2). This may be the difference in the ecological strategy of the soil microbial community. In general, the soil bacterial community prefers r-strategy species, which are often limited by soil phosphorus in the early growth stage [55,56,57]. Meanwhile, our study also found the highest Pho in the ES forest (Table 2), which predicted that soil microbes release large amounts of Pho to decrease soil phosphorus limitation in the ES forest [58]. In addition, the low soil pH will also alter soil bacterial metabolism and inhibit bacterial growth [26,53,59]. Therefore, higher soil phosphorus content and pH in the LS forest may be responsible for increasing soil bacterial community diversity.

4.2. The Variation of Soil Microbial Community Composition in Forests across Successional Stages

Research on successional changes in microbial community composition has put microbes into r- and k-strategy groups. As previously shown, bacteria pertained to r-strategy groups in high-quality environments and proliferated fast [7,16]. Fungi tend to the k-strategy groups, which grow in nutrient-limiting environments and have strong competitiveness [13,14]. In this study, the relative abundance ratio of soil fungal to bacterial (F/B) increased significantly from the early to the late successional forests (p < 0.05) (Figure 3d), which indicates that the niche of bacterial and fungal communities varied considerably in forests with three successional stages. With the forest succession, the increase in the fungal community niche supplemented the decrease in the bacterial community niche. Yan et al. [10] and Zhou et al. [9] produced the same results.
We further analyzed the changing pattern of soil bacterial and fungal taxonomic composition in the three forests. For bacterial groups, Proteobacteria and Bacteroidetes were enriched in the ES forest, while Actinobacteria dominated in the LS forest (Figure 3a). It was previously documented that Proteobacteria and Bacteroidetes belong to the r-strategy groups, while Acidobacteria and Actinobacteria tend to be in the k-strategy groups [7,8]. The increase in light soluble organic matter stimulated r-strategy bacteria growth and inhibited k-strategy bacteria growth [5]. In our study, SOC and TN concentration decreased considerably in the LS forest and the C/N ratio increased significantly (p < 0.05) (Table 2). Therefore, the increase in refractory organics in the LS forest may lead to the loss of the r-strategy bacteria niche and the expansion of the k-strategy niche. In addition, the (Actinobacteria + Acidobacteria) to (Proteobacteria + Bacteroidetes) ratio was the highest in the LS forest (Figure 3c) and the results further verified that the bacterial community transitioned from r-strategy in the ES forest to k-strategy in LS forest. It is noteworthy that the relative abundance of Acidobacteria did not increase in the forests with different successional stages (Figure 3a). This may be due to numerous subgroups of Acidobacteria and their acidophilic characteristics [18,30,31]. Masataka et al. [17] and Jiang et al. [19] found that Acidobacteria were enriched in the early successional forest. Zhang et al. [3] indicated that the relative abundance of Subgroup_4 and Subgroup_6 decreased significantly after the abandonment of farmland. Similarly, our study also found significant differences in the Acidobacteria class-level community. Acidobacteriia was dominant in the ES forest and Subgroup_6 was prevalent in the LS forest, while Subgroup_4 had no substantial changes from the early to the late successional forest (Table A1). In addition, we also found that Acidobacteriia was negatively related to soil pH (p < 0.05), while Subgroup_6 was positively associated with soil pH (p < 0.05) (Figure A2). It was further confirmed that the subgroups of Acidobacteria may differ considerably and soil pH was a significant factor determining the changes in the Acidobacteria community composition.
We observed that Ascomycota, Basidiomycota and Mortierellomycota were the leading phyla in the forest with different successional stages for fungal communities. The fungal community composition switched from Mortierellomycota and Ascomycota in the ES forest to Basidiomycota in the LS forest (Figure 3) and Yan et al. [10] and Jiang et al. [19] obtained the same results. The Chi et al. [60] and Li et al. [61] investigations showed that Ascomycota and Mortierellomycota colonized early and mostly degraded simple polysaccharides and hemicellulose. On the contrary, Basidiomycota contains many ectomycorrhizal and saprophytic fungi, which are essential for decomposing macromolecular compounds [62,63]. In our study, the C/N was dramatically increased in the LS forest leading to an increase in Basidiomycota. In addition, in our study, fungal diversity decreased considerably in the LS forest, suggesting that k-strategy groups dominated in the LS forest. Our results show that both soil bacterial and fungal phyla switch from r-strategy groups to k-strategy groups with forest succession.
Previous studies on soil microbial taxonomic composition focused on phylum level [10,20,21] and seldom [17,22] on class level. Our results confirmed significant changes in the class-level groups of bacteria and fungi in the three forests (Figure 4 and Table A1). For bacterial class level, the relative abundance of Bacteroidia and Acidobacteriia decreased considerably from early to the late succession forest (p < 0.05) (Table A1). Padmanabhan et al. [64] proved that Bacteroidia has high nutrient requirements and was a typical r-strategy group. Liu et al. [65] and Barns et al. [66] also proved that Acidobacteriia was strongly eosinophilic and negatively correlated with soil pH. Therefore, the low soil nutrient and high pH environment in the LS forest might be the key factors for the community changes. For the fungal class level, the fungal community shifted from Mortierellomycete, Sordariomycetes and Eurotiomycetes in the ES forest to Agaricomycetes, Geminibasidiomycetes and Tremellomycetes in the LS forest (Table A1). Secondly, in our study, the enrichment groups in the ES forest were significantly positively correlated with SOC and TN. However, the enrichment groups in the LS forest were notably negatively correlated with SOC and TN (Figure A2). Therefore, the study provided insights into niche switches in bacterial and fungal class-level communities in forests with different successional stages and we preliminarily inferred that the early enrichment groups prefer r-strategy species, while the late enrichment groups prefer k-strategy species.
In conclusion, we observed that the bacterial and fungal community composition changed significantly in the forests with different successional stages in the broad-leaved Korean pine forest. Both shifted from r-strategy groups in the early stages to k-strategy in the late stages. The above research results are consistent with our hypothesis.

4.3. Effects of Soil Factors on Soil Microbial Community Composition in Forests across Successional Stages

Exploring the influence of soil characteristics on soil microbial community composition during forest succession can help understand the mechanism of the changes in soil microbial community composition [63]. Our study observed that SWC was one of the significant factors changing bacterial and fungal community structure (Figure 6a,b). This may be attributed to the dramatic decrease in forests with different successional stages. However, soil water changes may not be the consequence of forest succession and are more likely to be influenced by the microclimate [67] and geographical location [68]. In addition to SWC, AP was the key factor affecting bacterial community composition (Figure 6a). On the other hand, the vital determinants of the fungal community composition were SOC, TN, TK and the C/N ratio (Figure 6b). In the early successional forest, the lower TP, AP and higher Pho activity indicate P restriction [57,58]. Alternatively, the growth of the r-strategy group was more sensitive to soil phosphorus content [55]. The low soil phosphorus content in the ES forest is a key factor restricting the development of the r-strategy group. Furthermore, Ure and Suc activity increased considerably, and SOC and TN decreased considerably from the early to the late successional forest, suggesting that the microbial communities shifted from soil phosphorus limitation to nitrogen and carbon limitation with the forest succession [58], which accounts for the dominance of k-strategy groups in the LS forest.
Soil carbon and nitrogen are essential indicators for measuring soil nutrients and critically affecting microbial community composition and structure [19,21]. It is noteworthy that SOC and TN have less impact on the variation of soil bacterial community composition but significantly impact the growth of the fungal community (Figure 6a,b). This was due to the bacteria being more sensitive to soil P content in this work. Previous studies have shown that copiotrophic species are positively correlated with soil carbon content, while oligotrophic species are negatively correlated with soil carbon content [8,27,62]. This also explains that the abundance of Bacteroidetes, Ascomycota and Mortierellomycota significantly decreased and that of Actinobacteria and Basidiomycota notably increased with forest succession. Interestingly, there is no significant correlation between Proteobacteria abundance and SOC, contrary to prior findings [3,41]. This may be due to the effect of SWC. For example, in our study, Proteobacteria and Gammaproteobacteria were increased significantly with the increase in SWC (Figure A1 and Figure A2), consistent with previous work [19].
In addition, SOC and TN concentration were also the crucial factors for the switch of class-level community structure in forests in three successional stages. SOC and TN were significantly positively correlated with Bacteroidia, Sordariomycetes and Mortierellomycetes (p < 0.05), while negatively related to Agaricomycetes, Geminibasidiomycetes and Tremellomycetes (p < 0.05) (Figure A2). These results demonstrated that niche shifts also occurred in bacterial and fungal class levels due to the different carbon source utilization. It further verified our hypothesis that the early enrichment groups prefer r-strategy species while the late enrichment groups prefer k-strategy species. Moreover, soil enzyme activity, as an indicator measure of biological activity and productivity of soil, may affect the soil microbial community [69]. In contrast, we observed that soil enzyme activity had a weak effect on the changes of soil bacterial and fungal communities but a substantial effect on individual bacterial or fungal species. Therefore, we should focus on the relationship between particular bacteria or fungi and soil enzyme activity in future research. In conclusion, we observed that soil properties were the significant factors leading to the changes in bacterial and fungal community structure. Specifically, SOC and TN were the critical factors for the transformation of r-strategy groups and k-strategy groups.

5. Conclusions

Overall, this study provides insight into the features of successional strategies of soil bacterial and fungal communities in three forests with different successional stages. Based on our results, forest succession in this specific area resulted in the change of soil bacterial and fungal community composition, which shifted from r-strategy groups dominating in the early successional forest to k-strategy groups dominating in the late successional forest. Soil microbial community composition changed from bacteria-dominated in the early successional forest to fungi in the late successional forest. Soil bacterial community changed from Bacteroidetes-dominated in the early successional forest to Actinobacteria-dominated in the late successional forest. While soil fungal community changed from Ascomycota- and Mortierellomycota-dominated to Basidiomycota. The effects of forest succession on soil bacterial and fungal diversity were different. Soil bacterial community diversity increased, while soil fungal community diversity decreased as the succession proceeded. The changes in soil properties in forest succession are the key factor leading to the variation in soil microbial community composition. Particularly, changes in soil organic carbon and nitrogen content resulted in the shifting of microbial species with different ecological strategies.

Author Contributions

Conceptualization, K.Z. and Q.W.; methodology, K.Z. and Q.W.; software, K.Z. and Y.Z.; validation, K.Z., Q.W. and Y.Z.; formal analysis, K.Z., Q.W. and Y.Z.; investigation. and resources, K.Z., Q.W., Y.Z., L.X. and S.M.; writing—original draft preparation, K.Z.; writing—review and editing, K.Z., Q.W. and N.Z.; supervision, project administration and funding acquisition, Q.W. All authors have read and agreed to the published version of the manuscript.

Funding

This work was financially supported by the Fundamental Research Funds for the Central Universities (2572017PZ03 and 2572019CP16) and the Heilongjiang Provincial Government for National Key Research Programs (GX18B022).

Data Availability Statement

Not applicable.

Acknowledgments

We thank Jianwen Hu, Rui Gong and Hongli Li for their help and support in the fieldwork and the laboratory work. We also appreciate the field assistance of Heilongjiang Province’s Liangshui National Nature Reserve involved in the initial sampling assignments.

Conflicts of Interest

No one declared any conflicts of interest.

Appendix A

Table A1. Based on the general linear model, the changes of bacterial and fungal class-level communities in broad-leaved Korean pine forest at different succession stages in Lesser Hinggan Mountains.
Kingdom.PhylumClassAverage Relative Abundance (%)R2Slope ± SEp-Value
BacteriaProteobacteriaAlphaproteobacteria20.030.273−0.809 ± 0.4990.149
Gammaproteobacteria6.810.689−1.333 ± 0.3390.006 **
Deltaproteobacteria5.100.087−0.186 ± 0.2280.441
AcidobacteriaAcidobacteriia8.020.868−2.741 ± 0.404<0.001 **
Subgroup_67.130.5131.444 ± 0.5320.03 *
Subgroup_42.290.3200.323 ± 0.1780.112
Holophagae1.310.459−0.514 ± 0.2110.045 *
ActinobacteriaActinobacteria5.790.0390.171 ± 0.3210.611
Thermoleophilia5.190.4430.569 ± 0.2410.051
Acidimicrobiia2.250.2530.228 ± 0.1480.167
MB-A2-1081.340.2050.122 ± 0.0910.221
BacteroidetesBacteroidia2.580.698−0.34 ± 0.0850.005 **
ChloroflexiKD4-963.000.0030.03 ± 0.2030.886
TK101.040.643−0.465 ± 0.1310.009 **
RokubacteriaNC104.450.069−0.178 ± 0.2480.496
GemmatimonadetesGemmatimonadetes2.100.453−0.385 ± 0.1600.047 *
VerrucomicrobiaVerrucomicrobiae12.020.3185.128 ± 2.8380.114
FungiAscomycotaLeotiomycetes17.120.015−0.006 ± 0.0190.75
Sordariomycetes6.900.500−0.138 ± 0.0520.033 *
Eurotiomycetes1.900.674−0.284 ± 0.0750.007 *
Dothideomycetes1.690.348−0.245 ± 0.1270.095
MortierellomycotaMortierellomycetes9.310.947−0.129 ± 0.012<0.001 **
BasidiomycotaAgaricomycetes33.500.5930.022 ± 0.0070.015 *
Geminibasidiomycetes3.230.6680.141 ± 0.0380.007 **
Microbotryomycetes2.260.2670.214 ± 0.1340.155
Tremellomycetes2.150.7710.507 ± 0.1040.002 **
Note: “*” and “**” indicate a significant correlation at p < 0.05 and p < 0.01, respectively.
Figure A1. Correlation analysis between bacterial (a) and fungal (b) phylum communities and soil properties in broad-leaved Korean pine forest at different succession stages in Lesser Hinggan Mountains. SOC, TN, TP, TK, AP, SWC, Pho, Ure, Suc represents the abbreviations of soil organic carbon, total nitrogen, total phosphorus, total potassium, available phosphorus, soil water content, acid phosphatase, urease, sucrase, respectively. “*” and “**” indicate a significant correlation at p < 0.05 and p < 0.01, respectively.
Forests 13 00625 g0a1
Figure A2. Correlation analysis between bacterial (a) and fungal (b) class communities and soil properties in broad-leaved Korean pine forest at different succession stages in Lesser Hinggan Mountains. SOC, TN, TP, TK, AP, SWC, Pho, Ure, Suc represents the abbreviations of soil organic carbon, total nitrogen, total phosphorus, total potassium, available phosphorus, soil water content, acid phosphatase, urease, sucrase, respectively. “*” and “**” indicate a significant correlation at p < 0.05 and p < 0.01, respectively.
Forests 13 00625 g0a2

References

  1. Finegan, B. Forest succession (reply). Nature 1985, 315, 692. [Google Scholar] [CrossRef]
  2. Walker, L.R.; Walker, J.; Hobbs, R.J. Linking Restoration and Ecological Succession; Springer: Berlin, Germany, 2007. [Google Scholar]
  3. Zhang, C.; Liu, G.; Xue, S.; Wang, G. Soil bacterial community dynamics reflect changes in plant community and soil properties during the secondary succession of abandoned farmland in the Loess Plateau. Soil Biol. Biochem. 2016, 97, 40–49. [Google Scholar] [CrossRef]
  4. Zhao, C.; Long, J.; Liao, H.; Zheng, C.; Li, J.; Liu, L.; Zhang, M. Dynamics of soil microbial communities following vegetation succession in a karst mountain ecosystem, Southwest China. Sci. Rep. 2019, 9, 2160. [Google Scholar] [CrossRef] [PubMed]
  5. Bernard, L.; Mougel, C.; Maron, P.A.; Nowak, V.; Leveque, J.; Henault, C.; Haichar, F.Z.; Berge, O.; Marol, C.; Balesdent, J.; et al. Dynamics and identification of soil microbial populations actively assimilating carbon from 13C-labelled wheat residue as estimated by DNA- and RNA-SIP techniques. Environ. Microbiol. 2007, 9, 752–764. [Google Scholar] [CrossRef] [PubMed]
  6. Fang, X.; Yu, D.; Zhou, W.; Zhou, L.; Dai, L. The effects of forest type on soil microbial activity in Changbai Mountain, Northeast China. Ann. For. Sci. 2016, 73, 473–482. [Google Scholar] [CrossRef] [Green Version]
  7. Morrissey, E.M.; Mau, R.L.; Schwartz, E.; McHugh, T.A.; Dijkstra, P.; Koch, B.J.; Marks, J.C.; Hungate, B.A. Bacterial carbon use plasticity, phylogenetic diversity and the priming of soil organic matter. ISME J. 2017, 11, 1890–1899. [Google Scholar] [CrossRef]
  8. Fierer, N.; Bradford, M.A.; Jackson, R.B. Toward an ecological classification of soil bacteria. Ecology 2007, 88, 354–1364. [Google Scholar] [CrossRef]
  9. Zhou, Z.; Wang, C.; Jiang, L.; Luo, Y. Trends in soil microbial communities during secondary succession. Soil Biol. Biochem. 2017, 115, 92–99. [Google Scholar] [CrossRef]
  10. Yan, B.; Sun, L.; Li, J.; Liang, C.; Wei, F.; Xue, S.; Wang, G. Change in composition and potential functional genes of soil bacterial and fungal communities with secondary succession in Quercus liaotungensis forests of the Loess Plateau, western China. Geoderma 2020, 364, 114199. [Google Scholar] [CrossRef]
  11. Kielak, A.M.; Barreto, C.C.; Kowalchuk, G.A.; van Veen, J.A.; Kuramae, E.E. The Ecology of Acidobacteria: Moving beyond Genes and Genomes. Front. Microbiol. 2016, 7, 744. [Google Scholar] [CrossRef] [Green Version]
  12. Liu, G.; Chen, L.; Shi, X.; Yuan, Z.; Yuan, L.Y.; Lock, T.R.; Kallenbach, R.L. Changes in rhizosphere bacterial and fungal community composition with vegetation restoration in planted forests. Land Degrad. Dev. 2019, 30, 1147–1157. [Google Scholar] [CrossRef]
  13. Cai, Z.; Zhang, Y.; Yang, C.; Wang, S. Land-use type strongly shapes community composition, but not always diversity of soil microbes in tropical China. Catena 2018, 165, 369–380. [Google Scholar] [CrossRef]
  14. Jia, G.; Zhang, P.; Wang, G.; Cao, J.; Han, J.; Huang, Y. Relationship Between Microbial Community and Soil Properties During Natural Succession of Abandoned Agricultural Land.pdf. For. Ecol. Manag. 2010, 20, 352–360. [Google Scholar]
  15. Lin, Q.; Baldrian, P.; Li, L.; Novotny, V.; Hedenec, P.; Kukla, J.; Umari, R.; Meszarosova, L.; Frouz, J. Dynamics of Soil Bacterial and Fungal Communities During the Secondary Succession Following Swidden Agriculture IN Lowland Forests. Front. Microbiol. 2021, 12, 676251. [Google Scholar] [CrossRef]
  16. Zhang, X.; Liu, S.; Hong, Y.; Fu, S. Changes on Community Structure and Diversity of Soil Bacterial Community during the Succession of Quercus wutaishanica. Sci. Silvae Sin. 2019, 55, 193–202. [Google Scholar] [CrossRef]
  17. Nakayama, M.; Imamura, S.; Taniguchi, T.; Tateno, R. Does conversion from natural forest to plantation affect fungal and bacterial biodiversity, community structure, and co-occurrence networks in the organic horizon and mineral soil? For. Ecol. Manag. 2019, 446, 238–250. [Google Scholar] [CrossRef]
  18. Piao, Z.; Yang, L.; Zhao, L.; Yin, S. Actinobacterial community structure in soils receiving long-term organic and inorganic amendments. Appl. Environ. Microbiol. 2008, 74, 526–530. [Google Scholar] [CrossRef] [Green Version]
  19. Jiang, S.; Xing, Y.; Liu, G.; Hu, C.; Wang, X.; Yan, G.; Wang, Q. Changes in soil bacterial and fungal community composition and functional groups during the succession of boreal forests. Soil Biol. Biochem. 2021, 161, 108393. [Google Scholar] [CrossRef]
  20. Ren, C.; Liu, W.; Zhao, F.; Zhong, Z.; Deng, J.; Han, X.; Yang, G.; Feng, Y.; Ren, G. Soil bacterial and fungal diversity and compositions respond differently to forest development. Catena 2019, 181, 104071. [Google Scholar] [CrossRef]
  21. Zhong, Z.; Wang, X.; Zhang, X.; Zhang, W.; Xu, Y.; Ren, C.; Han, X.; Yang, G. Edaphic factors but not plant characteristics mainly alter soil microbial properties along a restoration chronosequence of Pinus tabulaeformis stands on Mt. Ziwuling, China. For. Ecol. Manag. 2019, 453, 117625. [Google Scholar] [CrossRef]
  22. Li, S.; Huang, X.; Shen, J.; Xu, F.; Su, J. Effects of plant diversity and soil properties on soil fungal community structure with secondary succession in the Pinus yunnanensis forest. Geoderma 2020, 379, 114646. [Google Scholar] [CrossRef]
  23. Wang, Z.; Bai, Y.; Hou, J.; Li, F.; Li, X.; Cao, R.; Deng, Y.; Wang, H.; Jiang, Y.; Yang, W. The Changes in Soil Microbial Communities across a Subalpine Forest Successional Series. Forests 2022, 13, 289. [Google Scholar] [CrossRef]
  24. Cline, L.C.; Zak, D.R. Soil microbial communities are shaped by plant-driven changes in resource availability during secondary succession. Ecology 2015, 96, 3374–3385. [Google Scholar] [CrossRef] [PubMed]
  25. Fierer, N.; Lauber, C.L.; Ramirez, K.S.; Zaneveld, J.; Bradford, M.A.; Knight, R. Comparative metagenomic, phylogenetic and physiological analyses of soil microbial communities across nitrogen gradients. ISME J. 2012, 6, 1007–1017. [Google Scholar] [CrossRef] [PubMed] [Green Version]
  26. Li, H.; Ye, D.; Wang, X.; Settles, M.L.; Wang, J.; Hao, Z.; Zhou, L.; Dong, P.; Jiang, Y.; Ma, Z. Soil bacterial communities of different natural forest types in Northeast China. Plant Soil 2014, 383, 203–216. [Google Scholar] [CrossRef]
  27. Lauber, C.L.; Hamady, M.; Knight, R.; Fierer, N. Pyrosequencing-based assessment of soil pH as a predictor of soil bacterial community structure at the continental scale. Appl. Environ. Microbiol. 2009, 75, 5111–5120. [Google Scholar] [CrossRef] [PubMed] [Green Version]
  28. Thoms, C.; Gattinger, A.; Jacob, M.; Thomas, F.M.; Gleixner, G. Direct and indirect effects of tree diversity drive soil microbial diversity in temperate deciduous forest. Soil Biol. Biochem. 2010, 42, 1558–1565. [Google Scholar] [CrossRef]
  29. van der Heijden, M.G.; Bardgett, R.D.; van Straalen, N.M. The unseen majority: Soil microbes as drivers of plant diversity and productivity in terrestrial ecosystems. Ecol. Lett. 2008, 11, 296–310. [Google Scholar] [CrossRef]
  30. Sun, Y.; Wang, C.; Yang, J.; Liao, J.; Chen, H.Y.H.; Ruan, H.; Xu, X. Elevated CO2 shifts soil microbial communities from k- to r-strategists. Glob. Ecol. Biogeogr. 2021, 30, 961–972. [Google Scholar] [CrossRef]
  31. Jones, R.T.; Robeson, M.S.; Lauber, C.L.; Hamady, M.; Knight, R.; Fierer, N. A comprehensive survey of soil acidobacterial diversity using pyrosequencing and clone library analyses. ISME J. 2009, 3, 442–453. [Google Scholar] [CrossRef]
  32. Chen, Y.-L.; Xu, T.-L.; Veresoglou, S.D.; Hu, H.-W.; Hao, Z.-P.; Hu, Y.-J.; Liu, L.; Deng, Y.; Rillig, M.C.; Chen, B.-D. Plant diversity represents the prevalent determinant of soil fungal community structure across temperate grasslands in northern China. Soil Biol. Biochem. 2017, 110, 12–21. [Google Scholar] [CrossRef]
  33. Liu, C.; Xing, S.; Ma, H.; Du, Z.; MA, B. Effects of inoculating plant growth-promoting rhizobacteria on the biological characteristics of walnut (Juglans regia) rhizosphere soil under drought condition. Chin. J. Appl. Ecol. 2014, 25, 1475–1482. [Google Scholar] [CrossRef]
  34. Liao, H.; Huang, F.; Li, D.; Kang, L.; Chen, B.; Zhou, T.; Peng, S. Soil microbes regulate forest succession in a subtropical ecosystem in China: Evidence from a mesocosm experiment. Plant Soil 2018, 430, 277–289. [Google Scholar] [CrossRef]
  35. Liu, Y.; Zhang, W. Biodivers. Anal. Differ. Communities Broad-Leaved Korean Pine For. Xiaoxing’an Mountains. For. Eng. 2022, 38, 27–33. [Google Scholar] [CrossRef]
  36. Yang, X.; Lin, W.; Wu, Z. The species-abundance distribution pattern of broad-leaved Korean pine forest in the Lesser Khingan mountains. J. Cent. South Univ. For. Technol. 2020, 40, 104–113. [Google Scholar] [CrossRef]
  37. Shi, B.; Jin, G.; Wang, Z. Temporal and spatial variability in soil respiration in five temperate forests in Xiaoxing’an Mountains, China. Acta Ecol. Sin. 2012, 32, 5416–5428. [Google Scholar] [CrossRef]
  38. Gao, F.; Cui, X.; Sang, Y.; Song, J. Changes in soil organic carbon and total nitrogen as affected by primary forest conversion. For. Ecol. Manag. 2020, 463, 118013. [Google Scholar] [CrossRef]
  39. Bunnell, F.L.; Vales, D.J. Comparison of methods for estimating forest overstory cover: Differences among techniques. Can. J. For. Res. 1990, 20, 101–107. [Google Scholar] [CrossRef]
  40. Zhang, L.; Zhang, D.; Mao, Z. Charicateristic of Soil Oranic Carbon and Its Components in Different Successional Series of Broadleaved Korean Pine Forest in Xiaoxing’an Mountains. Sci. Silvae Sin. 2017, 53, 11–17. [Google Scholar]
  41. Zhang, W.; Qiao, W.; Gao, D.; Dai, Y.; Deng, J.; Yang, G.; Han, X.; Ren, G. Relationship between soil nutrient properties and biological activities along a restoration chronosequence of Pinus tabulaeformis plantation forests in the Ziwuling Mountains, China. Catena 2018, 161, 85–95. [Google Scholar] [CrossRef]
  42. Sparks, D.L.; Page, A.L.; Helmke, P.A.; Loeppert, R.H.; Soltanpour, P.N.; Tabatabai, M.A.; Johnston, C.T.; Sumner, M.E. Methods of Soil Analysis. Part. 3. Chemical Methods; John Wiley & Sons: Hoboken, NJ, USA, 1996. [Google Scholar] [CrossRef] [Green Version]
  43. Yao, H.; Huang, C. Soil Microbiology Ecology and Experimental Technology; China Science Publishing and Media Ltd.: Beijing, China, 2006. [Google Scholar]
  44. Bolyen, E.; Rideout, J.R.; Dillon, M.R.; Bokulich, N.A.; Abnet, C.; Al-Ghalith, G.A.; Alexander, H.; Alm, E.J.; Arumugam, M.; Asnicar, F.; et al. QIIME 2: Reproducible, Interactive, Scalable, and Extensible Microbiome Data Scienc. PeerJ Prepr. 2018, 6, e27295v2. [Google Scholar]
  45. Callahan, B.J.; McMurdie, P.J.; Rosen, M.J.; Han, A.W.; Johnson, A.J.; Holmes, S.P. DADA2: High-resolution sample inference from Illumina amplicon data. Nat. Methods 2016, 13, 581–583. [Google Scholar] [CrossRef] [PubMed] [Green Version]
  46. Chao, A. Nonparametric estimation of the number of classes in a population. Scand. J. Stat. 1984, 4, 265–270. [Google Scholar]
  47. Shannon, P.; Markiel, A.; Ozier, O.; Baliga, N.S.; Wang, J.T.; Ramage, D.; Amin, N.; Schwikowski, B.; Ideker, T. Cytoscape: A software environment for integrated models of biomolecular interaction networks. Genome Res. 2003, 13, 2498–2504. [Google Scholar] [CrossRef] [PubMed]
  48. Simpson, E.H. Measurement of diversity. Nature 1949, 163, 688. [Google Scholar] [CrossRef]
  49. Segata, N.; Izard, J.; Waldron, L.; Biology, D.G.J.G. Metagenomic biomarker discovery and explanation. Genome Biol. 2011, 12, R60. [Google Scholar] [CrossRef] [Green Version]
  50. Team, R.C. R: A Language and Environment for Statistical Computing; Team, R.C: Vienna, Austria, 2013. [Google Scholar]
  51. Aanderud, Z.T.; Lennon, J.T. Validation of heavy-water stable isotope probing for the characterization of rapidly responding soil bacteria. Appl. Environ. Microbiol. 2011, 77, 4589–4596. [Google Scholar] [CrossRef] [Green Version]
  52. Siles, J.A.; Margesin, R. Abundance and Diversity of Bacterial, Archaeal, and Fungal Communities Along an Altitudinal Gradient in Alpine Forest Soils: What Are the Driving Factors? Microb. Ecol. 2016, 72, 207–220. [Google Scholar] [CrossRef] [Green Version]
  53. Shen, C.; Xiong, J.; Zhang, H.; Feng, Y.; Lin, X.; Li, X.; Liang, W.; Chu, H. Soil pH drives the spatial distribution of bacterial communities along elevation on Changbai Mountain. Soil Biol. Biochem. 2013, 57, 204–211. [Google Scholar] [CrossRef]
  54. Hooper, D.U.; Bignell, D.E.; Brown, V.K.; Brussard, L.; Dangerfield, J.M.; Wall, D.H.; Wardle, D.A.; Coleman, D.C.; Giller, K.E.; Lavelle, P.J.B. Interactions between Aboveground and Belowground Biodiversity in Terrestrial Ecosystems: Patterns, Mechanisms, and Feedbacks. Bioscience 2000, 50, 1049–1061. [Google Scholar] [CrossRef]
  55. Sterner, R.W.; Elser, J.J. Ecological Stoichiometry: The Biology of Elements from Molecules to the Biosphere; Princeton University Press: Princeton, NJ, USA, 2003. [Google Scholar] [CrossRef] [Green Version]
  56. Elser, J.J.; Sterner, R.W.; Gorokhova, E.; Fagan, W.F.; Markow, T.A.; Cotner, J.B.; Harrison, J.F.; Hobbie, S.E.; Odell, G.M.; Weider, L.W. Biological stoichiometry from genes to ecosystems. Ecol. Lett. 2008, 3, 540–550. [Google Scholar] [CrossRef]
  57. Su, Q. Growth rate hypothesis research progresses: Implications for zooplankton. Adv. Earth Sci. 2012, 27, 1204–1210. [Google Scholar]
  58. Yan, B.; Sun, L.; Li, J.; Gao, L.; Qiao, Z.; Gao, X.; Wu, C.; Wang, G. Changes of soil enzyme activity and their stoichiometric characteristics during secondary succession of Quercus liaotungensis forests. Chin. J. Ecol. 2021, 2021, 1–9. [Google Scholar] [CrossRef]
  59. Bai, X.; Shi, R.; You, Y.; Shen, H.; Han, S.; Zhang, Y. Bacterial community structure and diversity in soils of different forest ages and types in Baotianman forest, Henan Province, China. Chin. J. Appl. Ecol. 2015, 26, 2273–2281. [Google Scholar] [CrossRef]
  60. Chi, Y.; Liu, Z.; Bao, P. Decomposition and succession of wood by microflora on wood. J. Fungal Res. 2004, 2, 51–57. [Google Scholar] [CrossRef]
  61. Li, Q.; Wei, Y. Species composition and distribution characteristics of wood-decaying fungi in tropical areas of China. Res. Pap. 2021, 40, 2653–2672. [Google Scholar] [CrossRef]
  62. Urbanová, M.; Šnajdr, J.; Baldrian, P. Composition of fungal and bacterial communities in forest litter and soil is largely determined by dominant trees. Soil Biol. Biochem. 2015, 84, 53–64. [Google Scholar] [CrossRef]
  63. Chase, J.M. Community assembly: When should history matter? Oecologia 2003, 136, 489–498. [Google Scholar] [CrossRef]
  64. Padmanabhan, P.; Padmanabhan, S.; DeRito, C.; Gray, A.; Gannon, D.; Snape, J.R.; Tsai, C.S.; Park, W.; Jeon, C.; Madsen, E.L. Respiration of 13C-labeled substrates added to soil in the field and subsequent 16S rRNA gene analysis of 13C-labeled soil DNA. Appl. Env. Microbiol. 2003, 69, 1614–1622. [Google Scholar] [CrossRef] [Green Version]
  65. Liu, C.; Dong, Y.; Jiao, R. Research Progress in Acidobacteria Diversity in Forest Soil. World For. Res. 2016, 29, 17–22. [Google Scholar] [CrossRef]
  66. Barns, S.M.; Cain, E.C.; Sommerville, L.; Kuske, C.R. Acidobacteria phylum sequences in uranium-contaminated subsurface sediments greatly expand the known diversity within the phylum. Appl. Environ. Microbiol. 2007, 73, 3113–3116. [Google Scholar] [CrossRef] [Green Version]
  67. Staudt, K.; Serafimovich, A.; Siebicke, L.; Pyles, R.D.; Falge, E. Vertical structure of evapotranspiration at a forest site (a case study). Agric. For. Meteorol. 2011, 151, 709–729. [Google Scholar] [CrossRef]
  68. Liu, Z.; Wang, Y.; Tian, A.; Yu, P.; Xiong, W.; Xu, L.; Wang, Y. Intra-Annual Variation of Stem Radius of Larix principis-rupprechtii and Its Response to Environmental Factors in Liupan Mountains of Northwest China. Forests 2017, 8, 382. [Google Scholar] [CrossRef] [Green Version]
  69. Caldwell, B.A. Enzyme activities as a component of soil biodiversity: A review. Pedobiologia 2005, 49, 637–644. [Google Scholar] [CrossRef]
Figure 1. Changes in alpha-diversity of soil bacteria and fungi of broad-leaved Korean pine forest at different successional stages in Lesser Hinggan Mountains. (ad) for the alpha-diversity of bacteria; (eh) for the alpha-diversity of fungi. ES: Early-stage; IS: Intermediate-stage; LS: Late-stage.
Forests 13 00625 g001
Figure 2. Pearson correlation between alpha-diversity of soil microbial community and soil properties of broad-leaved Korean pine forest in Lesser Hinggan Mountains. “B-” for the bacterial community; “F-” for the fungal community. “*” indicate a significant correlation at p < 0.05.
Forests 13 00625 g002
Figure 3. Relative abundance of soil bacterial (a), fungal (b) phylum-level composition and the ratio of relative abundance (c,d) with three successional stages of broad-leaved Korean pine forest in Lesser Hinggan Mountains. ES: Early-stage; IS: Intermediate-stage; LS: Late-stage. Pro: Proteobacteria; Aci: Acidobacteria; Act: Actinobacteria; Ver: Verrucomicrobia; Chl: Chloroflexi; Rok: Rokubacteria; Bac: Bacteroidetes; Gem: Gemmatimonadete; Fir: Firmicutes; Nit: Nitrospirae; Bas: Basidiomycota; Asc: Ascomycota; Mor: Mortierellomycota; Roz:Rozellomycota. Different letters indicate significant differences (p < 0.05).
Forests 13 00625 g003
Figure 4. Relative abundance of soil bacteria (a) and fungi (b) class-level composition with three successional stages of broad-leaved Korean pine forest in Lesser Hinggan Mountains. ES: Early-stage; IS: Intermediate-stage; LS: Late-stage.
Forests 13 00625 g004
Figure 5. LDA Effect Size analysis of soil bacteria (a) and fungi (b) communities in different successional stages of broad-leaved Korean pine forest in Lesser Hinggan Mountains. ES: Early-stage; IS: Intermediate-stage; LS: Late-stage. We only provide LDA > 3.5 for bacterial community and LDA > 4 for fungal community.
Forests 13 00625 g005
Figure 6. RDA analysis of soil bacterial (a,c) and fungal (b,d) dominant community composition at phylum (a,b) and class (c,d) level, and soil properties in the broad-leaved Korean pine forest at different successional stages in Lesser Hinggan Mountains. ES: Early-stage; IS: Intermediate-stage; LS: Late-stage.
Forests 13 00625 g006
Table 1. Stand features of broad-leaved Korean pine forest at different successional stages in Lesser Hinggan Mountains.
Forest Stand
Features
Forest Successional Stages
Early-StageIntermediate-StageLate-Stage
Tree composition *60% Betula platyphylla, 20% Populus davidiana, 10% Abies nephlolepis, 10% Ulmus davidiana and others40% Fraxinus mandshurica, 20% Ulmus davidiana, 20% Populus davidiana,10% Quercus mongolica, 10% Acer mono and others60% Pinus koraiensis, 20% Fraxinus mandshurica, 10% Abies nephlolepis,10% Tilia amurensis and others
Mean height (m)22.0320.5724.50
Mean DBH (cm)20.6822.7633.90
Canopy closure0.80.80.8
Forest typeSecondary birch forestSelection cutting forestMixed broad-leaved Korean pine forest
Age of stand<6080–120>300
Note: * Species composition was based on the ratio of basal area of tree species to the stand total.
Table 2. Changes in soil properties in the forest with different successional stages of broad-leaved Korean pine forest in the Lesser Hinggan Mountains.
Soil Properties IndexForest Successional Stages
Early-StageIntermediate-StageLate-Stage
SOC(g/kg)80.28 ± 2.52 a81.94 ± 1.17 a60.28 ± 0.74 b
TN(g/kg)4.93 ± 0.075 b6.14 ± 0.07 a3.13 ± 0.07 c
C/N16.31 ± 0.70 b13.35 ± 0.14 c19.27 ± 0.56 a
TP(g/kg)0.83±0.02 a0.64±0.03 b0.87±0.01 a
TK(g/kg)8.32 ± 0.38 b8.53 ± 0.25 b13.08 ± 0.12 a
AP(mg/kg)4.22 ± 0.37 a4.79 ± 0.16 a4.76 ± 0.16 a
pH5.10 ± 0.09 b5.29 ± 0.09 b5.82 ± 0.13 a
SWC(%)39.43 ± 0.70 a29.30 ± 0.67 b22.63 ± 0.38 c
Pho(mg/g 24 h)3.03 ± 0.03 a2.84 ± 0.04 ab2.53 ± 0.23 b
Ure(mg/g 24 h)2.42 ± 0.23 b8.54 ± 0.23 a1.69 ± 0.03 c
Suc(mg/g 24 h)2.75 ± 0.71 b8.45 ± 9.67 a8.06 ± 2.06 a
Note: SOC, TN, TP, TK, AP, SWC, Pho, Ure, Suc represents the abbreviations of soil organic carbon, total nitrogen, total phosphorus, total potassium, available phosphorus, soil water content, acid phosphatase, urease, sucrase, respectively. Different letters indicate significant differences in each successional stage (p < 0.05).
Publisher’s Note: MDPI stays neutral with regard to jurisdictional claims in published maps and institutional affiliations.

