Article

Distributions and Influencing Factors of Soil Organic Carbon Fractions under Different Vegetation Restoration Conditions in a Subtropical Mountainous Area, SW China

1
Yunnan Key Laboratory for Plateau Mountain Ecology and Restoration of Degraded Environments, School of Ecology and Environmental Sciences, Yunnan University, Kunming 650091, China
2
Department of Life School and Technology, Kunming University, Kunming 650214, China
3
Yunnan International Cooperative Center of Plateau Lake Ecological Restoration and Watershed Management & Yunnan Think Tank of Ecological Civilization, Kunming 650091, China
*
Author to whom correspondence should be addressed.
Both authors contributed equally to this work.
Submission received: 14 March 2022 / Revised: 13 April 2022 / Accepted: 14 April 2022 / Published: 17 April 2022
(This article belongs to the Special Issue Soil Carbon Storage in Forests: Mechanisms, Dynamics, and Management)

Abstract

:
Vegetation type is known to affect soil organic carbon (SOC) storage. However, the magnitudes and distributions of SOC sequestration and driving factors for different vegetation types are still largely unknown. Thus, we studied the changes in SOC fractions along soil profiles for different vegetation restoration types and their relationships with soil properties. We selected five vegetation types and collected soil samples from depth intervals of 0–10, 10–30, 30–60, and 60–90 cm. Five soil carbon fractions and the soil properties were tested to evaluate the soil carbon fraction distributions and influencing factors. Our results demonstrated that the concentrations of total organic carbon (TOC) and five carbon fractions were strongly affected by vegetation types and soil depths. The concentrations of all five soil carbon fractions in 0–10 cm depth were higher than those in the other three soil depths and generally increased with vegetation complexity. The Pearson correlations and redundancy analysis showed that the fractions of soil glomalin-related soil protein (GRSP) and Fe oxides as well as the soil bulk densities, were the most significant related to soil TOC levels and carbon fractions, which suggests that soil biochemical and physicochemical processes are among the most important mechanisms that contribute to SOC persistence. Considering the sensitive indices of the soil carbon variables and PCA results, soil permanganate oxidizable carbon (POXC) was considered to be the most sensitive index for differentiating the effects of vegetation types. These results provide important information regarding the distributions and driving factors of the carbon fractions that result from different vegetation restoration types and will help to improve our understanding of soil carbon sequestration during vegetation restoration processes.

1. Introduction

Soil stores the largest terrestrial organic carbon pool on Earth and it is a major source and sink of atmospheric CO2 in mitigating the greenhouse effect [1]. Soil organic carbon (SOC) is a key indicator for evaluating soil quality because of its physicochemical properties, biological processes, and ecological functions [2,3,4]. Ecological restoration is widely considered as a way to improve SOC sequestration and ecosystem services for different land-cover types [5]. Through the differences in carbon inputs from biota and losses through decomposition, different types of vegetation restoration have the potential to influence soil carbon storage and carbon dynamics, as reported in previous research [6,7]. Therefore, it is necessary to understand the influences of vegetation restoration on soil C distributions and stocks to evaluate the soil carbon sequestration capacities and maintain ecological sustainability.
Generally, the total organic carbon (TOC) levels change slowly and are insensitive to vegetation restoration over short time periods. In contrast to TOC, the soil carbon fractions, especially the labile organic C fractions, can often be used to assess the impacts of land cover or management [8,9]. The soil carbon fractions mainly include dissolved organic carbon (DOC), particulate organic carbon (POC), permanganate oxidizable carbon (POXC), light fraction organic carbon (LFOC), and heavy fraction organic carbon (HFOC). Due to the easy decomposition and short turnover times, the labile C fractions (e.g., DOC, POXC, POC, and LFOC) are widely adopted as indicators of soil ecosystems to reveal how the SOC responds to land-cover change [10,11,12]. In addition, more comprehensive indices based on soil carbon lability, such as the stability index (SI), carbon pool management index (CMI), and soil carbon sequestration capacity (SCS), have been widely used in many previous studies to assess soil quality and soil carbon stability [6,13,14]. However, there is a need for a comprehensive understanding of the dynamic changes in the SOC fractions under different vegetation restoration types. In addition, the driving factors that control the SOC pool and its fractions are still largely unknown.
The soil physicochemical properties that are induced by different vegetation types are significant factors that influence the distributions of TOC and its fractions. Some studies have reported that soil properties (such as pH, bulk density, total nitrogen) are closely associated with the SOC and its fractions [15,16,17]. Moreover, soil microbial communities play important roles in soil structures and carbon cycling. Glomalin-related soil protein (GRSP), produced by arbuscular mycorrhizal fungi (AMF), acts as cementing material to form soil structures and contributes over 20 times more than the microbial biomass to SOC [18]. GRSP have been demonstrated that it might be sensitive indicator of soil C stock and ability [19,20]. In addition, soil extracellular polysaccharide (EPS) is another important organic cementing material that helps to promote soil carbon stability through the production of soil aggregates [21]; for example, bacteria exude extracellular polysaccharides that promote the stability of soil microaggregates (<250 μm) [22], and saprotrophic fungi can also release extracellular polysaccharides that facilitate formation of soil water-stable aggregates [23]. However, few data are available on the correlations between biochemical properties, for example, GRSP and EPS, and soil carbon fraction pools, as well as on the different contributions of the soil biochemical and physicochemical properties in soil carbon distributions among different vegetation restoration types.
As an area with high biodiversity, the Mid-Yunnan area in China continues to be influenced by human activity and disturbance. Deforestation of original natural forest or conversion from forest to arable land in the 1960s led to profound changes in soil quality and service. Several ecological restoration measures, including natural recovery and plantations of fast-growing Pinus species, supply the conditions for elucidating the effects of ecological restoration measures on soil C distributions [24,25]. This study therefore evaluated the soil carbon fractions and soil physicochemical and biochemical properties for different vegetation restoration measures located in a subtropical mountainous area of China. An adjacent undisturbed climax natural forest community was selected in this study as a reference community. The aims of this study were to (1) quantify the changes in the SOC fraction pools and soil properties among the five vegetation types; (2) identify the main soil physicochemical or biochemical factors that influence the distributions of soil carbon fractions; and (3) determine the sensitive indicators of carbon to different vegetation restoration.

2. Materials and Methods

2.1. Study Area

The study area is located at the Samachang ecological observation station (25°24′09″N; 101°28′18″E) in Muding County mid-Yunnan, about 200 km away from Kunming City in the Yunnan Province of China (Figure 1). The area has a subtropical monsoon climate with an average annual rainfall of 846 mm and a mean annual temperature of 16 °C. The soil in this area is a Cambisol. Most of original natural vegetation was cleared for fuelwood and pastures before the 1960s. Since the 1980s, different vegetation types, mainly including shrub-grass land (SG), coniferous Pinus forest (PF), coniferous and broad-leaved mixed forest (MF), and natural secondary forest (NSF), have been used to recover degraded land. Meanwhile, the undisturbed and mature natural forest (NF) in the Huafoshan Nature Reserve about 6 km apart from the study area was selected as the reference area. The study area and reference area belonged to the same climatic and soil zones. Detailed information about the restoration history and community characteristics of these four ecological measures is provided by Fu et al. [24,25] (different plant community abbreviations) and in Appendix A (Table A1).

2.2. Soil Sampling

In 2019, 15 comparative study plots were established in three representative sites with SG, PF, MF, and NSF to assess soil C distribution. At least 3 km distance between sites was selected to reduce spatial autocorrelation. Four representative 20 × 20 m plot for every vegetation restoration type were established within each site. In addition, three representative plots of NF in the nearby Huafoshan Nature Reserve were selected as references (Figure 1). Eight to ten soil cores from four soil depth levels (e.g., 0–10, 10–30, 30–60, and 60–90 cm) were obtained at random in each plot. These samples were sieved (2-mm mesh) and air-dried to analyze soil properties and soil C fractions. Additionally, soil bulk density (BD) and soil water content (SWC) were measured gravimetrically with an additional three undisturbed soil samples.

2.3. Laboratory Analysis

We measured the soil pH using a soil to water mixture (1:2.5, w:v) with a pH meter and soil clay contents by the Bouyoucos hydrometer method. Soil total nitrogen (TN) was determined using the semimicro Kjeldahl method, and total phosphorus (TP) was examined by phosphomolybdate blue methods [26]. The soil free Fe (Fed), poorly crystalline Fe (Feo), and organically complexed Fe (Fep) were extracted using dithionite-citrate-bicarbonate (DCB), ammonium oxalate, and sodium pyrophosphate at pH 10, respectively. The extracted Fe was measured by using atomic absorption spectroscopy [26].
The SOC concentrations were determined with a TOC analyzer. The DOC was extracted with a 1:5 ratio of soil to 0.5 M K2SO4 solution and shaken [27]. The solution was determined with a TOC analyzer after filtration (0.45 μm membrane). The LFOC (<1.7 g cm−3) and HFOC (>1.7 g cm−3) fractions were determined according to the density fractionation method described by Gregorich and Ellert [26]. The POXC fraction was determined by adding 0.333 M KMnO4 for oxidation. The suspension was then centrifuged, diluted, and measured spectrophotometrically at 565 nm [28]. The POC fraction was separated using the wet sieving approach. In brief, 20 g air-dried soil with 5 g L−1 (NaPO3)6 was dispersed for 20 h. The soil suspension was passed through a 53-μm sieve. The fraction retained on the sieve was oven-dried and analyzed with a TOC analyzer.
The soil biochemical properties, including GRSP and EPS, were also determined. The GRSP fractionation was determined using the method described by Singh et al. [29]. Briefly, easily extractable GRSP (EE-GRSP) was extracted from 1.0 g of soil incubated with 8 mL of 20 mM citrate (pH 7.0) by 30 min autoclaving. The T-GRSP was obtained from 1.0 g of soil with 8 mL of 50 mM citric acid (pH 8.0) by six successive autoclaving cycles. The GRSP contents in the extracts were assayed using a Bradford assay [29]. The difficultly extractable GRSP (DE-GRSP) was the difference between T-GRSP and EE-GRSP. The EPS levels were determined on the supernatant by the anthrone method [30].

2.4. Calculations of Soil Carbon Indices

The SOC stock was calculated as follows [6]:
SOC   stock   ( kg   m 2 ) = i = 1 n B D i × S O C i × D i
where BDi is bulk density (g cm−3) at soil layer i, SOCi is the soil organic carbon content (g kg−1) at soil layer i, and Di is the soil depth (cm).
The sensitivity index (SI) was defined as the reductions in soil carbon fractions after different vegetation restorations and was calculated as follows [31]:
SI = (carbon variables of restoration vegetation − carbon variables of reference natural forest)/carbon fractions of reference natural forest
The carbon management index (CMI), carbon pool index (CPI), and soil carbon sequestration capacity (SCS), which are the systematic, sensitive indicators used to assess SOC changes, were also calculated as follows [31,32,33]:
CPI = SOC of restoration vegetation/SOC of natural forest
CMI = CPI × LI × 100
SCS = CPI/C lability
where LI (lability index) = C lability of restoration vegetation/C lability of natural forest, C lability = POXC/Non-POXC, and non-POXC = TOC-POXC. Meanwhile, the SIs of these three carbon indices were also calculated using Equation (2).

2.5. Statistical Analyses

Normality and homogeneity tests were applied to all variables. Two-way ANOVA was used to compare the effects of vegetation restoration type and soil depth on the concentrations of the basic soil properties and soil carbon variables. The significances of the differences in the tested parameters among the vegetation restoration types were compared using LSD (Least Significant Difference) at the 0.05 level.
Pearson correlations and redundancy analysis (RDA) were applied to elucidate the relationships among the soil carbon variables and soil characteristics among all soil samples from different vegetation restoration types. To summarize the total variance of the data, we performed a principal component analysis (PCA) that included all soil carbon fractions and carbon indices for the combined vegetation types and soil depths. The above analyses were conducted using SPSS 20 (SPSS, Chicago, USA) and CANOCO 5.0.

3. Results

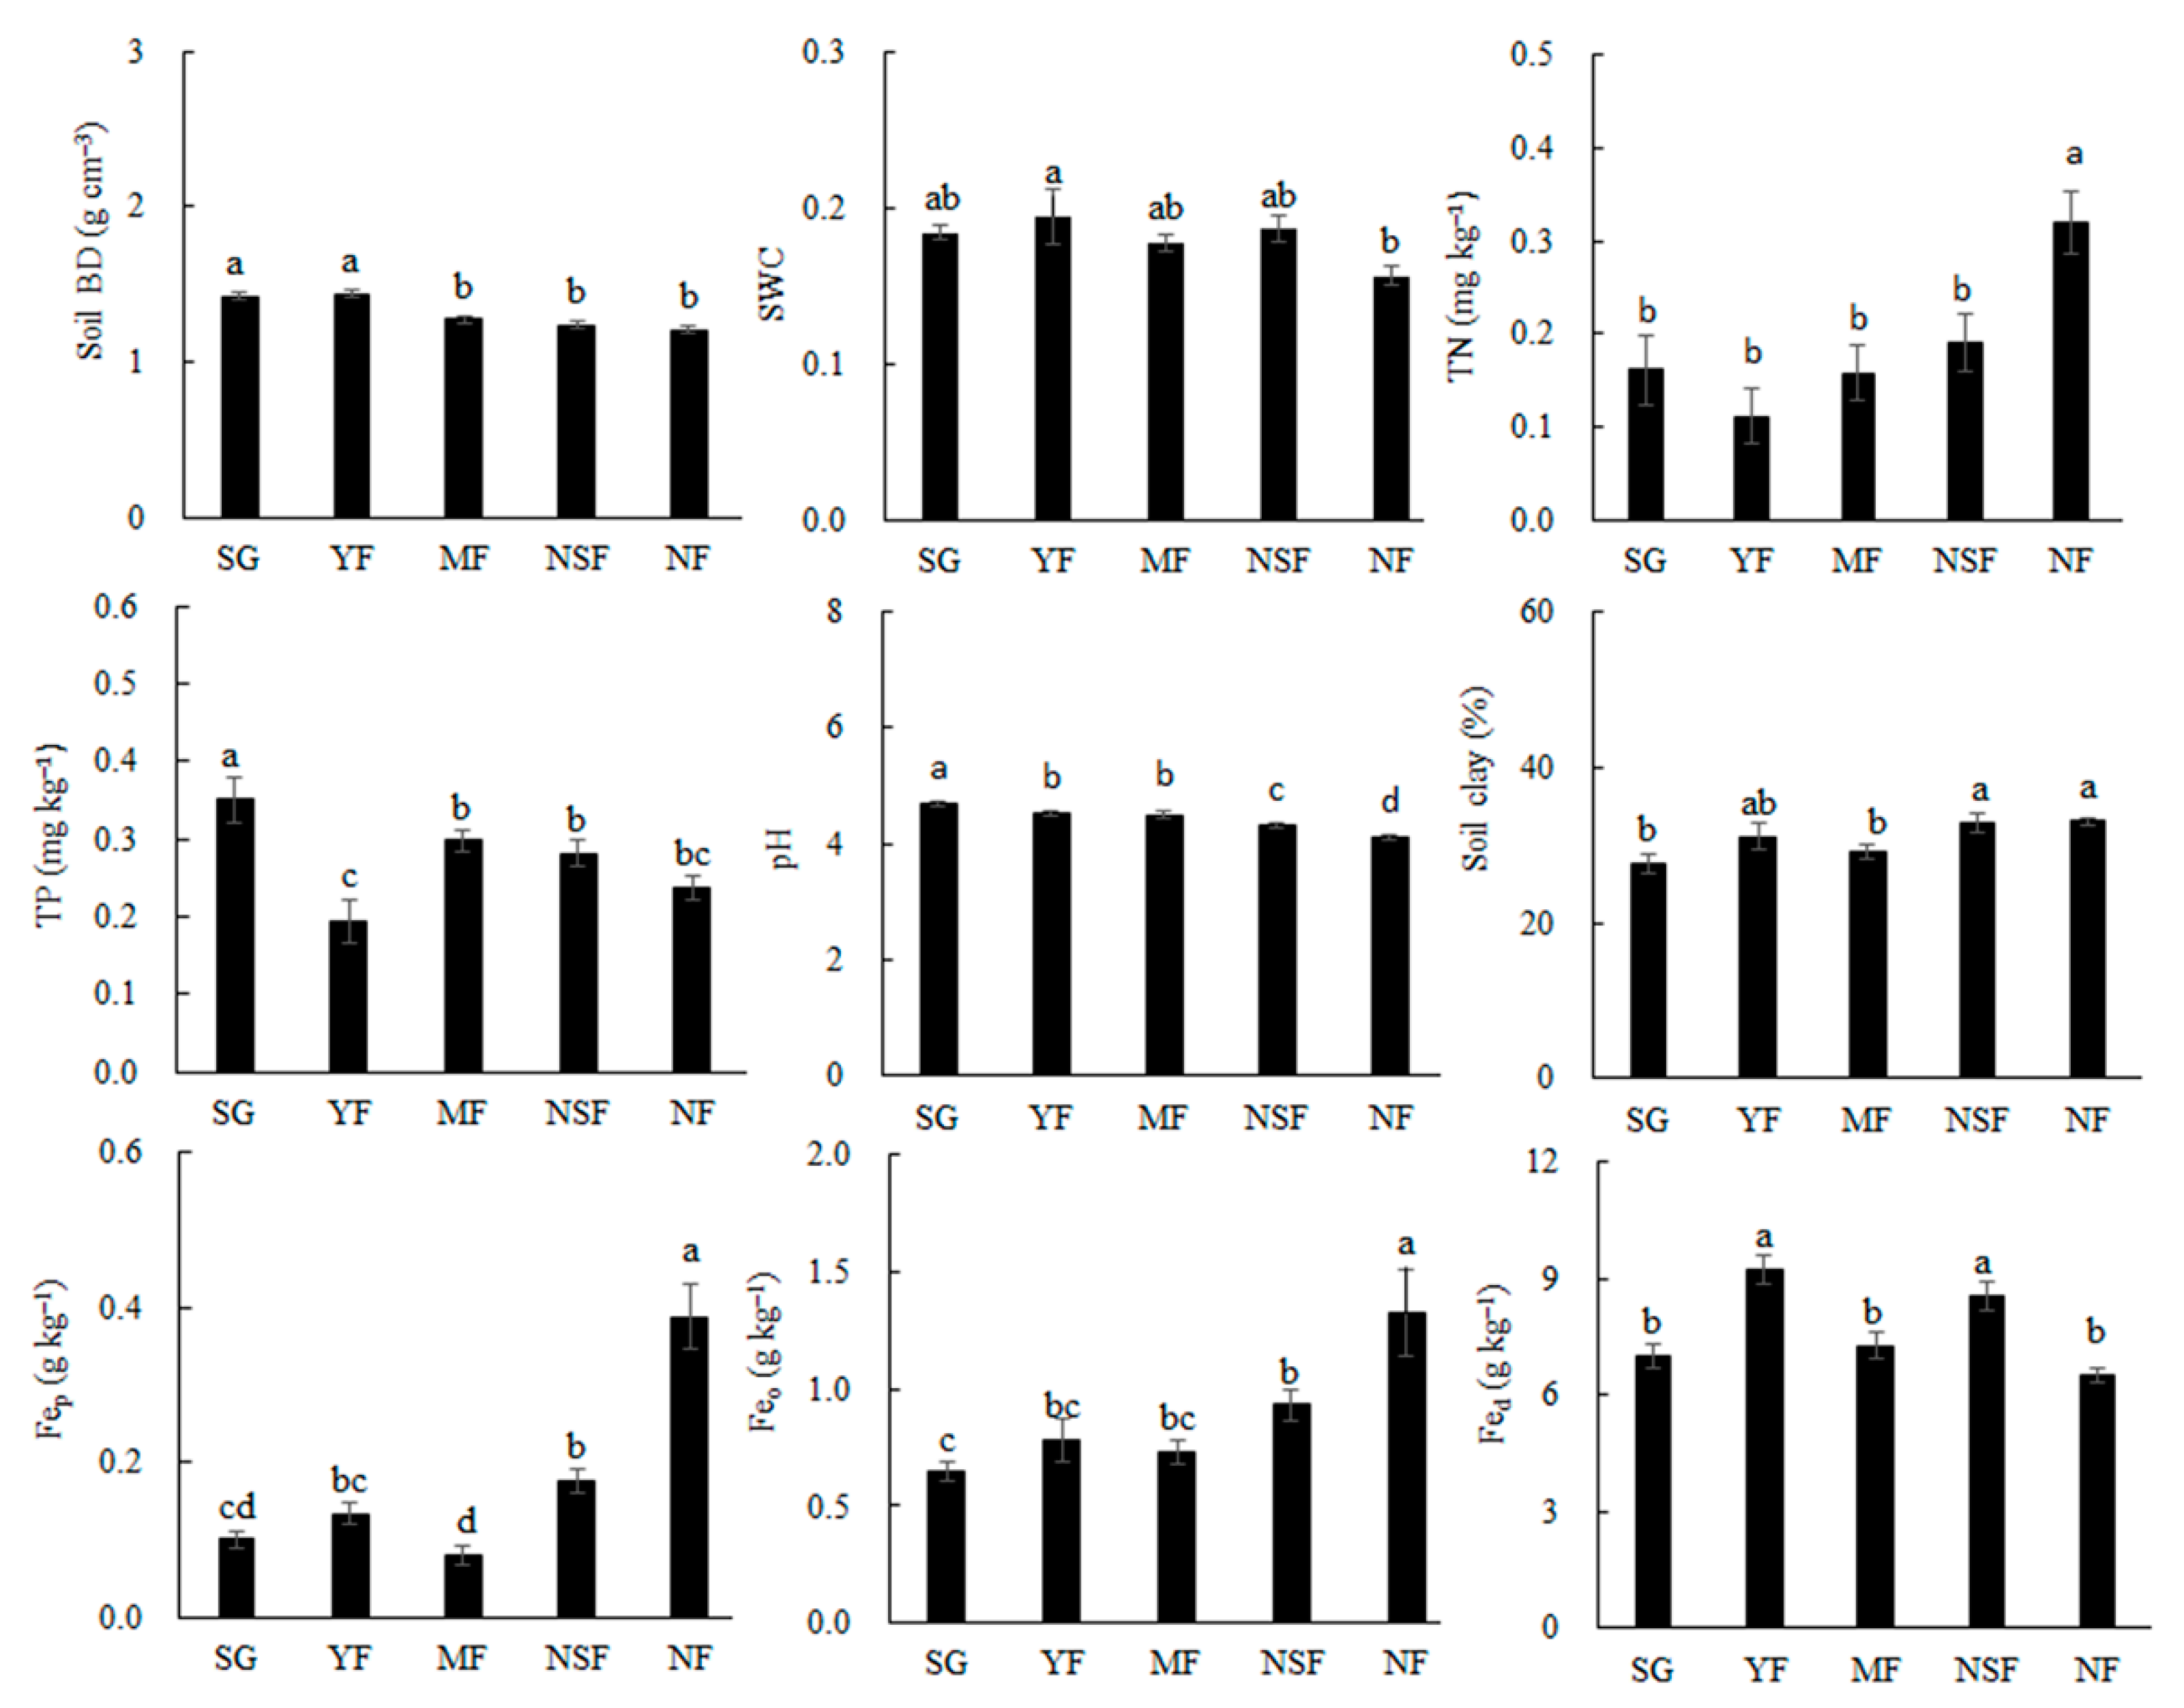
3.1. Basic Soil Characteristics

Two-way ANOVA showed that the vegetation restoration type had a strong effect on all basic soil properties except for the SWC, and soil depth had a significant effect only on the BD and Fep (p < 0.05, Table A2). Throughout the soil profile (0–90 cm), the soil BD and pH values decreased, and the concentrations of soil TN, Fep, Feo, and soil clay contents increased with the vegetation complexity (Figure 2). The highest values of BD, TP, and pH were found in soils under SG. The TN, Fep, and Feo concentrations were obviously higher in soils under NF than those under the other four vegetation restoration types (Figure 2 and Table A2).
Vegetation types and soil depths had significant effects on the distributions of soil GRSP and EPS (p < 0.05), except vegetation types had no effect on EPS (p > 0.05) (Table A2). The concentrations of EE-GRSP and EPS in the 0–10 cm soil layer increased with the vegetation complexity (Figure 3).

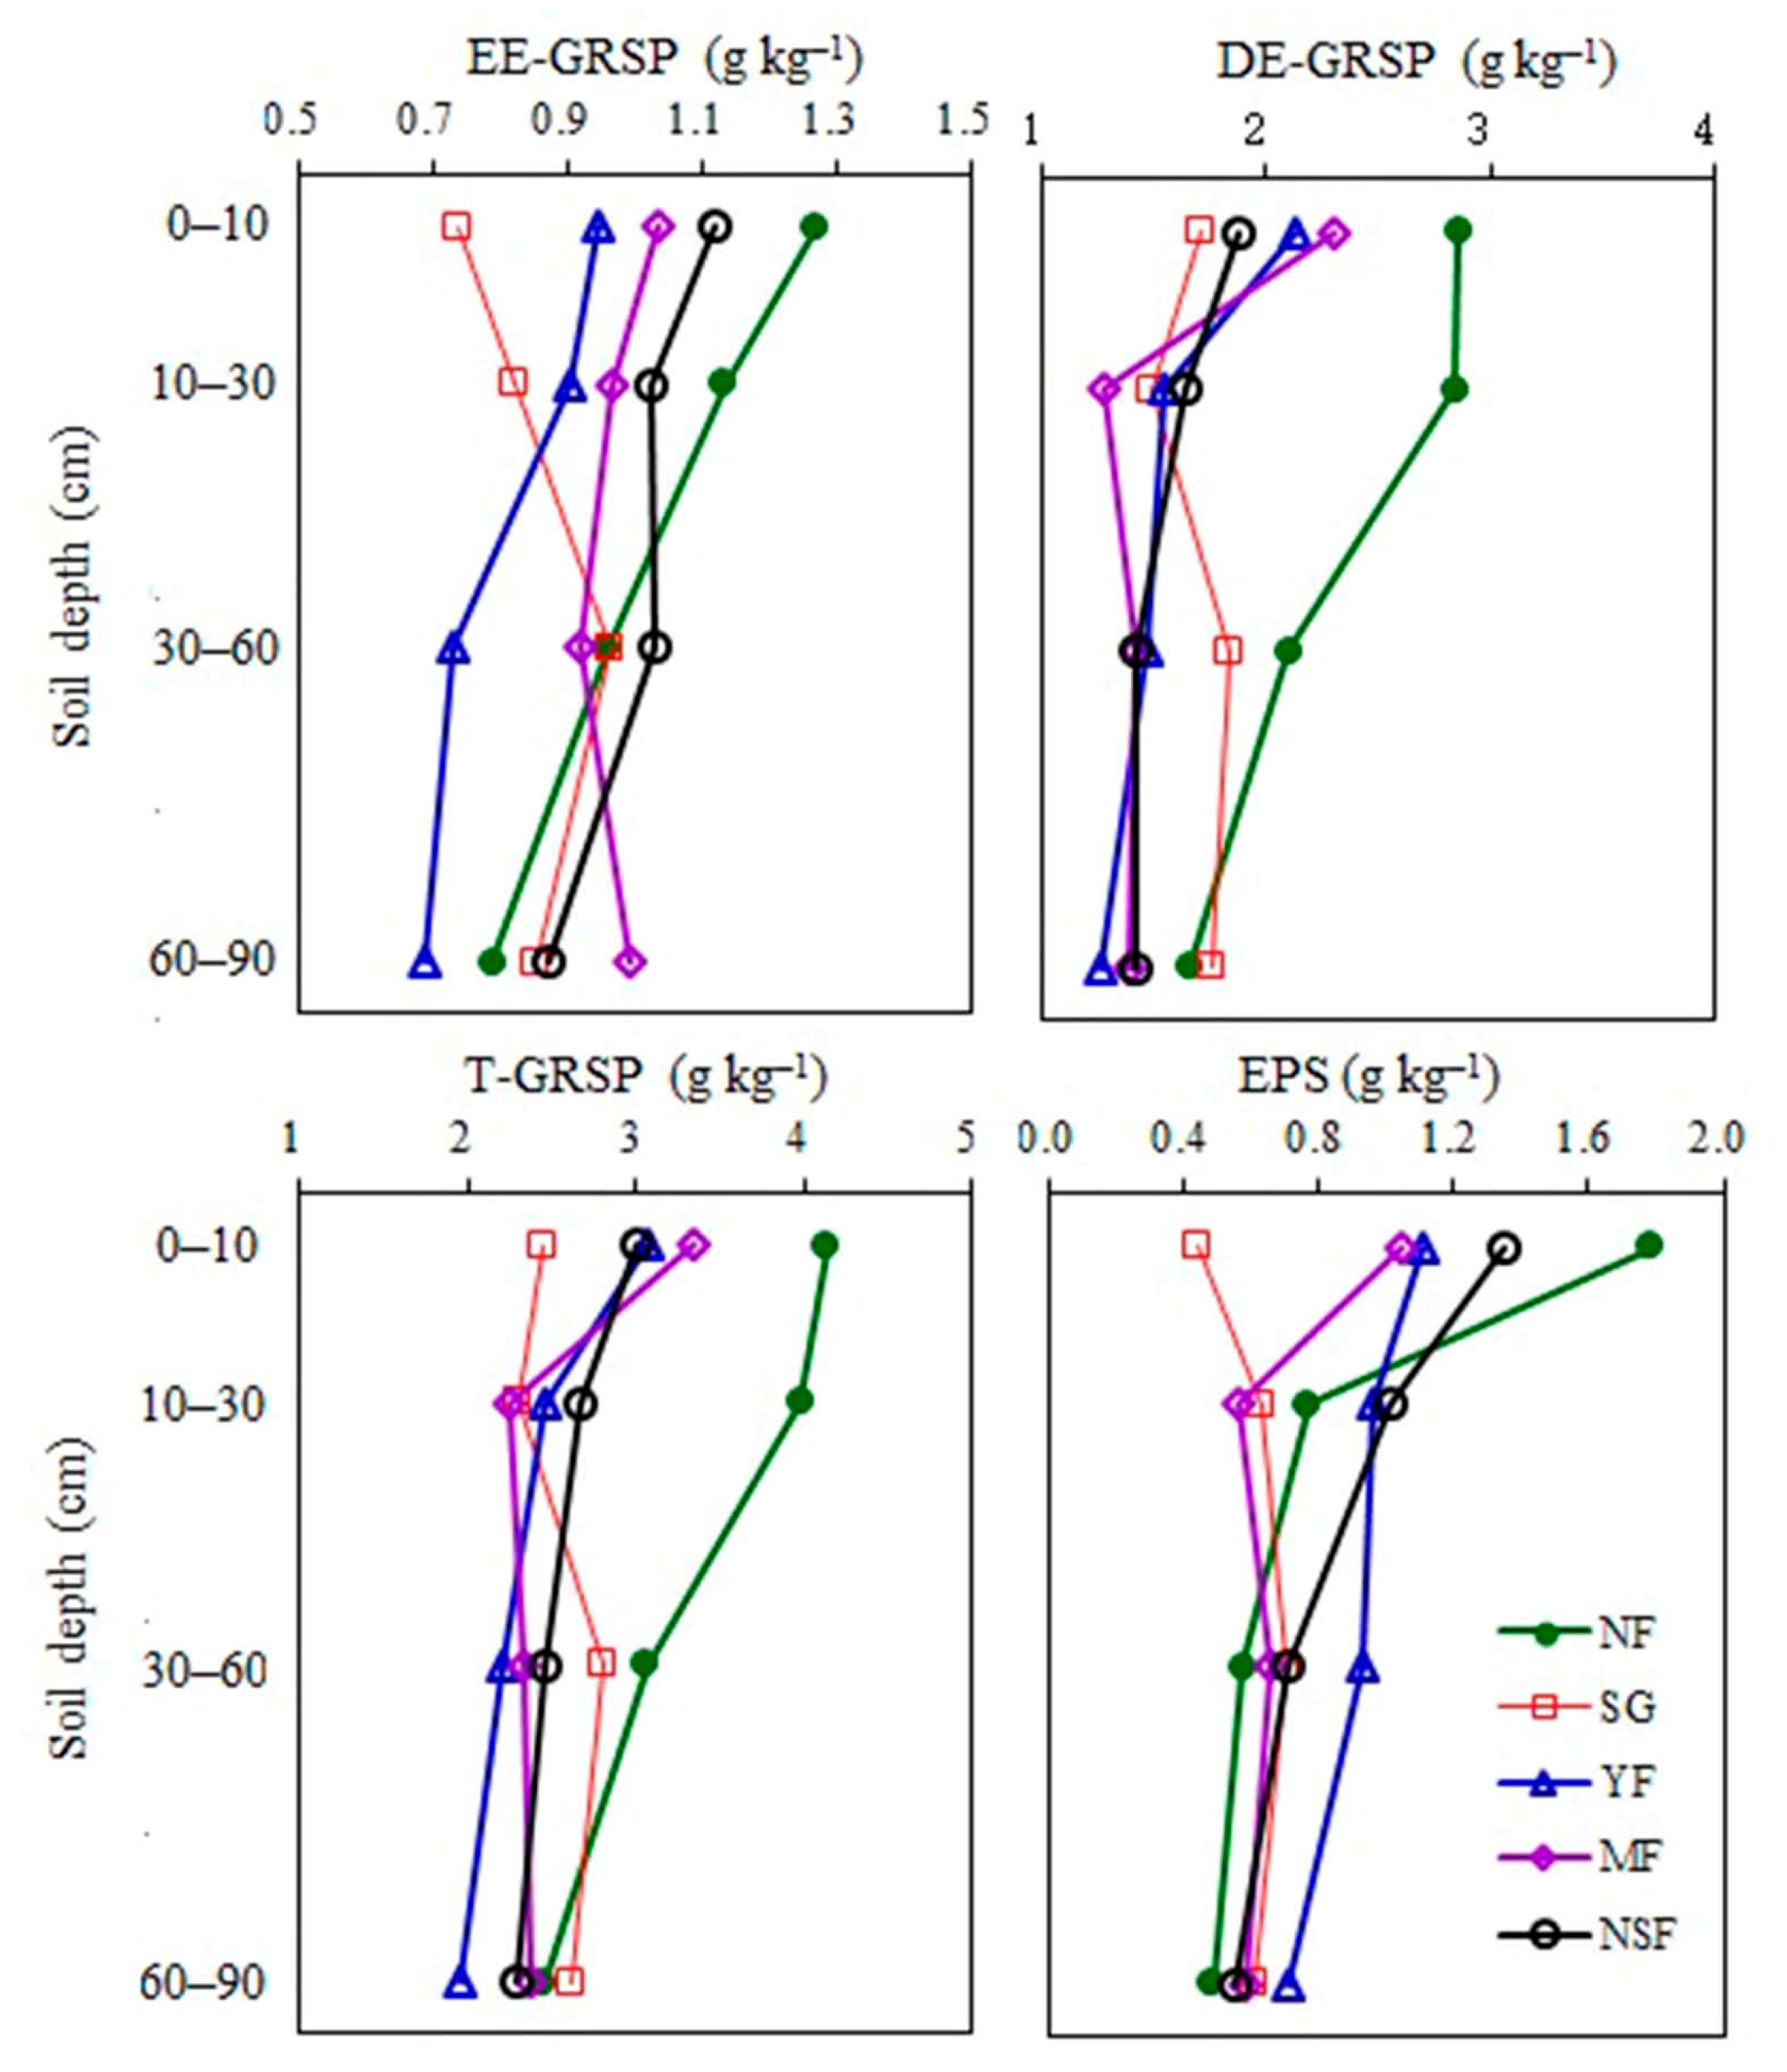
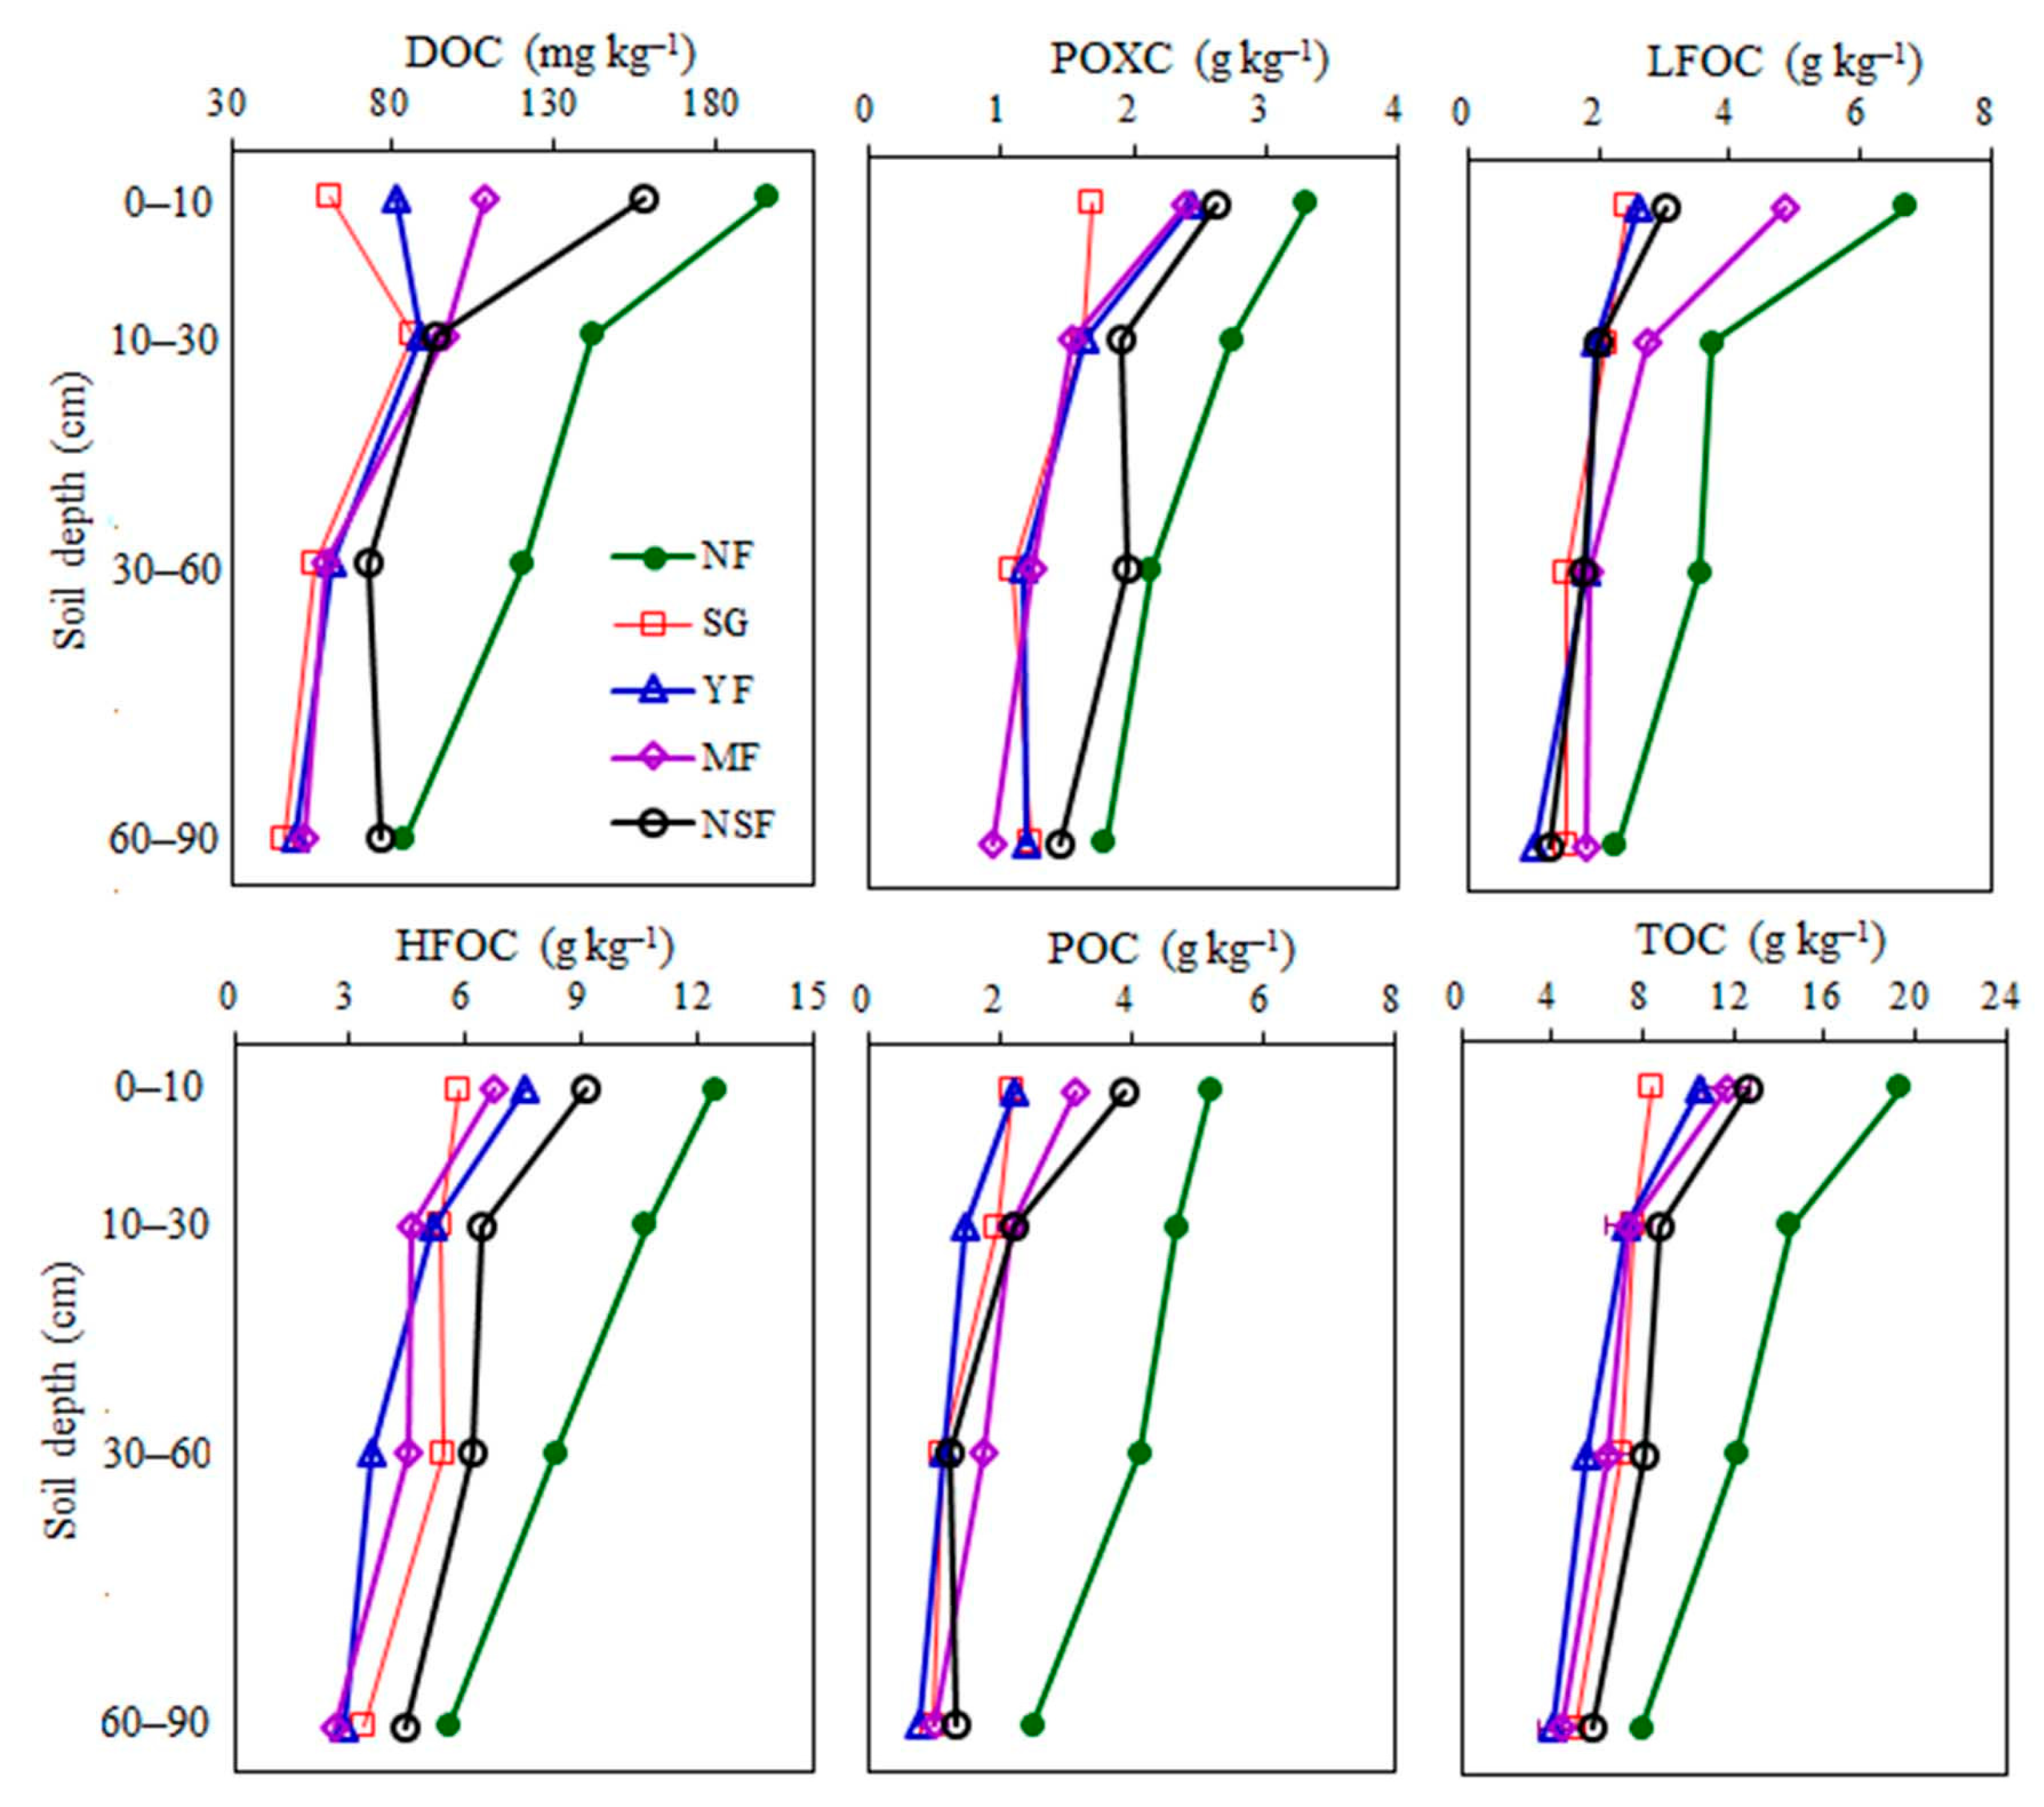
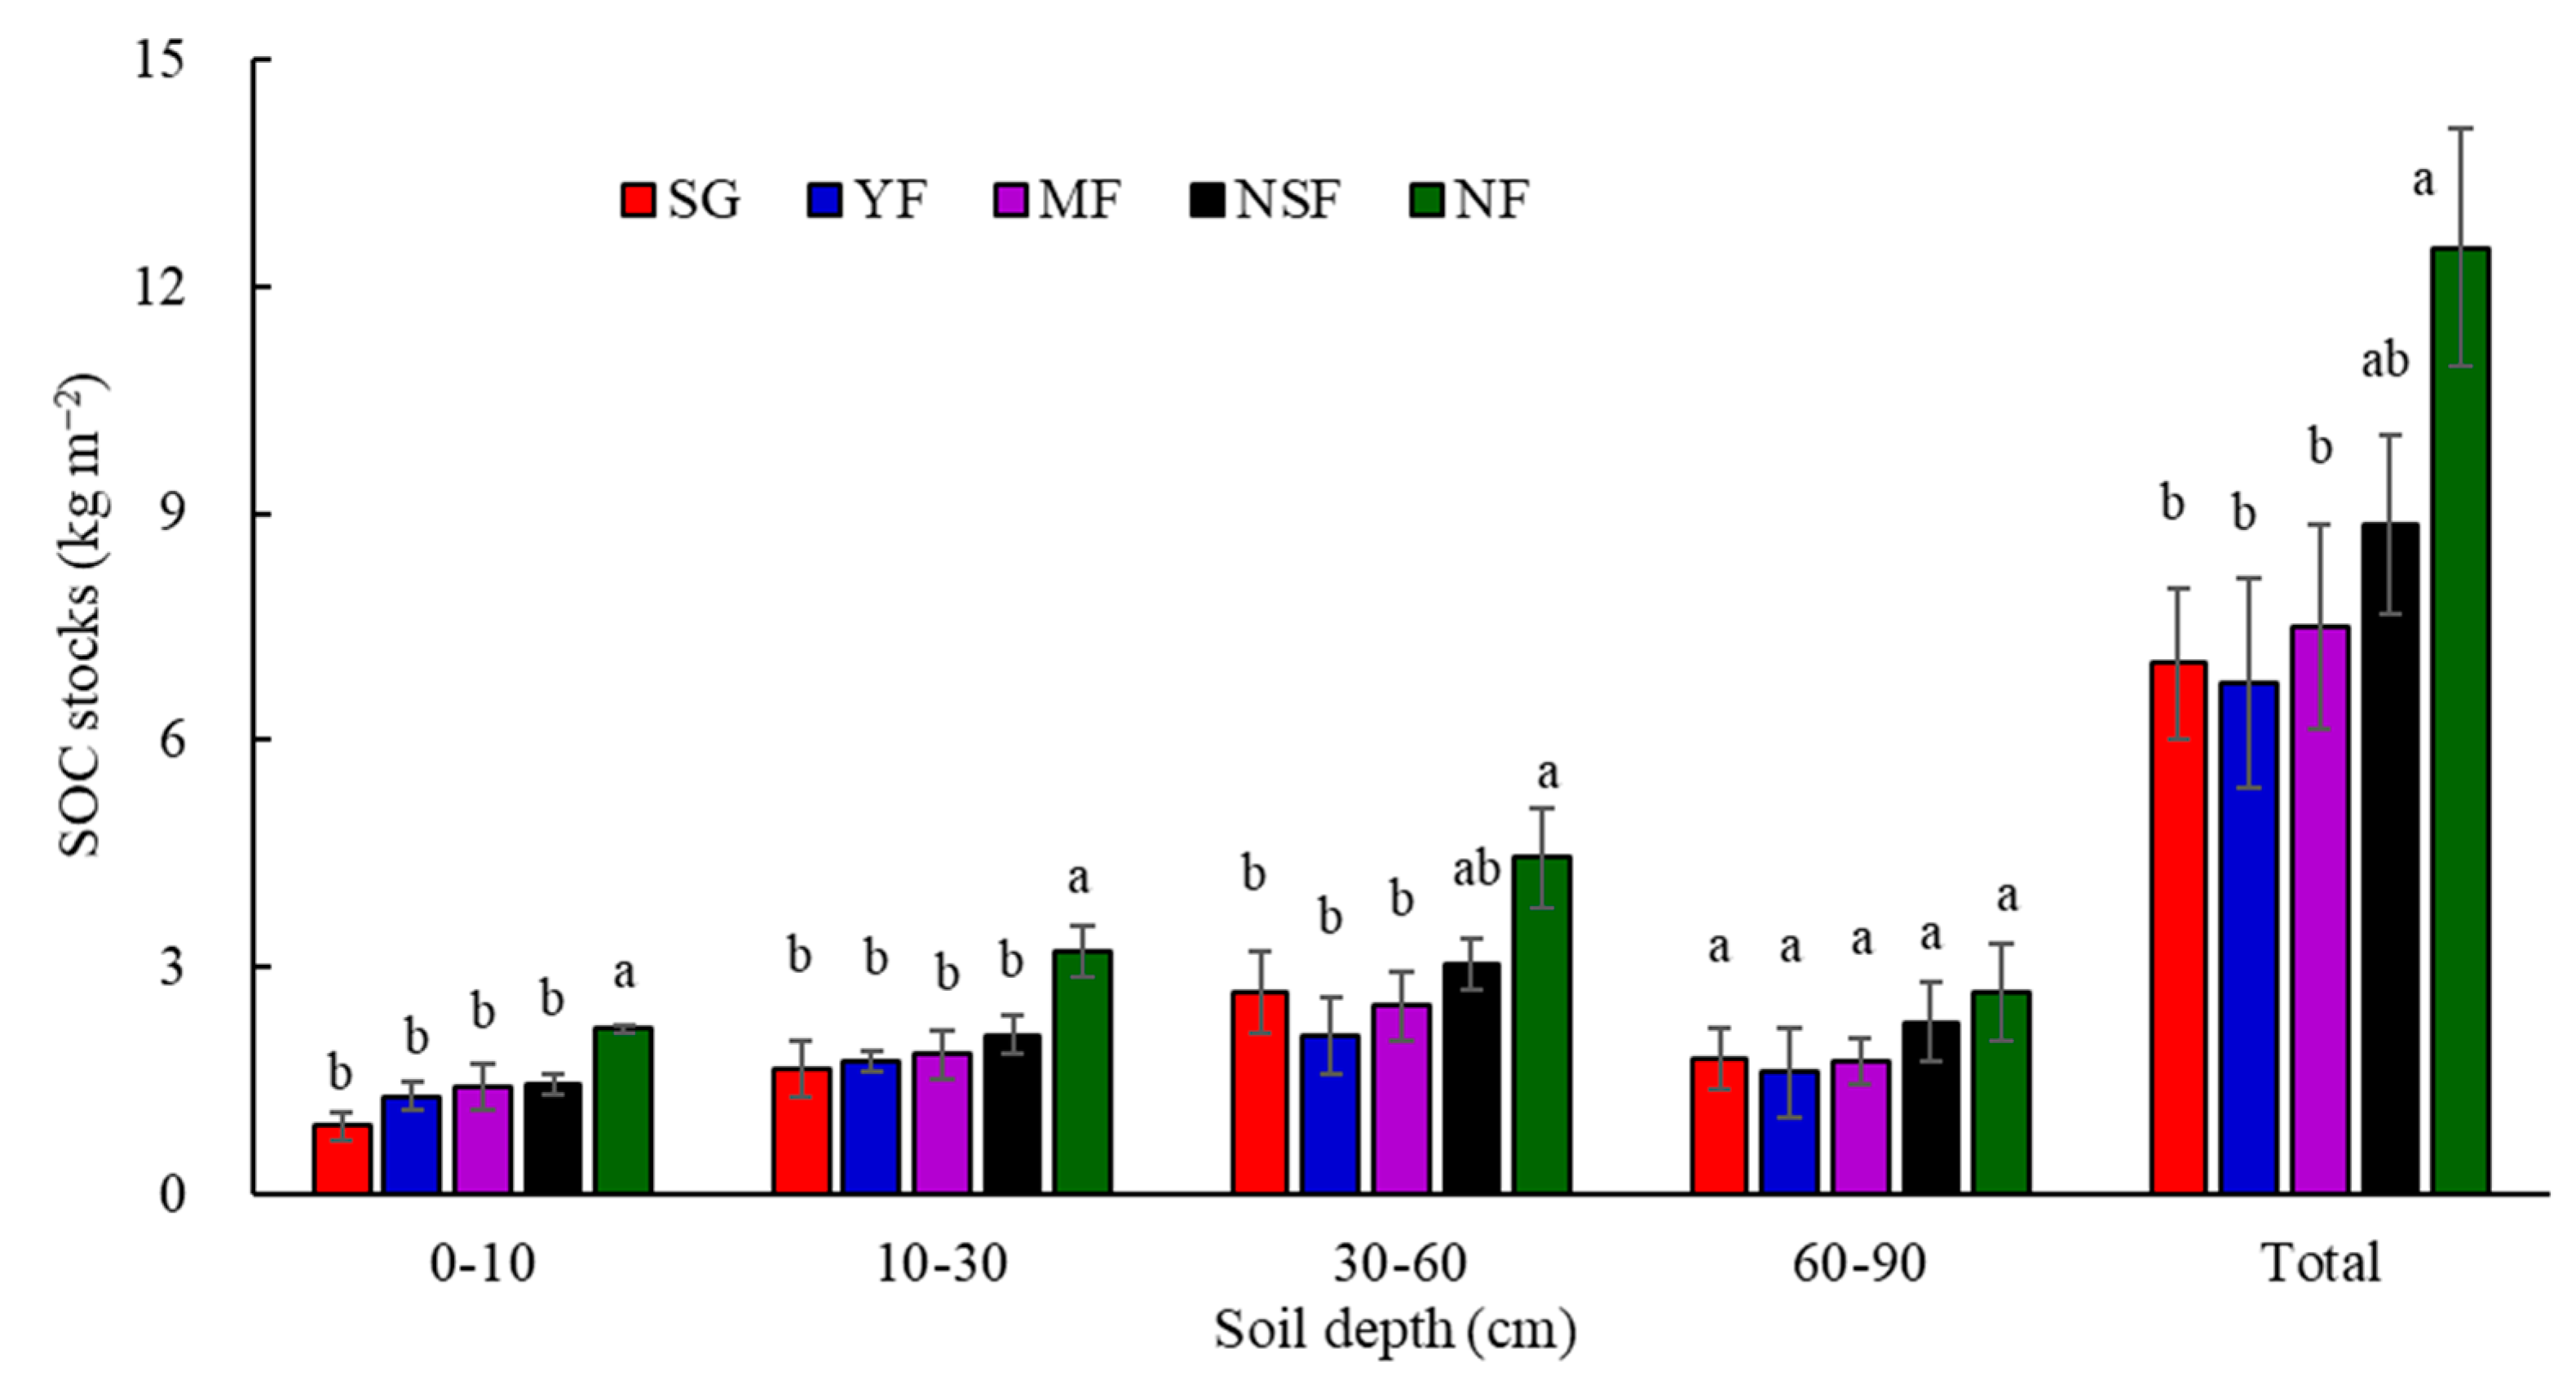
3.2. Distributions of Soil Carbon Variables

The concentrations of TOC and those of all five carbon fractions were strongly affected by the community types and soil depths (Table 1). The TOC, POXC, LFOC, HFOC, and POC concentrations in the surface layer (0–10 cm) were higher than those in the other three soil layers and generally increased with the vegetation complexity (Figure 4). The DOC concentrations in the surface layer exhibited more significant difference than those in the other soil layers and those of the other carbon indices among the five vegetation types (Figure 4). The CPI and CMI values in the surface layer (0–10 cm) were lower than other vegetation types. The CPI and SCS values exhibited increasing trends with soil depth (Figure 4, Table A3).
The SOC stocks and carbon fractions in different soil layers or throughout the soil profile under NF were higher than those under the other vegetation restoration types (Figure 5 and Table A3). The SOC stocks did not display significant differences among SG, YF, MF, and NSF, although the SOC stocks exhibited an increasing trend with vegetation complexity (Figure 5).

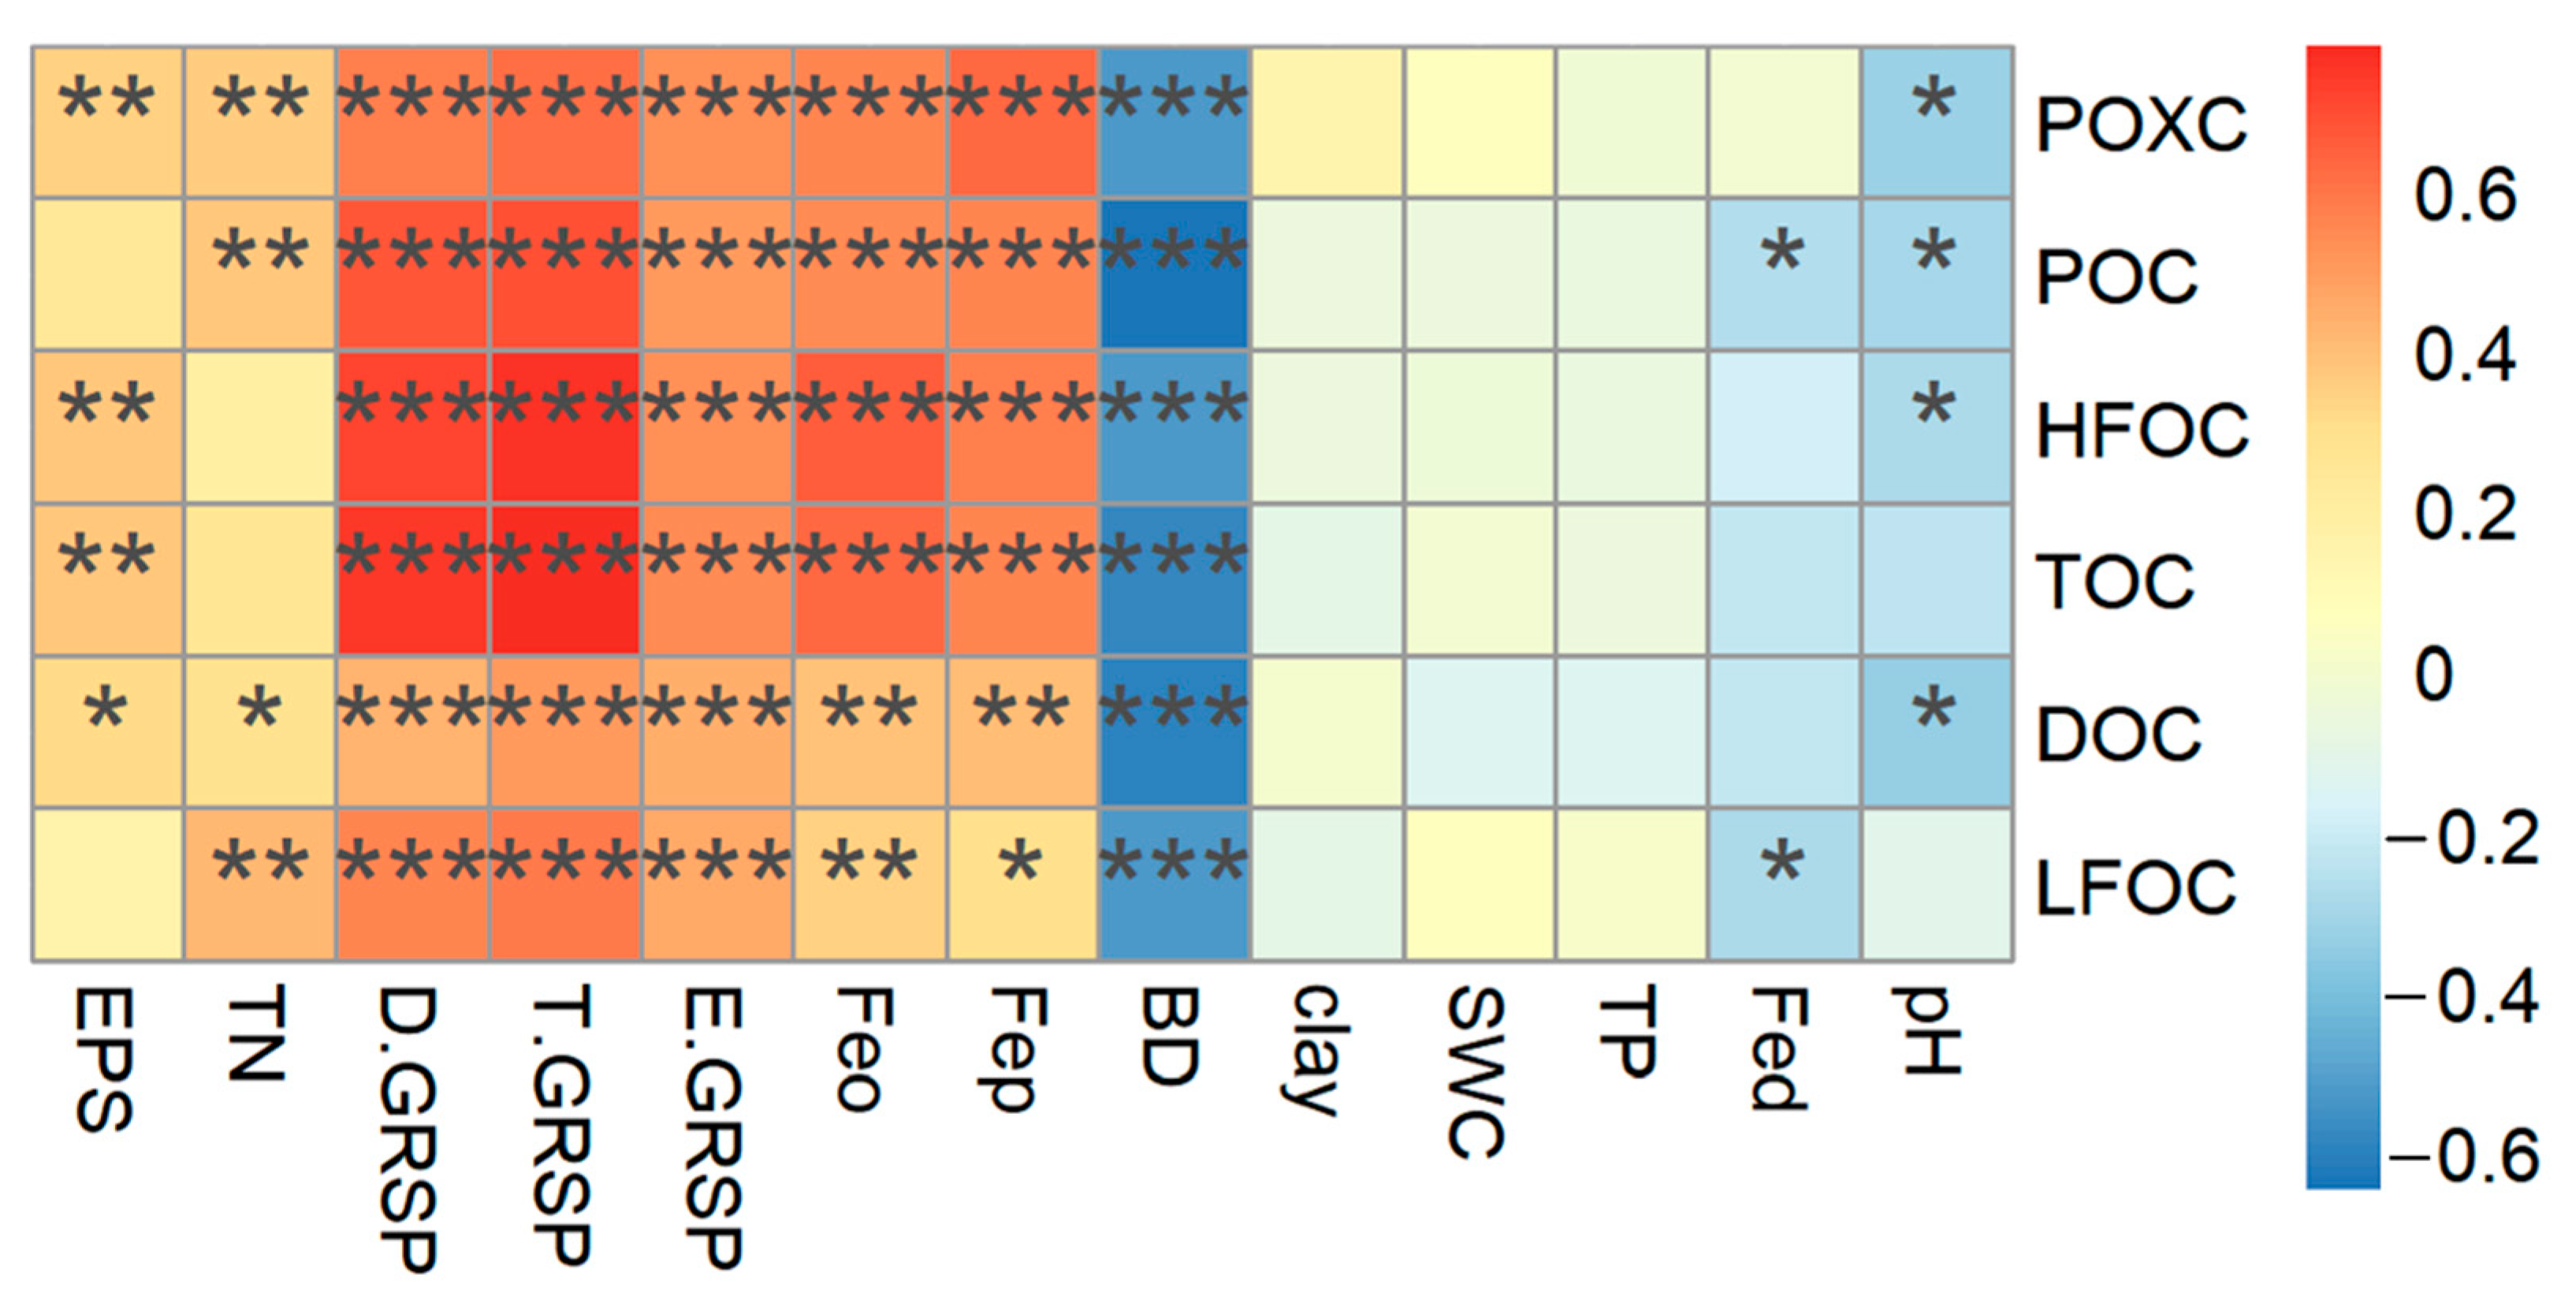
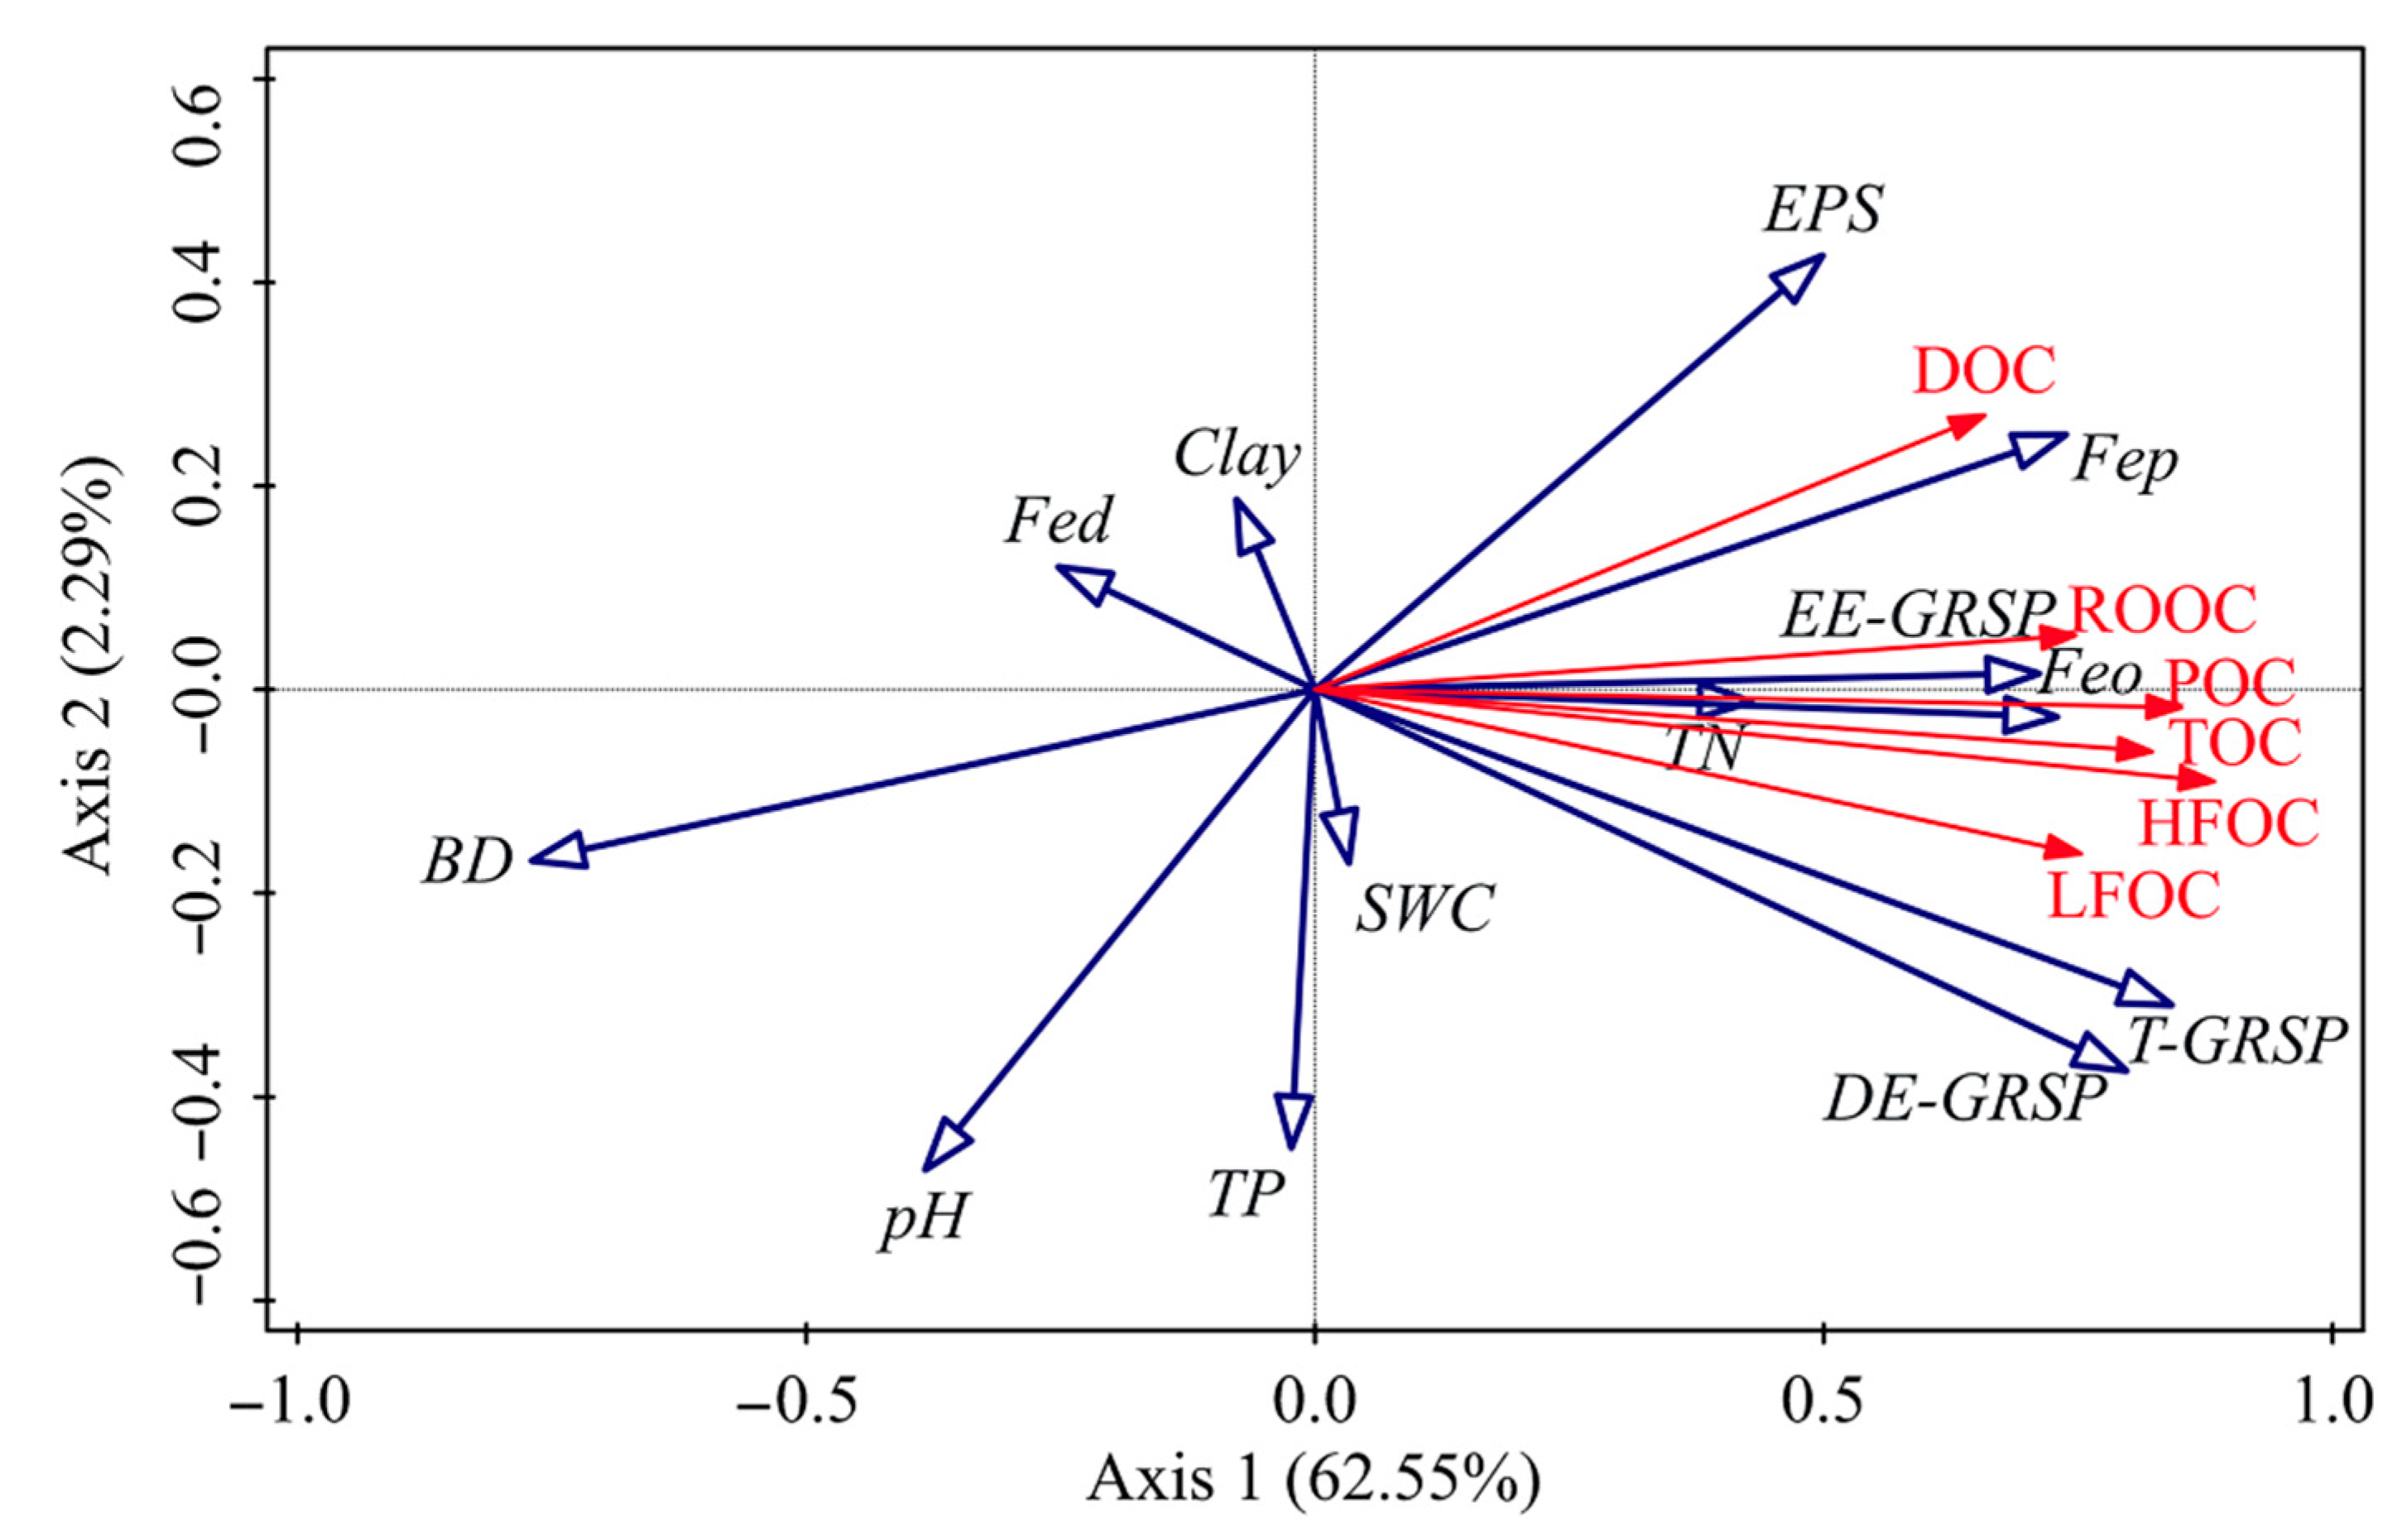
3.3. Multivariate Analysis between SOCs and Soil Properties

The Pearson correlations showed that the soil TOCs and all five carbon fractions were significantly negatively correlated with the BD and pH, and positively related to EE-GRSP, DE-GRSP, T-GRSP, EPS, TN, Fep, and Feo (Figure 6). The RDA results showed that the first axis explained 62.55% of the variances in the carbon fractions. The soil GRSP, Fe oxides, and BD were the most driving factors that were significantly related to the soil TOCs and carbon fractions (Figure 7).

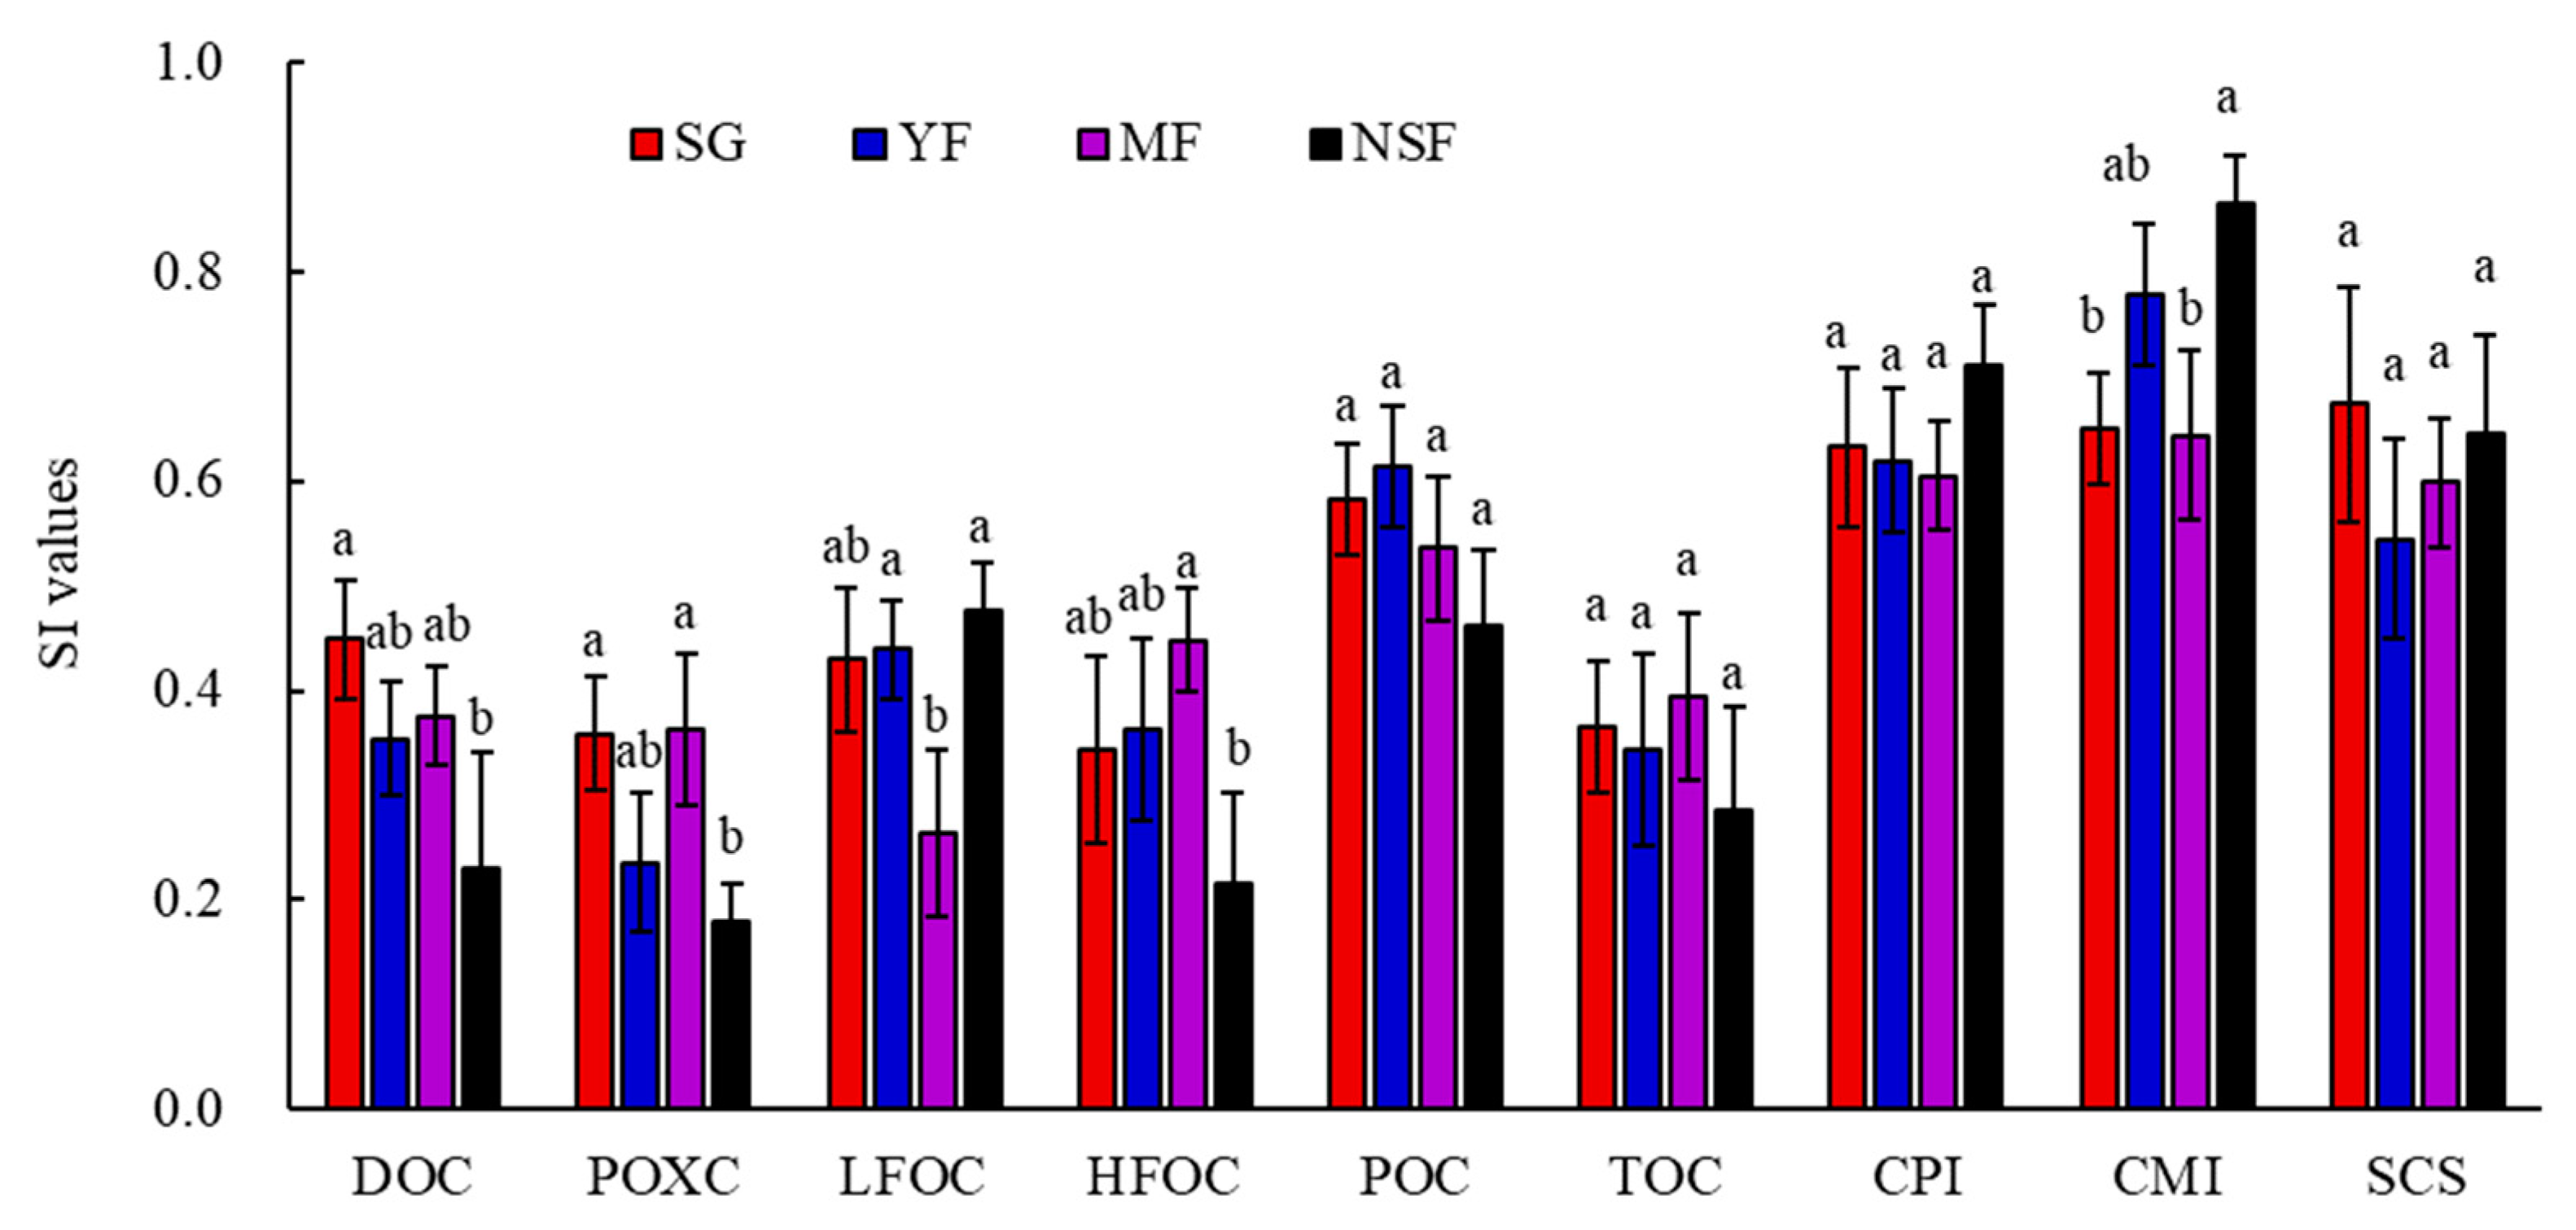
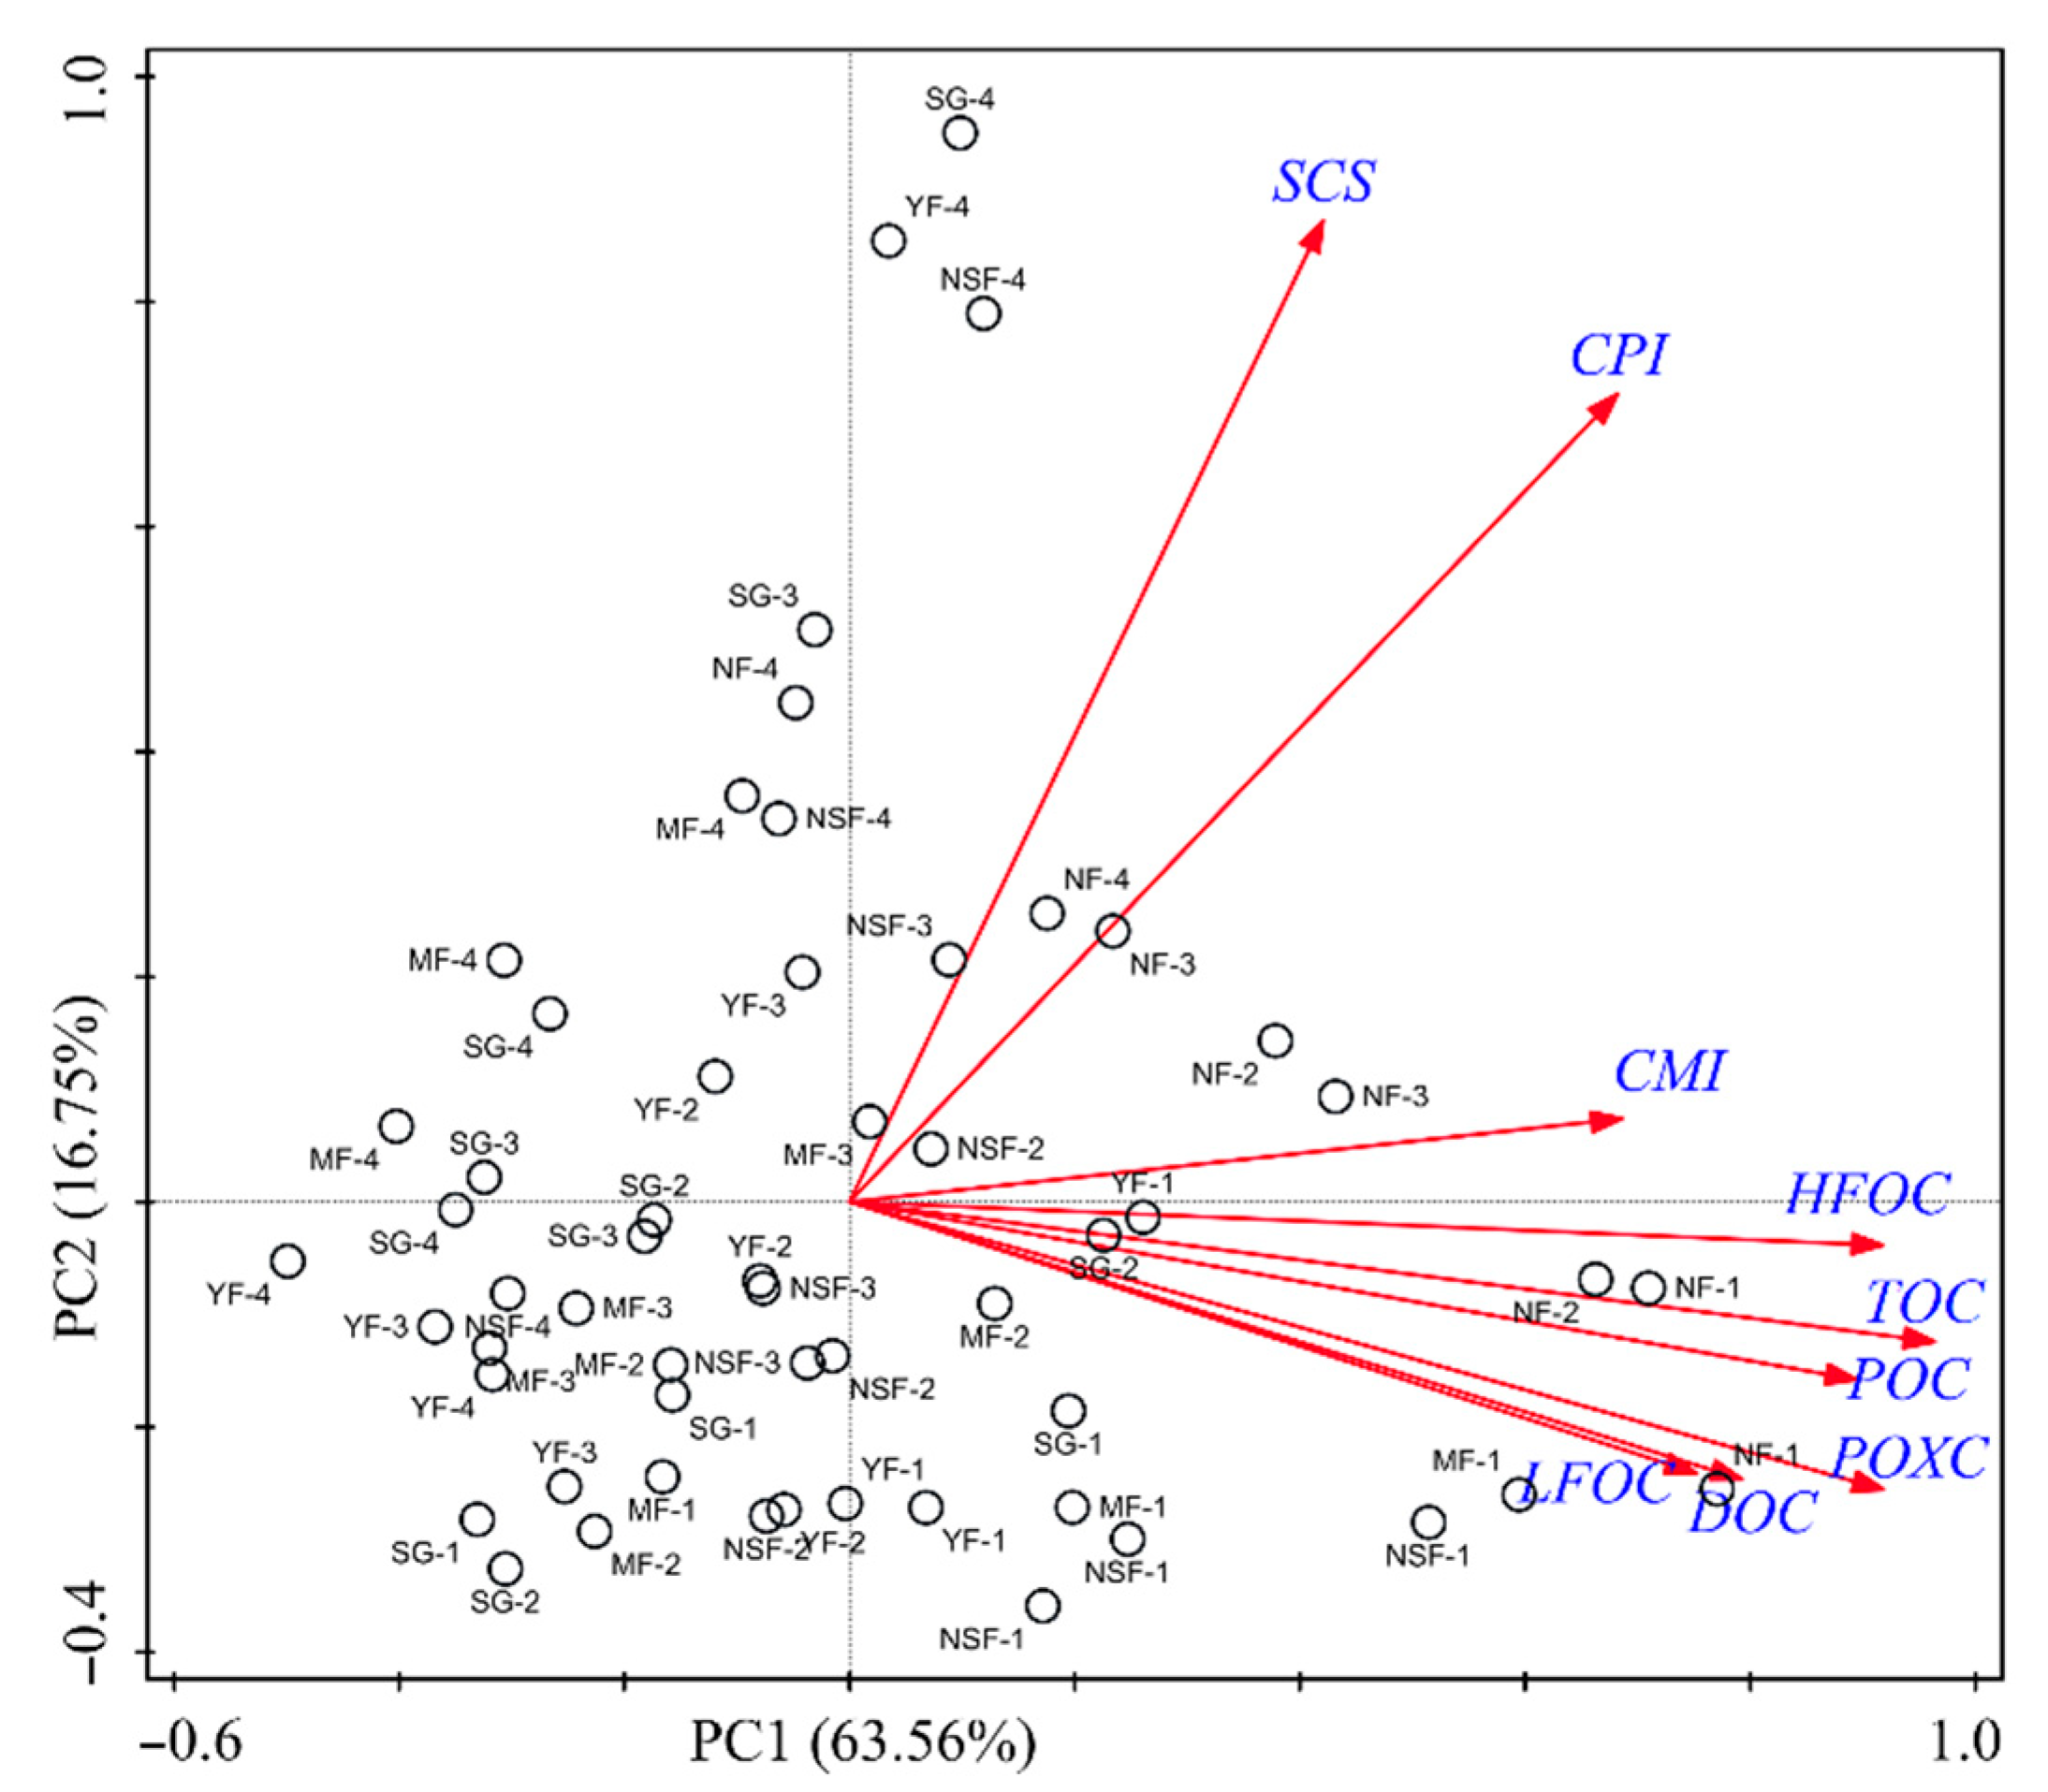
3.4. Sensitivity of Soil Carbon Variables to Vegetation Restoration Types

The two-way ANOVA results showed that the community type had a significant effect on the SI values for the soil carbon fractions and CPI, CMI, SCS. Soil depth had a significant effect only on the SI value for soil POC (Table 1). The CMI and CPI values under NSF were highest in all the five vegetation types. The average SI values for the soil carbon indices along the soil profile (0–90 cm) indicated that the SI values for CMI were highest and were followed by the CPI, SCS, and POC, while the DOC, POXC, LFOC, HFOC, and TOC were less sensitive to changes in community types (Figure 8).
The principal component analysis (PCA) demonstrated that the first two component explained 63.56% (PC1) and 16.75% (PC2) of the total variance, respectively (Figure 9). All of the carbon fractions and carbon indices positively contributed to PC1. However, POXC, POC, and HFOC contributed more than the other carbon fractions and carbon indices. The SCS and CPI presented positive and significant associations with PC2.

4. Discussion

4.1. Effects of Different Vegetation Types on the Soil Organic Carbon Variables

Our results showed that different vegetation restoration types affected the soil carbon contents and exhibited an increasing pattern with increased vegetation complexity, which was corroborated by previous studies [13]. Generally, the SOC stocks are determined by the balance between plant litter/root inputs and outputs or decomposition. First, the inputs of litter and roots in the relatively complex communities (e.g., MF, NSF, and NF) were higher than those in the SG and YF communities [24,34], so less organic matter was returned to the soil in the SG and YF communities. Second, as the early stages of community succession, the rapid growth of plants in SG and YF communities greatly consumed soil nutrients by roots. In contrast, the higher accumulated biomass levels in the relatively complex communities increased the organic matter levels through litter and roots. Meanwhile, with the improvements in soil structure and functions, the losses of soil carbon and nutrients due to soil erosion and runoff were reduced [24]. Our study also revealed that the concentrations of TOC and most carbon fractions decreased along the soil profile. This possibly occurred because the TOC and its fractions were mainly affected by root residues and secretion at deeper depths and less by litter, which led to carbon decrease along the soil profile for all the different vegetation restoration types [35,36].
Significant positive correlations were found between the TOC and soil carbon fractions (p < 0.001), which suggested that the conversion from SOC to carbon sequestration in the forms of labile and non-labile carbon fractions can increase synchronously with the vegetation complexity. DOC is a key component of soil carbon cycling and plays a vital role in soil processes and functions [11]. The DOC contents in the surface layer exhibited more significant differences, which indicated that DOC was more sensitive to vegetation change than the other carbon fractions and soil depths. The POXC and LFOC fractions have been used as measures of labile carbon under different land cover or vegetation types [28,37]. For example, significant correlations have been reported in many studies. de Moraes Sá et al. [13] and Sheng et al. [32] found a positive relationship between SOC and POXC and LFOC during ecological succession.

4.2. Influencing Factors of Soil Carbon Distributions

The present study showed that the GRSP fractions were the most influencing factors that were significantly correlated with soil TOC and carbon fractions (Figure 6) and validated the contribution of biochemical properties to increase the carbon pools composed of TOC and carbon fractions. The significant correlation between SOC and GRSP has been reported in several previous studies [17,19,20,38]. By relating the GRSP contents to the SOC contents, the proportions of T-GRSP/SOM were 41%, 40%, 39%, 32%, and 28% for SG, YF, MF, NSF, and NF soils, respectively, which indicate that GRSP contributes highly to the SOC in soils. In addition, high GRSP contents can be found in relatively simple plant communities that are susceptible to changes in abiotic stress. Higher glomalin levels under environmental stresses are produced by arbuscular mycorrhizal fungi [39,40]. On the other hand, GRSP can protect SOC from decomposition by enhancing the formation of soil aggregates and partially sealing the soil pore system to slow down the penetration of water into the aggregates [19,41]. Overall, our results indicated that T-GRSP and its two fractions might be the reliable indicators under vegetation restoration. Similar to GRSP, EPS plays an important role in improving the production of soil aggregates and promoting soil carbon stability [21]. In our study, we found that soil GRSP contributes more to SOC than to EPS. Therefore, soil GRSP are generally considered to be a sensitive indicator of long-term C storage [19,20,42].
In line with previous works that were studied in other tropical and subtropical sites [19,43], our results also showed that Fe and BD have significant correlations with TOC and carbon fractions (Figure 6 and Figure 7). This result indicates an interdependency between SOC, GRSP, and some soil physicochemical properties. The significantly negative relationships between BD and SOC and GRSP indicated that SOC and GRSP increase with decreasing soil structure. In addition, compared to the soil Fed concentrations, significant correlations between the Fep and Feo concentrations and the carbon fractions were also found in our study, which implies that different vegetation restoration types may change the associations of SOC with Fe oxides and eventually influence the SOC contents. Iron oxides in soil play an important role in soil C stability because they are involved in the physical, chemical, and biological protection mechanisms of SOC [44,45,46]. Different forms of Fe oxides have different roles in the process of SOC stability by improving the formation of soil aggregates. Feo and Fep have extensive surface areas and strong binding capacities to stabilize SOC [47]. Compared to Fed, Feo and Fep contributed more to SOC stability because their effects on the formation of soil aggregates were significantly greater than that of Fed [10].

4.3. Indices for Assessing the Vegetation Restoration Effect on the Soil Carbon Pool

The PCA results indicate that all soil carbon fractions and carbon indices had the potential to be used as indicators to assess the vegetation restoration effects on the soil carbon pool (Figure 9). The PCA showed that the first PC mainly distinguished the different restoration vegetation types, and the second PC resulted in the differentiation among soil depths. Considering the SI values and correlations between principal components and carbon variables (Figure 8 and Figure 9), it can be inferred that POXC, POC, and HFOC were the most sensitive indices for differentiating vegetation types, whereas the SCS and CPI were more sensitive for differentiating the effects of soil depth. The POC is more sensitive to both rapid losses and gains in TOC as a result of management or land-use conversions, and the LFOC and HFOC, which are separated by using densitometry techniques, are also more sensitive to land cover changes and management practices [48,49]. The soil POXC is more sensitive to the presence of lignin or lignin-like compounds and therefore to the nature of the vegetation present [50], which may explain the highest sensitivity of POXC to vegetation type. Therefore, POXC is considered to be the most sensitive index for differentiating the effects of vegetation types in our region.

5. Conclusions

The present study demonstrated that the SOC stocks exhibited an increasing trend with vegetation complexity in this region. However, there were no significant differences among SG, YF, MF, and NSF. Meanwhile, the TOC, POXC, LFOC, HFOC, and POC contents in the surface layer were higher than those in the other three deeper soil layers. These results suggested that the concentrations of TOC and all five carbon fractions were strongly affected by the community types and soil depths. The positive correlations between the SOC fractions and soil BD, Fe, and GRSP suggested that soil physicochemical and microbial processes are among the most important mechanisms that contribute to SOC persistence. Although all soil carbon indices have the potential to be used as indicators to assess vegetation recovery, POXC could be considered as most sensitive indicator of soil carbon changes that are associated with vegetation restoration.

Author Contributions

Conceptualization, X.W. and D.F.; methodology, G.H. and H.S.; validation, All authors; formal analysis, X.W. and D.F.; investigation, data curation; resources, X.W. and D.F.; data curation, X.W. and D.F.; writing—original draft preparation, X.W.; writing—review and editing, C.D. and D.F.; visualization, all authors; supervision, C.D.; project administration, C.D.; funding acquisition, C.D. All authors have read and agreed to the published version of the manuscript.

Funding

This research was funded by the National Natural Science Foundation of China, grant number U2002208 and 31860133, and China Yunnan Provincial R & D Programs, grant number 202101AS070033.

Data Availability Statement

Not applicable.

Conflicts of Interest

The authors declare no conflict of interest.

Appendix A

Table A1. Description of disturbances and records of different plant communities.
Plant CommunityDisturbance HistoryRestoration Process and Management
Shrub-Grass Land
(SG)
1950s: the aboveground parts of all big trees were felled in the zonal forest; 1960s: all aboveground biomass of big shrub plants was progressively harvested for fuel; 1970s: most of the underground biomass of shrub plants was harvested for fuel; 1980s and 1990s: degraded ecosystem was used for grazing.Intense disturbance; Restoration by natural succession; Stands have been closed for afforestation and felling prohibited since 1999.
Coniferous Pinus Forest (PF)1950s: the aboveground parts of all big trees were felled in the zonal forest; 1960s and 1970s: aboveground and belowground parts of trees and shrub plants were all harvested for fuel.Human-assisted restoration plus natural succession; Stands were seeded with P. yunnanensis in 1980, and have been closed ever since for afforestation, felling is prohibited.
Coniferous And Broad-Leaved Mixed Forest (MF)1950s: the aboveground parts of all big trees were felled in the zonal forest; 1960s: aboveground parts of big shrub plants were harvested for fuel; 1970s: belowground parts of big shrub plants were harvested for fuel and intermediate and small shrub plants were left.Human-assisted restoration plus natural succession; Stands were seeded with P. yunnanensis in 1980, and have been closed ever since for afforestation, felling is prohibited
Natural Secondary Forest (NSF)1950s: the aboveground parts of big trees were felled; 1960s and 1970s: all of the aboveground parts of big and small trees were harvested at intervals but the underground parts were left intact.Weak disturbance; Restoration by natural succession; Stands have been closed for afforestation and felling prohibited since 1980.
Mature Natural Forest (NF)Original natural vegetation, No human disturbanceIn 1982, it was designated as a state-level nature reserve.
Table A2. Basic soil physicochemical properties and results of two-way ANOVA of single and interactions effects of soil depth and vegetation type on soil properties.
VegetationSoil DepthBD
(g cm−3)
SWCClay
(%)
pHTN
(mg kg−1)
TP
(mg kg−1)
Fep
(g kg−1)
Feo
(g kg−1)
Fed
(g kg−1)
NF0–10 cm1.13 ± 0.020.15 ± 0.0134.37 ± 0.614.18 ± 0.100.43 ± 0.070.28 ± 0.030.49 ± 0.021.77 ± 0.307.16 ± 0.25
10–30 cm1.19 ± 0.010.17 ± 0.0132.65 ± 0.424.17 ± 0.030.36 ± 0.040.25 ± 0.020.42 ± 0.131.55 ± 0.545.95 ± 0.01
30–60 cm1.22 ± 0.000.16 ± 0.0133.08 ± 0.484.06 ± 0.040.24 ± 0.010.23 ± 0.020.37 ± 0.071.12 ± 0.166.34 ± 0.43
60–90 cm1.29 ± 0.010.14 ± 0.0132.05 ± 1.704.06 ± 0.010.25 ± 0.030.19 ± 0.000.27 ± 0.040.88 ± 0.276.62 ± 0.09
SG0–10 cm1.32 ± 0.020.18 ± 0.0127.44 ± 0.604.67 ± 0.120.18 ± 0.070.39 ± 0.060.08 ± 0.000.54 ± 0.056.94 ± 0.95
10–30 cm1.39 ± 0.010.19 ± 0.0027.40 ± 1.074.68 ± 0.080.15 ± 0.060.47 ± 0.070.09 ± 0.020.72 ± 0.116.96 ± 0.82
30–60 cm1.44 ± 0.010.18 ± 0.0127.09 ± 2.314.71 ± 0.130.17 ± 0.090.47 ± 0.070.10 ± 0.010.72 ± 0.097.00 ± 0.30
60–90 cm1.55 ± 0.010.19 ± 0.0128.06 ± 4.934.63 ± 0.020.17 ± 0.100.47 ± 0.060.13 ± 0.040.60 ± 0.047.16 ± 0.78
YF0–10 cm1.34 ± 0.020.18 ± 0.0031.42 ± 1.704.58 ± 0.070.18 ± 0.080.19 ± 0.050.17 ± 0.010.87 ± 0.128.43 ± 0.83
10–30 cm1.41 ± 0.010.17 ± 0.0131.68 ± 1.884.53 ± 0.110.08 ± 0.020.19 ± 0.060.10 ± 0.020.75 ± 0.149.49 ± 0.75
30–60 cm1.48 ± 0.010.24 ± 0.0733.31 ± 2.644.50 ± 0.110.13 ± 0.090.19 ± 0.050.11 ± 0.020.73 ± 0.219.73 ± 0.82
60–90 cm1.53 ± 0.040.19 ± 0.0128.03 ± 6.184.44 ± 0.060.06 ± 0.020.20 ± 0.080.16 ± 0.040.78 ± 0.319.23 ± 0.78
MF0–10 cm1.22 ± 0.030.19 ± 0.0226.43 ± 1.574.50 ± 0.170.14 ± 0.050.30 ± 0.030.10 ± 0.030.70 ± 0.096.42 ± 1.14
10–30 cm1.26 ± 0.030.17 ± 0.0127.85 ± 1.384.51 ± 0.190.17 ± 0.070.30 ± 0.040.10 ± 0.020.73 ± 0.106.76 ± 0.33
30–60 cm1.28 ± 0.020.18 ± 0.0030.57 ± 0.874.56 ± 0.180.16 ± 0.050.31 ± 0.020.06 ± 0.010.73 ± 0.127.77 ± 0.37
60–90 cm1.33 ± 0.070.17 ± 0.0131.43 ± 1.864.45 ± 0.110.16 ± 0.100.28 ± 0.030.05 ± 0.020.77 ± 0.128.21 ± 0.49
NSF0–10 cm1.14 ± 0.020.23 ± 0.0228.78 ± 1.714.38 ± 0.120.22 ± 0.100.29 ± 0.040.20 ± 0.050.91 ± 0.138.32 ± 1.15
10–30 cm1.20 ± 0.030.16 ± 0.0131.65 ± 1.224.32 ± 0.030.19 ± 0.060.28 ± 0.030.20 ± 0.020.74 ± 0.048.39 ± 0.87
30–60 cm1.27 ± 0.030.18 ± 0.0034.02 ± 1.334.30 ± 0.040.19 ± 0.050.28 ± 0.040.17 ± 0.001.06 ± 0.148.44 ± 0.73
60–90 cm1.32 ± 0.030.18 ± 0.0136.80 ± 3.614.29 ± 0.060.16 ± 0.070.27 ± 0.040.14 ± 0.031.01 ± 0.169.18 ± 0.60
Two-way ANOVA
Community65.25 ***1.633.39 *12.90 ***3.91 *15.50 ***43.86 ***8.57 ***8.58 ***
Depth36.94 ***0.770.590.610.810.102.88 *0.680.75
Community × Depth0.691.020.730.100.330.281.581.300.41
* and *** indicate significant difference at 0.05 and 0.001 level, respectively.
Table A3. Soil CPI, CMI, and SCS in different soil depths in five vegetation types.
DepthVegetationCPICMISCS
0–10 cmSG0.49 ± 0.10b59.45 ± 9.99b0.41 ± 0.11b
YF0.64 ± 0.09b95.54 ± 2.07a0.44 ± 0.12b
MF0.66 ± 0.15b83.03 ± 17.04a0.55 ± 0.06b
NSF0.66 ± 0.06b84.14 ± 6.63a0.52 ± 0.06b
NF1.00a100a1.00a
10–30 cmSG0.57 ± 0.14b64.89 ± 13.53a0.51 ± 0.14b
YF0.60 ± 0.04b76.25 ± 15.01a0.53 ± 0.16b
MF0.54 ± 0.10b60.65 ± 13.98a0.49 ± 0.07b
NSF0.61 ± 0.07b72.24 ± 1.62a0.53 ± 0.14b
NF1.00a100a1.00a
30–60 cmSG0.64 ± 0.10b56.68 ± 10.65b0.82 ± 0.32a
YF0.54 ± 0.14b72.58 ± 13.54ab0.46 ± 0.19a
MF0.56 ± 0.10b62.24 ± 9.85b0.51 ± 0.11a
NSF0.70 ± 0.10ab105.00 ± 12.45a0.52 ± 0.19a
NF1.00a100a1.00a
60–90 cmSG0.83 ± 0.24a78.97 ± 7.53ab0.96 ± 0.45a
YF0.70 ± 0.26a66.89 ± 19.09b0.75 ± 0.47a
MF0.66 ± 0.11a51.69 ± 11.40b0.86 ± 0.14a
NSF0.86 ± 0.20a84.23 ± 4.99ab0.99 ± 0.43a
NF1.00a100a1.00a
Two-way ANOVA
Community 7.07 ***6.94 ***2.79 *
Depth 1.430.692.44
Community × Depth0.331.000.33
CPI, carbon pool index; CMI, carbon management index; SCS, soil carbon sequestration capacity; SG, shrub-grass land; PF, coniferous Pinus forest; MF: coniferous and broad-leaved mixed forest; NSF, natural secondary forest. The different letters for each carbon index indicate significant differences among vegetation types at the 0.05 level. * and *** indicate significant difference at 0.05 and 0.001 level, respectively.

References

  1. Lehmann, J.; Kleber, M. The Contentious Nature of Soil Organic Matter. Nature 2015, 528, 60–68. [Google Scholar] [CrossRef] [PubMed]
  2. Lal, R. Soil Carbon Sequestration Impacts on Global Climate Change and Food Security. Science 2004, 304, 1623–1627. [Google Scholar] [CrossRef] [PubMed] [Green Version]
  3. Bongiorno, G.; Bünemann, E.K.; Oguejiofor, C.U.; Meier, J.; Gort, G.; Comans, R.; Mäder, P.; Brussaard, L.; de Goede, R. Sensitivity of Labile Carbon Fractions to Tillage and Organic Matter Management and Their Potential as Comprehensive Soil Quality Indicators across Pedoclimatic Conditions in Europe. Ecol. Indic. 2019, 99, 38–50. [Google Scholar] [CrossRef]
  4. Wiesmeier, M.; Urbanski, L.; Hobley, E.; Lang, B.; von Lützow, M.; Marin-Spiotta, E.; van Wesemael, B.; Rabot, E.; Ließ, M.; Garcia-Franco, N. Soil Organic Carbon Storage as a Key Function of Soils-A Review of Drivers and Indicators at Various Scales. Geoderma 2019, 333, 149–162. [Google Scholar] [CrossRef]
  5. Kollmann, J.; Meyer, S.T.; Bateman, R.; Conradi, T.; Gossner, M.M.; de Souza Mendonça Jr., M.; Fernandes, G.W.; Hermann, J.-M.; Koch, C.; Müller, S.C.; et al. Integrating Ecosystem Functions into Restoration Ecology—Recent Advances and Future Directions. Restor. Ecol. 2016, 24, 722–730. [Google Scholar] [CrossRef]
  6. Xu, H.; Qu, Q.; Wang, M.; Li, P.; Li, Y.; Xue, S.; Liu, G. Soil Organic Carbon Sequestration and Its Stability after Vegetation Restoration in the Loess Hilly Region, China. Land Degrad. Dev. 2020, 31, 568–580. [Google Scholar] [CrossRef]
  7. Liu, M.; Li, P.; Liu, M.; Wang, J.; Chang, Q. The Trend of Soil Organic Carbon Fractions Related to the Successions of Different Vegetation Types on the Tableland of the Loess Plateau of China. J. Soil. Sediment. 2021, 21, 203–214. [Google Scholar] [CrossRef]
  8. Haynes, R.J. Labile Organic Matter Fractions as Centralcomponents of the Quality of Agricultural Soils: An Overview. Adv. Agron. 2005, 5, 221–268. [Google Scholar]
  9. Christensen, B.T. Physical Fractionation of Soil and Structural and Functional Complexity in Organic Matter Turnover. Eur. J. Soil Sci. 2001, 52, 345–353. [Google Scholar] [CrossRef]
  10. Ma, W.; Li, G.; Wu, J.; Xu, G.; Wu, J. Response of Soil Labile Organic Carbon Fractions and Carbon-Cycle Enzyme Activities to Vegetation Degradation in a Wet Meadow on the Qinghai–Tibet Plateau. Geoderma 2020, 377, 114565. [Google Scholar] [CrossRef]
  11. Zhong, Y.; Yan, W.; Shangguan, Z. Soil Carbon and Nitrogen Fractions in the Soil Profile and Their Response to Long-Term Nitrogen Fertilization in a Wheat Field. Catena 2015, 135, 38–46. [Google Scholar] [CrossRef]
  12. Benbi, D.K.; Brar, K.; Toor, A.S.; Singh, P. Total and Labile Pools of Soil Organic Carbon in Cultivated and Undisturbed Soils in Northern India. Geoderma 2015, 237, 149–158. [Google Scholar] [CrossRef]
  13. de Moraes Sá, J.C.; Gonçalves, D.R.P.; Ferreira, L.A.; Mishra, U.; Inagaki, T.M.; Furlan, F.J.F.; Moro, R.S.; Floriani, N.; Briedis, C.; de Oliveira Ferreira, A. Soil Carbon Fractions and Biological Activity Based Indices Can Be Used to Study the Impact of Land Management and Ecological Successions. Ecol. Indic. 2018, 84, 96–105. [Google Scholar] [CrossRef]
  14. Zhang, H.; Deng, Q.; Hui, D.; Wu, J.; Xiong, X.; Zhao, J.; Zhao, M.; Chu, G.; Zhou, G.; Zhang, D. Recovery in Soil Carbon Stock but Reduction in Carbon Stabilization after 56-Year Forest Restoration in Degraded Tropical Lands. Forest Ecol. Manag. 2019, 441, 1–8. [Google Scholar] [CrossRef]
  15. Singh, A.K.; Rai, A.; Singh, N. Effect of Long Term Land Use Systems on Fractions of Glomalin and Soil Organic Carbon in the Indo-Gangetic Plain. Geoderma 2016, 277, 41–50. [Google Scholar] [CrossRef]
  16. Castellano, M.J.; Mueller, K.E.; Olk, D.C.; Sawyer, J.E.; Six, J. Integrating Plant Litter Quality, Soil Organic Matter Stabilization, and the Carbon Saturation Concept. Glob. Chang. Biol. 2015, 21, 3200–3209. [Google Scholar] [CrossRef]
  17. Kumar, S.; Singh, A.K.; Ghosh, P. Distribution of Soil Organic Carbon and Glomalin Related Soil Protein in Reclaimed Coal Mine-Land Chronosequence under Tropical Condition. Sci. Total Environ. 2018, 625, 1341–1350. [Google Scholar] [CrossRef]
  18. Sinsabaugh, R.L.; Hill, B.H.; Shah, J.J.F. Ecoenzymatic Stoichiometry of Microbial Organic Nutrient Acquisition in Soil and Sediment. Nature 2009, 462, 795–798. [Google Scholar] [CrossRef]
  19. Rillig, M.C.; Ramsey, P.W.; Morris, S.; Paul, E.A. Glomalin, an Arbuscular-Mycorrhizal Fungal Soil Protein, Responds to Land-Use Change. Plant Soil 2003, 253, 293–299. [Google Scholar] [CrossRef]
  20. Zhang, J.; Tang, X.; Zhong, S.; Yin, G.; Gao, Y.; He, X. Recalcitrant Carbon Components in Glomalin-Related Soil Protein Facilitate Soil Organic Carbon Preservation in Tropical Forests. Sci. Rep. 2017, 7, 1–9. [Google Scholar] [CrossRef] [Green Version]
  21. Sher, Y.; Baker, N.R.; Herman, D.; Fossum, C.; Hale, L.; Zhang, X.; Nuccio, E.; Saha, M.; Zhou, J.; Pett-Ridge, J. Microbial Extracellular Polysaccharide Production and Aggregate Stability Controlled by Switchgrass (Panicum Virgatum) Root Biomass and Soil Water Potential. Soil Biol. Biochem. 2020, 143, 107742. [Google Scholar] [CrossRef]
  22. Daynes, C.N.; Zhang, N.; Saleeba, J.A.; McGee, P.A. Soil Aggregates Formed in Vitro by Saprotrophic Trichocomaceae Have Transient Water-Stability. Soil Biol. Biochem. 2012, 48, 151–161. [Google Scholar] [CrossRef]
  23. Ambriz, E.; Báez-Pérez, A.; Sánchez-Yáñez, J.M.; Moutoglis, P.; Villegas, J. Fraxinus–Glomus–Pisolithus Symbiosis: Plant Growth and Soil Aggregation Effects. Pedobiologia 2010, 53, 369–373. [Google Scholar] [CrossRef]
  24. Fu, D.; Wu, X.; Duan, C.; Chadwick, D.R.; Jones, D.L. Response of Soil Phosphorus Fractions and Fluxes to Different Vegetation Restoration Types in a Subtropical Mountain Ecosystem. Catena 2020, 193, 104663. [Google Scholar] [CrossRef]
  25. Fu, D.; Wu, X.; Duan, C.; Smith, A.R.; Jones, D.L. Traits of Dominant Species and Soil Properties Co-Regulate Soil Microbial Communities across Land Restoration Types in a Subtropical Plateau Region of Southwest China. Ecol. Eng. 2020, 153, 105897. [Google Scholar] [CrossRef]
  26. Gregorich, E.G.; Carter, M.R. Soil Sampling and Methods of Analysis; CRC Press: Boca Raton, FL, USA, 2007. [Google Scholar]
  27. Jones, D.L.; Willett, V.B. Experimental Evaluation of Methods to Quantify Dissolved Organic Nitrogen (DON) and Dissolved Organic Carbon (DOC) in Soil. Soil Biol. Biochem. 2006, 38, 991–999. [Google Scholar] [CrossRef]
  28. Blair, G.J.; Lefroy, R.D.B.; Lisle, L. Soil Carbon Fractions Based on Their Degree of Oxidation, and the Development of a Carbon Management Index for Agricultural Systems. Aust. J. Agr. Res. 1995, 46, 1459–1466. [Google Scholar] [CrossRef]
  29. Singh, A.K.; Rai, A.; Pandey, V.; Singh, N. Contribution of Glomalin to Dissolve Organic Carbon under Different Land Uses and Seasonality in Dry Tropics. J. Environ. Manag. 2017, 192, 142–149. [Google Scholar] [CrossRef]
  30. Brink Jr, R.H.; Dubach, P.; Lynch, D.L. Measurement of Carbohydrates in Soil Hydrolyzates with Anthrone. Soil Sci. 1960, 89, 157–166. [Google Scholar] [CrossRef]
  31. Oliveira, D.M.; da, S.; Paustian, K.; Cotrufo, M.F.; Fiallos, A.R.; Cerqueira, A.G.; Cerri, C.E.P. Assessing Labile Organic Carbon in Soils Undergoing Land Use Change in Brazil: A Comparison of Approaches. Ecol. Indic. 2017, 72, 411–419. [Google Scholar] [CrossRef]
  32. Sheng, H.; Zhou, P.; Zhang, Y.; Kuzyakov, Y.; Zhou, Q.; Ge, T.; Wang, C. Loss of Labile Organic Carbon from Subsoil Due to Land-Use Changes Insubtropical China. Soil Biol. Biochem. 2015, 88, 148–157. [Google Scholar] [CrossRef]
  33. Cavalcante, D.M.; de Castro, M.F.; Chaves, M.T.L.; da Silva, I.R.; de Oliveira, T.S. Effects of Rehabilitation Strategies on Soil Aggregation, C and N Distribution and Carbon Management Index in Coffee Cultivation in Mined Soil. Ecol. Indic. 2019, 107, 105668. [Google Scholar] [CrossRef]
  34. Fu, D.G.; Wu, X.N.; Qiu, Q.T.; Duan, C.Q.; Jones, D.L. Seasonal variations in soil microbial communities under different land restoration types in a subtropical mountains region, Southwest China. Appl. Soil Ecol. 2020, 153, 103634. [Google Scholar] [CrossRef]
  35. Fontaine, S.; Barot, S.; Barré, P.; Bdioui, N.; Mary, B.; Rumpel, C. Stability of Organic Carbon in Deep Soil Layers Controlled by Fresh Carbon Supply. Nature 2007, 450, 277–280. [Google Scholar] [CrossRef]
  36. Trumbore, S.E.; Davidson, E.A.; Barbosa de Camargo, P.; Nepstad, D.C.; Martinelli, L.A. Belowground Cycling of Carbon in Forests and Pastures of Eastern Amazonia. Global Biogeochem. Cy. 1995, 9, 515–528. [Google Scholar] [CrossRef] [Green Version]
  37. Weil, R.R.; Islam, K.R.; Stine, M.A.; Gruver, J.B.; Samson-Liebig, S.E. Estimating Active Carbon for Soil Quality Assessment: A Simplified Method for Laboratory and Field Use. Am. J. Altern. Agr. 2003, 18, 3–17. [Google Scholar]
  38. Ren, A.T.; Mickan, B.S.; Li, J.Y.; Zhou, R.; Zhang, X.C.; Ma, M.S.; Wesly, K.; Xiong, Y.C. Soil Labile Organic Carbon Sequestration Is Tightly Correlated with the Abundance and Diversity of Arbuscular Mycorrhizal Fungi in Semiarid Maize Fields. Land Degrad. Dev. 2021, 32, 1224–1236. [Google Scholar] [CrossRef]
  39. Wu, Q.-S.; Xia, R.-X.; Zou, Y.-N. Improved Soil Structure and Citrus Growth after Inoculation with Three Arbuscular Mycorrhizal Fungi under Drought Stress. Eur. J. Soil Biol. 2008, 44, 122–128. [Google Scholar] [CrossRef]
  40. Malekzadeh, E.; Aliasgharzad, N.; Majidi, J.; Abdolalizadeh, J.; Aghebati-Maleki, L. Contribution of Glomalin to Pb Sequestration by Arbuscular Mycorrhizal Fungus in a Sand Culture System with Clover Plant. Eur. J. Soil Biol. 2016, 74, 45–51. [Google Scholar] [CrossRef]
  41. Rillig, M.C. Arbuscular Mycorrhizae, Glomalin, and Soil Aggregation. Can. J. Soil Sci. 2004, 84, 355–363. [Google Scholar] [CrossRef] [Green Version]
  42. Lovelock, C.E.; Wright, S.F.; Clark, D.A.; Ruess, R.W. Soil Stocks of Glomalin Produced by Arbuscular Mycorrhizal Fungi across a Tropical Rain Forest Landscape. J. Ecol. 2004, 92, 278–287. [Google Scholar] [CrossRef]
  43. Fokom, R.; Adamou, S.; Teugwa, M.C.; Boyogueno, A.D.B.; Nana, W.L.; Ngonkeu, M.E.L.; Tchameni, N.S.; Nwaga, D.; Ndzomo, G.T.; Zollo, P.H.A. Glomalin Related Soil Protein, Carbon, Nitrogen and Soil Aggregate Stability as Affected by Land Use Variation in the Humid Forest Zone of South Cameroon. Soil Till. Res. 2012, 120, 69–75. [Google Scholar] [CrossRef]
  44. Zong, M.; Lin, C.; Li, S.; Li, H.; Duan, C.; Peng, C.; Guo, Y.; An, R. Tillage Activates Iron to Prevent Soil Organic Carbon Loss Following Forest Conversion to Cornfields in Tropical Acidic Red Soils. Sci. Total Environ. 2021, 761, 143253. [Google Scholar] [CrossRef] [PubMed]
  45. Huang, X.; Tang, H.; Kang, W.; Yu, G.; Ran, W.; Hong, J.; Shen, Q. Redox Interface-Associated Organo-Mineral Interactions: A Mechanism for C Sequestration under a Rice-Wheat Cropping System. Soil Biol. Biochem. 2018, 120, 12–23. [Google Scholar] [CrossRef]
  46. Wiseman, C.L.S.; Püttmann, W. Soil Organic Carbon and Its Sorptive Preservation in Central Germany. Eur. J. Soil Sci. 2005, 56, 65–76. [Google Scholar] [CrossRef]
  47. Berhe, A.A.; Suttle, K.B.; Burton, S.D.; Banfield, J.F. Contingency in the Direction and Mechanics of Soil Organic Matter Responses to Increased Rainfall. Plant Soil 2012, 358, 371–383. [Google Scholar] [CrossRef]
  48. Wang, H.; Jin, J.; Yu, P.; Fu, W.; Morrison, L.; Lin, H.; Meng, M.; Zhou, X.; Lv, Y.; Wu, J. Converting Evergreen Broad-Leaved Forests into Tea and Moso Bamboo Plantations Affects Labile Carbon Pools and the Chemical Composition of Soil Organic Carbon. Sci. Total Environ. 2020, 711, 135225. [Google Scholar] [CrossRef]
  49. Oliveira, S.P.; Candido, M.J.D.; Weber, O.B.; Xavier, F.A.S.; Escobar, M.E.O.; Oliveira, T.S. Conversion of Forest into Irrigated Pasture I. Changes in the Chemical and Biological Properties of the Soil. Catena 2016, 137, 508–516. [Google Scholar] [CrossRef]
  50. Skjemstad, J.O.; Swift, R.S.; McGowan, J.A. Comparison of the Particulate Organic Carbon and Permanganate Oxidation Methods for Estimating Labile Soil Organic Carbon. Aust. J. Soil Res. 2006, 44, 255–263. [Google Scholar] [CrossRef]
Figure 1. Localization of the study area (a) and sampling sites (b) in Yunnan, southwest China.
Forests 13 00629 g001
Figure 2. Basic physicochemical properties of the soils (0–90 cm) under different vegetation restoration types. Different letters indicate significant differences between vegetation types at the same soil depths at the 0.05 level. NF, natural forest; SG, shrub-grass land; PF, coniferous Pinus forest; MF: coniferous and broad-leaved mixed forest; and NSF, natural secondary forest. BD, bulk density; SWC, soil water content; TN, soil total nitrogen; TP, soil total phosphorus; Fed, free Fe; Feo, poorly crystalline; Fep, organically complexed Fe.
Forests 13 00629 g002
Figure 3. Distributions of glomalin-related soil protein (GRSP) and extracellular polysaccharide (EPS) concentrations for five vegetation types. EE-GRSP, easily extractable GRSP; DE-GRSP, difficultly extractable GRSP; T-GRSP, total extractable GRSP. NF, natural forest; SG, shrub-grass land; PF, coniferous Pinus forest; MF: coniferous and broad-leaved mixed forest; NSF, natural secondary forest.
Forests 13 00629 g003
Figure 4. Distributions of soil total organic carbon (TOC) and carbon fraction concentrations for five vegetation types. DOC, dissolved organic carbon; LFOC, light fraction organic carbon; HFOC, heavy fraction organic carbon; POXC, permanganate oxidizable carbon; POC, particulate organic carbon. NF, natural forest; SG, shrub-grass land; PF, coniferous Pinus forest; MF: coniferous and broad-leaved mixed forest; NSF, natural secondary forest.
Forests 13 00629 g004
Figure 5. Soil organic carbon (SOC) stocks at different soil depths for five vegetation types. Values are the means ± standard error. Different letters indicate significant differences between vegetation types at the same soil depths at the 0.05 level.
Forests 13 00629 g005
Figure 6. Pearson correlations of the soil carbon indices and soil properties for different vegetation types. *, **, and *** indicate significant correlation at 0.05, 0.01, and 0.001 level, respectively.
Forests 13 00629 g006
Figure 7. Redundancy analysis of the soil carbon indices and soil properties for five vegetation types.
Forests 13 00629 g007
Figure 8. Sensitivity index (SI) values for the soil carbon indices for different vegetation restoration types relative to reference forest (natural forest). Values are the means ± standard error. The different letters for each carbon variable indicate significant differences between vegetation types at the 0.05 level.
Forests 13 00629 g008
Figure 9. Principal component analysis for all vegetation types involving the carbon fractions and carbon indices. TOC, total organic carbon; DOC, dissolved organic carbon; LFOC, light fraction organic carbon; HFOC, heavy fraction organic carbon; POXC, permanganate oxidizable carbon; POC, particulate organic carbon; CPI, carbon pool index; CMI, carbon management index; SCS, soil carbon sequestration capacity; NF, natural forest; SG, shrub-grass land; PF, coniferous Pinus forest; MF: coniferous and broad-leaved mixed forest; NSF, natural secondary forest; 1–4 indicates soil 0–10, 10–30, 30–60, and 60–90 cm depths.
Forests 13 00629 g009
Table 1. Results of two-way ANOVA of the single and interactive effects of soil depths and vegetation types on soil organic carbon, carbon fractions, and the sensitivity indices of the soil carbon indices.
FactorsCommunity TypeSoil DepthCommunity Type × Soil Depth
Soil organic carbon and carbon fraction (p value)
TOC<0.001<0.0010.688
DOC<0.001<0.0010.210
POXC<0.001<0.0010.867
LFOC<0.001<0.0010.644
HFOC<0.001<0.0010.860
POC<0.001<0.0010.174
Sensitivity index of soil carbon indices (p value)
TOC<0.0010.2710.992
DOC<0.0010.1750.845
POXC<0.0010.6630.741
LFOC<0.0010.2770.786
HFOC<0.0010.1990.969
POC<0.001<0.0010.294
CPI<0.0010.2480.979
CMI<0.0010.5650.463
SCS<0.050.0790.979
Publisher’s Note: MDPI stays neutral with regard to jurisdictional claims in published maps and institutional affiliations.

