Article

Crown Shapes of Urban Trees-Their Dependences on Tree Species, Tree Age and Local Environment, and Effects on Ecosystem Services

by
Eleonora Franceschi
1,*,
Astrid Moser-Reischl
1,2,
Mohammad A. Rahman
2,
Stephan Pauleit
2,
Hans Pretzsch
1 and
Thomas Rötzer
1
1
Chair for Forest Growth and Yield Science, Technical University of Munich, Hans-Carl-von-Carlowitz-Platz 2, 85354 Freising, Germany
2
Chair for Strategic Landscape Planning and Management, Technical University of Munich, Emil-Ramann-Str. 6, 85354 Freising, Germany
*
Author to whom correspondence should be addressed.
Submission received: 11 March 2022 / Revised: 28 April 2022 / Accepted: 10 May 2022 / Published: 12 May 2022
(This article belongs to the Special Issue Urban Forest and Urban Microclimate)

Abstract

:
Crown shapes of common European urban tree species differ from tree species to tree species and are modified by the age of a tree and its local environment. A tree’s crown shape has a great influence on the crown volume and thus on the ecosystem service provision of a tree such as the shade area or the shade density. We used the data of 3852 tree individuals from eight German cities and the crown shape data of 528 trees for the species Acer platanoides, Acer pseudoplatanus, Aesculus hippocastanum, Fraxinus excelsior, Platanus × acerifolia, Robinia pseudoacacia and Tilia cordata to analyze tree structural dimensions and the crown volume and shade dependency on a tree’s crown shapes. Ovoid (57% of all tree individuals) and spherical (24%) crown shapes were mostly observed. However, columnar shape was observed for light-demanding R. pseudoacacia in close proximity of objects. The greatest shade areas were measured for spherical shape and the highest shade density for ovoid shape. Logistic regression analysis showed significant effects of age and distance to objects on crown shapes. Significant probability of crown shapes was found for different tree species, e.g., A. hippocastanum strongly showed half-ellipsoid crown shapes.

1. Introduction

Urban trees as a major component of urban green spaces are nature-based solutions to mitigate the intensity of heat islands and to ameliorate the city climate (e.g., [1]) as well as to ensure multiple health benefits (e.g., [2,3]). Tree canopies, most importantly crowns of individual trees, i.e., their size and shape, play a very prominent role in providing these services. They lower the surface temperature by shielding solar radiation, thus reducing the energy that reaches the ground [4]. This lowers the absorption of short-wave radiation, consequently reducing the long-wave emission of the ground to the surrounding environment [5]. Moreover, through the evapotranspiration process, advected heat is absorbed, thus energy is partitioned more as a latent rather than a sensible heat flux [6]. The impact of the cooling effect depends on tree size, leaf amount [7,8,9] and constitution under prevalent growing conditions and resources [10]. Additional to cooling by shading and evapotranspiration (e.g., [6,11,12]), tree canopies act as a filter and lower air pollution levels [13,14]. While a single tree can have an impact on the surrounding microclimate [15], in parks these effects can extend into the nearby built environment [16]. Tree crown structure, crown density and crown size play a key role in ameliorating the surrounding climate, e.g., the performance of trees in producing shade and filtering solar radiation depends on canopy shape and solidity and overall tree structure [17].
Therefore, changes in crown volume and shape can influence the magnitude of ecosystem service provision. Crown volume can be used as a proxy to estimate leaf area, transpiration and filtration of fine particles [18]. According to Gratani and Varone [19], it is the most significant variable to explain a change in air temperature under the tree canopy. Consequently, the precise calculation of a tree’s crown volume is an important prerequisite to accurately estimate such growth parameters and ecosystem services. Of particular importance for green space planning is the development of space occupation over time. Further, the changing rainfall interception with increasing tree size (and therefore plant surface area) has to be taken into account causing changes in a tree’s water balance (e.g., [20]).
Data on crown dimensions have been collected for several purposes following different methods; these have been recently reviewed by Zhu et al., [21]. Crown structure assessment with field measurements has shown to be a fast and simple approach. In fact, while recent technologies such as terrestrial laser scanning (TLS) allow partly direct measurements crown-related field measurements offer a straightforward data collection option [21]. At the same time, digital horizontal photography as an alternative to laser scans still requires longer post processing time than field measurements [21]. Recent urban forestry assessment studies (e.g., [18,22]) applied crown radii and crown length estimates for the calculation of tree crown dimensions, assuming the canopies grow in a simplified cylindrical shape. A cylindrical shape of the canopy could be linked to an allocation of biomass in the stem in situations of light competition, as this leads to the tree growing taller to maintain a competitive position where less space for crown extension is available [23]. In urban settings, competition from neighboring trees plays a minor role; consequently, tree crown shapes vary to a greater extent. According to lists for trees recommended for urban plantings (e.g., [24]), urban trees grow their crowns in shapes that widely differ from the cylindrical one and can vary with the tree age. While structure, function and management of urban forests and their relationships are not yet fully understood, traditional forestry sciences have already been considering crown shapes and different canopy growth at a single-tree level for decades. In 1992, Pretzsch et al., [25] set the basis for species-specific crown shapes, ranging from neiloidal to paraboloidal to cylindrical crowns. These considerations have since then been implemented in the single-tree-based stand simulator SILVA [26,27]. There are only a handful of growth models that simulate urban tree growth and estimate ecosystem services independent of spatial and temporal resolution [12]. Among them, the i-Tree growth model group is one of the most prominent ones [28] that can simulate individual tree or trees of single regions. The calculations are based on the average growth rates and biomass allometries as well as canopy structures of urban and forest tree species. In contrast to the generic i-Tree model, CityTree is a physiologically based growth model for single trees [29] and considers carbon and water cycles depending on the environmental conditions.
In this study, we analyzed the crown shapes of common central European urban tree species and their impact on selected ecosystem services. Our overarching hypothesis was that an improved crown shape modeling in urban tree models is essential for a correct estimation of derived crown volume and shade area. We therefore wanted to answer these specific questions:
(1)
Is the dependency of the key parameters for calculating the crown volume, i.e., crown radius and crown length, on tree age varying for common urban tree species?
(2)
Does the crown shape and thus crown volume of urban trees differ from species to species and change with increasing tree age?
(3)
Does the crown shape of urban trees depend on the local environment?
(4)
How does the crown shape influence the shade area and the shade density of urban trees (and thereby the cooling potential)?

2. Materials and Methods
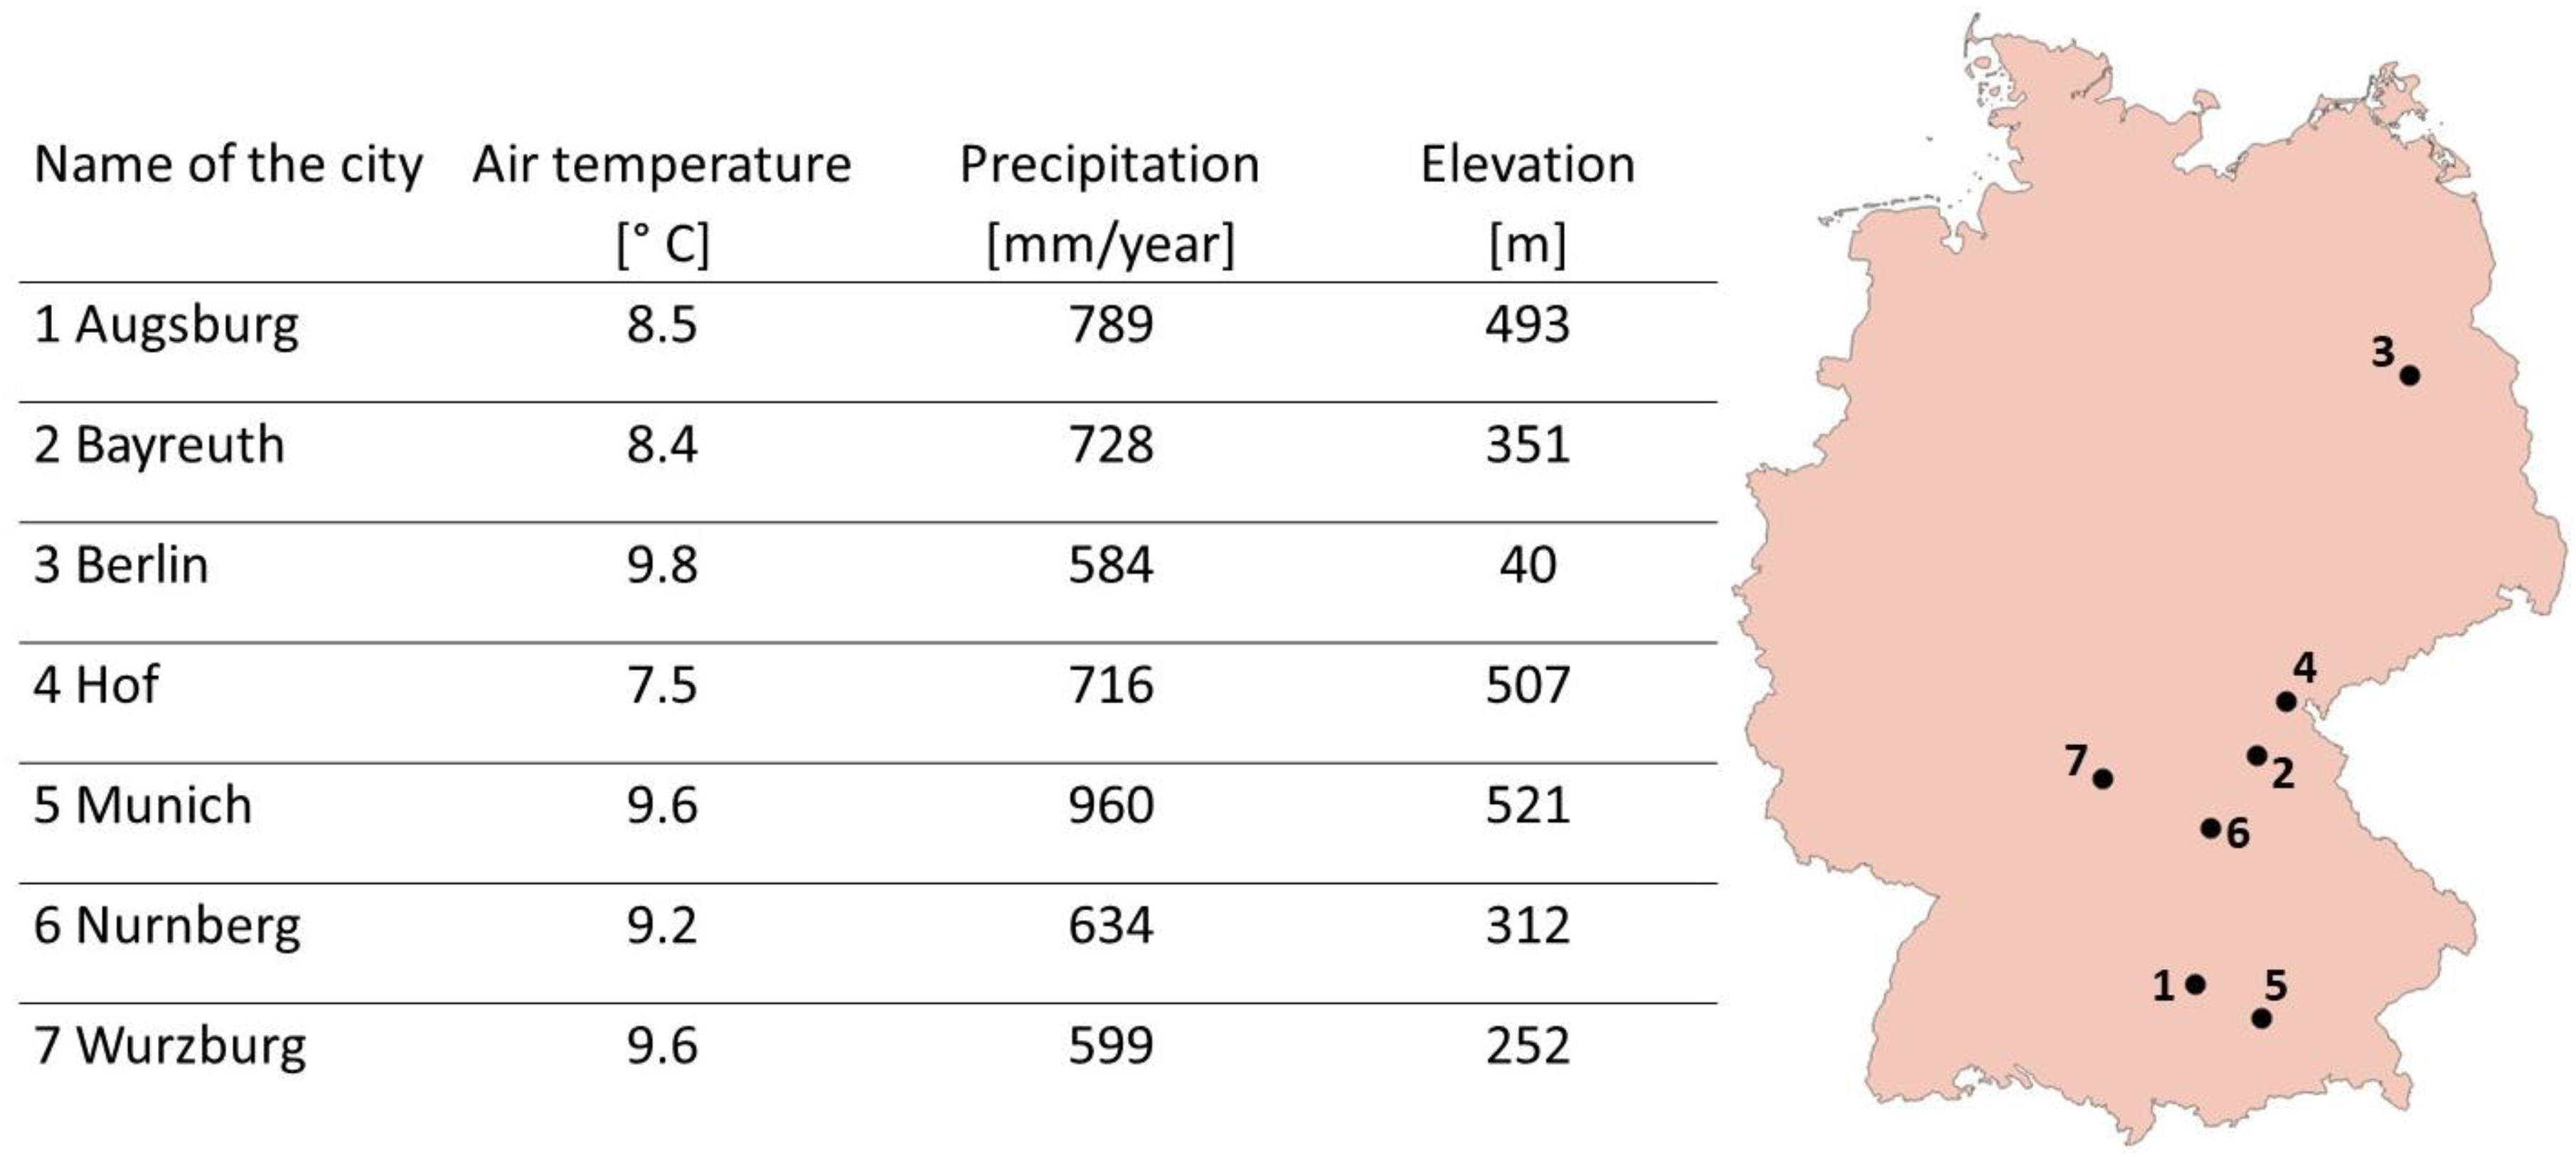
2.1. Study Sites

Structural data (see Section 2.2) were collected in eight cities in Germany (Figure 1). The selected cities cover a wide spectrum regarding size of the city and climate. Figure 1 gives an overview of the different precipitation levels of the cities, with the drier sites in Berlin and Wurzburg with less than 600 mm precipitation per year and the highest annual amount for Munich reaching 960 mm [30]. The average annual air temperature values show differences too, highlighting Berlin’s drier and warmer climate characteristics compared with the colder cities of Hof, Bayreuth and Augsburg. Additionally, Figure 1 shows the location of each city on a map. Due to the need for high resolution data and the high number of measured trees, local soil conditions of the different cities have not been considered in our analysis; although this plays an important role in tree growth, we expect above-ground conditions to be more decisive for our crown shape analysis.
For this study, we assume that the crown shape of trees is not influenced by the climate or the large-scale environmental conditions of the selected cities. Empirical evidence of the impact of local neighborhood diversity on tree morphological characteristics is rare [32]. Moreover, open-grown trees, as in cities, are less studied even in mixed species forests; rather, they serve as a reference for understanding the response of trees to various biotic competitions [18]. Hasenauer [33] stated that open-grown trees, as is true for many urban trees, can grow larger than comparable forest trees. Of course, these have to be analyzed in a next step for which a broader data set from more cities must be available.

2.2. Tree Species, Structural Data and Tree Age

The present study sets its focus on crown shape analyses, while additional structural data for a more accurate analysis of the first research question were included. Overall, seven tree species were considered: Acer platanoides (Norway maple), Acer pseudoplatanus (sycamore maple), Aesculus hippocastanum (horse chestnut), Tilia cordata (small-leaved lime), Robinia pseudoacacia (black locust), Platanus × acerifolia (London plane), Fraxinus excelsior (European ash). The chosen tree species represent considerably different ecological features [34,35,36]. Moreover, Roloff [37] and Niinemets and Valladares [38] classified the selected species among others regarding their drought tolerance and found different suitability regarding drought stress in urban areas. These tree species are all very abundant in temperate and Mediterranean climate zones [39]. While T. cordata, A. hippocastanum, A. platanoides and A. pseudoplatanus are usually shade tolerant species, they are able to adapt to strong light conditions. On the other hand, R. pseudoacacia, F. excelsior and P. × acerifolia are very light demanding but also very drought tolerant [34,37,40].
For all seven species, structural data including diameter at breast height (dbh), tree height (h), crown base (height of the first branch [41,42]), crown radii in eight cardinal directions (north, northeast, east, southeast, south, southwest, west, northwest) as well as the tree locations (geographical coordinates and elevation) were measured. We excluded visually damaged or strongly pruned trees and focused on vital possibly single-standing trees. In addition, for the eight cardinal directions, the distances to neighboring objects (trees or buildings) were measured.
Standard crown dimensions were calculated based on the collected data in the field and formulas from the literature (e.g., [43,44,45]), i.e., mean crown radius and crown length. While crown length (cl) was defined as the upper segment of tree height from the branch start (i.e., crown base),
cl = h crown   base
the mean crown radius (cr) was defined as the quadratic mean of the eight crown radii, with i being the eight directions and r the corresponding crown radius value:
cr = i = 1 8 r i 2 8
The averages of the collected structural data and their standard deviation are shown in Table 1. The number of measured trees per species ranged from 246 individuals for F. excelsior to 1065 individuals for T. cordata.
All tree species showed a relatively similar range of dbh, with the highest values for A. hippocastanum and P. × acerifolia. These species showed the biggest crown lengths and crown radii.
For urban tree managers it is important to know the age of the trees, therefore we estimated tree age using the variables dbh and h and species-specific equations (Table 2). From these equations age can be derived and applied as an alternative to dbh. Age was used for the calculation of the leaf area index.

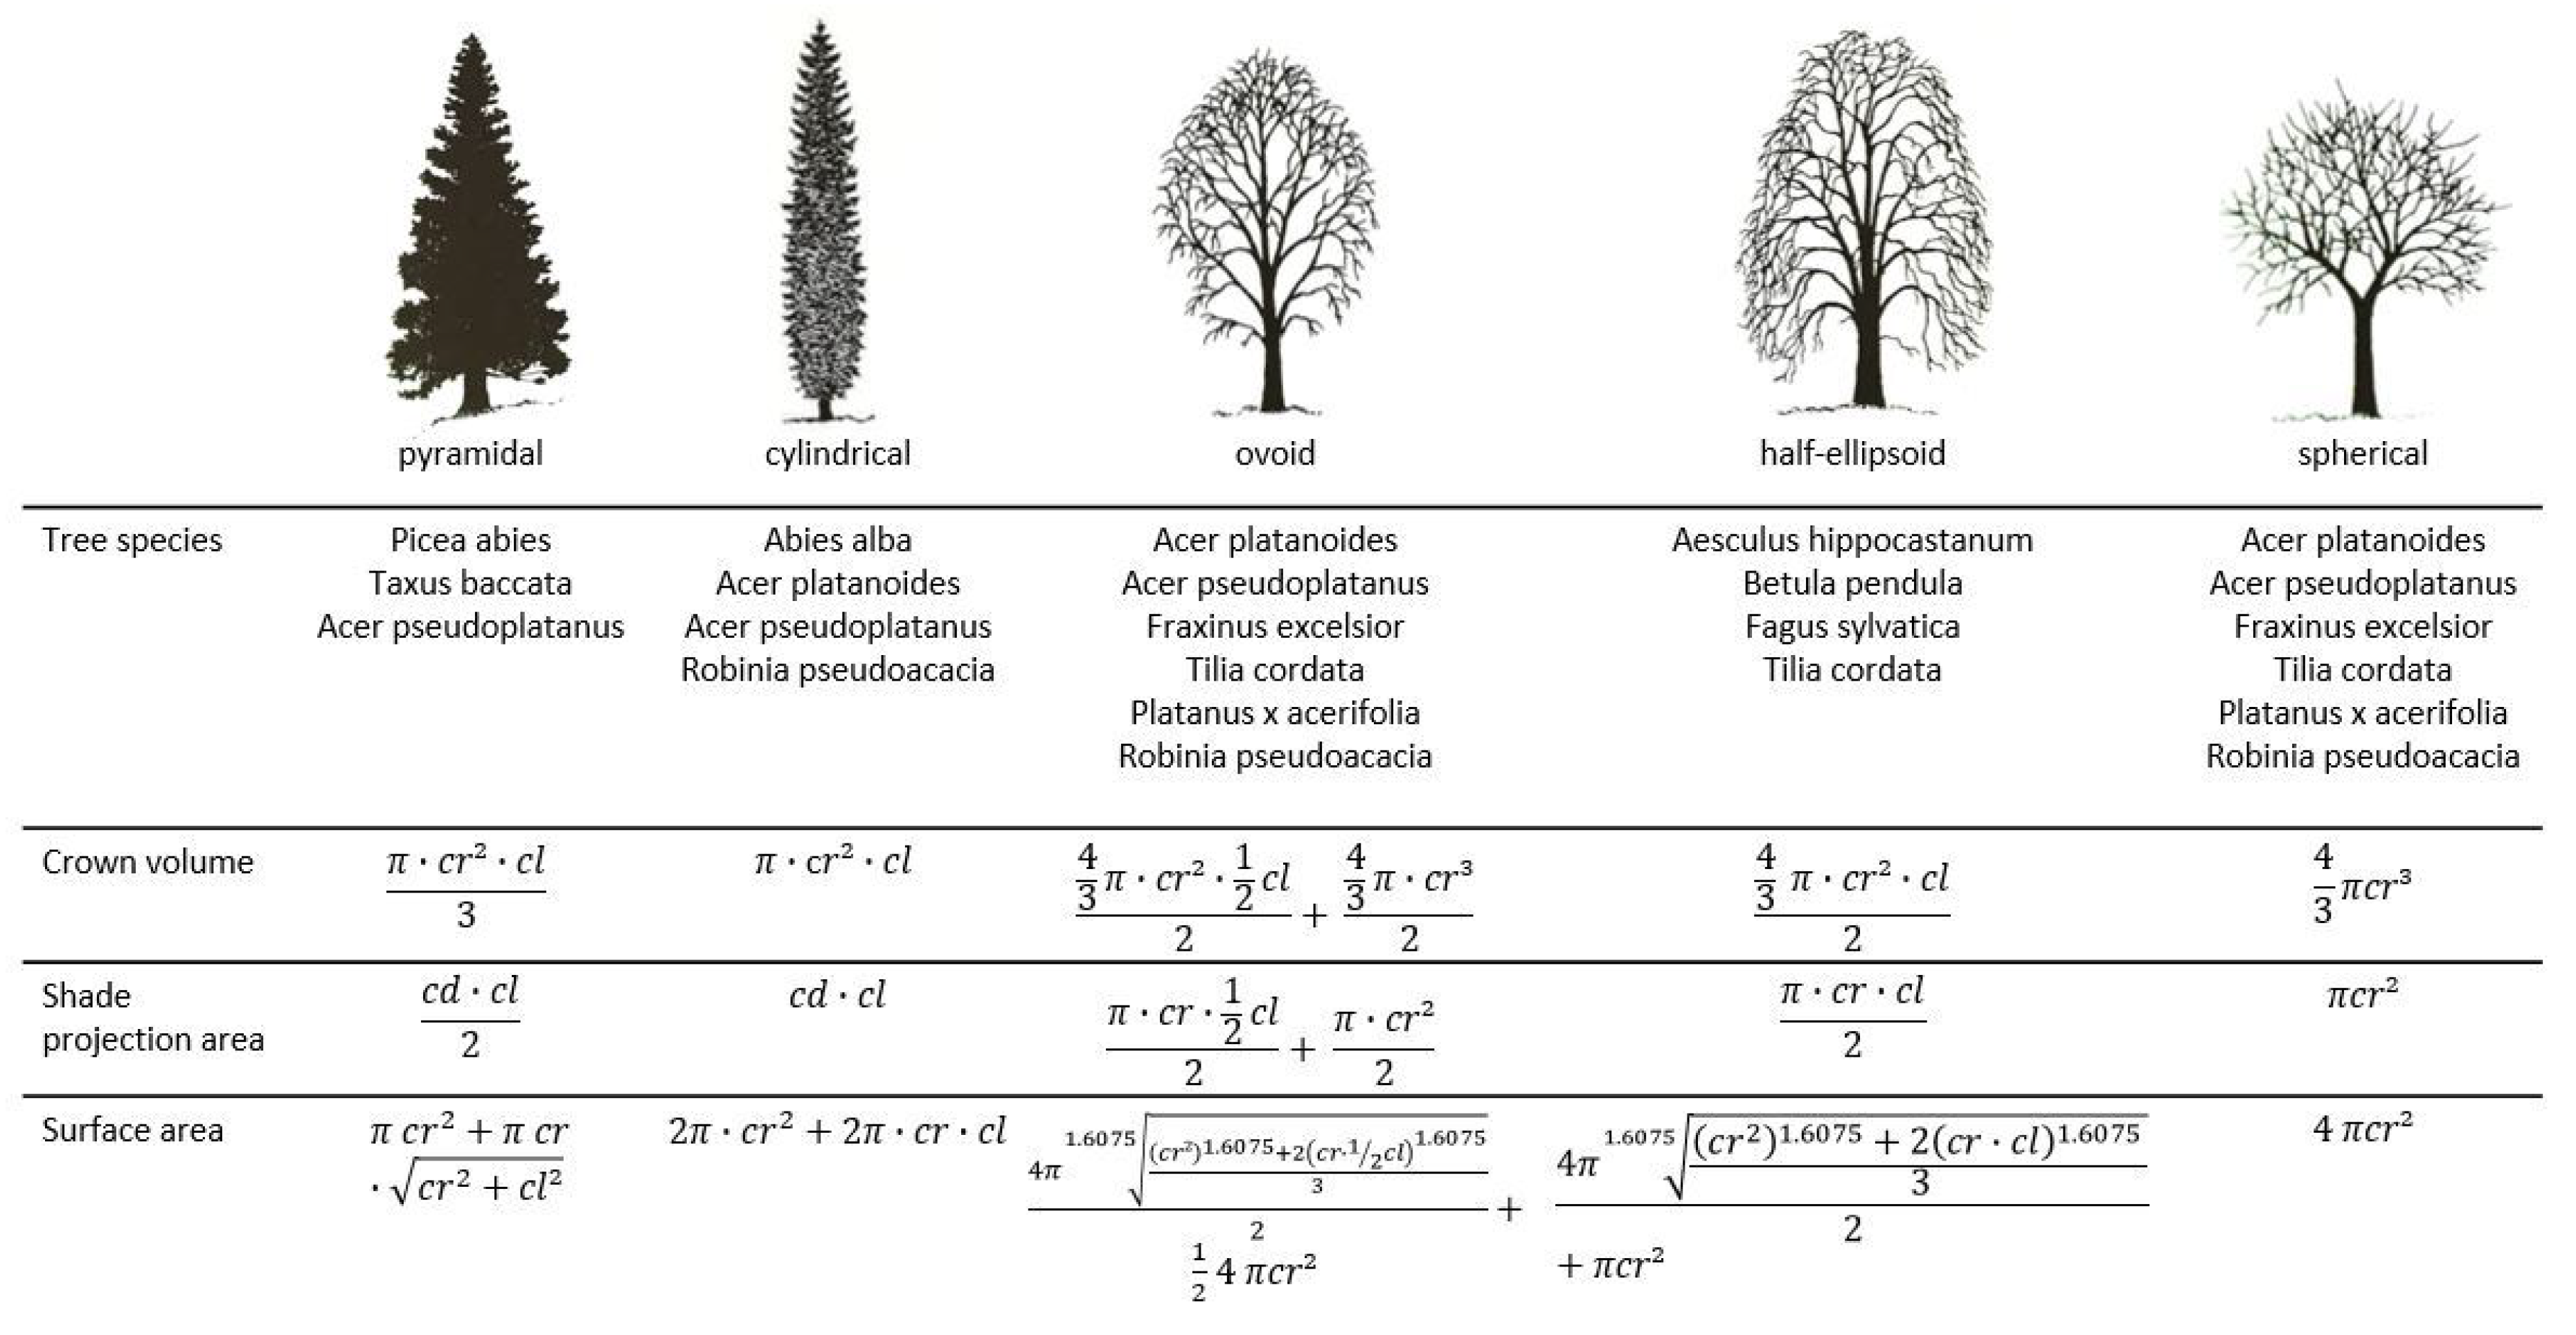
2.3. Crown Volume Calculation

Within this study, we analyzed the estimation of crown volume based on shape-specific volume calculations. Therefore, the tree crowns of 528 trees located in Munich and Berlin were assigned to five crown shape types based on Lawrence (1985) [50]; five tree species have been included (Table 3).
Most of the tree species have specific crown shapes, particularly solitary trees, which are not affected by neighboring trees or buildings. Pyramidal, cylindrical, spherical, ovoid and half-ellipsoidal crown shapes are the most common occurring crown shapes of the analyzed tree species based on the literature and urban tree catalogues [24,50,51] (Figure 2).
To calculate a tree’s crown volume (cv), crown surface area and crown shade projection area (cspa) the standard geometrical equations shown in Figure 2 were used. Crown radius and crown length were used as the key parameters for these calculations, with cr as radius and cl as crown height (Figure 2). For the half-ellipsoidal shape, the volume of an ellipsoid was calculated and then divided by 2. In this case, the two shorter segments of the ellipsoid were substituted by cr and the longer one by cl. For the ovoid shape, half of an ellipsoid and half of a sphere were summarized to consider both possibilities of a longer upper part of the crown with a flatter lower part and the opposite with an elongated crown shape facing the ground (Figure 2). A bigger cl resulted then in an elongated egg shape, whereas a smaller cl led to a more spherical shape. For the cspa, we used cl and cr to calculate a tree’s silhouette. i.e., a circle for the spherical shape, an (half) ellipse for the half-ellipsoid shape and a rectangle for the cylindrical one.

2.4. Statistical Methods

The calculation of the crown volumes (following Figure 2) was applied in Microsoft Office Excel 2013. The visualization of the results was realized using R (software version 3.6.3) basis plot functions. Normal distribution for the main parameters was visually checked (histogram representation in RStudio) before log–log–linear regression was applied to investigate significance and relationship of crown radius and crown length with dbh, following Pretzsch et al., 2012 [52] and Moser et al., (2015) [53].
Dependency of crown shape on the local environment was analyzed applying an index expressing distance levels to objects. The index was equal to 0 when a tree or a building was standing closer than the tree height and equal to 1 when the distance was greater. Logistic regression was then computed in R using the glm function of the package stats. The regression analysis included effects of tree species, diameter at breast height and distance level (0 or 1) for each single crown shape:
glm crown   shape     dbh + as . factor distance   level + as . factor tree   species

2.5. Calculations Based on the Process-Based Growth Model CityTree

Ecosystem services and urban tree growth can be assessed using the process-based model CityTree [32]. For this study, the CityTree model was applied for the estimation of a tree’s age-based leaf area index.
The procedure of the CityTree model was also used to calculate the shadow area, shadow density and shadow index of a tree. Hereby, the crown shape was additionally taken into account. The shade area was calculated as the average of the shade area from 8 am to 6 pm for the 21st of June (the longest day in the northern hemisphere). Thus, the shade area was calculated by applying the formulas for cspa, using cd and shade length (instead of cl), with shade length itself calculated using cl and the cotangent for the hour and for the location of the sun height. The single hourly shade areas were averaged into
avg .   shade   area = i = 8 18 shade   area   i 11 ,
with i as the hour of the day and 11 as the number of considered hours. In the calculation of shade density and shade index, the crown shape was considered by applying the shape-specific cv calculation (Figure 2):
shade   density =   leaf   area   m 2 cv   m 3
and
shade   index = shade   area   ·   shade   density ,
with
leaf area = LAI   · cpa  
In the following results section, examples of the shade area, shade density and shade index were listed to enhance the impact of different crown shapes on those variables. The LAI differences caused by age increase have been considered in the calculations of the variables which include leaf area.

3. Results

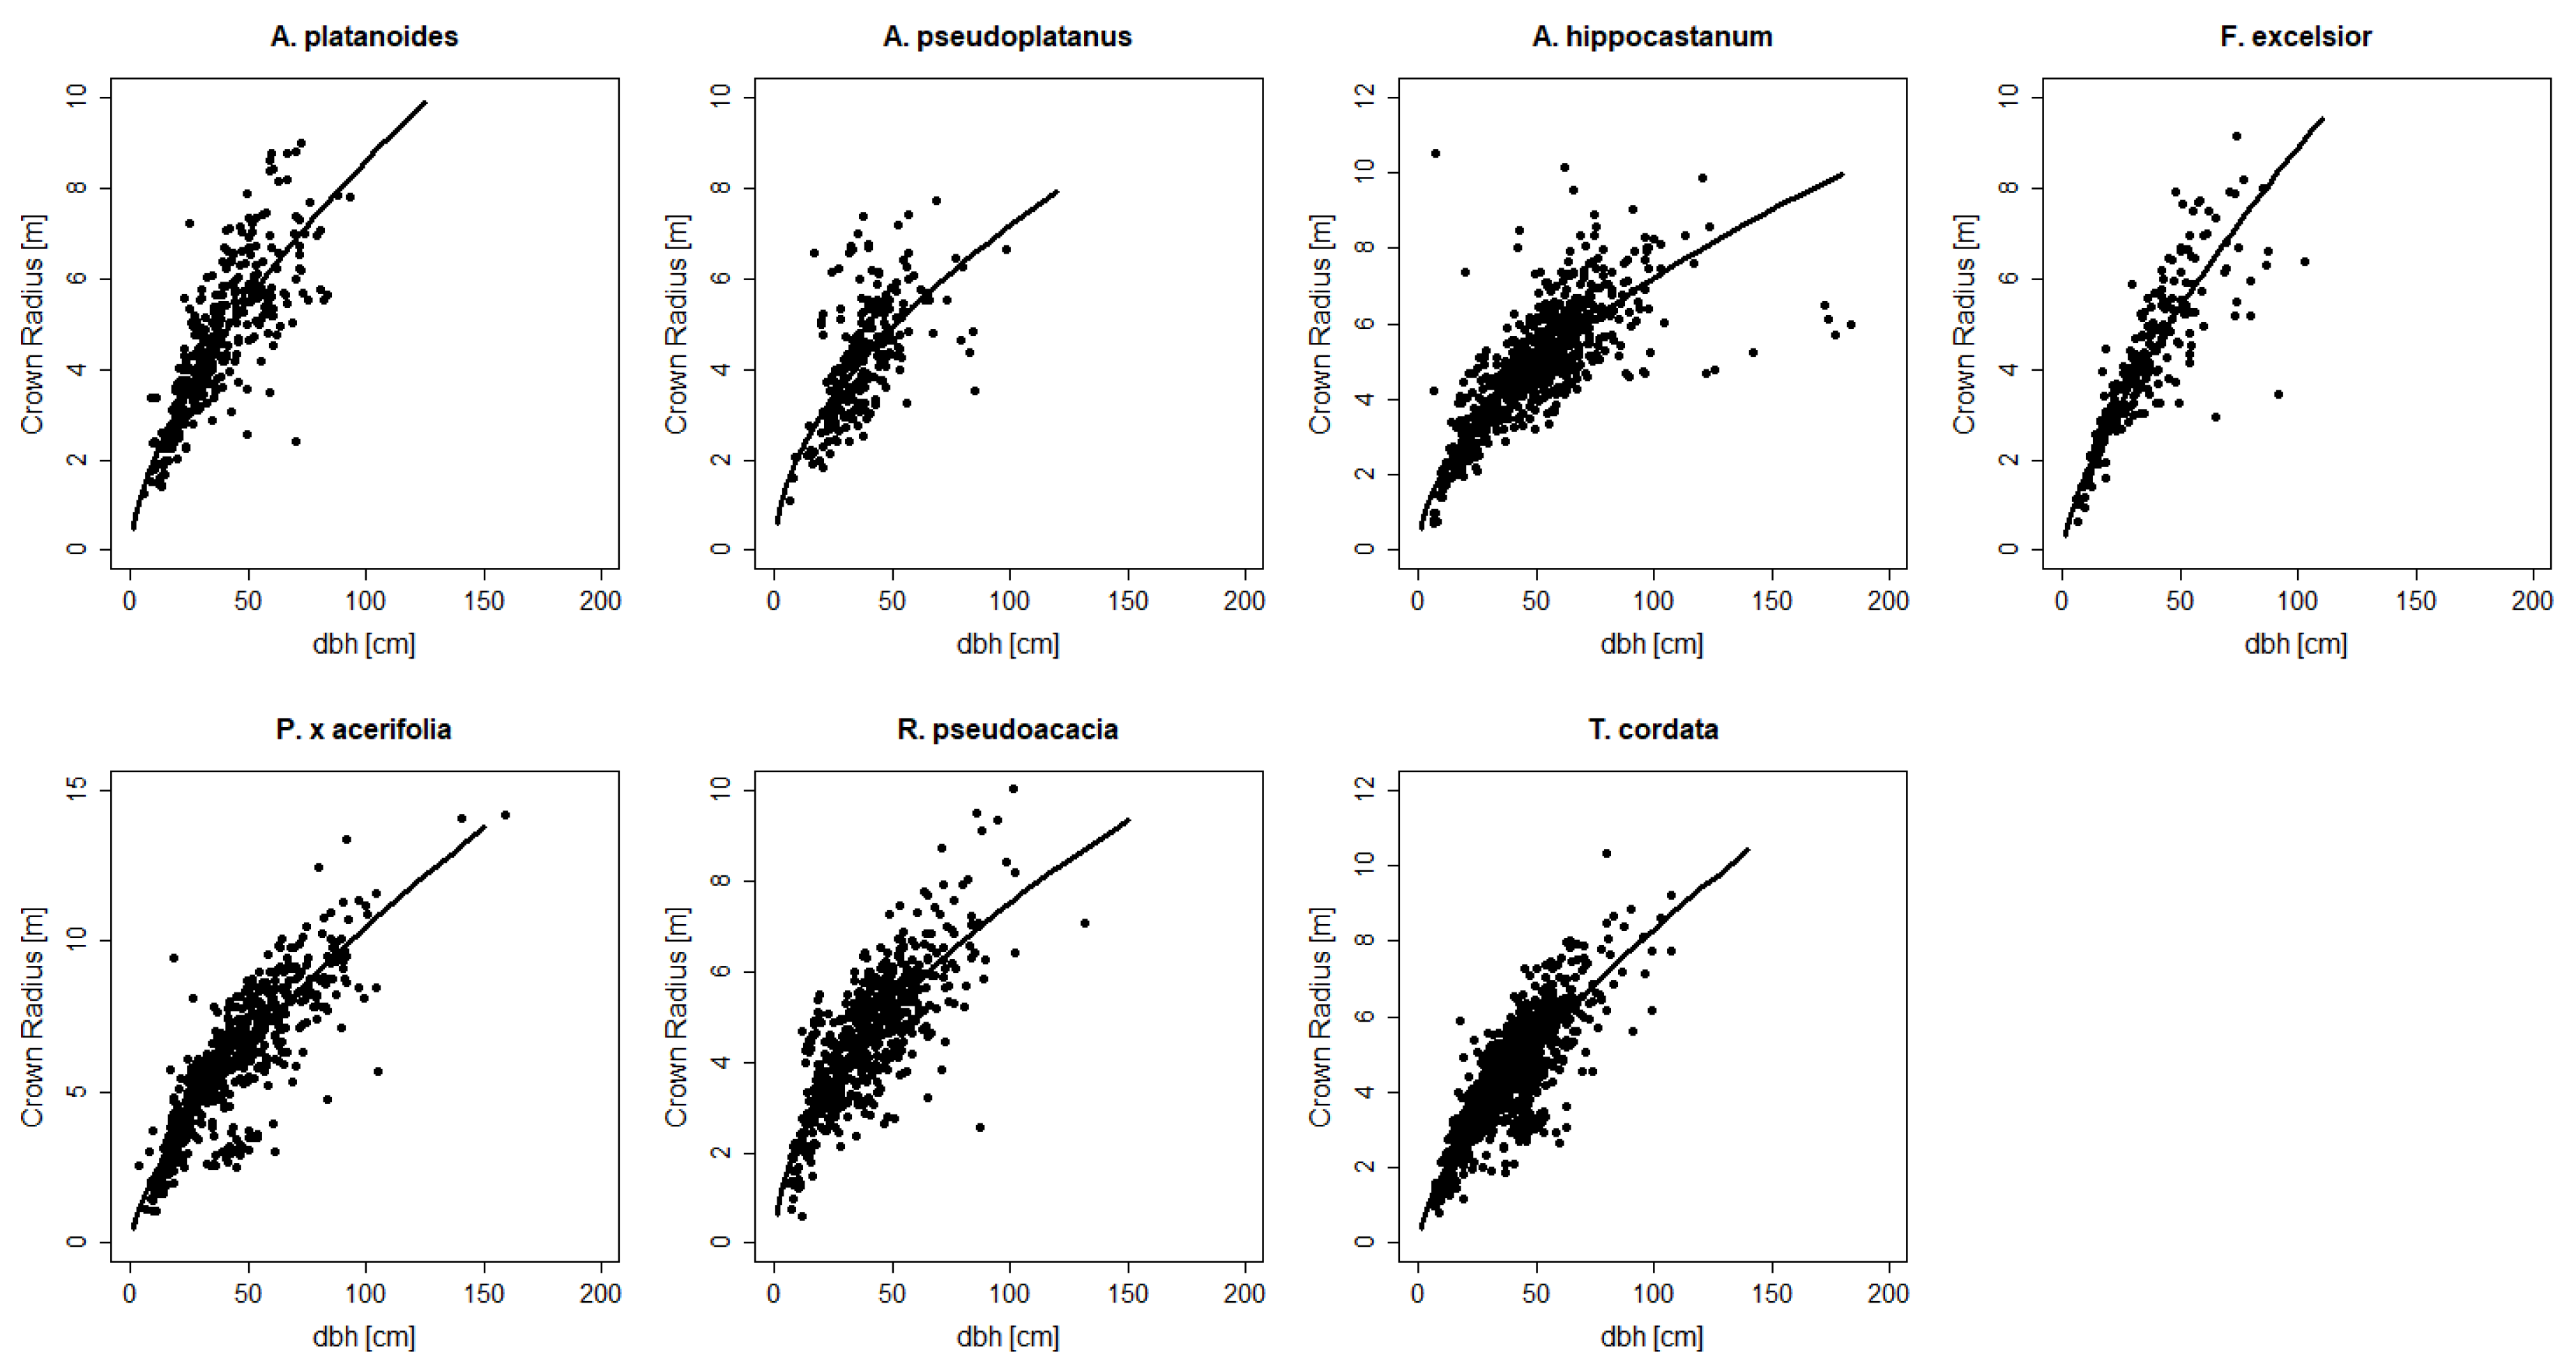
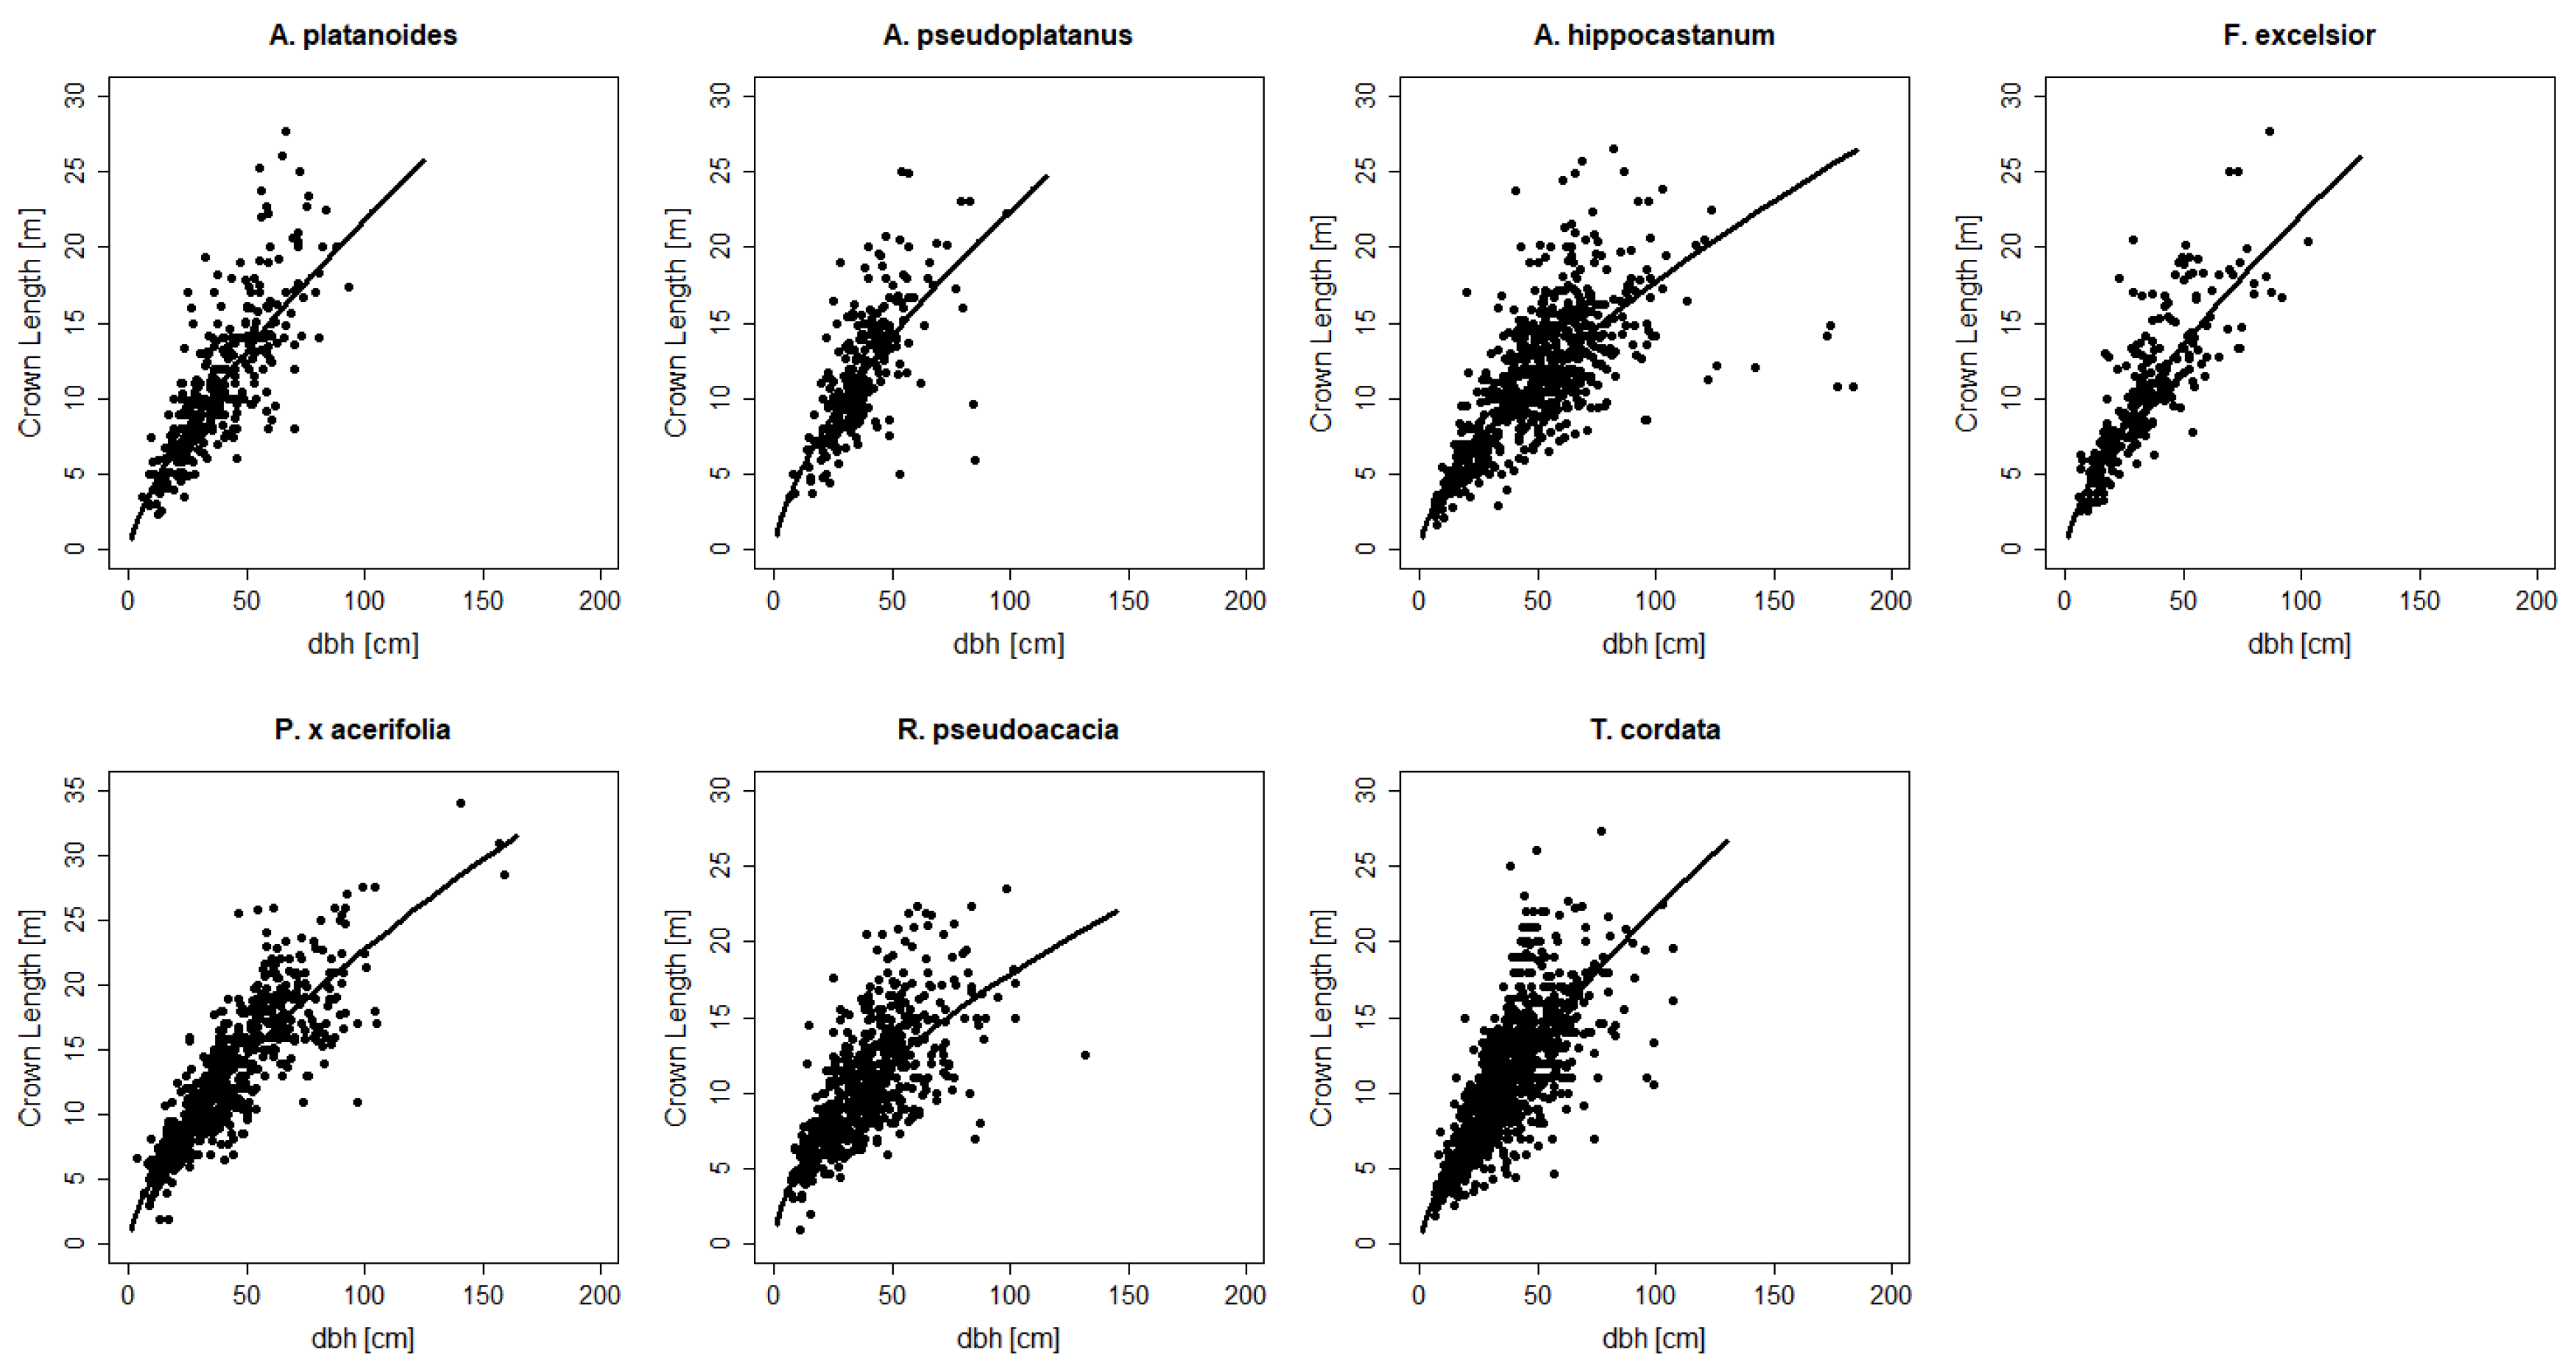
3.1. The Crown Structure of Urban Tree Species

The relationship between dbh and crown radius (Figure 3) as well as dbh and crown length (Figure 4) of seven tree species are shown for all 3852 measured trees. Double-logarithmic relationships between the crown dimensions (cr and cl) and the tree diameter were analyzed through linear regression (see Table 4). Their nonlinear least square relationship is represented in Figure 3 and Figure 4 through a black curve. In both analyses, we recognized different species-specific trends, such as a less pronounced increase of crown radius and crown length with increasing dbh for R. pseudoacacia (slope equal to 0.53 and 0.56, Table 4) compared with other species such as F. excelsior (0.72 and 0.71); whereas, the oldest trees measured were A. pseudoplatanus and A. hippocastanum.
The p-value for all tree species showed a consistent high significance for the relationship between crown radius and dbh as well as crown length and dbh (Table 4). At the same time, while the R² value for A. pseudoplatanus was the lowest for both cr and cl dependencies from dbh (0.46 and 0.51), strong dependency was obvious for F. excelsior (0.83 and 0.73) and P. × acerifolia (0.73 and 0.76). For F. excelsior an increase of 10% in dbh showed the greatest changes in crown radius and length, with an increase in cr of 7.2% and for cl of 7%. For R. pseudoacacia a 10% increase of dbh only led to an increase of 5.2% for cr and 5.5% for cl.

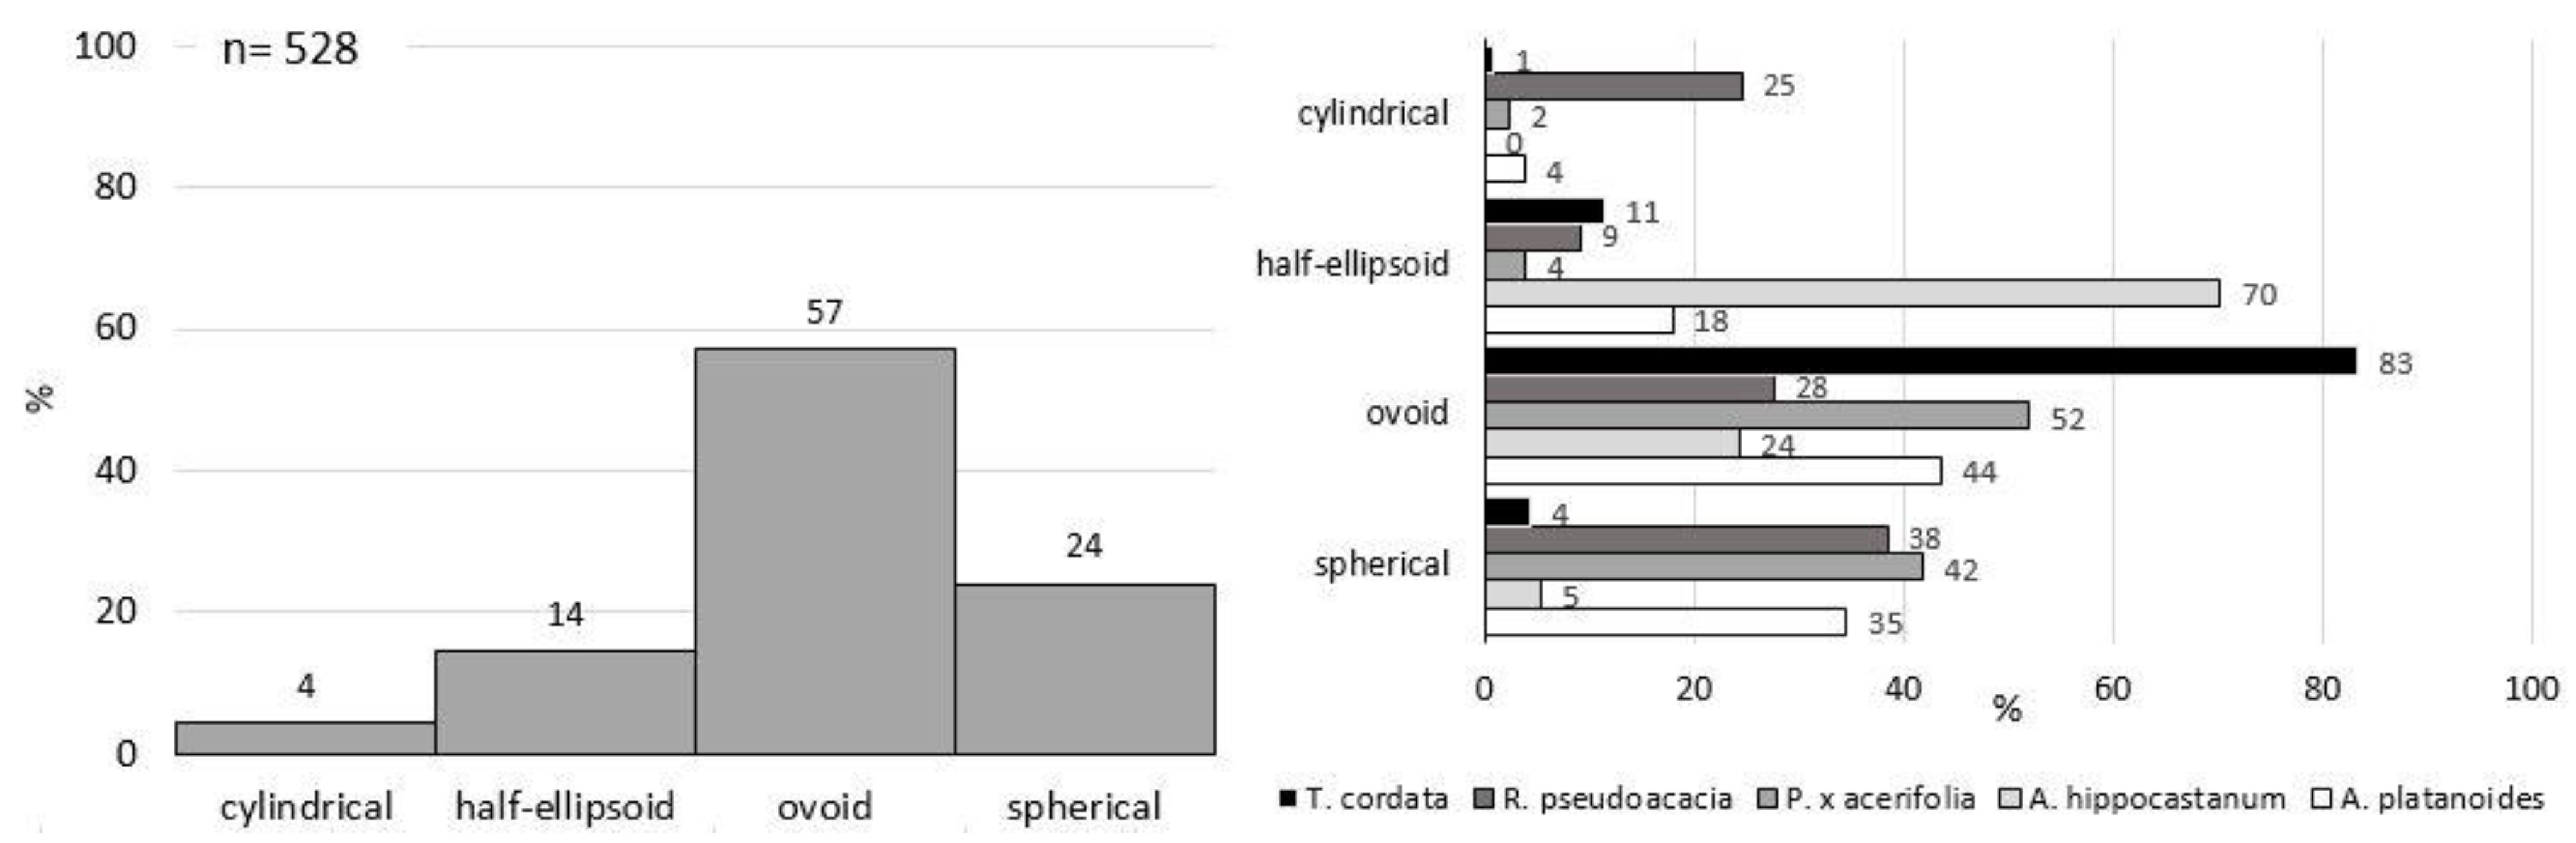
3.2. Crown Shapes of Urban Tree Species

The assignment of trees into crown shape categories showed a prevalence of ovoid shapes (57%) for all tree species (Figure 5). The cylindrical shape was seldom (5%) observed in an urban tree context when single-standing trees were analyzed. R. pseudoacacia was an exception, as it developed a columnar-shaped crown for 25% of its sample. This light-demanding species is often planted in street canyons, which can be considered as situations of light competition due to the shading buildings.
A. hippocastanum showed mostly half-ellipsoidal shaped crowns; however, this was the species with the smallest sample size. Over 50% (52%) of P. × acerifolia’s observed crowns were ovoid. For R. pseudoacacia, there was no clear prevalent shape, whereas 83% of the crowns of T. cordata were ovoid shaped. While for T. cordata the cylindrical shape was present only for a few trees (1%), 25% of the R. pseudoacacia trees showed an elongated crown shape, comparably as often as the ovoid shape. Table 5 highlights the differences of observed crown shapes of small (young) and big (old) trees, where bigger trees were defined as dbh higher than 30 cm.
While classifying the trees into small and big trees, there were only a few small trees for the species R. pseudoacacia and A. hippocastanum. In the case of T. cordata and R. pseudoacacia, the distribution of the most relevant crown shape for the two age classes did not differ considerably. R. pseudoacacia showed 1% difference between big and small trees with spherical crowns, while for T. cordata 98% of the small trees and 79% of the big trees showed ovoid crowns. For the cylindrical shape, the classes difference was 5% for R. pseudoacacia trees. For P. × acerifolia, we noticed instead a change in the dominant shape; small trees of this species showed prevalently ovoid shaped crowns, while bigger trees had more spherical crowns.
The two most frequent crown shapes overall were ovoid (57%) and spherical (24%), with ovoid as the prevalent shape for T. cordata and spherical for A. platanoides and R. pseudoacacia. Divided in the two classes, we observed an increase of the half-ellipsoidal crowns in big trees (17% instead of 4%), while the cylindrical shape was present in 5% of the trees with dbh bigger than 30 cm and only in 3% of the smaller ones. For ovoid and spherical shapes, the age-distribution differences over the whole sample were not high. The cylindrical shape represented only 4% of the tree crowns in our sample.

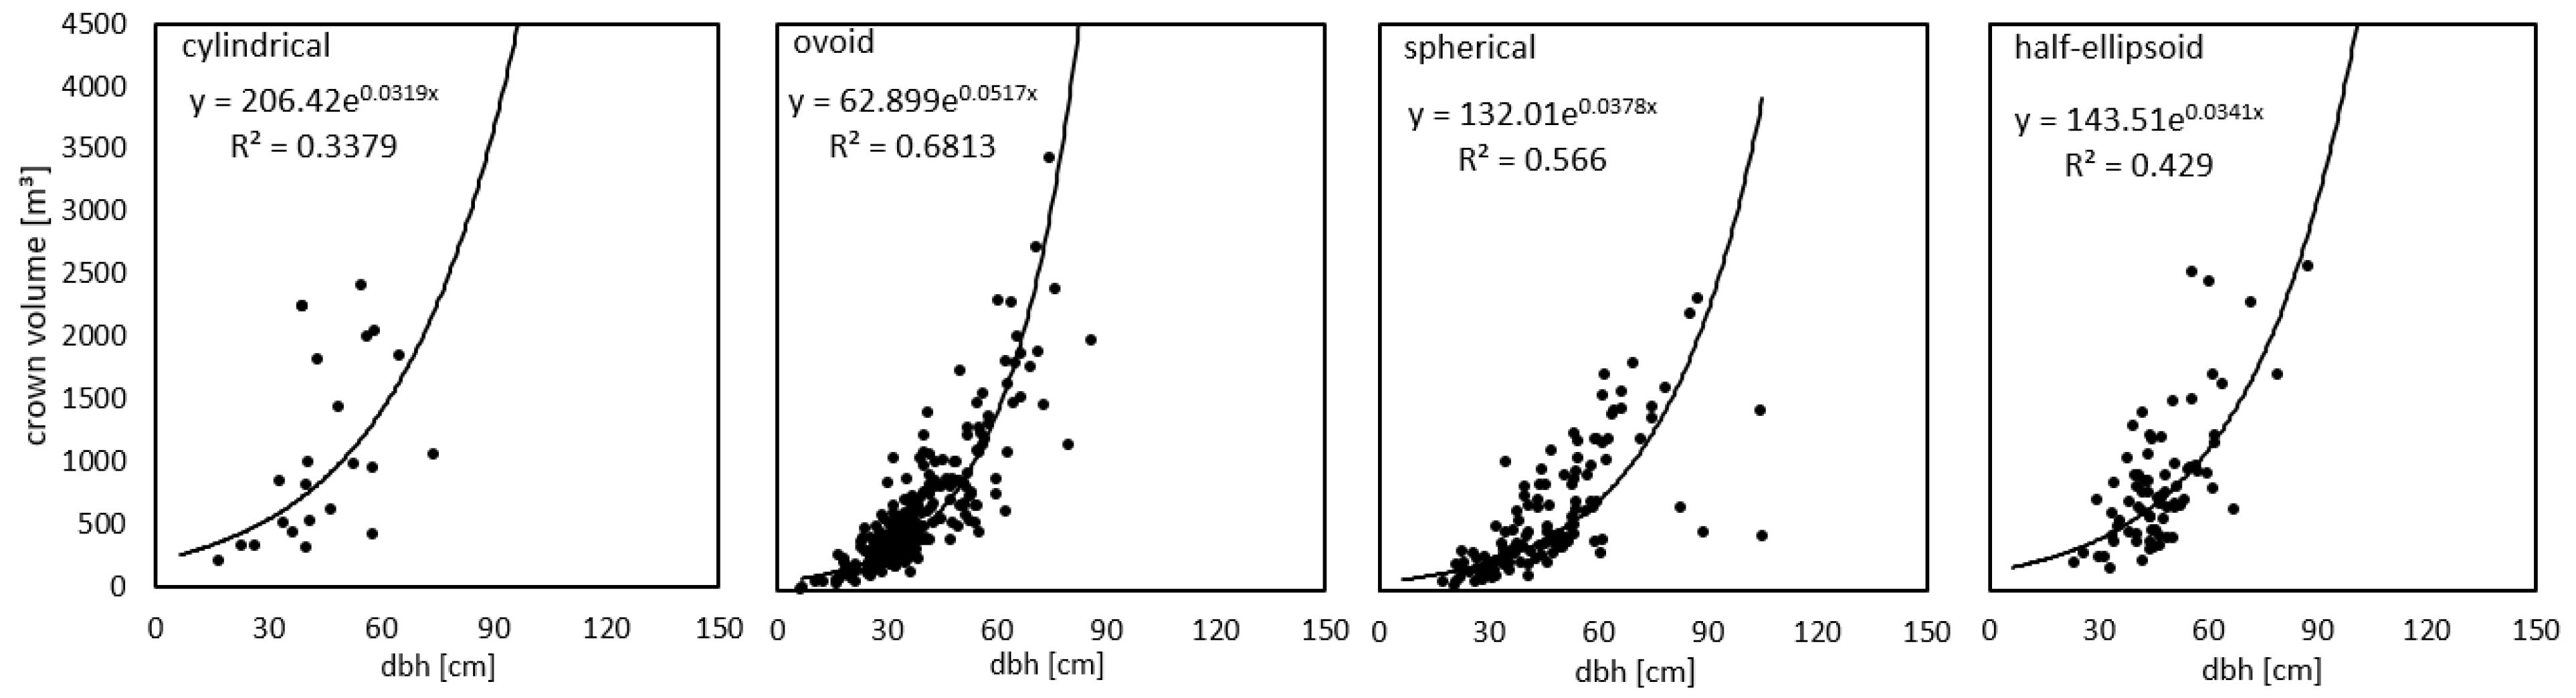
3.3. Influence of Crown Shape on Crown Volume

As we can see from Figure 6, the distribution and development of crown volume with increasing dbh differed depending on the crown shape and its calculation of the crown volume. While the slope of the exponential increase of crown volume with increasing dbh was the highest for the ovoid and spherical shape, cylindrical and half-ellipsoid crown volumes showed only a small increase per year (slope equal to 0.032 and 0.034). For cylindrical crowns the smallest number of trees was observed; this resulted in a low value of goodness of our model (R² = 0.34) in comparison with the ovoid shape (R² = 0.68).

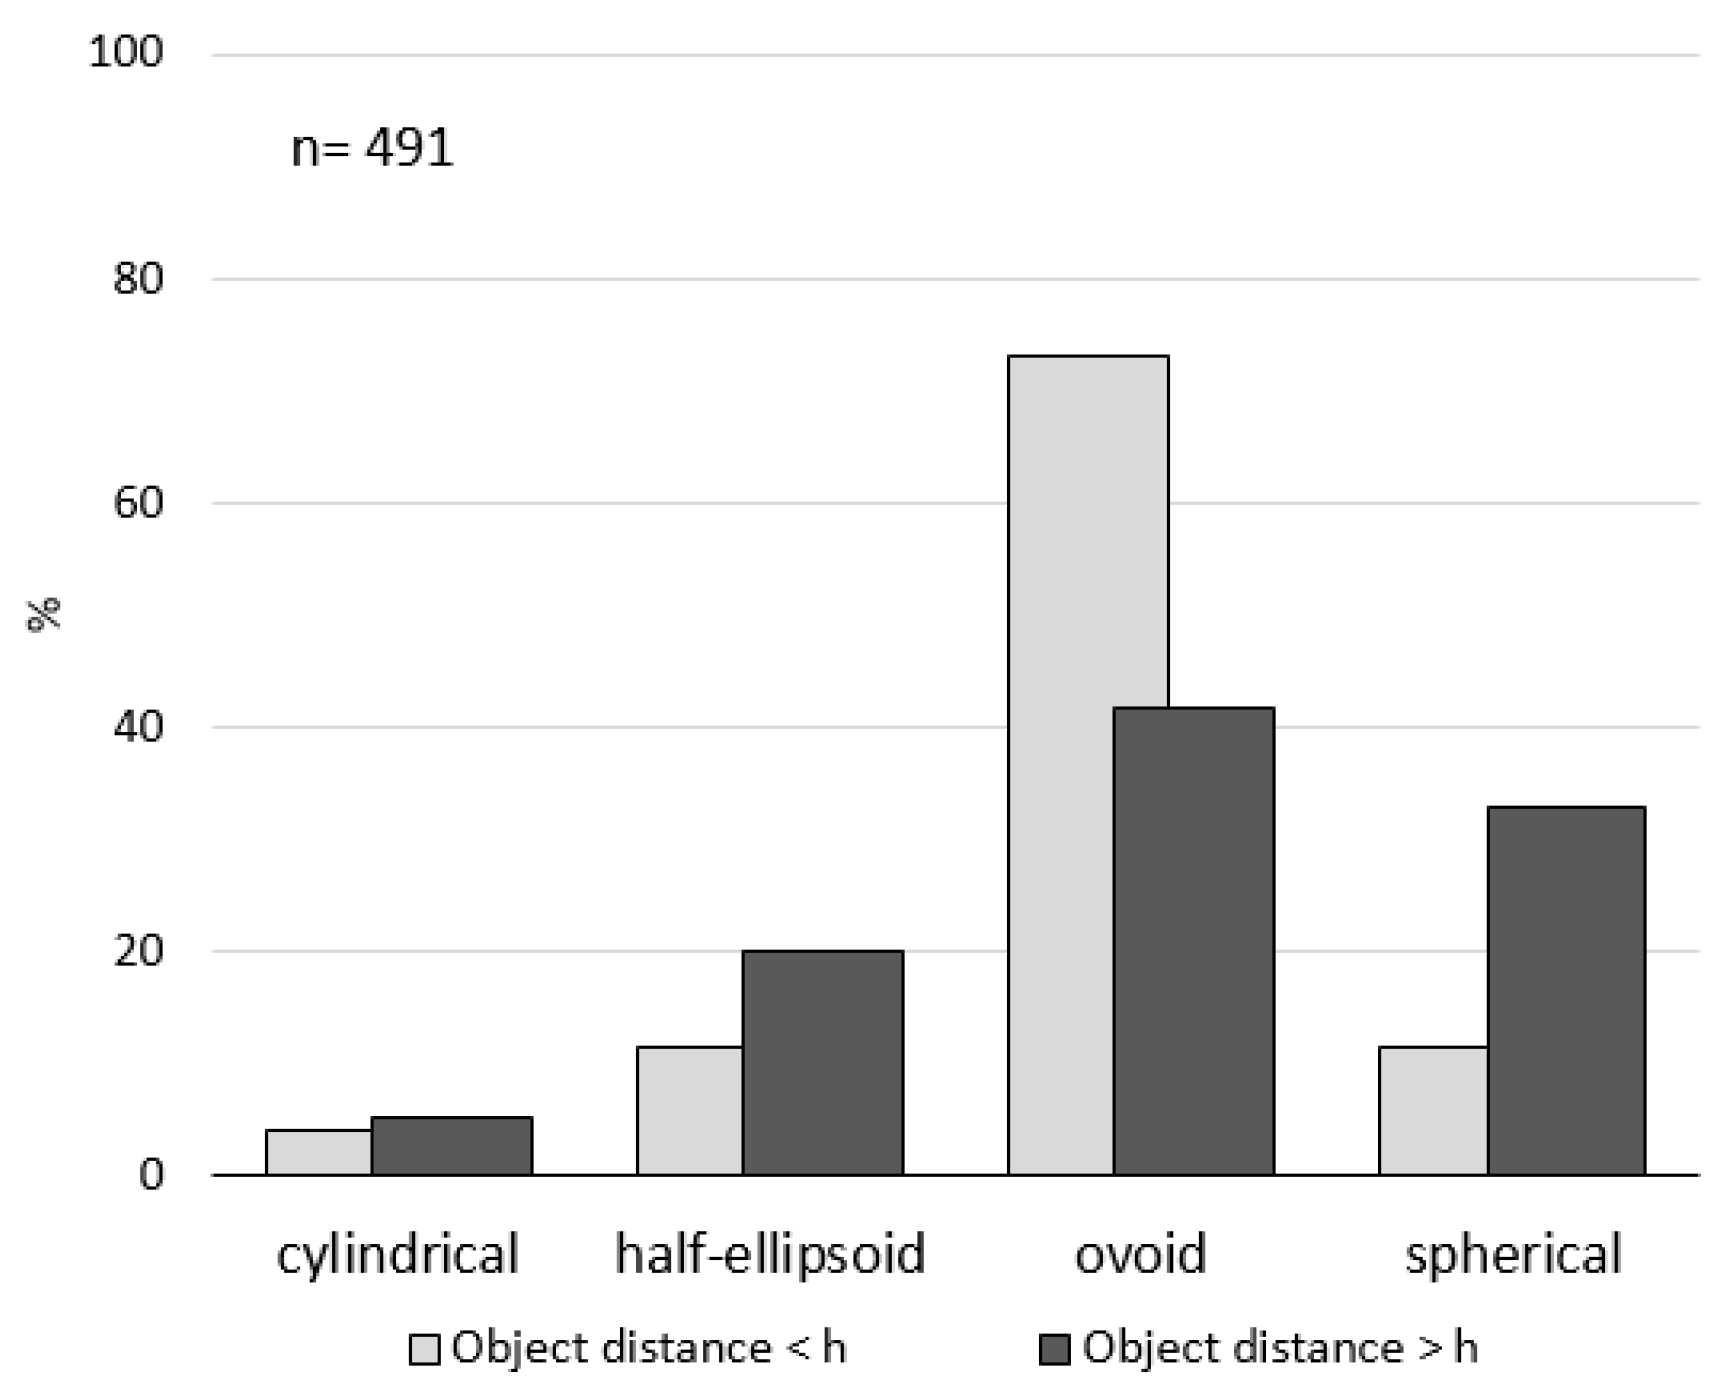
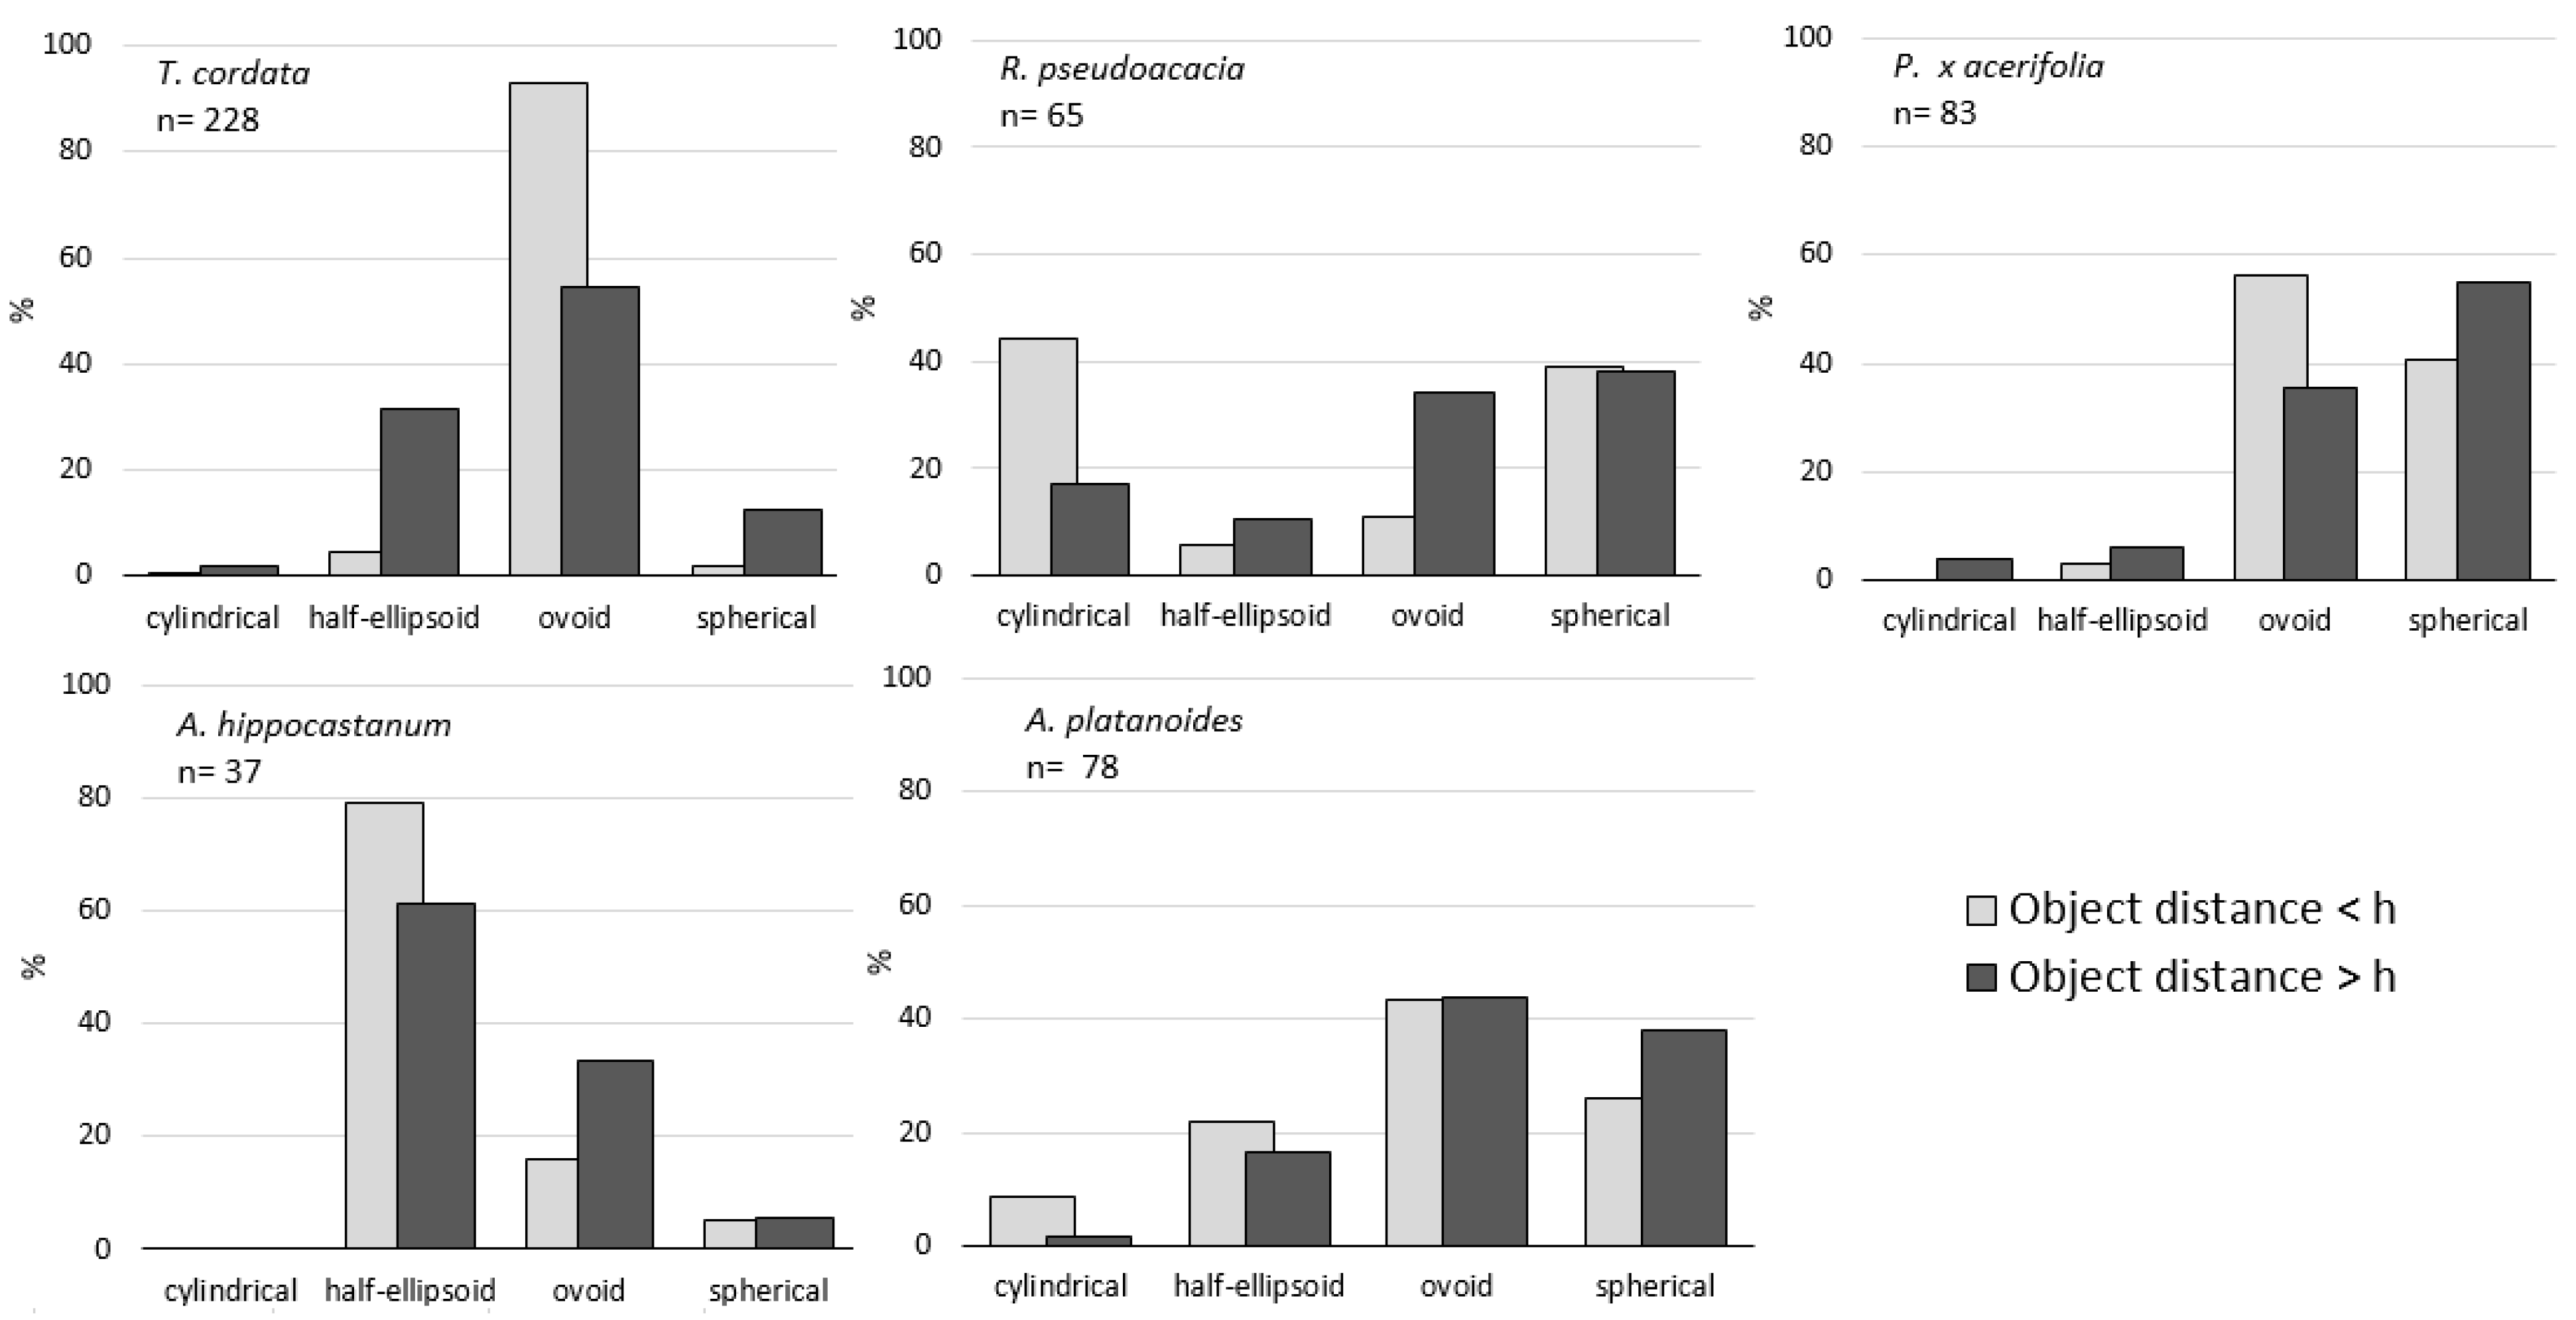
3.4. Dependency of Crown Shape on the Local Environment

To analyze the dependency of the crown shapes on the local environment we analyzed the influence of the distance to buildings or other trees on the development of the crown shape and volume. For this, two distance classes were defined depending on a tree’s height, with one class for the nearest object with a distance smaller or equal to the tree height (h) and one class for the nearest object standing at a distance bigger than the tree height.
For most species, distances from objects such as houses or other trees had little influences on the predominant crown shape. This was distinctly recognizable for A. hippocastanum, with spherical-shaped crowns in 79% and 61% (respectively, for shorter and longer distance) of the observations and T. cordata, with ovoid shape for 93% and 54%. An exception was represented by R. pseudoacacia, with a higher percentage of cylindrically shaped crowns when growing close to objects (44%) and more spherical canopies for wider space conditions (38% spherical and only 17% cylindrical). P. × acerifolia showed slightly more elongated crowns for small distances (ovoid shape 56%) but spherical crowns for the higher distance level (55%). The change in distribution for P. × acerifolia was less pronounced than for R. pseudoacacia.

3.5. Overarching Analysis of the Crown Shapes of Urban Trees

The results of the logistic regression analysis of the dependencies of the crown shapes on tree species, dbh and distance level can be seen in Table 6.
The results of Table 6 are in line with the observed distribution of crown shapes. For most tree crown shapes a significant relationship to dbh and distance to objects was calculated, even if in different levels; the direction of the effect caused by an increase of age and/or distance level varied strongly. For example, with increasing dbh a positive effect on cylindrical, spherical and half-ellipsoid crown shape exists. For each year of increase, a 4.8% lower probability of ovoid crowns occurring can be seen. The direction of the effects for distance to objects also showed different results depending on the observed shape. A bigger distance to objects showed a significant effect with a positive sign for half-ellipsoid and spherical crowns. In contrast, for ovoid shaped crowns the effect is negative and highly significant, but clearly smaller (−67.34% vs. 208.32%). This is consistent with the results of Figure 7, where more ovoid trees were observed at a distance less than the tree height.
For the different tree species and their relationships to crown shape, we recognize for R. pseudoacacia a seven times higher probability of observing cylindrical crowns than for the reference species A. platanoides. All other species show lower probabilities. For the half-ellipsoid shape, a strong presence of A. hippocastanum was visible with a 13 times higher probability compared with the reference species. Moreover, as shown in Figure 8, T. cordata and A. platanoides were the species with the highest probability of ovoid shaped crowns, in particular T. cordata (2.6 times higher than A. platanoides).

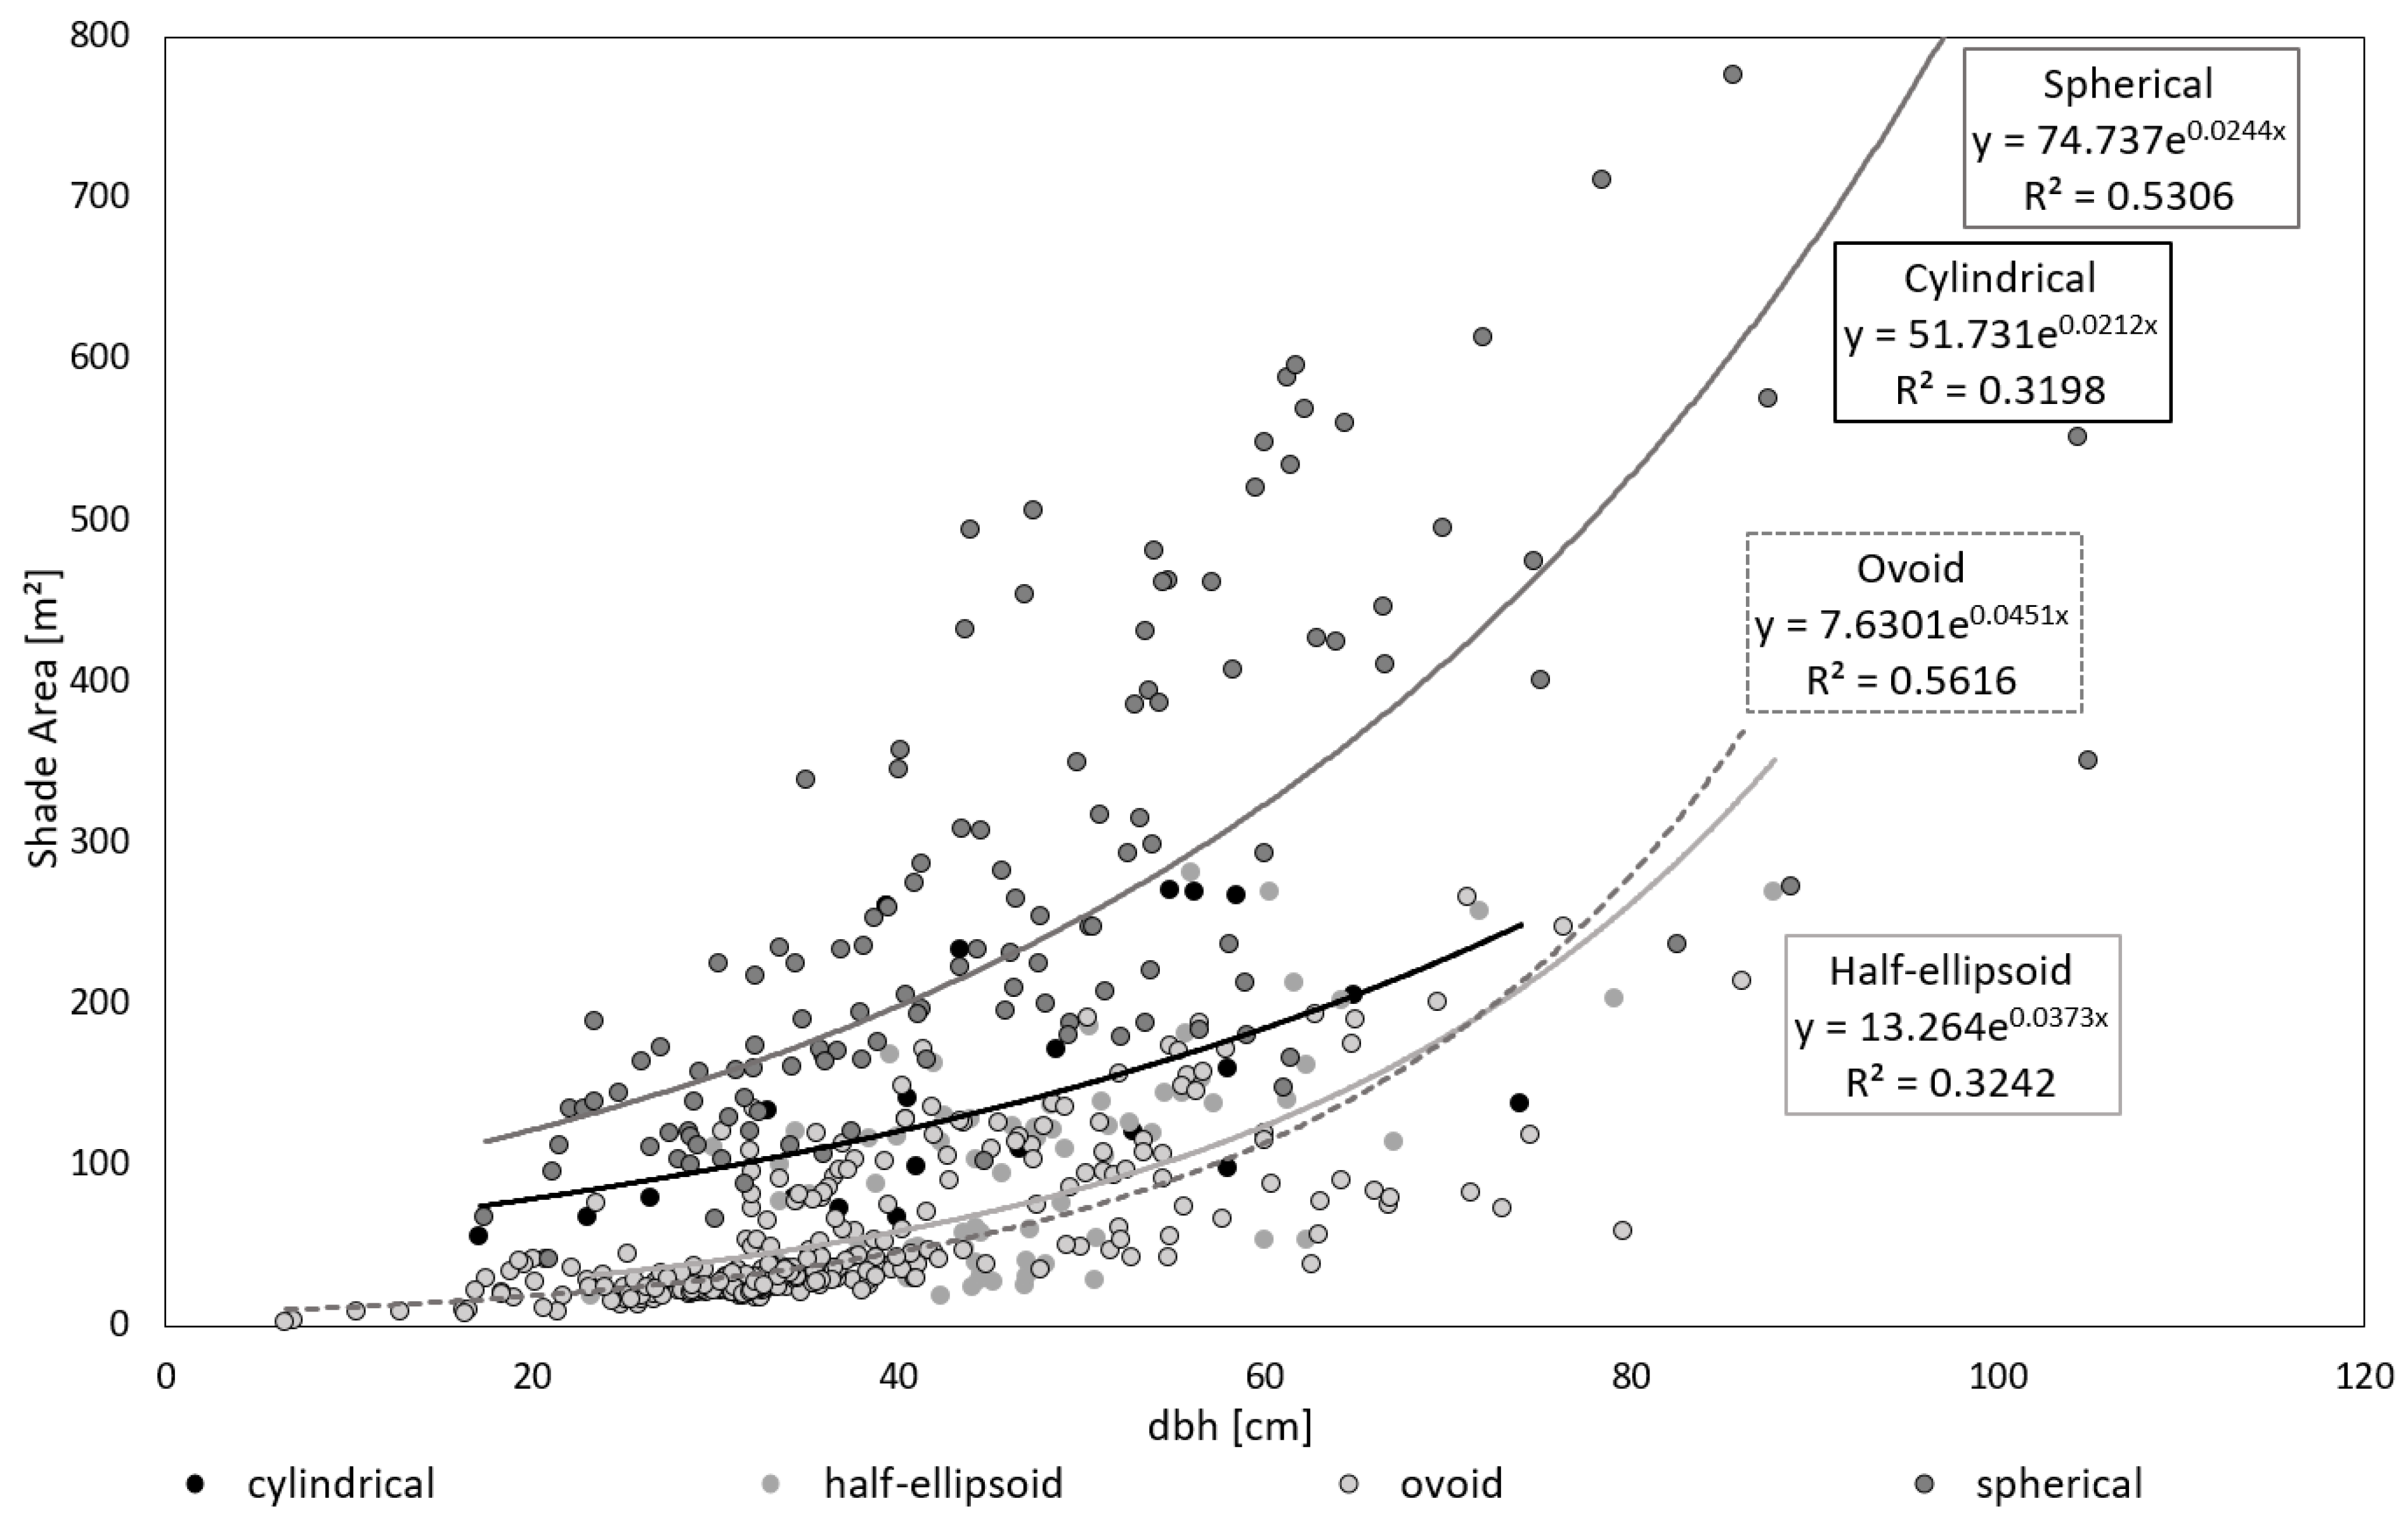
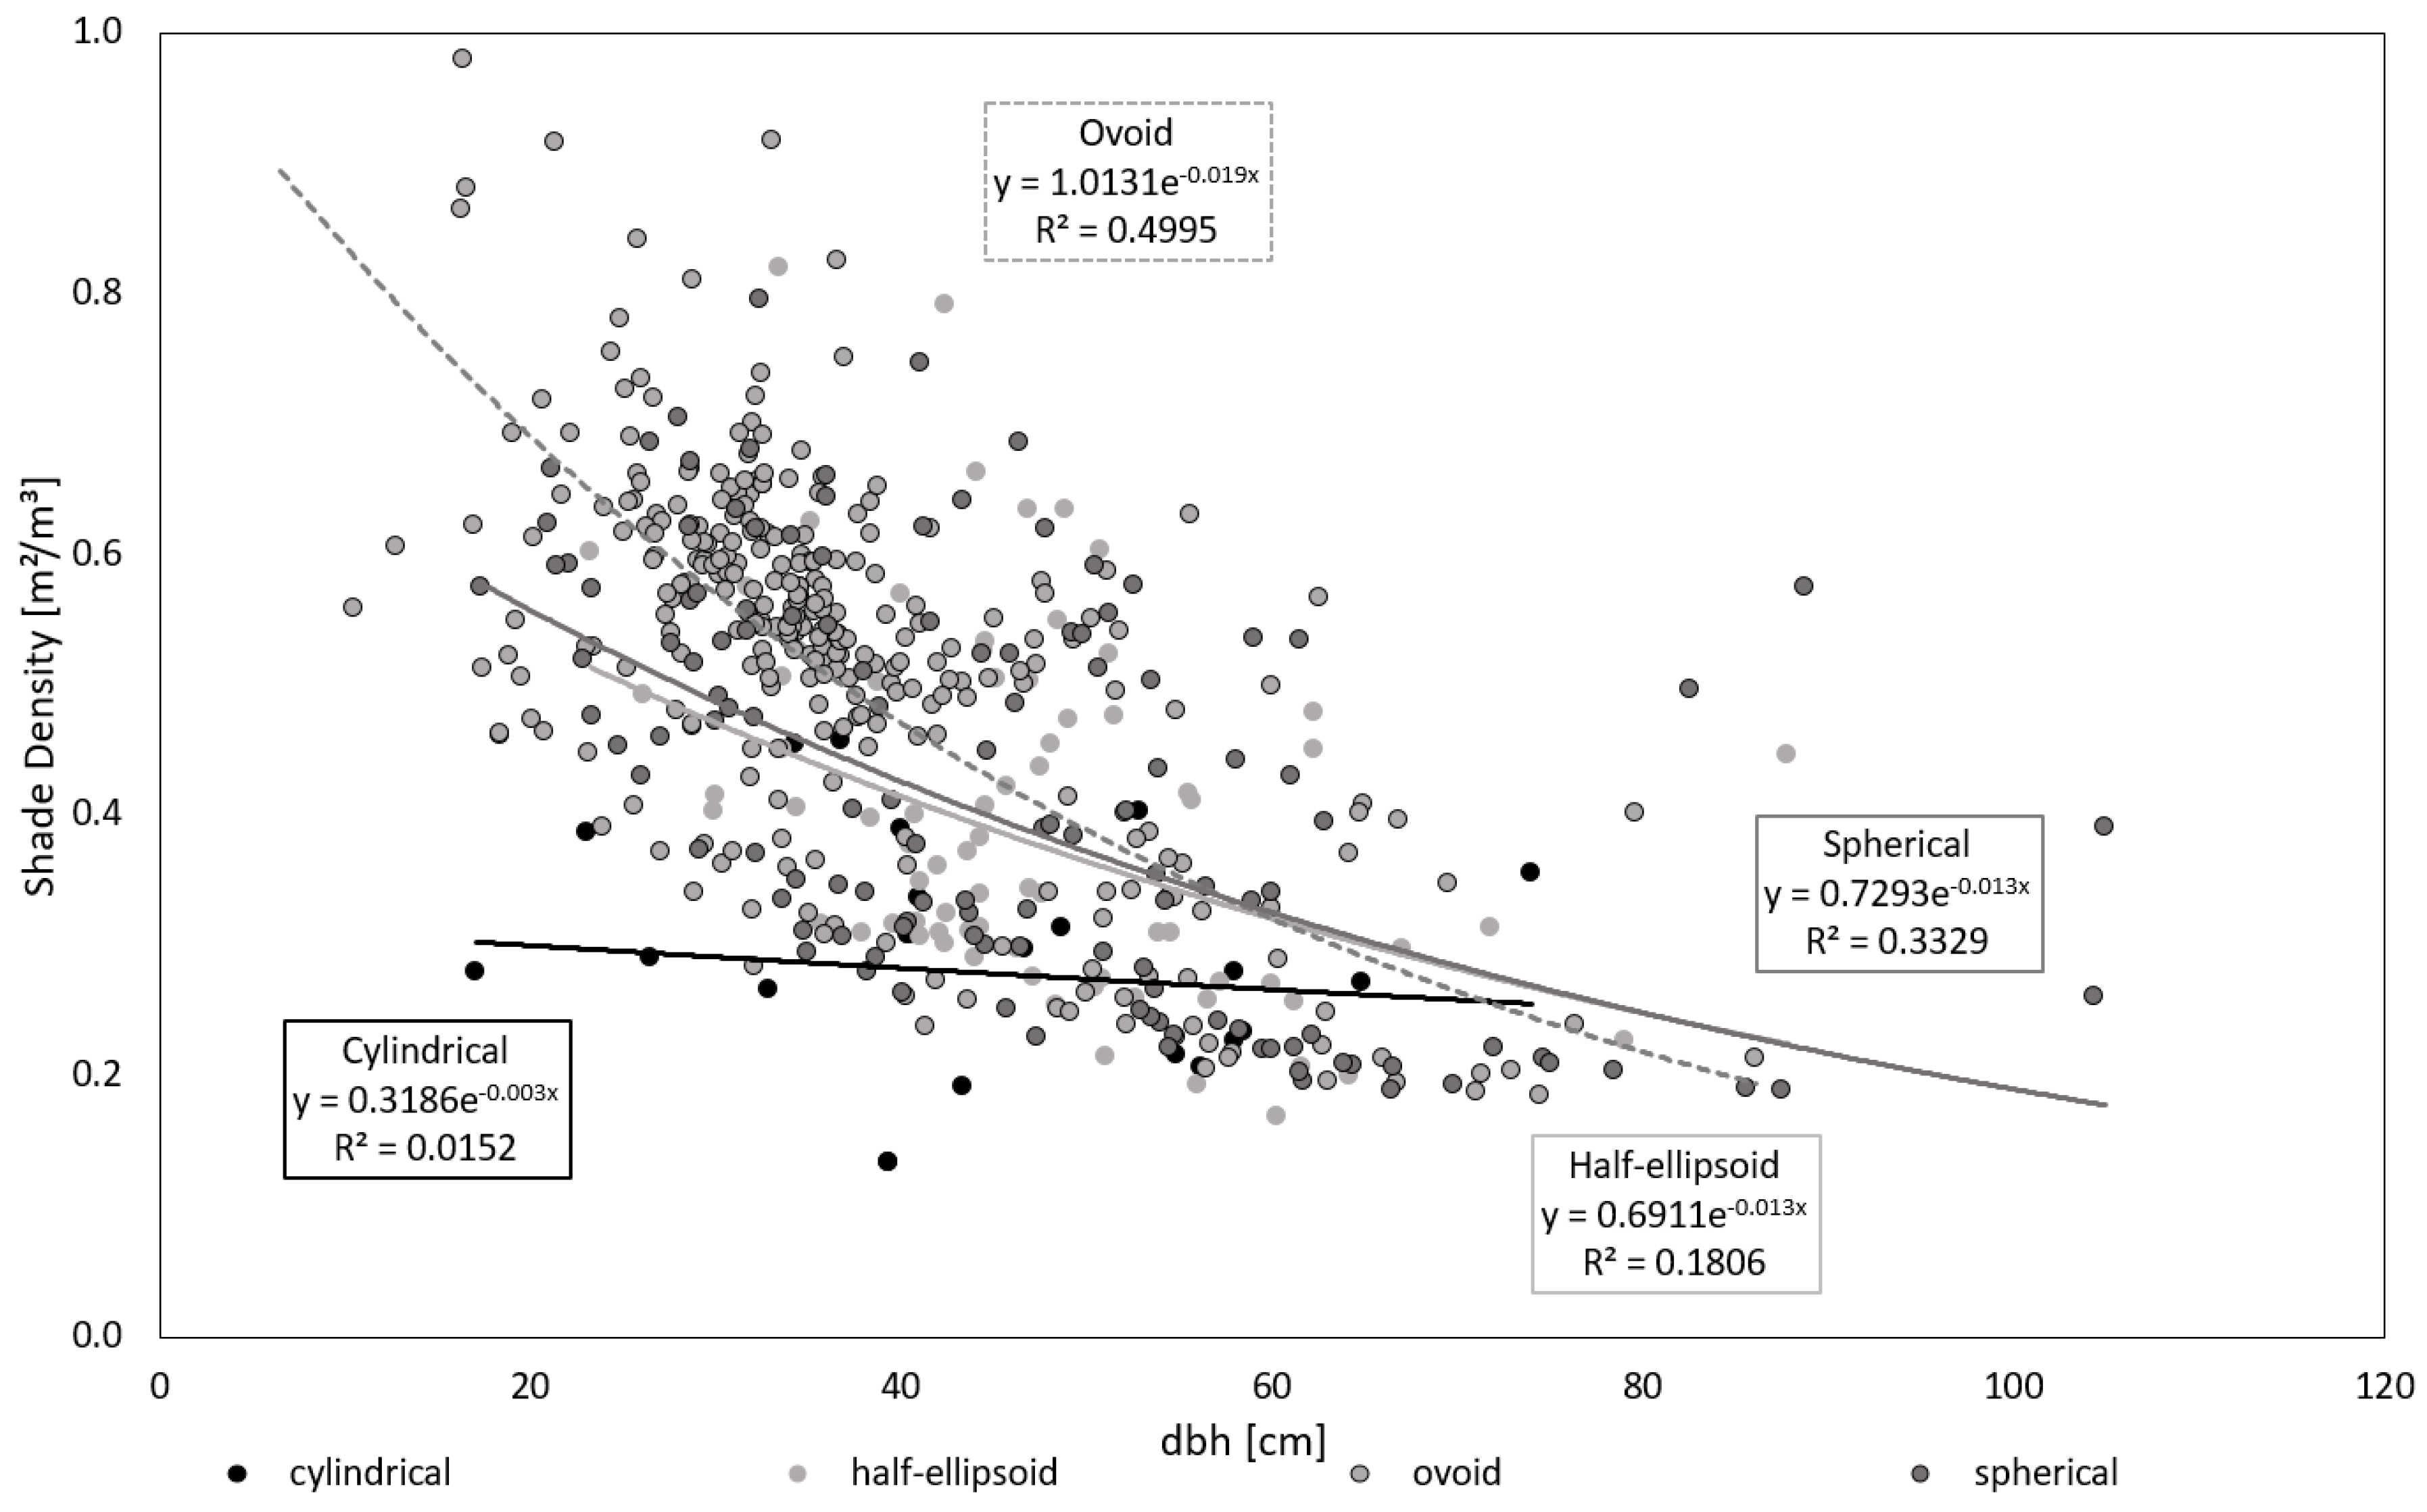
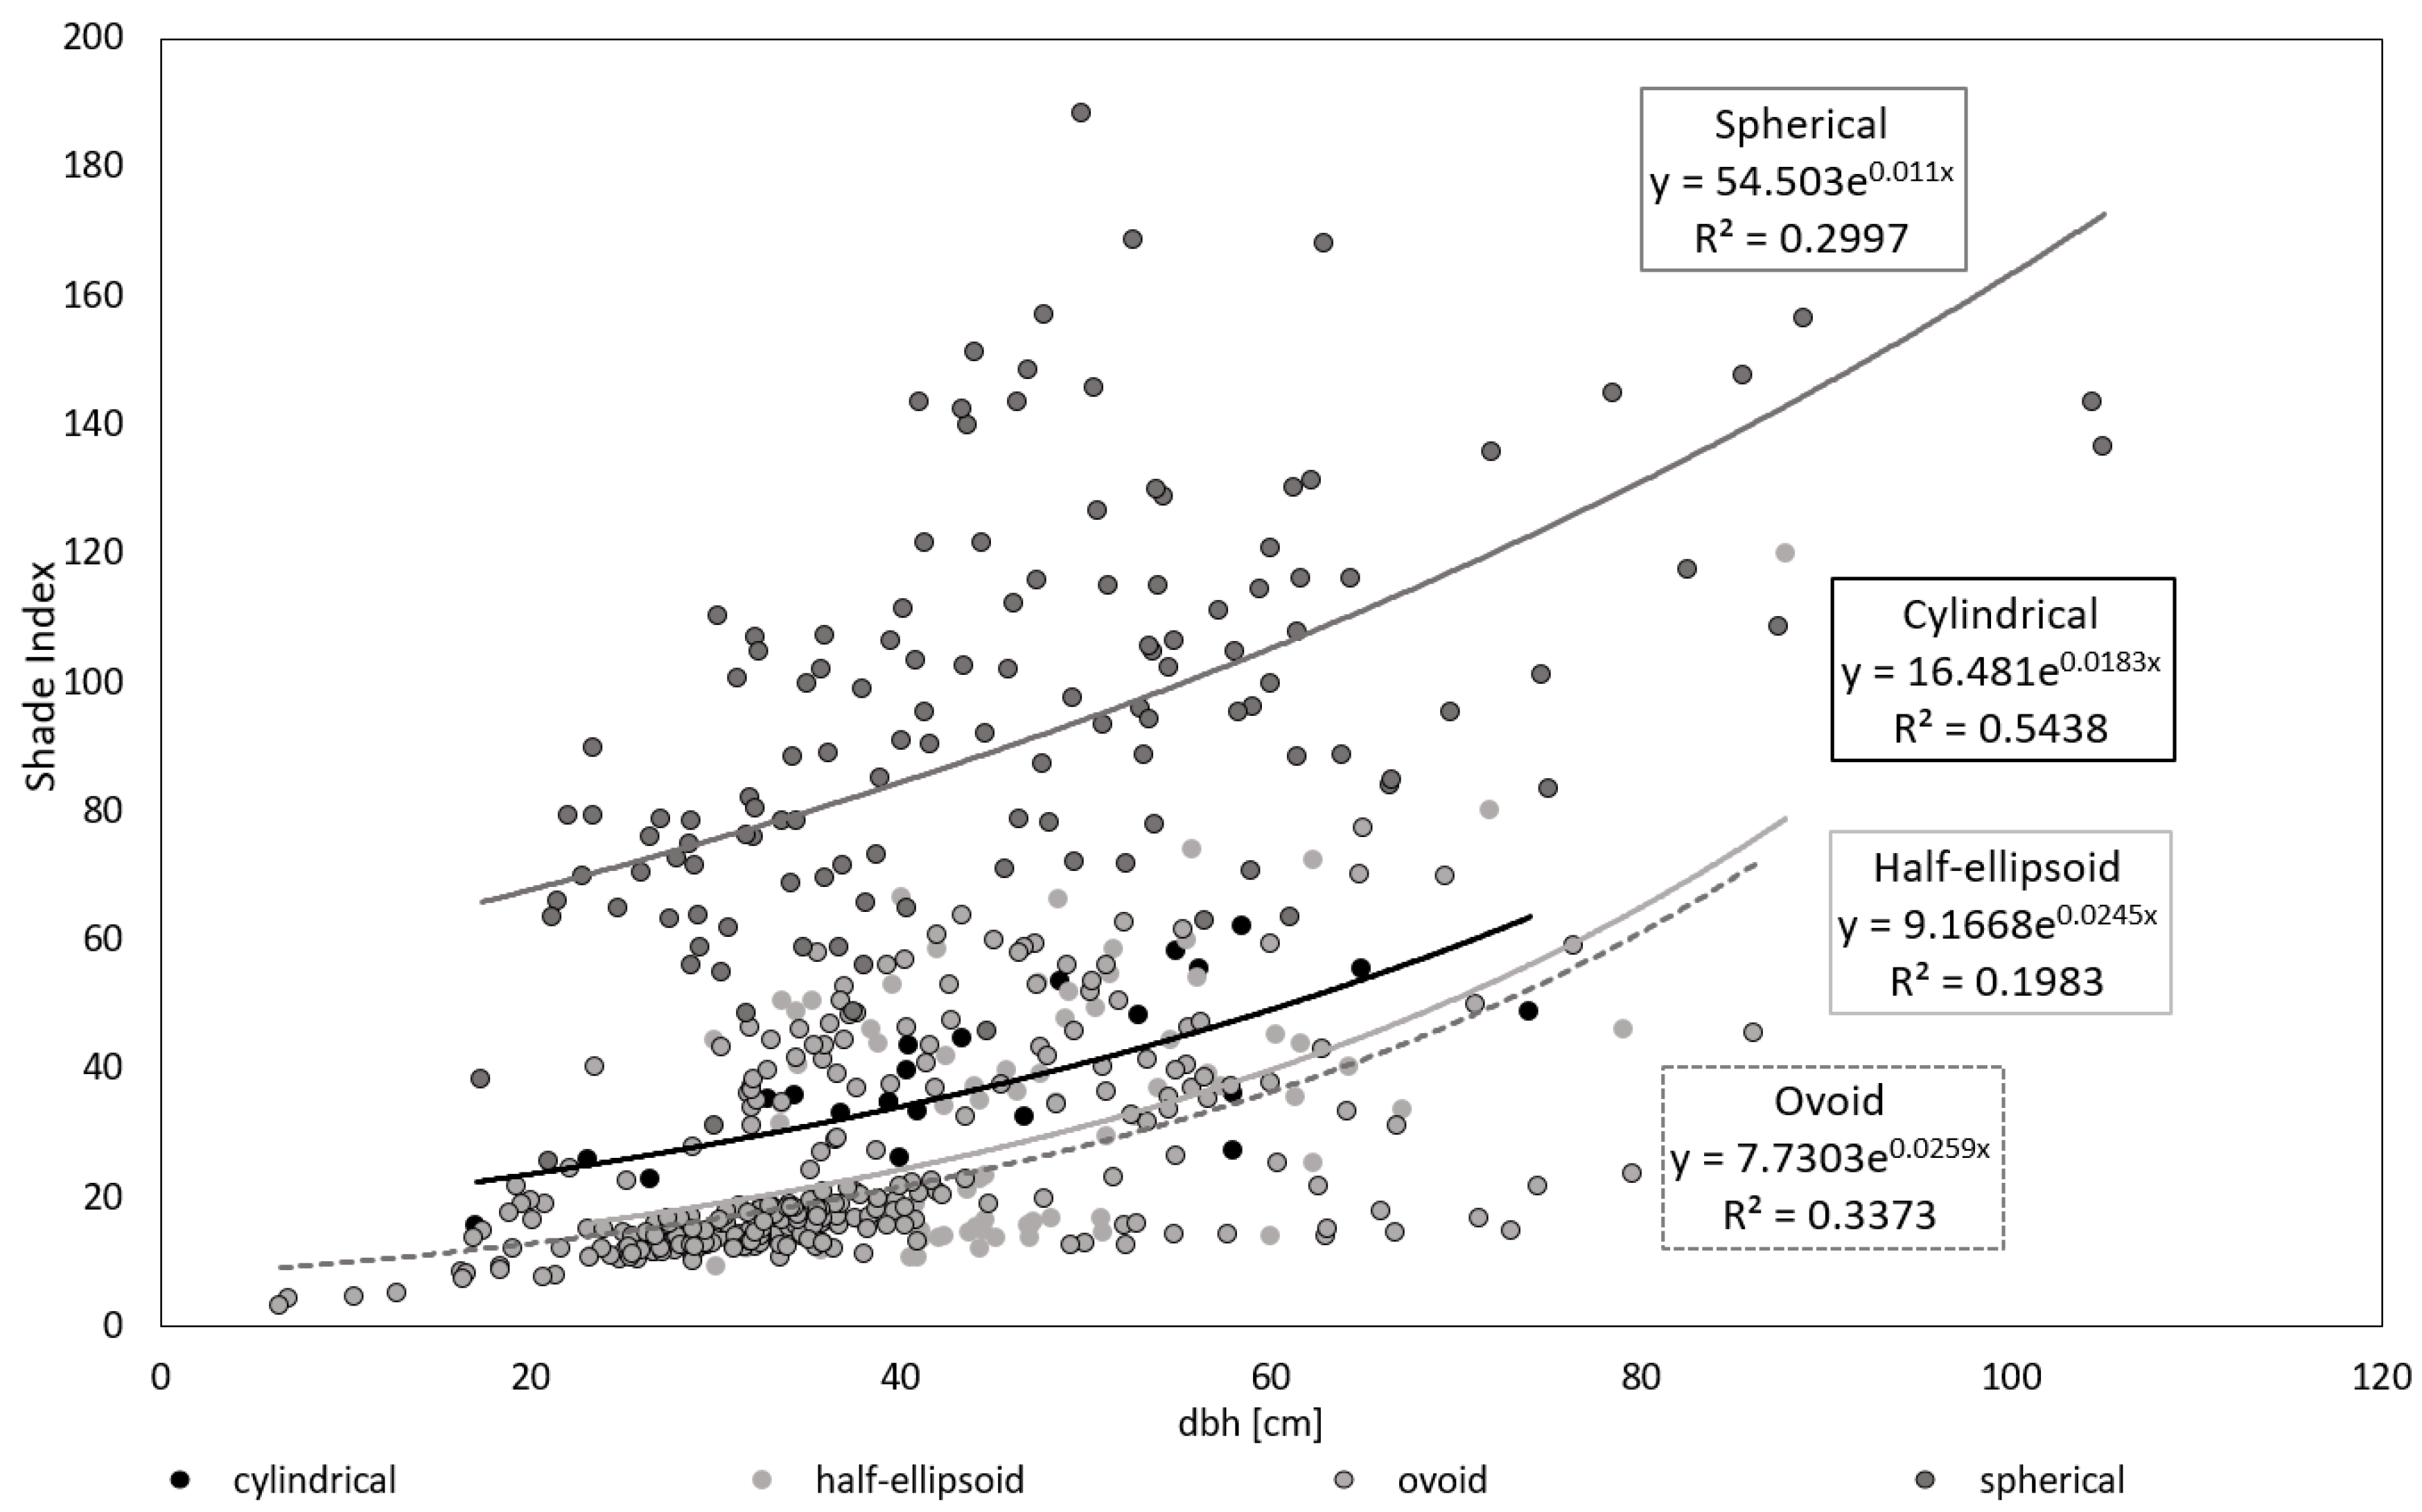
3.6. Influence of Crown Shape on the Shade Area and the Shade Density

Resolving the exponential equations for the natural logarithm, an increase of 10% in dbh (x) resulted in an increase of the shade area of 0.43% for ovoid shaped crowns and 0.36% for the half-ellipsoid shape. The shade area for cylindrical shaped crowns did not increase strongly with age (0.2% per 10% increase in stem diameter) (see Figure 9). In contrast, the shade density of the trees showed almost reverse patterns for the different crown forms depending on dbh (Figure 10), with decreasing shade density for every species and the lowest decrease for the cylindrical shape (−0.03% per 10% increase in stem diameter). For example, a tree measuring 60 cm dbh with a spherical shape has a mean shade area of 323.1 m², while a cylindrical shaped tree has a mean shade area of 184.6 m². A tree with a half ellipsoidal or an ovoid crown, in contrast, has a smaller mean shade area, respectively, of 124.3 m² and 114.2 m². Smaller trees, measuring 40 cm dbh, also show for the spherical and cylindrical crown the highest shade area values (198.3 m² and 120.8 m²).
Old trees (age > 80) presented ca. 30% to 44% lower shade density than young trees (age < 40), with the highest reduction for ovoid and half-ellipsoid. At the same time, ovoid as well as spherical shaped tree crowns were the densest, with an average shade density of 0.52 m²/m³ and 0.42 m²/m³, respectively. For a tree with a dbh of 60 cm, the shade density is 0.27 m²/m³ for a cylindrical crown shape, 0.32 m²/m³ for an ovoid and half-ellipsoid and 0.33 m²/m³ for a spherical crown shape. For smaller trees, e.g., with a dbh of 40 cm, the highest shade density is shown by the ovoid (0.47 m²/m³) and spherical (0.43 m²/m³) crown shapes.
The shade index showed a trend of different levels between crown shapes (Figure 11) similar to Figure 9, with the highest values for spherical and cylindrical crowns having the highest intercepts. At the same time, the highest increment in shade index was shown for the ovoid shape with an increase of 0.25% per 10% increase of dbh. Differently than for the two precedent figures, we noticed the highest R² value for the dependency of the shade index from tree stem diameter for cylindrical-shaped trees (R² = 0.54). For the crown shape half-ellipsoid, the dbh impact was the lowest with an R² value of 0.19. For a tree with a dbh of 60 cm, this results in shade indices of 105.5 for spherical and 49.4 for cylindrical crown shape and in smaller shade indices for the half-ellipsoid and ovoid (39.9 and 36.6) shapes.

4. Discussion

The results of this study show the diversity of tree crown dimensions in urban environments in central Europe and possible calculation methods of crown volume and derived ecosystem services. While in the first part we analyzed the development of crown dimensions in dependence on dbh for seven common species, later we analyzed in more depth the effect of different crown shapes on the crown volume and resulting shading parameters. Furthermore, a possible dependency of the crown shape of different tree species on the proximity to neighboring objects was discussed.
The importance of the specific estimation of required space for tree crowns in an urban setting was shown by Pretzsch et al., (2015) [18], who quantified species-specific crown size and its allometry. Our aim was to show the importance of crown shapes for crown volume calculations, to reveal the dependence on tree species, tree dbh and local environment and to quantify effects on ecosystem services, i.e., on the shading effect of urban trees.
This study offers a simple method that can be used in field measurements and be implemented in urban tree models that aim to estimate ecosystem services of urban trees. We are aware that this method cannot offer an analysis linked to growth development without the use of repeated measurements. Moreover, a broader data basis is needed to be able to examine the influence of the climate in the cities on the development of the tree crown shape in more detail. In addition to the classical and simple method of the visual classification of tree crowns as used by us, terrestrial laser scanning (TLS) has been applied more frequently in recent years and also in the field of urban forestry (e.g., [35,54]). The reasons are cheaper and more mobile devices as well as a meanwhile available easy-to-use evaluation software and powerful computers. This method allows, for example, accurate estimation and quantification of individual crown dimensions and structures [55,56]. However, recording a high number of crown shapes—as required for this study—of different tree species of different ages in different locations in several cities using TLS is still very time consuming and costly in contrast to classical observation.

4.1. Influence of the Crown Shape on the Structure and Dimensions of Urban Tree Species

Our results showed ovoid and spherical crown shapes being the most common (Figure 4). This was in line with previous research [20,50,51] reassumed for different species in Table 4. A change of crown shape at different dbh classes could not be seen for most of the species, which could be explained by the small number of small trees. Only for P. × acerifolia a shift from ovoid to spherical as the prevalent shape was shown with increasing dbh. As Troxel et al., [57] state, the physical dimensions of trees are often highly correlated, but the patterns of growth for individuals of the same species (over time) can vary depending on tree species and site conditions [58].
In several studies, crown volume (cv) is calculated for cylindrical shaped crowns [22,53,57] as well as in urban tree growth models like CityTree [29]. A development into a cylindrical crown shape was linked to light competition that leads to the allocation of biomass in shoots and therefore the tree grows taller [23]. Moreover, obstructions like other close-growing trees, buildings and pruning for traffic safety can result in more dense cylindrical crown shapes. This is also discussed in the following Section 4.2.
However, for single-standing trees the assumption of cylindrical shaped crowns can result in clear under- or overestimation of the real value. For example, for a tree with cr of 4 m, cl 10 m long and a spherical crown, a cylindrical calculation for its cv would result in a crown volume equal to 1.87 times the actual value (87% overestimation), whereas for the same tree dimensions and an ovoid crown the overestimation would be around 67% (1.67 times the actual value). Assuming that a tree with a pyramidal crown shape resembles a cylinder, the actual crown volume and ecosystem services would always be greatly overestimated as the cv for pyramidal crown (cone) is equal to one third of the cylindrical one (see formula for pyramidal shape in Figure 2).

4.2. Influence of the Local Environment on the Crown Shape

Most tree species showed one or two prevalent crown shapes that do not change in relation to the distance to close objects, but instead remain characteristic for the species. An exception is represented by R. pseudoacacia, which preferred the cylindrical crown shapes for growing situations with smaller distances to objects like narrow street canyons, where long-elongated crowns permit to escape shading objects. P. × acerifolia, another light-demanding species like R. pseudoacacia, also invested in slightly more elongated crowns on an ovoid shape for small distances and extended its branches into a spherical shape when more space is available. As Troxel et al., [57] state, light-demanding tree species might have weaker dbh–cv relations due to being more susceptible in their growth to their surrounding environment. On the contrary, the shade tolerant tree species seemed to show a more stable crown shape distribution, independent from the distance to objects. This would suggest that the influence of close objects is more or less relevant depending on the tree species character.

4.3. Effects of the Crown Shape/Crown Volume on Ecosystem Services (Shading)

Depending on the analyzed sample and tree species, we recognized different trends and effects of the relationship between crown shape and cooling potential by shading. In terms of shade provision, two important considerations are the shade area and the shade density. The shade area for a taller crown is usually higher, in particular during the mornings and the evenings when the sun is at a lower angle [59], as can be seen for the case of the cylindrical crown in Figure 9. However, the higher shade area from taller crowns comes at the cost of reduced shade density as shown in Figure 10. Shade density is especially important for surface temperature reduction and human thermal comfort [4,60,61]; thus, trees with an ovoid crown shade a specific point on the ground for longer. Similarly, higher canopy density is important in providing higher evapotranspiration cooling [22].
Considering the findings of the insignificant effect of local surroundings over the genetic constituents of species characteristics, it is important to choose species strategically when planting in narrow street canyons or wider avenues to optimize the cooling benefits. It is best to plant trees with broader and denser canopies to maximize the cool “refuge” effect for the city dwellers during hot days. However, the context of underlying surfaces such as higher radiation through light canopies for expediting evapotranspiration from grass lawns [62] or narrow street canyon conditions where light demanding species protrude towards light sources should be taken into consideration.

5. Conclusions

This study answered different questions regarding the crown structure development of seven common urban tree species, crown shape distribution and its link with dbh as well as with the local environment. Additionally, the influence of the crown shape on the crown volume calculation and the resulting differences in shade area and shade density of urban trees were shown. The diverging results depending on the tree crown shapes confirm the need for more specific crown volume assessment methods in urban forestry to better estimate ecosystem services of different tree species.
Species-specific trends for the development of crown dimensions were observed. For all species, the relationship of crown radius and length with tree stem diameter was highly significant, showing dbh as a suitable parameter to predict crown dimension development.
The cylindrical shape, often used in urban tree growth models, was the least observed within this urban sample. Instead, the ovoid and spherical shapes were the prevalent shapes independent of tree species. The highest percentage of cylindrical crowns was found for R. pseudoacacia. This light-demanding species responded to the proximity of shading objects with the development of more elongated shapes, while expanding into spherical crowns when more space was available. The influence of nearby buildings was not recognized for the shade tolerant species T. cordata and A. platanoides. Considering possible reactions of crown development due to different light sensibilities of the tree species could improve green space planning in the varying urban structures and surroundings.
Applying crown shape-specific equations to calculate a tree’s crown volume result in more realistic values if only the formula for cylindrical crown shapes is used. According to our study sample, the smallest slope and increase of crown volume with increasing stem diameter was shown for the half-ellipsoid and the cylindrical shape, while the highest increase is recorded for the ovoid and the spherical shape.
Tree crowns with the highest shade area values presented a spherical and a cylindrical shape, with spherical crowns also showing high shade densities (along with ovoid shaped crowns) and shade index. Shade area increased with dbh most strongly for ovoid tree crowns, while cylindrical crowns showed the least decrease of shade density with stem growth. Consideration of ecosystem services such as cooling by shading in urban landscape planning purposes can be improved by applying shape-specific calculations for shade area extension and shade density.
Our findings showed clear over estimations of crown volume (i.e., up to two or three times the actual value depending on the crown shape) when relying on cylindrical shape based calculations, as often applied in urban tree growth models. The methodological approach for this study was chosen as a simple readily available but extensive fast method to be used in field measurements, where TLS scans can hardly be realized. The visual categorization of crown shapes based on reference figures offers a fast, cheap and easy-to-use possibility of obtaining an improved estimation of the crown volume of trees and of deriving ecosystem services that are dependent on the crown shape (e.g., shade area or cooling potential). In the future, however, terrestrial laser scanning may be used more and more, especially if the devices become cheaper and more mobile and easy-to-use analysis software is available.

Author Contributions

Conceptualization, E.F. and T.R.; Methodology, E.F., T.R. and M.A.R.; Formal Analysis, E.F.; Writing–Original Draft Preparation, E.F.; Writing–Review and Editing, E.F., T.R., A.M.-R., M.A.R., H.P. and S.P.; Visualization, E.F.; Supervision, T.R.; Project Administration, T.R., H.P. and S.P.; Funding Acquisition, T.R., H.P., M.A.R. and S.P. All authors have read and agreed to the published version of the manuscript.

Funding

This research was funded by the German Science Foundation (Deutsche Forschungsgemeinschaft), grant number PR 292/21−1 and PA 2626/3−1 and by the Bavarian State Ministry of the Environment and Consumer Protection, grant numbers TUF01UF−64971 and TLK01UFuE69397.

Data Availability Statement

The data are available on request from the corresponding author.

Acknowledgments

We like to thank the DFG for funding the project “Impact of trees on the urban microclimate under climate change: Mechanisms and ecosystem services of urban tree species in temperate, Mediterranean and arid major cities” as well as the Bavarian State Ministry of the Environment and Consumer Protection for funding the project “Urban trees under climate change I + II: their growth, environmental performance, and perspectives” in the frame of the Centre for Urban Ecology and Climate Adaptation. The authors want to thank the municipalities of the cities for the permit to measure urban trees. Thanks also to Martin Honold, Nayanesh Pattnaik and Anna Wenig for their help during the field work.

Conflicts of Interest

The authors declare no conflict of interest.

References

  1. Oke, T.R. The micrometeorology of the urban forest. Phil. Trans. R. Soc. Lond. B 1989, 324, 335–349. [Google Scholar] [CrossRef]
  2. Wolf, K.L.; Lam, S.T.; McKeen, J.K.; Richardson, G.R.A.; van den Bosch, M.; Bardekjian, A.C. Urban Trees and Human Health: A Scoping Review. Int. J. Environ. Res. Public Health 2020, 17, 4371. [Google Scholar] [CrossRef] [PubMed]
  3. Tzoulas, K.; Korpela, K.; Venn, S.; Yli-Pelkonen, V.; Kaźmierczak, A.; Niemela, J.; James, P. Promoting ecosystem and human health in urban areas using Green Infrastructure: A literature review. Landsc. Urban Plan. 2007, 81, 167–178. [Google Scholar] [CrossRef]
  4. Rahman, M.A.; Stratopoulos, L.M.; Moser-Reischl, A.; Zölch, T.; Häberle, K.-H.; Rötzer, T.; Pretzsch, H.; Pauleit, S. Traits of trees for cooling urban heat islands: A meta-analysis. Build. Environ. 2020, 170, 106606. [Google Scholar] [CrossRef]
  5. Rahman, M.A.; Dervishi, V.; Moser-Reischl, A.; Ludwig, F.; Pretzsch, H.; Rötzer, T.; Pauleit, S. Comparative analysis of shade and underlying surfaces on cooling effect. Urban For. Urban Green. 2021, 63, 127223. [Google Scholar] [CrossRef]
  6. Rahman, M.A.; Moser, A.; Rötzer, T.; Pauleit, S. Within canopy temperature differences and cooling ability of Tilia cordata trees grown in urban conditions. Build. Environ. 2017, 114, 118–128. [Google Scholar] [CrossRef]
  7. Peters, E.B.; McFadden, J.P.; Montgomery, R.A. Biological and environmental controls on tree transpiration in a suburban landscape. J. Geophys. Res. 2010, 115. [Google Scholar] [CrossRef]
  8. Armson, D.; Stringer, P.; Ennos, A.R. The effect of tree shade and grass on surface and globe temperatures in an urban area. Urban For. Urban Green. 2012, 11, 245–255. [Google Scholar] [CrossRef]
  9. Gillner, S.; Vogt, J.; Tharang, A.; Dettmann, S.; Roloff, A. Role of street trees in mitigating effects of heat and drought at highly sealed urban sites. Landsc. Urban Plan. 2015, 143, 33–42. [Google Scholar] [CrossRef]
  10. Rahman, M.A.; Moser, A.; Rötzer, T.; Pauleit, S. Microclimatic differences and their influence on transpirational cooling of Tilia cordata in two contrasting street canyons in Munich, Germany. Agric. For. Meteorol. 2017, 232, 443–456. [Google Scholar] [CrossRef]
  11. Gill, S.; Handley, J.; Ennos, A.; Pauleit, S. Adapting Cities for Climate Change: The Role of the Green Infrastructure. Built Environ. 2007, 33, 115–133. [Google Scholar] [CrossRef]
  12. Rötzer, T.; Moser-Reischl, A.; Rahman, M.A.; Grote, R.; Pauleit, S.; Pretzsch, H. Modelling Urban Tree Growth and Ecosystem Services: Review and Perspectives. In Progress in Botany Vol. 82; Cánovas, F.M., Lüttge, U., Risueño, M.-C., Pretzsch, H., Eds.; Springer International Publishing: Cham, Switzerland, 2021; pp. 405–464. ISBN 978-3-030-68619-2. [Google Scholar]
  13. Grote, R.; Samson, R.; Alonso, R.; Amorim, J.H.; Cariñanos, P.; Churkina, G.; Fares, S.; Le Thiec, D.; Niinemets, Ü.; Mikkelsen, T.N.; et al. Functional traits of urban trees: Air pollution mitigation potential. Front Ecol. Environ. 2016, 14, 543–550. [Google Scholar] [CrossRef]
  14. Nowak, D.J.; Crane, D.E.; Stevens, J.C. Air pollution removal by urban trees and shrubs in the United States. Urban For. Urban Green. 2006, 4, 115–123. [Google Scholar] [CrossRef]
  15. Yu, C.; Hien, W.N. Thermal benefits of city parks. Energy Build. 2006, 38, 105–120. [Google Scholar] [CrossRef]
  16. Bowler, D.E.; Buyung-Ali, L.; Knight, T.M.; Pullin, A.S. Urban greening to cool towns and cities: A systematic review of the empirical evidence. Landsc. Urban Plan. 2010, 97, 147–155. [Google Scholar] [CrossRef]
  17. Shahidan, M.; Jones, P. Plant Canopy Design in Modifying Urban Thermal Environment: Theory and Guidelines. In Proceedings of the 25th Conference on Passive and Low Energy Architecture, Dublin, Ireland, 22–24 October 2008. [Google Scholar]
  18. Pretzsch, H.; Biber, P.; Uhl, E.; Dahlhausen, J.; Rötzer, T.; Caldentey, J.; Koike, T.; van Con, T.; Chavanne, A.; Seifert, T.; et al. Crown size and growing space requirement of common tree species in urban centres, parks, and forests. Urban For. Urban Green. 2015, 14, 466–479. [Google Scholar] [CrossRef]
  19. Gratani, L.; Varone, L. Carbon sequestration by Quercus ilex L. and Quercus pubescens Willd. and their contribution to decreasing air temperature in Rome. Urban Ecosyst 2006, 9, 27–37. [Google Scholar] [CrossRef]
  20. Baptista, M.D.; Livesley, S.J.; Parmehr, E.G.; Neave, M.; Amati, M. Variation in leaf area density drives the rainfall storage capacity of individual urban tree species. Hydrol. Processes 2018, 32, 3729–3740. [Google Scholar] [CrossRef]
  21. Zhu, Z.; Kleinn, C.; Nölke, N. Assessing tree crown volume—A review. For. Int. J. For. Res. 2021, 94, 18–35. [Google Scholar] [CrossRef]
  22. Rahman, M.A.; Armson, D.; Ennos, A.R. A comparison of the growth and cooling effectiveness of five commonly planted urban tree species. Urban Ecosyst 2015, 18, 371–389. [Google Scholar] [CrossRef]
  23. Poorter, H.; Niklas, K.J.; Reich, P.B.; Oleksyn, J.; Poot, P.; Mommer, L. Biomass allocation to leaves, stems and roots: Meta-analyses of interspecific variation and environmental control. New Phytol. 2012, 193, 30–50. [Google Scholar] [CrossRef] [PubMed]
  24. GALK Straßenbaumliste. Available online: https://www.galk.de/arbeitskreise/stadtbaeume/themenuebersicht/strassenbaumliste (accessed on 16 December 2021).
  25. Pretzsch, H. Zur Analyse der räumlichen Bestandesstruktur und der Wuchskonstellation von Einzelbäumen. Forst Und Holz 1992, 47, 408–418. [Google Scholar]
  26. Pretzsch, H. Analysis and modeling of spatial stand structures. Methodological considerations based on mixed beech-larch stands in Lower Saxony. For. Ecol. Manag. 1997, 97, 237–253. [Google Scholar] [CrossRef]
  27. Pretzsch, H.; Biber, P.; Ďurský, J. The single tree-based stand simulator SILVA: Construction, application and evaluation. For. Ecol. Manag. 2002, 162, 3–21. [Google Scholar] [CrossRef]
  28. Nowak, D.; Crane, D.; Stevens, J.; Hoehn, R.; Walton, J.; Bond, J. A Ground-Based Method of Assessing Urban Forest Structure and Ecosystem Services. AUF 2008, 34, 347–358. [Google Scholar] [CrossRef]
  29. Rötzer, T.; Rahman, M.A.; Moser-Reischl, A.; Pauleit, S.; Pretzsch, H. Process based simulation of tree growth and ecosystem services of urban trees under present and future climate conditions. Sci. Total Environ. 2019, 676, 651–664. [Google Scholar] [CrossRef]
  30. Deutscher Wetterdienst–Climate Data Center. Available online: https://cdc.dwd.de/portal/ (accessed on 16 December 2021).
  31. DIVA-GIS. Available online: http://www.diva-gis.org/gdata (accessed on 2 March 2022).
  32. Georgi, L.; Kunz, M.; Fichtner, A.; Reich, K.F.; Bienert, A.; Maas, H.-G.; von Oheimb, G. Effects of local neighbourhood diversity on crown structure and productivity of individual trees in mature mixed-species forests. For. Ecosyst. 2021, 8, 26. [Google Scholar] [CrossRef]
  33. Hasenauer, H. Dimensional relationships of open-grown trees in Austria. For. Ecol. Manag. 1997, 96, 197–206. [Google Scholar] [CrossRef]
  34. Moser-Reischl, A.; Rötzer, T.; Pauleit, S.; Pretzsch, H. Urban Tree Growth Characteristics of Four Common Species in South Germany. AUF 2021, 47, 150–169. [Google Scholar] [CrossRef]
  35. Moser, A.; Rötzer, T.; Pauleit, S.; Pretzsch, H. The Urban Environment Can Modify Drought Stress of Small-Leaved Lime (Tilia cordata Mill.) and Black Locust (Robinia pseudoacacia L.). Forests 2016, 7, 71. [Google Scholar] [CrossRef]
  36. Kükenbrink, D.; Gardi, O.; Morsdorf, F.; Thürig, E.; Schellenberger, A.; Mathys, L. Above-ground biomass references for urban trees from terrestrial laser scanning data. Ann. Bot. 2021, 128, 709–724. [Google Scholar] [CrossRef] [PubMed]
  37. Roloff, A. Bäume in der Stadt. Besonderheiten, Funktion, Nutzen, Arten, Risiken; Verlag Eugen Ulmer: Stuttgart, Germany, 2013. [Google Scholar]
  38. Niinemets, Ü.; Valladares, F. Tolerance to Shade, Drought, and Waterlogging of Temperate Northern Hemisphere Trees and Shrubs. Ecol. Monogr. 2006, 76, 521–547. [Google Scholar] [CrossRef]
  39. Pauleit, S.; Jones, N.; Garcia-Martin, G.; Garcia-Valdecantos, J.L.; Rivière, L.M.; Vidal-Beaudet, L.; Bodson, M.; Randrup, T.B. Tree establishment practice in towns and cities–Results from a European survey. Urban For. Urban Green. 2002, 1, 83–96. [Google Scholar] [CrossRef]
  40. Beck, P.; Caudullo, G.; Tinner, W.; de Rigo, D. Fraxinus Excelsior in Europe: Distribution, Habitat, Usage and Threats. In San-Miguel-Ayanz; de Rigo, D.J., Caudullo, G., Durrant, T.H., Mauri, A., Eds.; European Atlas of Forest Tree Species; Publish Office: Luxembourg, 2016. [Google Scholar]
  41. Larsen, F.; Kristoffersen, P. Tiliaߣs physical dimensions over time. J. Arboric. 2002, 28, 209–214. [Google Scholar] [CrossRef]
  42. Stoffberg, G.H.; van Rooyen, M.W.; van der Linde, M.J.; Groeneveld, H.T. Predicting the growth in tree height and crown size of three street tree species in the City of Tshwane, South Africa. Urban For. Urban Green. 2008, 7, 259–264. [Google Scholar] [CrossRef]
  43. Pretzsch, H. Grundlagen der Waldwachstumsforschung; Springer: Berlin/Heidelberg, Germany, 2019; ISBN 978-3-662-58154-4. [Google Scholar]
  44. Pretzsch, H. Forest Dynamics, Growth and Yield: From Measurement to Model; Springer: Berlin/Heidelberg, Germany, 2010; ISBN 978-3-540-88307-4. [Google Scholar]
  45. Moser-Reischl, A.; Uhl, E.; Rötzer, T.; Biber, P.; van Con, T.; Tan, N.T.; Pretzsch, H. Effects of the urban heat island and climate change on the growth of Khaya senegalensis in Hanoi, Vietnam. For. Ecosyst. 2018, 5, 37. [Google Scholar] [CrossRef]
  46. Herzog, M. Simulation of Growth and Ecosystem Services of Tree Species in Central European Cities under Present and Future Climate Conditions. Master Thesis, Technical University of Munich, Munich, Germany, 2021. [Google Scholar]
  47. Lukaszkiewicz, J.; Kosmala, M. Determining the Age of Streetside Trees with Diameter at Breast Height-based Multifactorial Model. AUF 2008, 34, 137–143. [Google Scholar] [CrossRef]
  48. Bühler, O.; Kristoffersen, P.; Larsen Søren Ugilt. Growth of Stree Trees in Copenhagen With Empphasis on the Effect of Different Establishment Concepts. Arboric. Urban For. 2007, 33, 330–337. [Google Scholar] [CrossRef]
  49. Dwyer, J.F. How old is that tree? Ill. Trees Q. Publ. Q. Publ. Illonis Arborist Assoc. 2009, 24, 13. [Google Scholar]
  50. Lawrence, E. The Illustrated Book of Trees and Shrubs; Octopus Books Limited: London, UK, 1985. [Google Scholar]
  51. baumportal.de: Baumportal–Alles über Bäume. Available online: baumportal.de (accessed on 2 March 2022).
  52. Pretzsch, H.; Matthew, C.; Dieler, J. Allometry of Tree Crown Structure. Relevance for Space Occupation at the Individual Plant Level and for Self-Thinning at the Stand Level. In Growth and Defence in Plants; Matyssek, R., Schnyder, H., Oßwald, W., Ernst, D., Munch, J.C., Pretzsch, H., Eds.; Springer: Berlin/Heidelber, Germany, 2012; pp. 287–310. ISBN 978-3-642-30644-0. [Google Scholar]
  53. Moser, A.; Rötzer, T.; Pauleit, S.; Pretzsch, H. Structure and ecosystem services of small-leaved lime (Tilia cordata Mill.) and black locust (Robinia pseudoacacia L.) in urban environments. Urban For. Urban Green. 2015, 14, 1110–1121. [Google Scholar] [CrossRef]
  54. Bayer, D.; Reischl, A.; Rötzer, T.; Pretzsch, H. Structural response of black locust (Robinia pseudoacacia L.) and small-leaved lime (Tilia cordata Mill.) to varying urban environments analyzed by terrestrial laser scanning: Implications for ecological functions and services. Urban For. Urban Green. 2018, 35, 129–138. [Google Scholar] [CrossRef]
  55. Jacobs, M.; Rais, A.; Pretzsch, H. How drought stress becomes visible upon detecting tree shape using terrestrial laser scanning (TLS). For. Ecol. Manag. 2021, 489, 118975. [Google Scholar] [CrossRef]
  56. Barbeito, I.; Dassot, M.; Bayer, D.; Collet, C.; Drössler, L.; Löf, M.; Del Rio, M.; Ruiz-Peinado, R.; Forrester, D.I.; Bravo-Oviedo, A.; et al. Terrestrial laser scanning reveals differences in crown structure of Fagus sylvatica in mixed vs. pure European forests. For. Ecol. Manag. 2017, 405, 381–390. [Google Scholar] [CrossRef]
  57. Troxel, B.; Piana, M.; Ashton, M.S.; Murphy-Dunning, C. Relationships between bole and crown size for young urban trees in the northeastern USA. Urban For. Urban Green. 2013, 12, 144–153. [Google Scholar] [CrossRef]
  58. Quigley, M.F. Street trees and rural conspecifics: Will long-lived trees reach full size in urban conditions? Urban Ecosyst 2004, 7, 29–39. [Google Scholar] [CrossRef]
  59. Armson, D.; Rahman, M.A.; Ennos, A. A comparison of the shading effectiveness of five different street tree species in Manchester, UK. Arboric. Urban For. 2013, 39, 157–164. [Google Scholar] [CrossRef]
  60. Lin, B.-S.; Lin, Y.-J. Cooling Effect of Shade Trees with Different Characteristics in a Subtropical Urban Park. Horts 2010, 45, 83–86. [Google Scholar] [CrossRef]
  61. Rahman, M.A.; Franceschi, E.; Pattnaik, N.; Moser-Reischl, A.; Hartmann, C.; Paeth, H.; Pretzsch, H.; Rötzer, T.; Pauleit, S. Spatial and temporal changes of outdoor thermal stress: Influence of urban land cover types. Sci. Rep. 2022, 12, 671. [Google Scholar] [CrossRef]
  62. Rahman, M.A.; Moser, A.; Rötzer, T.; Pauleit, S. Comparing the transpirational and shading effects of two contrasting urban tree species. Urban Ecosyst 2019, 22, 683–697. [Google Scholar] [CrossRef]
Figure 1. Positions of the eight cities in Germany and averages of annual air temperature and sum of precipitation for the period 1965–2015 (data source: DWD Climate Data Center [30]. Cartography realized with QGIS 3.10 Open Street Map and shapefile of Germany available online on DIVA-GIS [31]).
Forests 13 00748 g001
Figure 2. Mathematical equations for the calculation of crown volume, crown shade projection area and surface area for different crown shapes. Crown shapes illustrations from Lawrence, 1985 (Abbreviations as in text and cd— 2∙cr).
Forests 13 00748 g002
Figure 3. Crown radius and diameter at breast height relationship for seven common urban tree species.
Forests 13 00748 g003
Figure 4. Crown length and diameter at breast height relationship for seven common urban tree species.
Forests 13 00748 g004
Figure 5. Percentage distribution of crown shapes of all trees measured (left) and according to tree species (right).
Forests 13 00748 g005
Figure 6. Relationship of crown volume and dbh for the four different crown shapes. Graphs show all 258 trees. The mathematical constant e in the equations indicates the Euler’s number.
Forests 13 00748 g006
Figure 7. Percentage distribution of crown shapes of all trees for two distance classes of the closest object.
Forests 13 00748 g007
Figure 8. Percentage distribution of crown shapes for the different tree species for two distance classes of the closest object.
Forests 13 00748 g008
Figure 9. Dependency of shade area on dbh and crown shape. The mathematical constant e in the equations indicates the Euler’s number.
Forests 13 00748 g009
Figure 10. Dependency of shade density on tree dbh and crown shape. The mathematical constant e in the equations indicates the Euler’s number.
Forests 13 00748 g010
Figure 11. Dependency of shade index on tree dbh and crown shape. The mathematical constant e in the equations indicates the Euler’s number.
Forests 13 00748 g011
Table 1. Characteristics (means and standard deviation) of all measured trees. Abbreviations: n— number of samples, dbh— diameter at breast height.
Speciesndbh
[cm]
Height
[m]
Crown Radius
[m]
Crown Length
[m]
A. platanoides35637.5 ± 17.114.1 ± 5.04.6 ± 1.610.8 ± 4.6
A. pseudoplatanus24537.8 ± 14.115.6 ± 4.64.3 ± 1.211.9 ± 4.1
A. hippocastanum67650.5 ± 23.914.6 ± 4.74.9 ± 1.511.5 ± 4.3
F. excelsior24634.9 ± 18.414.3 ± 5.04.1 ± 1.610.5 ± 4.6
P. × acerifolia65942.4 ± 22.316.4 ± 5.25.8 ± 2.312.9 ± 5.1
R. pseudoacacia60538.7 ± 18.714.4 ± 4.64.5 ± 1.410.5 ± 3.9
T. cordata106537.1 ± 16.114.8 ± 4.64.3 ± 1.411.1 ± 4.2
Total = 3852
Table 2. Equations and parameters for the calculation of tree age for specific tree species. Sources of the formulas are indicated for every tree species; for R. pseudoacacia we applied the formula developed for Gleditschie by Dwyer (2009).
Tree SpeciesSourceFormula
A. platanoidesHerzog 2021 [46] a g e   y r s = 5.4256 + 1.5741   ·   d b h
A. pseudoplatanusHerzog 2021 [46] a g e   y r s = 9.3524 + 1.7587   ·   d b h
A. hippocastanumLukaszkiewicz and Kosmala 2008 [47]       a g e   y r s = a + e x p b + c   ×   d b h / 100 + d × h  
with   a = 54.2714 ,   b = 4.0709 ,   c = 0.7988 ,   d = 0.0209
F. excelsiorLukaszkiewicz and Kosmala 2008 [47] a g e   y r s = a + e x p b + c   ×   d b h / 100 + d × h
with   a = 210.115 ,   b = 5.3523 ,   c = 0.2655 ,   d = 0.0064
P. × acerifoliaBühler et al., 2007 [48] a g e   yrs = 0.996   ·   dbh
R. pseudoacaciaDwyer 2009 [49] a g e   yrs = 0.996   ·   dbh
T. cordataLukaszkiewicz and Kosmala 2008 [47] a g e yrs = a   +   exp b + c   · dbh 100 + d · h
with     a = 264.073 ,   b = 5.5834 ,   c = 0.3397 , d = 0.0026
Table 3. Number (n) of measured trees included in the crown shape analyses.
A. platanoidesA. hippocastanumP. × acerifoliaR. pseudoacaciaT. cordata
n91469865228
Table 4. Results of the transformed double-logarithmic equation detecting significance of changes in crown radius and crown length related to changes in dbh.
Crown Radius ln (cr) = a+bln (dbh)
A. platanoidesA. pseudoplatanusA. hippocastanumF. excelsiorP. × acerifoliaR. pseudoacaciaT. cordata
a−0.76−0.53−0.55−1.16−0.75−0.44−0.95
b0.630.540.540.720.670.530.67
0.690.460.680.830.730.630.72
p<0.001<0.001<0.001<0.001<0.001<0.001<0.001
Crown Length ln (cl) = a + b∙ln (dbh)
a−0.270.03−0.096−0.160.120.29−0.15
b0.730.670.650.710.650.560.71
0.670.510.650.730.760.580.64
p<0.001<0.001<0.001<0.001<0.001<0.001<0.001
Table 5. Observed distribution of different crown shapes according to species and age, n—number of observations.
Speciesn (%)Cylindrical
n (%)
Half-Ellipsoidal
n (%)
Ovoid
n (%)
Spherical
n (%)
A. platanoides91 (100)3 (3)14 (15)34 (38)40 (44)
dbh < 3021 (100)1 (5)1 (5)7 (33)12 (57)
dbh > 3070 (100)2 (3)13 (18)27 (39)28 (40)
A. hippocastanum46 (100)0 (0)26 (56)9 (20)11 (24)
dbh < 305 (100) 1 (20)2 (40)2 (40)
dbh > 3041 (100) 25 (61)7(17)9 (22)
P. × acerifolia98 (100)2 (2)4 (4)51 (52)41 (42)
dbh < 3018 (100)2 (3)0 (0)15 (83)3 (17)
dbh > 3080 (100) 4 (5)36 (45)38 (47)
R. pseudoacacia65 (100)16 (25)6 (9)18 (28)25 (38)
dbh < 307 (100)2 (29)1 (14)0 (0)4 (35)
dbh > 3058 (100)14 (24)5 (9)18 (31)21 (36)
T. cordata228 (100)2 (1)26 (12)190 (83)10 (4)
dbh < 3051 (100)2 (1)1 (2)50 (98)10 (6)
dbh > 30177 (100) 25 (14)140 (79)
Table 6. Dependency of the crown shape depending on tree species, dbh and distance level to objects. The used formula is (glm (crown shape)~dbh + as. factor (distance level) + as. factor (tree species)). The distance level 1 refers to the probability in comparison to the distance level with index 0. The reference tree species is A. platanoides, to which the tree species variable refers. p-value significance follows the RStudio output with “***” for p < 0.001, “**” for p < 0.01, “*” for p < 0.1 and “.” for p < 0.1.
VariableEstimatee (Estimate)Effect (%)p-Value
Cylindrical shape
Intercept−2.71 **
dbh0.0000371.000370.0367
distance level 1−0.8450.43−56.040.
tree species (A. hippocastanum)−15.520.00000018−99.999
tree species (P. × acerifolia)−0.5720.565−43.536
tree species (R. pseudoacacia)2.1548.616761.617**
tree species (T. cordata)−1.8730.154−84.628.
Half-ellipsoid shape
Intercept−4.659 ***
dbh0.05181.05325.319***
distance level 11.1263.083208.318***
tree species (A. hippocastanum)2.66214.3291332.893***
tree species (P. × acerifolia)−2.1430.117−88.267**
tree species (R. pseudoacacia)−0.9770.376−62.416.
tree species (T. cordata)0.2311.26025.994
Ovoid shape
Intercept2.547 ***
dbh−0.04910.952−4.792***
distance level 1−1.1190.327−67.345***
tree species (A. hippocastanum)−0.9620.382−61.806*
tree species (P. × acerifolia)0.2631.30230.18
tree species (R. pseudoacacia)−0.6390.528−47.226.
tree species (T. cordata)1.284−3.609260.937***
Spherical shape
Intercept−2.162 ***
dbh0.02151.0212.174*
distance level 10.8532.347134.665**
tree species (A. hippocastanum)−2.1510.116−88.368**
tree species (P. × acerifolia)0.5361.70970.925
tree species (R. pseudoacacia)0.09811.10310.302
tree species (T. cordata)−2.0090.134−86.596***
Publisher’s Note: MDPI stays neutral with regard to jurisdictional claims in published maps and institutional affiliations.

