Article

A Comparison of Radial Wood Property Variation on Pinus radiata between an IML PD-400 ‘Resi’ Instrument and Increment Cores Analysed by SilviScan

1
Forest Quality Pty Ltd., Franklin, TAS 7113, Australia
2
Scion, Rotorua 3010, New Zealand
3
Department of Forest and Wood Science, Stellenbosch University, Stellenbosch 7602, South Africa
4
Wood Quality Consulting, Rotorua 3015, New Zealand
5
Forestry Corporation of New South Wales, Softwood Plantations Division, Sydney, NSW 2125, Australia
6
Forest Industries Research Centre, University of the Sunshine Coast, Maroochydore, QLD 4556, Australia
*
Author to whom correspondence should be addressed.
Submission received: 19 April 2022 / Revised: 9 May 2022 / Accepted: 9 May 2022 / Published: 12 May 2022

Abstract

:
Mature age Pinus radiata D. Don trees were sampled across nine sites in northern New South Wales, Australia, that were expected, based on site quality and inventory metrics, to exhibit significant variation in productivity and wood quality. Twenty trees per site were harvested and 13 mm diameter, pith-to-bark increment cores were extracted from three trees per site from eight of the nine sites for SilviScan analysis. Outerwood increment cores were collected from all trees for basic density measurement. The same trees were also sampled using an IML PD400 (Resi) instrument. Radial mean properties of wood basic density derived from Resi traces were found to correlate strongly with the mean density data derived from SilviScan analyses and from increment cores. The Resi-derived basic density of 10 mm radial segments was strongly correlated with SilviScan measures of basic density averaged at similar intervals.

1. Introduction

Over the past few decades the SilviScan technology [1,2,3] has repeatedly demonstrated its capability for generating accurate measures of a wide range of physical wood properties [4] in samples taken from standing trees. These provide strong correlations with the commercial products sourced from logs [5]. The basic density, microfibril angle (MfA) and modulus of elasticity (MoE), along with a range of cell dimensional properties (e.g., radial and tangential fibre diameter, fibre wall thickness and fibre coarseness), can rapidly be determined at high radial resolution with a sampling interval of 25 μm (MfA and MoE at 0.2–5 mm minimum sampling interval). SilviScan, however, is relatively expensive and may take considerable time (weeks or months) to get data from a sample.
Radiata pine is a dominant commercial softwood species across much of the southern hemisphere [6], and for the past several decades there has been considerable emphasis on improving its wood properties. Consequently, there is considerable research and commercial interest in lower-cost and rapid in-field techniques for assessing wood quality [1,7,8,9,10,11]. The IML Power drill (PD series “Resi”) is increasingly being accepted as a tool for commercial pre-harvest assessment of stand-average wood quality in Australia and New Zealand. Its rapid, low-cost measurement capability, combined with its accuracy and precision for estimating wood density and its consequent prediction of log MoE has been demonstrated in a range of industry and Forest and Wood Products Australia (FWPA) funded studies [12,13,14,15]. Its application to tree breeding has also been demonstrated in multiple studies over recent years [16,17].
To date, the commercial use of the Resi has focused primarily on estimating the average density of the stem at the point of sampling [18], with limited attempts to explore the accuracy of the radial assessments at the annual ring or radial segment level [19]. The commercial objective has been to provide a reliable measure of the wood quality within a forest that is non-destructive and deployable during a standard forest inventory program, from which the value of the sawn timber product from that stand can be inferred with a commercially useful level of precision.
Radial variation in wood properties is an important component of the overall log quality [13]. Given that SilviScan represents an accepted standard in wood property assessment, the objective of this study was to compare the basic density estimates generated from Resi traces with those generated by SilviScan, where both Resi and SilviScan data have been obtained from effectively the same sampling point in the stem. Resi and SilviScan data were derived from 22 trees sampled across eight different, mature age radiata pine sites in the northern NSW Oberon region. The radial variation of estimates of MoE were also examined.

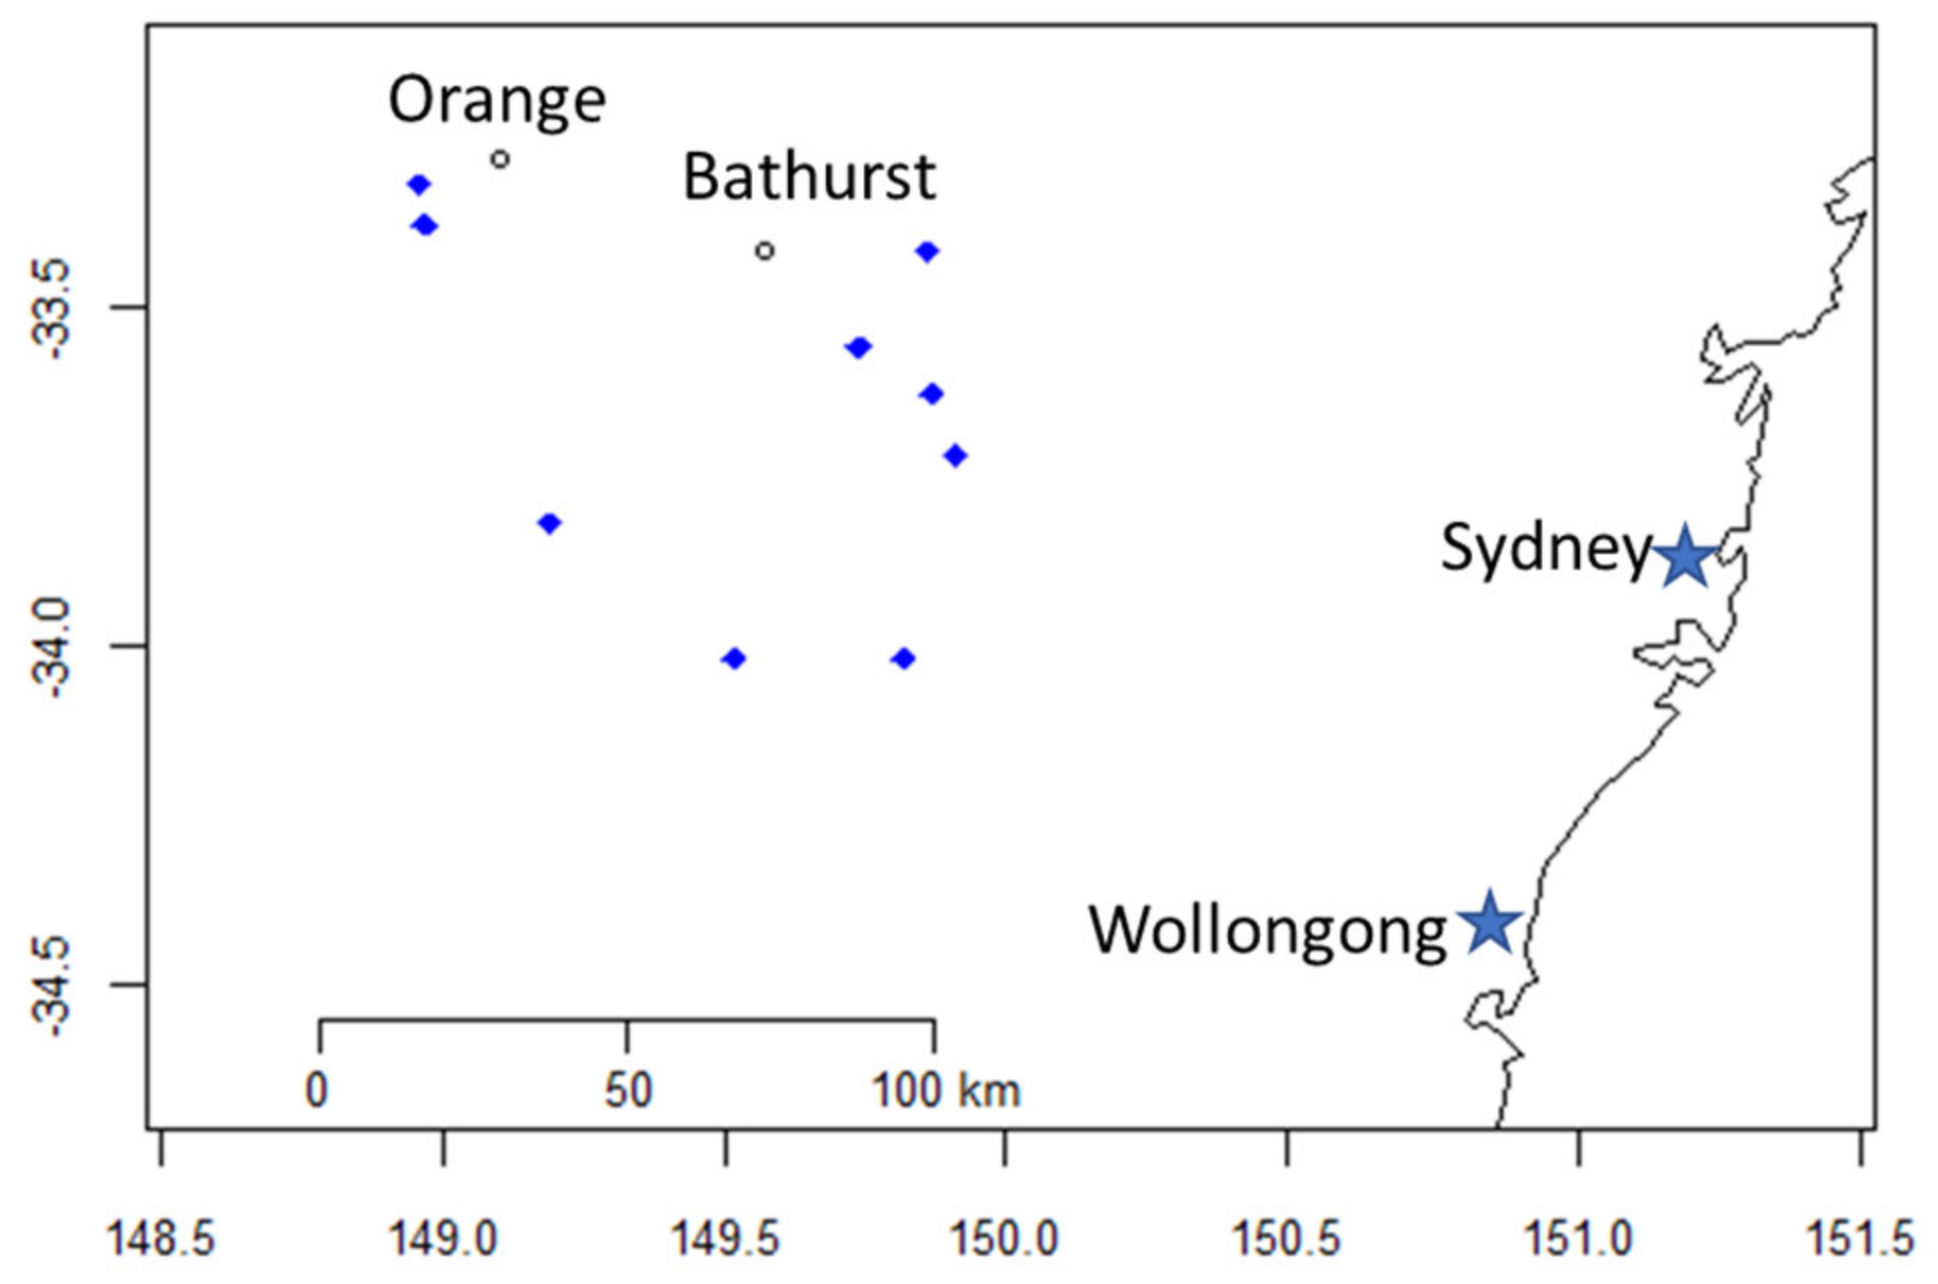
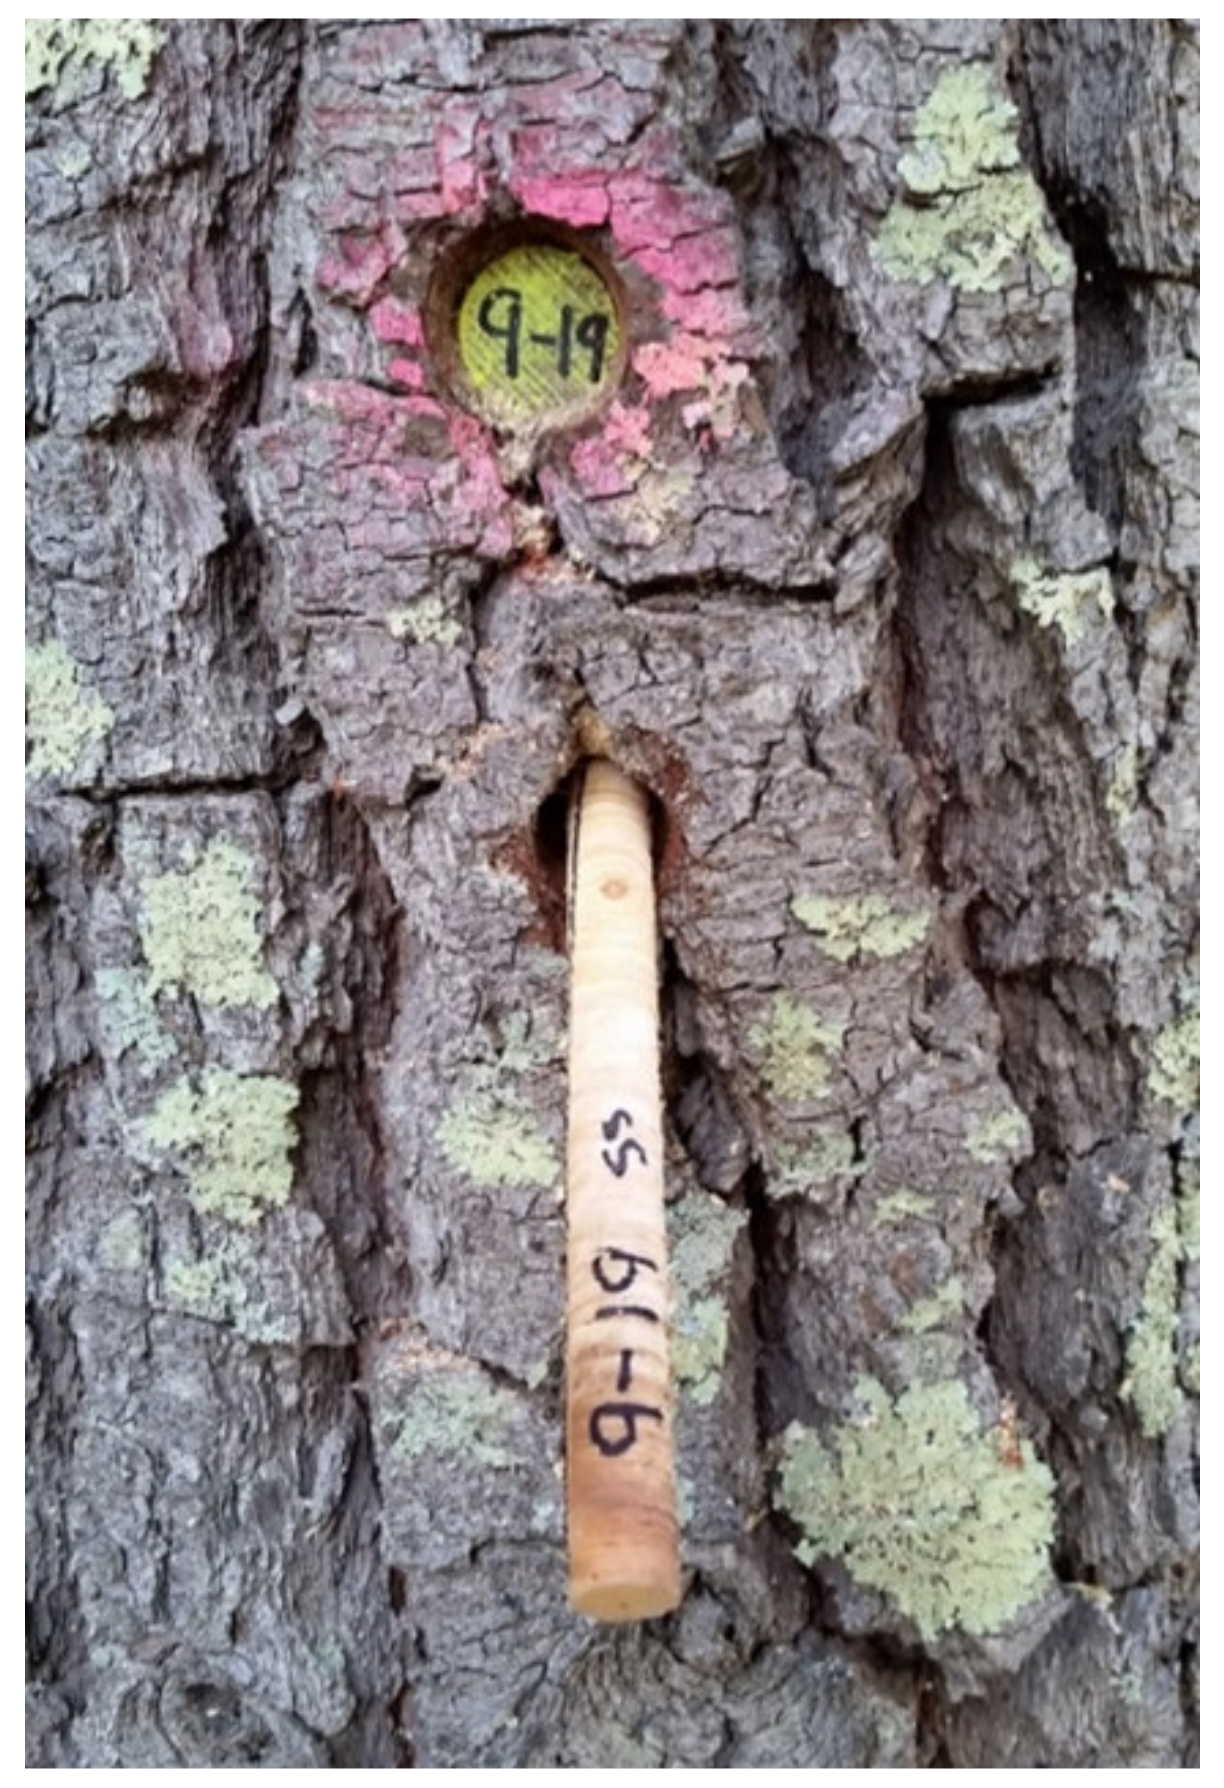
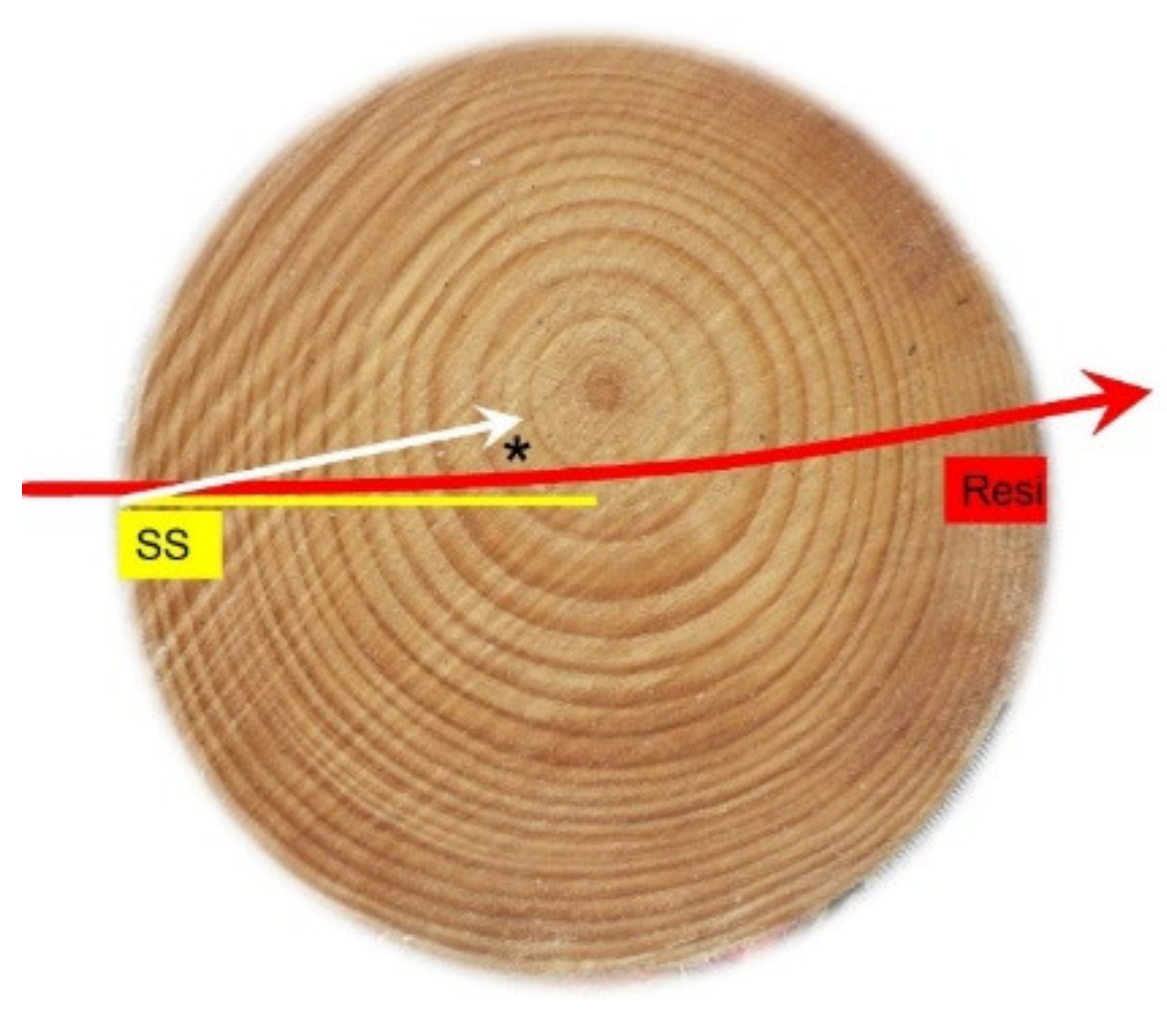
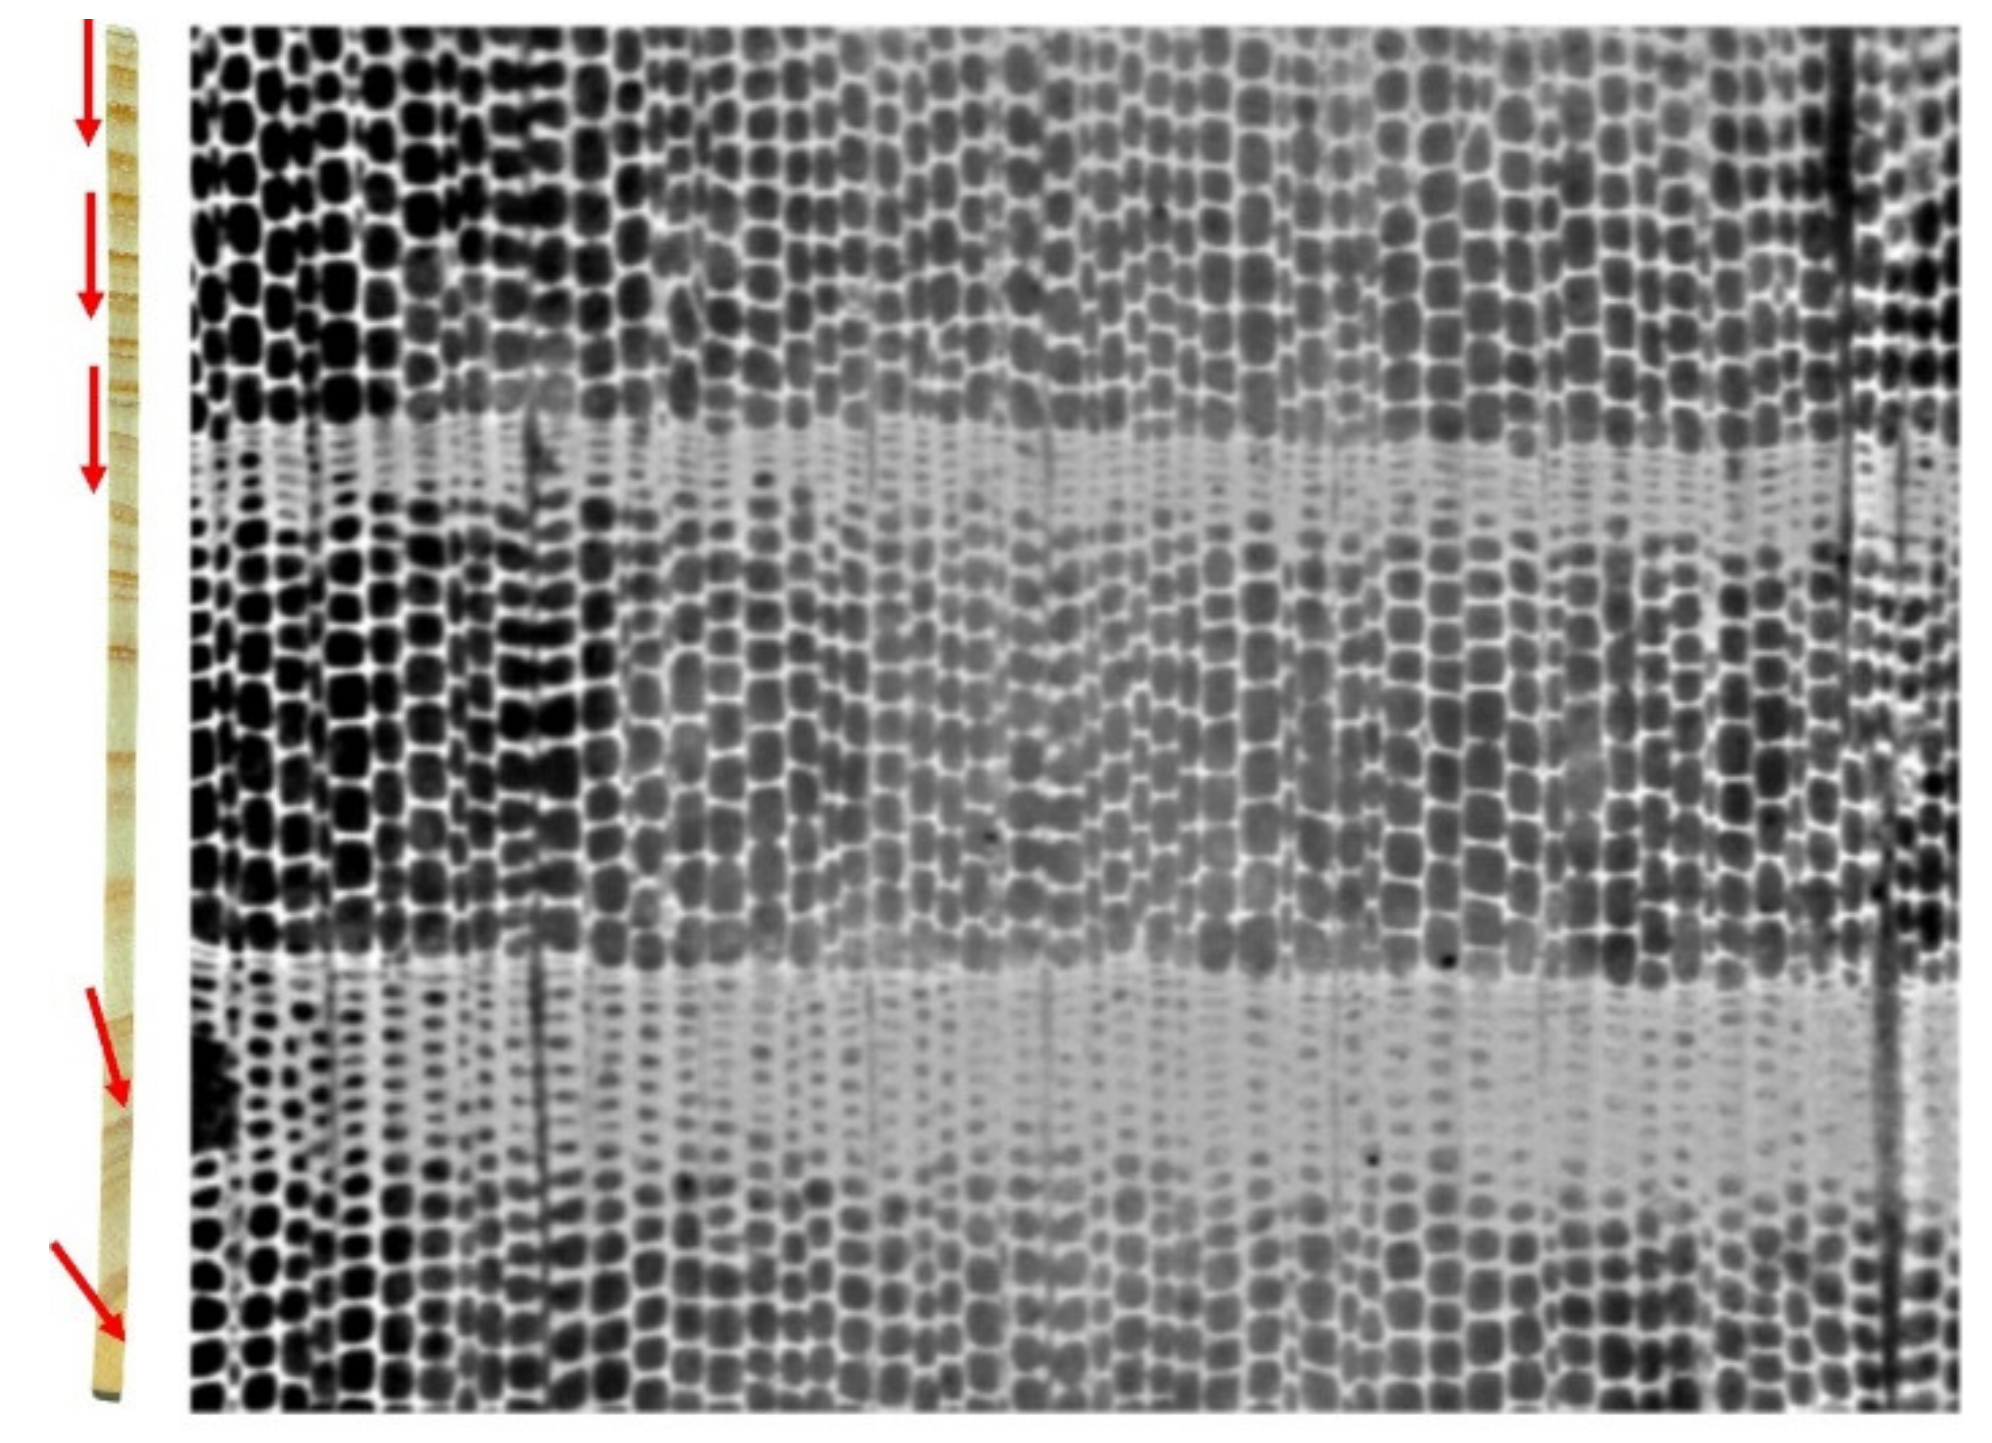
2. Materials and Methods

As part of a larger study [14], 180 trees were sampled across 9 sites in the Oberon region of central New South Wales in March 2019 (Table 1, Figure 1). The sites were selected to represent as broad a range of growth and wood properties as possible within the constraints of available close-to-harvest age plantations in the region and current harvesting operations.
As part of a larger study, twenty trees per site were sampled and felled for sawn timber processing to assess the accuracy and precision of pre-harvest measurements based on traces taken using the IML Resi. A Resi trace was collected at breast height from each tree, taken at random with respect to aspect, but avoiding proximity to branch and defects. Traces were collected with a forward speed of 200 cm/min and 2500 RPM. A 13 mm diameter by 50 mm long outerwood core was sampled close to the sampling location of the Resi trace using a motorized increment corer [20]. This was used to calibrate the Resi instrument amplitude data for basic density estimation. A wooden dowel was inserted into the resultant hole and the tree number recorded on it to assist in identifying the butt log in the log yard (Figure 2) in the larger mill trial [14].
From three trees at each site, selected to cover the range in breast height diameter, a 13 mm diameter full radius core was taken for SilviScan analyses (Figure 2). SilviScan and outerwood cores were sampled close to the location sampling point of the first of the pair of Resi traces sampled from each tree (Figure 3).
Given the potential for wood properties to vary significantly within a relatively short distance within stems, it is important to sample as close to the same portion of the stem with both the Resi and SilviScan core to obtain optimal comparisons. The slight curvature in the dark line in Figure 3 illustrates a potential for the Resi needle to follow a slightly curved trajectory through the tree as it interacts with the slope of grain and rotation direction of the needle. In most trees the trajectory is quite straight if the Resi instrument is level and the stem is perpendicular. Extreme curvature can be generated if the Resi instrument is angled significantly up or down (i.e., more than 5 degrees). However, in many trees the pith is not in the exact centre; thus, a perfect cross-sectional trace through the geometric centre may miss the pith by centimetres.
Of the 24 SilviScan cores collected, 22 full radius cores were sent to FP Innovations in Vancouver, Canada (https://web.fpinnovations.ca/) (accessed on 18 April 2022) for SilviScan analysis. SilviScan data was returned as radial, pith-to-bark profiles of density, cell diameter (radial and tangential) and wall thickness at a 25 μm radial sampling interval. Radial profiles of the microfibril angle (MfA) and dynamic modulus of elasticity (MoE) were also measured at a 2 mm radial sampling interval. Annual ring means generated using automated ring detection algorithms were also provided. However, these were found to be inaccurate in most radii due to narrow and/or false ring structures.
Resi traces were processed using web-based software (https://forestquality.shinyapps.io/FWPA-4/) (accessed on 18 April 2022) to prepare radial transects of amplitude for analysis. This processing platform was designed to upload and process Resi traces to derive diameter, bark thickness and wood density summary metrics with little or no user intervention. In this case, Resi traces were retained as % amplitude and not converted to basic density values. A user manual embedded in the web platform describes the function of the site in detail. Annual ring boundary positions were allocated within the traces to generate measures of annual ring mean amplitude and ring width. The web platform cited above also has the capability to read the radial profiles of wood properties generated by SilviScan, in which annual ring boundaries were manually positioned, to generate annual ring mean properties comparable as much as possible to those generated by Resi.
SilviScan density is air-dry density, not basic density, determined at a moisture content of ~7–8%, and derived from the sample conditioning and measurement at a constant 20 °C and 40% relative humidity. In the analyses reported here, the values were adjusted to approximate basic density using the following calculation from Siau [21]:
Basic density = 1000 × SilviScan_density/(1080 + coefA × SilviScan_density)
where “coefA” is a coefficient defined to minimise the bias between the SilviScan value and the value of the corresponding outerwood cores.
An important issue in comparing Resi and SilviScan data was the way the SilviScan data were presented. Because the SilviScan analysis included the image analysis of fibre properties, the radial profiles were corrected as if the core had been taken directly towards the pith. This is illustrated in Figure 3 as the differences between the yellow line indicating the actual trajectory of the SilviScan core (SS) and the white arrow indicating the corrected trajectory of the data generated. The automated image processing employed by SilviScan requires the orientation of the rays to be calculated [1]. Typically, the vascular rays in wood are aligned radially, running from pith to bark (Figure 4), which gives a ray angle of effectively zero degrees at the bark. If the sample misses the pith, the ray angle will progressively increase towards 90 degrees (as indicated by the red arrows) as it passes the pith. From this change in direction, the position of the pith can be estimated, and the radial profiles corrected accordingly. This, however, causes issues for comparing between SilviScan and Resi values, especially if either of them misses the pith by a substantial distance (as illustrated in Figure 3).
In many samples, annual ring boundaries could not be accurately identified either in the Resi traces, the SilviScan profiles or both. The coarser sampling interval of the Resi traces (0.1 mm) made accurate annual ring detection impossible in many traces. As the focus of this study was to compare radial wood property variation between SilviScan and Resi traces, five to six of the samples were able to be meaningfully compared using annual ring values. Consequently, the focus of the analyses presented here was on comparisons undertaken using all samples by generating the means of 10 mm intervals starting from the cambium. A similar approach had been adopted and reported in [19] in Eucalyptus nitens, comparing the radial variation in basic density with that of wood blocks of 20 mm radial thickness. The segment width used here increased the spatial resolution of the trends.
All analyses and reporting were done in R version 4.1.1., R foundation for Statistical Computing, Vienna, Austria [22] using RMarkdown [23] within the RStudio environment [24].

3. Results

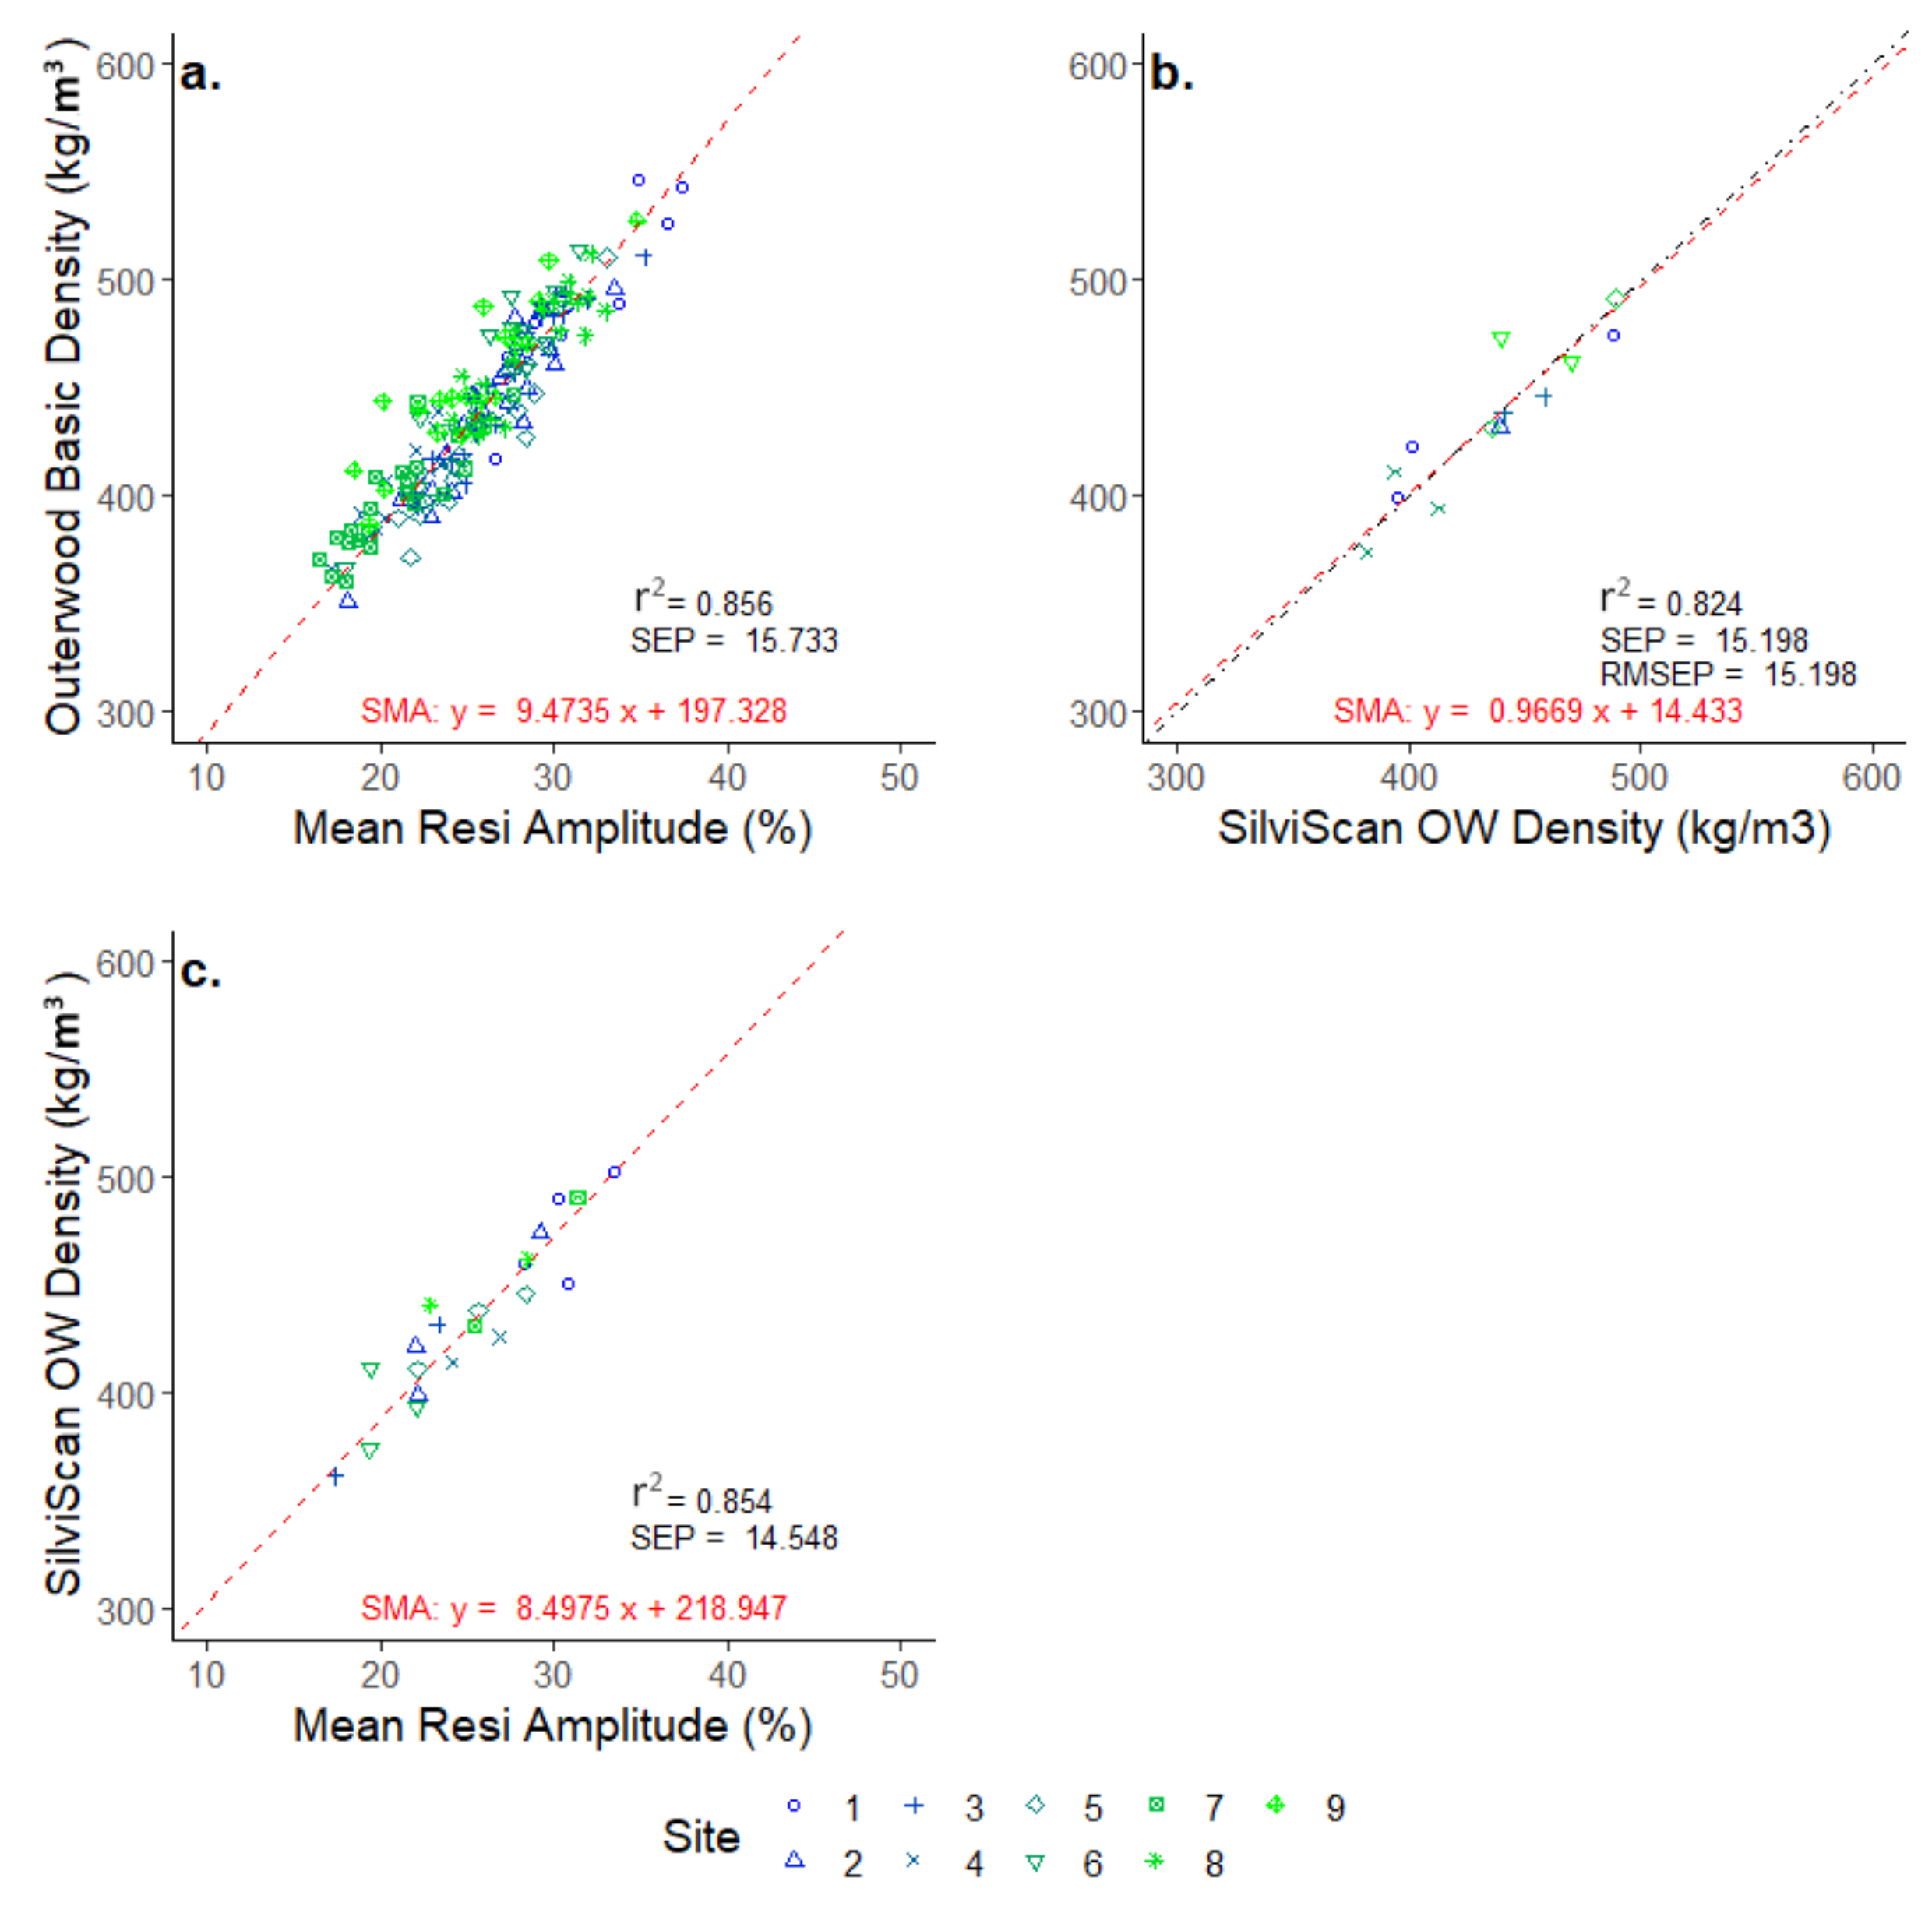
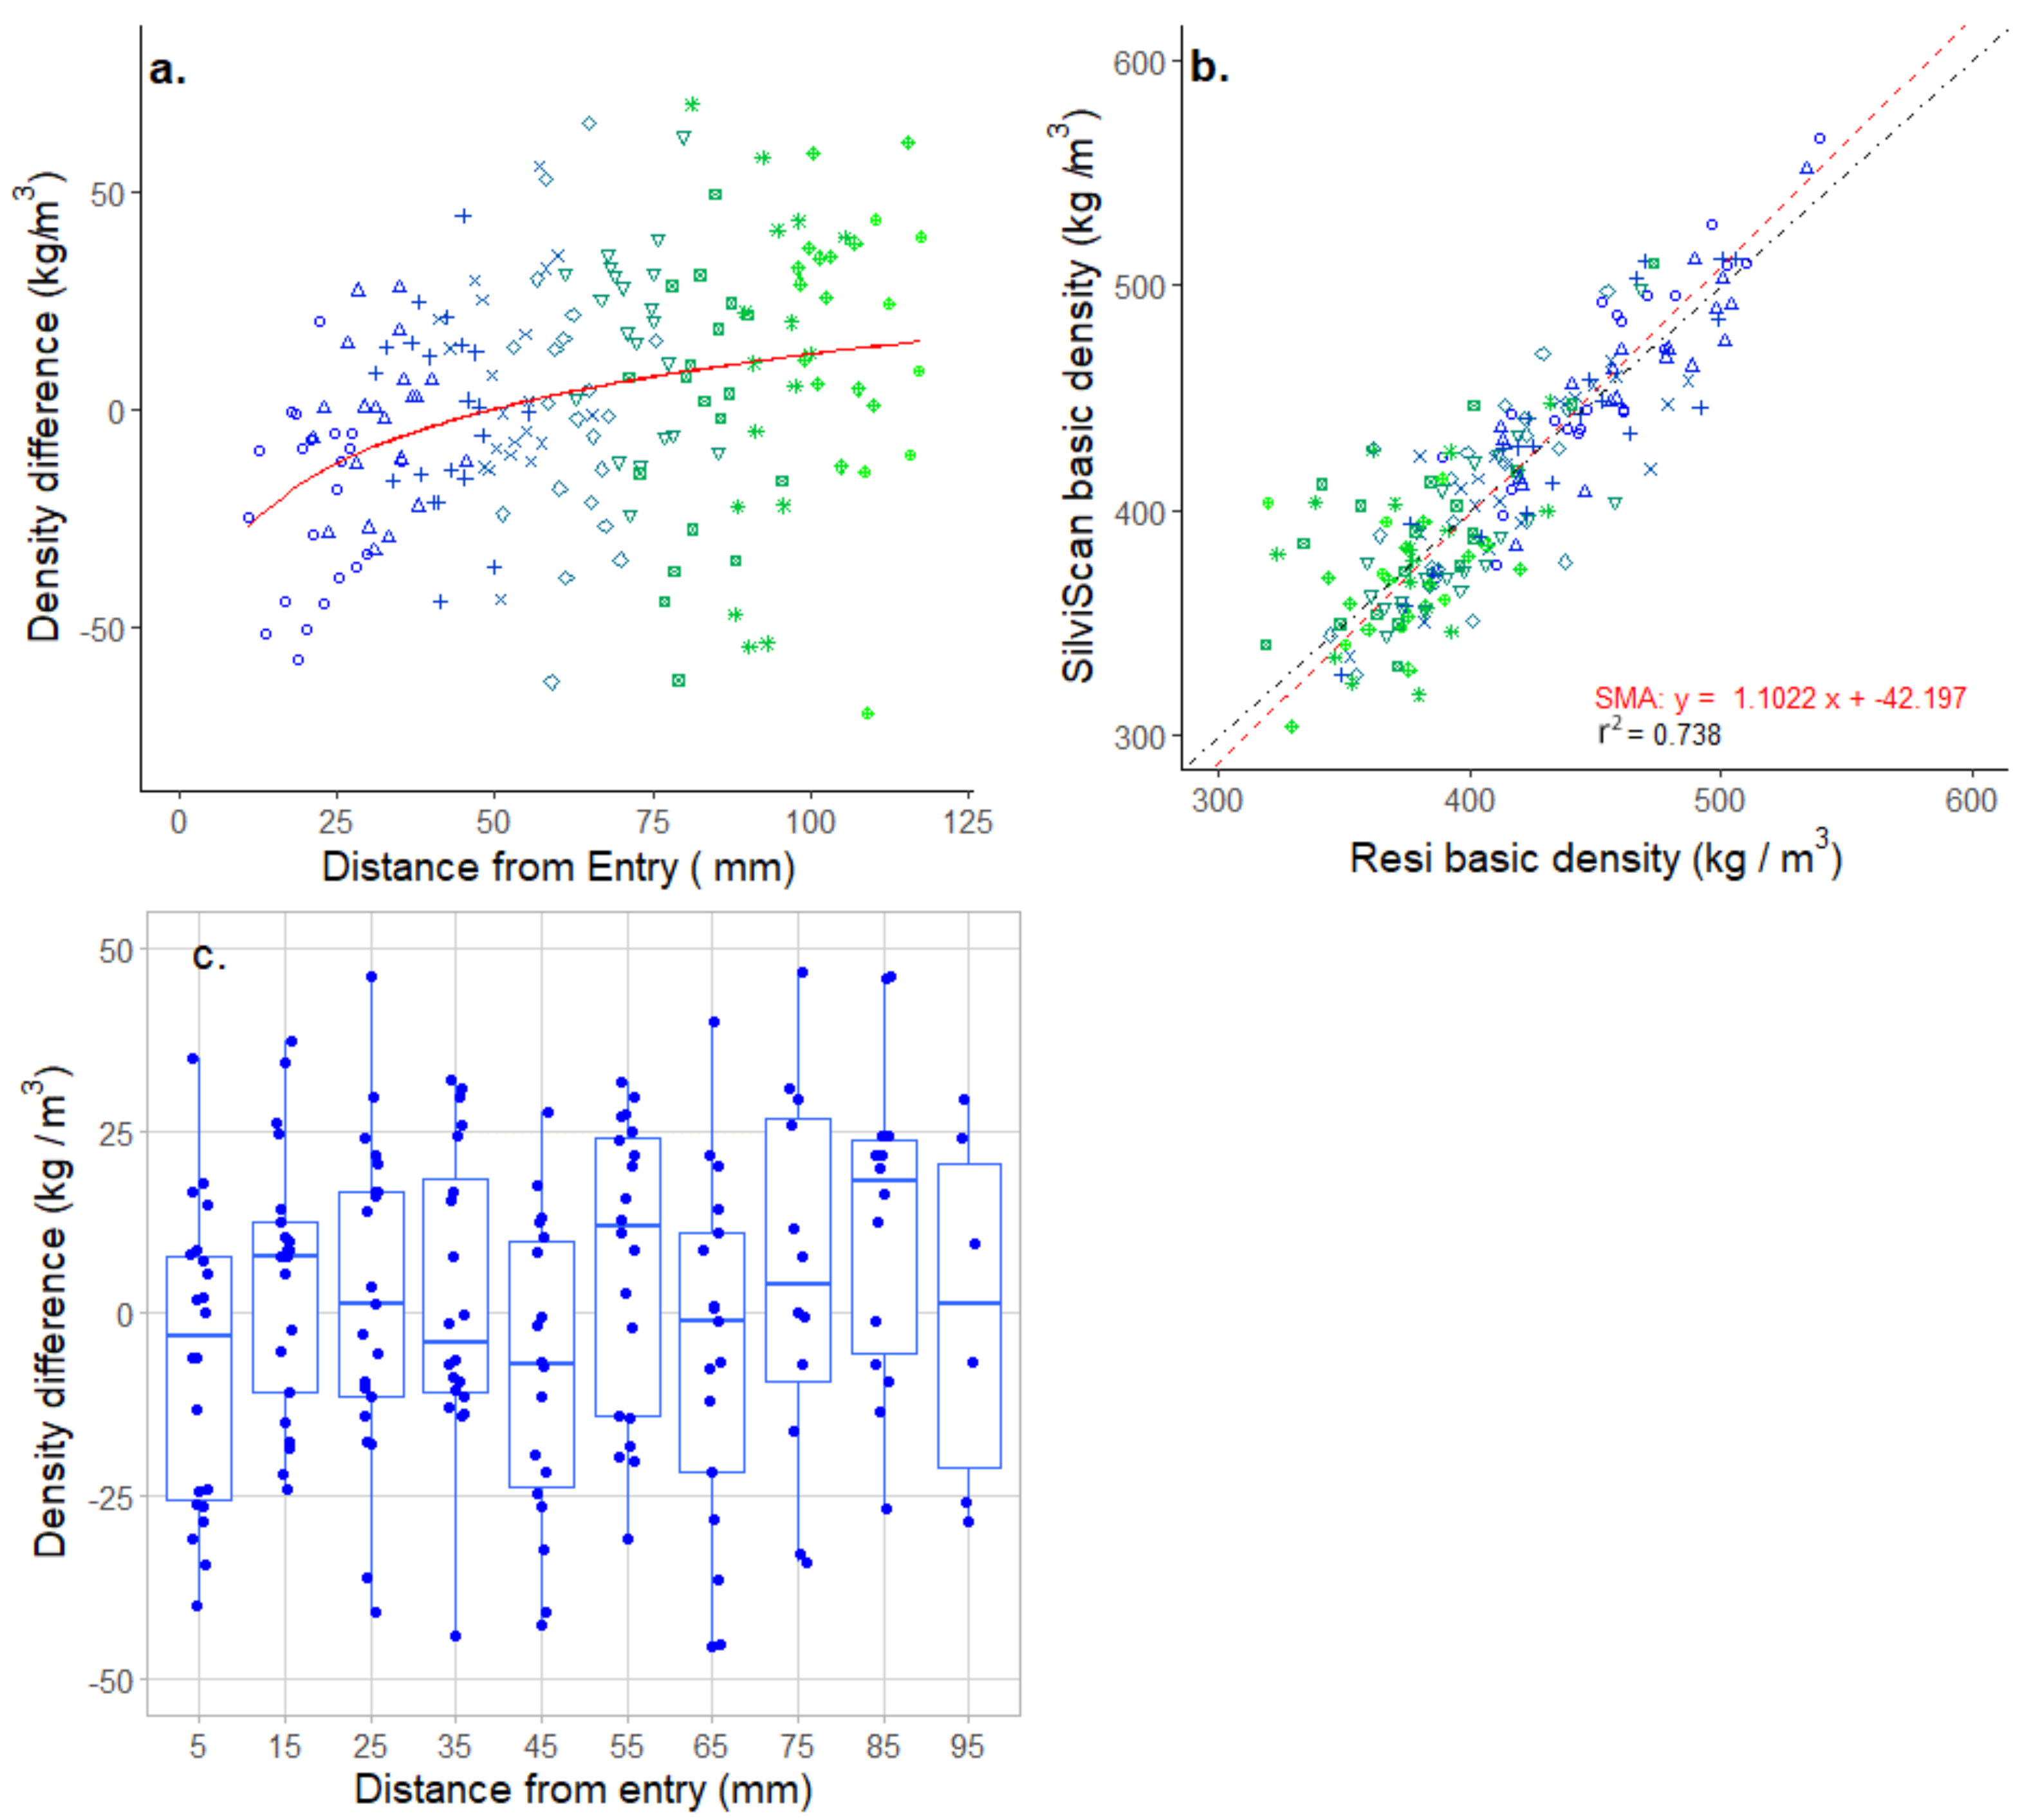
3.1. Calibrating the Resi Density Estimates

From the stem position from which the first Resi trace was collected, a 50 mm long, 13 mm diameter outerwood core was sampled in each of the 20 trees per site to develop a calibration relationship between Resi values (% amplitude) and basic density. To simplify the calibration process, protocols were developed relating the mean resistance values of the outer 50 mm of wood from the entry side of the trace with the corresponding Resi values for those samples. The web processing platform (https://forestquality.shinyapps.io/FWPA-4/) (accessed on 18 April 2022) facilitates defining the relationship between the relative Resi amplitude values (0–100%) and core basic density. In the relative scale of the Resi values, zero is defined by the resistance experienced within the instrument prior to the needle entering the wood. Maximum resistance is defined as 100% of the torque of both motors minus a safety factor. Previous work has shown that this relationship, at the core mean level, is linear [18].
Mean Resi values for the outer 50 mm underbark were calculated and the regression coefficients for the relationship with core basic density determined (Figure 5a). The fitted regression was defined using standardised major axis (SMA) regression within the “lmodel2” package (https://cran.r-project.org/package=lmodel2) (accessed on 10 October 2021). These coefficients were used in the larger study (not reported here) to compare Resi-derived wood properties with the sawn board products from the trees [14].
The outer 50 mm of the SilviScan profile was likewise compared with the basic density of the outerwood cores (Figure 5b) after defining the value for “coefA” described in Equation (1). A value of 0.414 resulted in minimum bias between the SilviScan and core density values. The corresponding Resi values explained 73% of the variance in the SilviScan values, which increased to 85% when an outlier was omitted from site 9 data (Figure 5c). This omission made minimal changes to the slope and intercept of the regression. Comparing the regressions between Figure 5a,c, the relationships were still significantly different (p < 0.001).

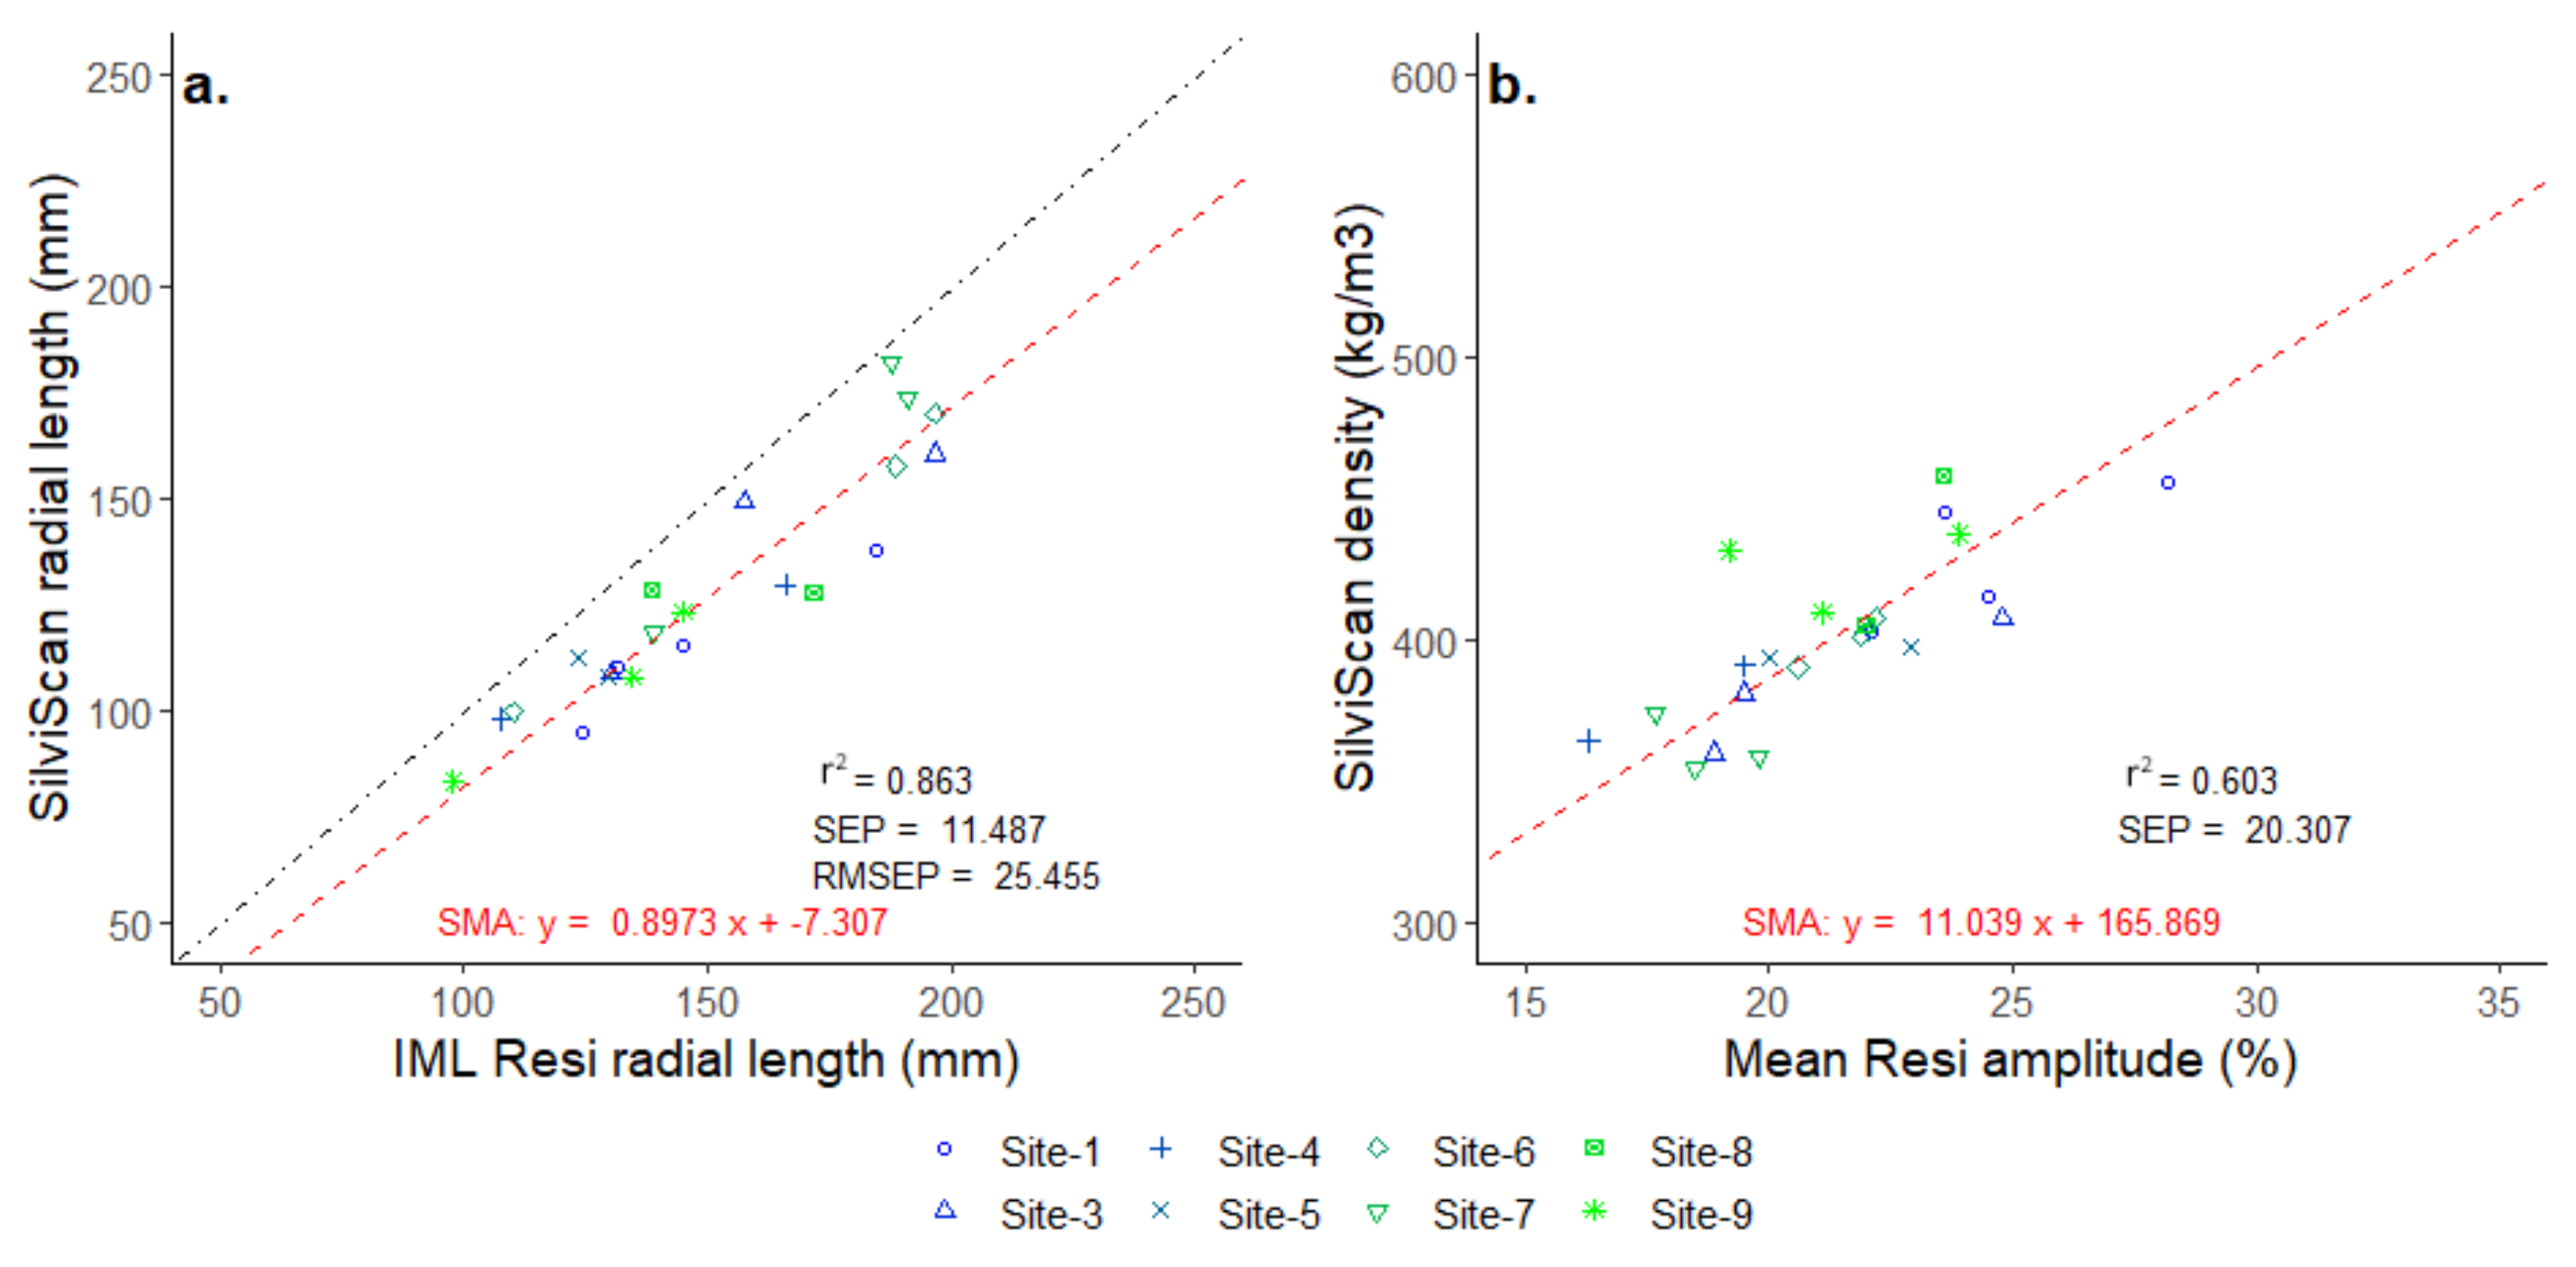
3.2. Comparison of Resi and SilviScan Radius Mean Values

The length of the stem breast height radius determined from the length of the SilviScan profile and the pith-to-bark length of the Resi trace were strongly correlated (r2 = 0.86) (Figure 6a). The radius obtained from the length of the SilviScan profile tended to be shorter than that of the Resi data owing to the ray angle correction in the SilviScan data described above. The mean density of the SilviScan profile and Resi trace were also strongly correlated (r2 = 0.60, Figure 6b).

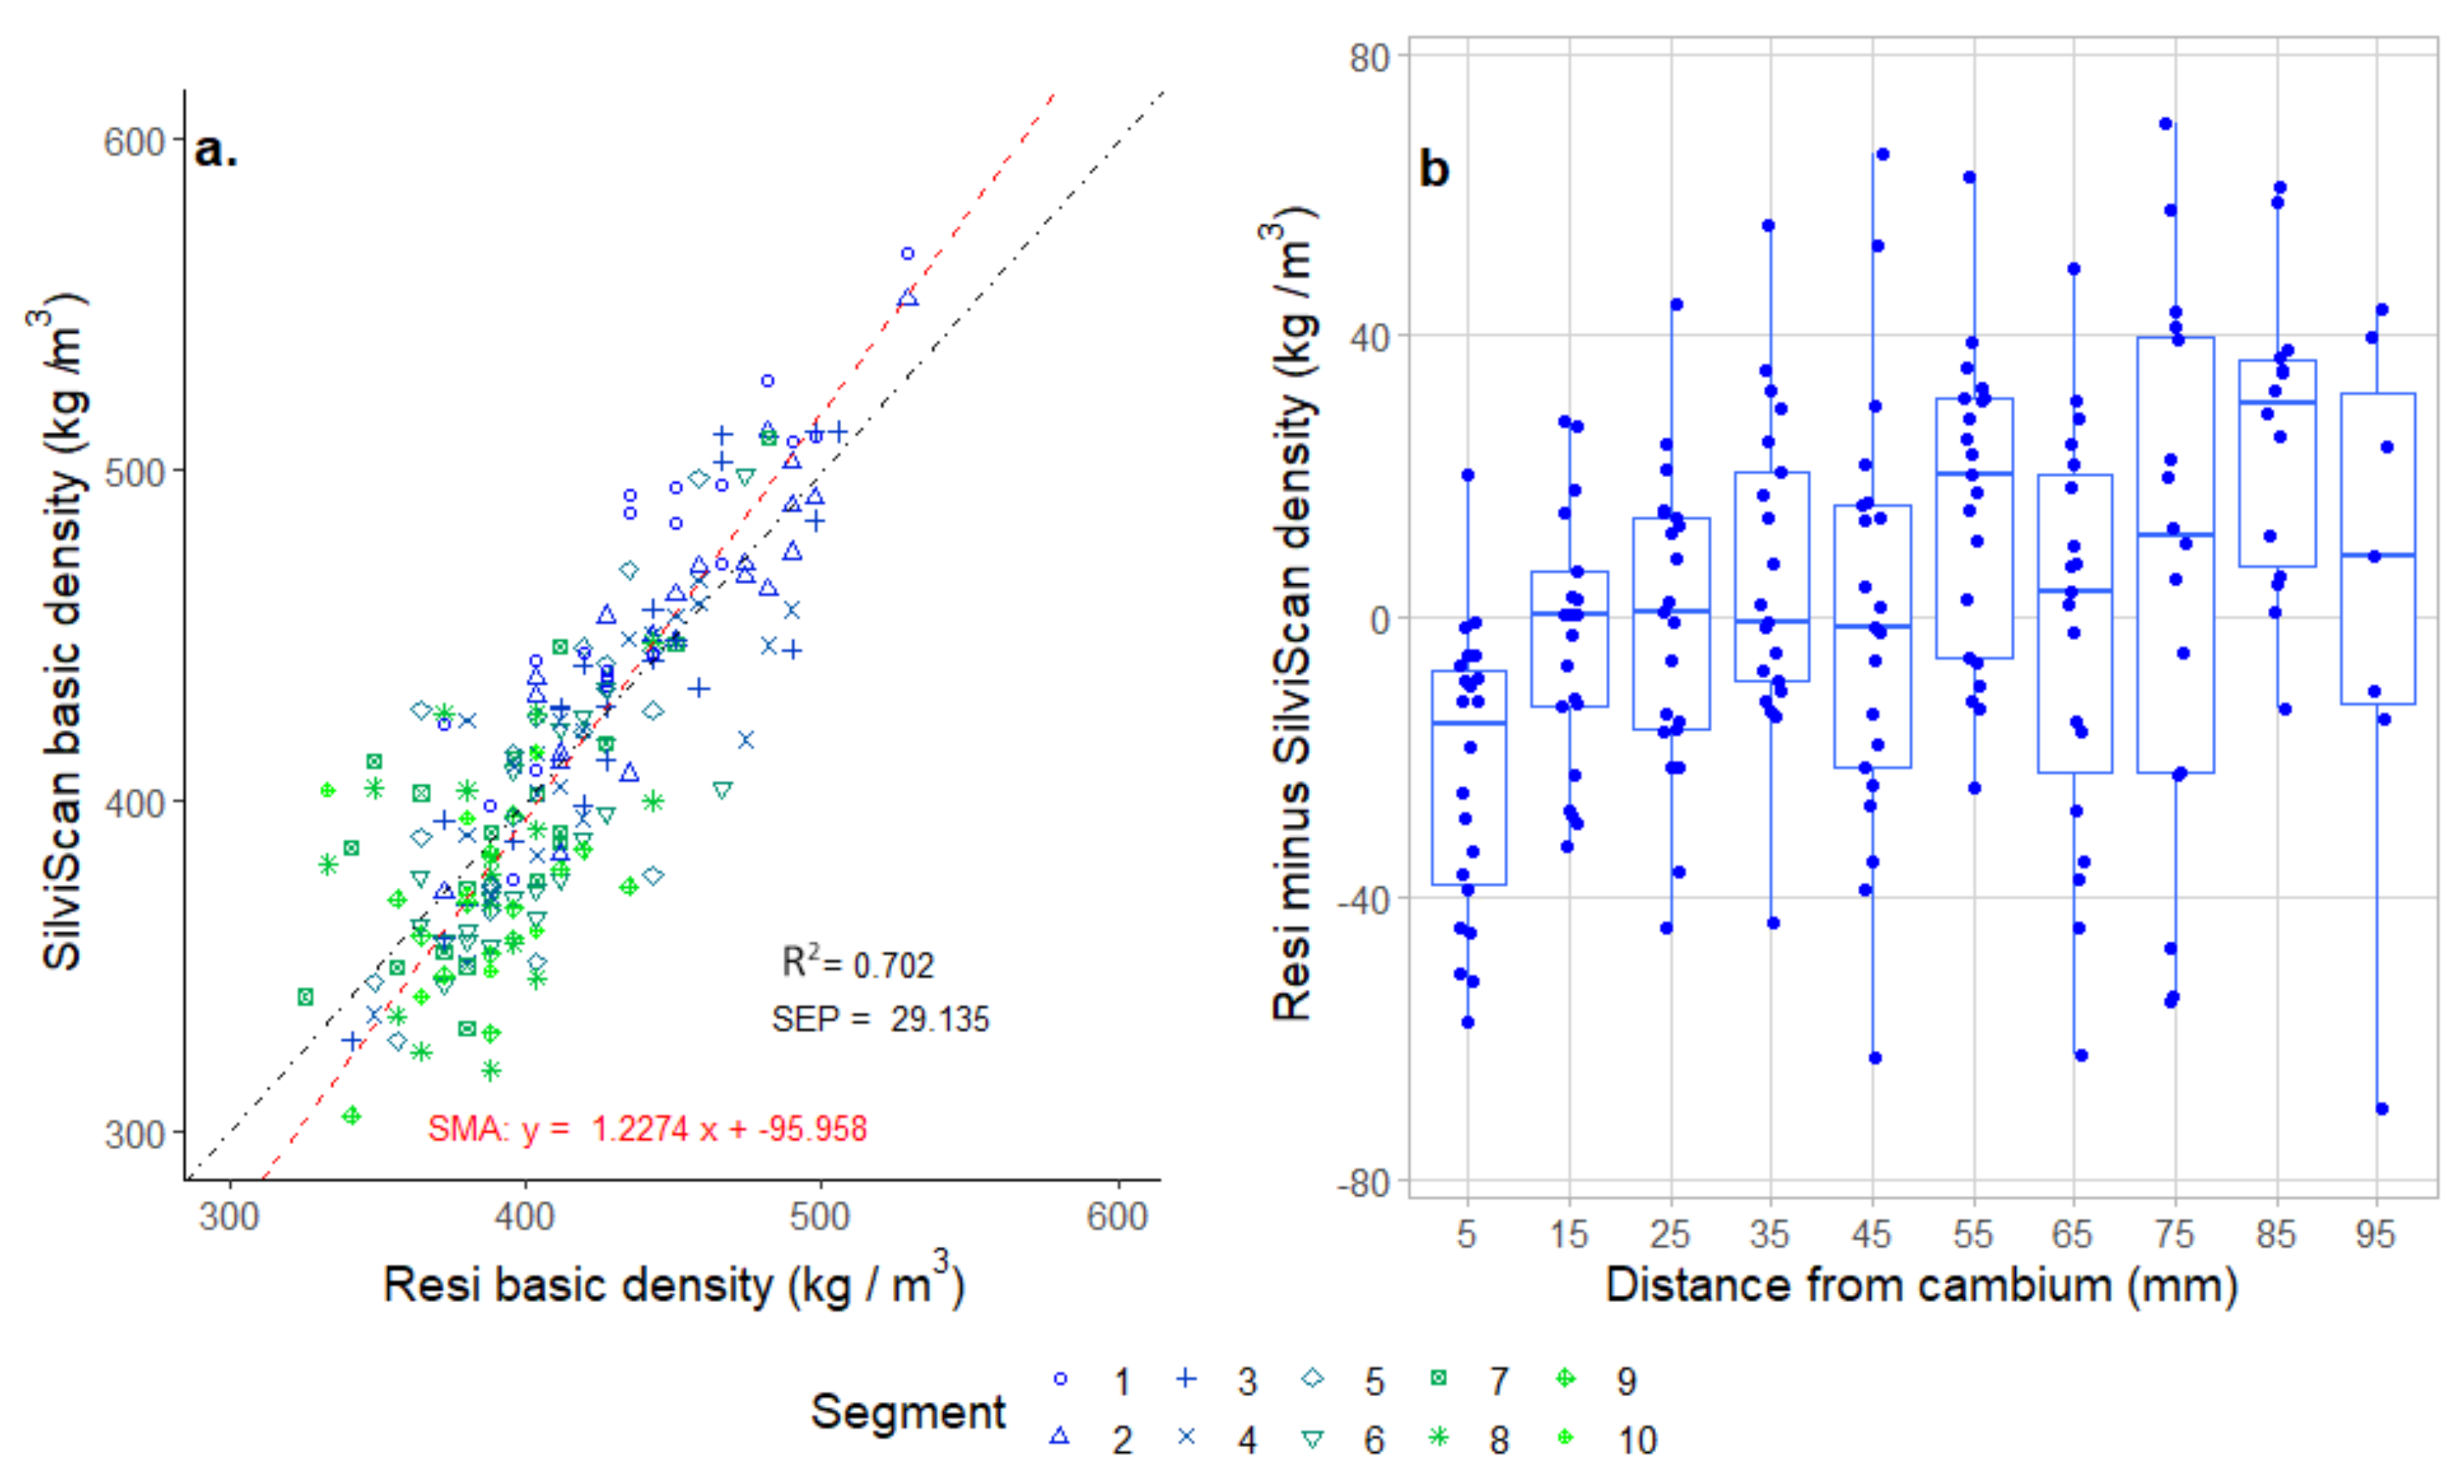
3.3. Comparing Radial Segment Means

As a result of the pith-to-bark alignment adjustments made to SilviScan profiles, ring widths determined from SilviScan profiles are more accurate than those obtained from Resi to the degree to which the Resi trace misses the pith. The effect is more marked in the wider, more curved rings of the juvenile core (e.g., asterisk in Figure 3), and minimal in the narrower mature wood rings.
To compare annual ring means it is necessary to ensure that the annual ring data represents the same growth year in both the SilviScan data and the Resi data. This requires that annual ring boundaries be clearly resolved and accurately allocated to the year of growth they represent. Due to the higher resolution of SilviScan (25 μm sampling interval) combined with the pith-to-bark adjustment of the traces and the ability to adjust the X-ray densitometry such that the X-ray path alignment is parallel to growth ring boundaries (Evans et al., 1995), this is more reliable in the SilviScan data than Resi data. However, even in the SilviScan data from some samples, ring widths were sufficiently narrow or indistinct to make this impossible to conduct with certainty (e.g., Figure 7).
In most samples the alignment of ring boundaries was a problem in the early juvenile rings. In many Resi traces (e.g., Figure 7b) the coarser resolution of the data made it impossible to clearly resolve narrow annual ring boundaries in the mature wood. Consequently, meaningful comparisons between annual ring means could not be made on enough samples where rings could be confidently identified and cross-matched between the Resi and SilviScan data sets.
The predicted mean basic density of 10 mm radial segments was calculated instead from each of the Resi and SilviScan data series starting from the bark and working towards the pith. To reduce the sampling error effect of misalignment between the SilviScan and Resi data, only the segments from the first 100 mm from the bark (first 10 segments) were considered, as the sample depth at higher segment numbers, combined with the “close-to-pith” alignment issues, made comparisons unreliable. For most radii, 100 mm from the bark extended well into the juvenile core.
The Resi values explained 70% of the variance in the SilviScan values (Figure 8a); 63% of eleven outliers, (defined as where the variance between the Resi and SilviScan means exceeded 70 kg/m3) were not removed. These outliers were predominantly segments 9–10, which were closest to the pith. The explained variance increased several more percentages when 20 or 25 mm segments were evaluated rather than 10 mm, as the net effect of misalignment between the Resi and SilviScan data was lessened (data not shown). The Resi-predicted density values were subtracted from the SilviScan values to calculate the difference. The first segment exhibited a lower density value in the Resi data than the SilviScan values (Figure 8b).

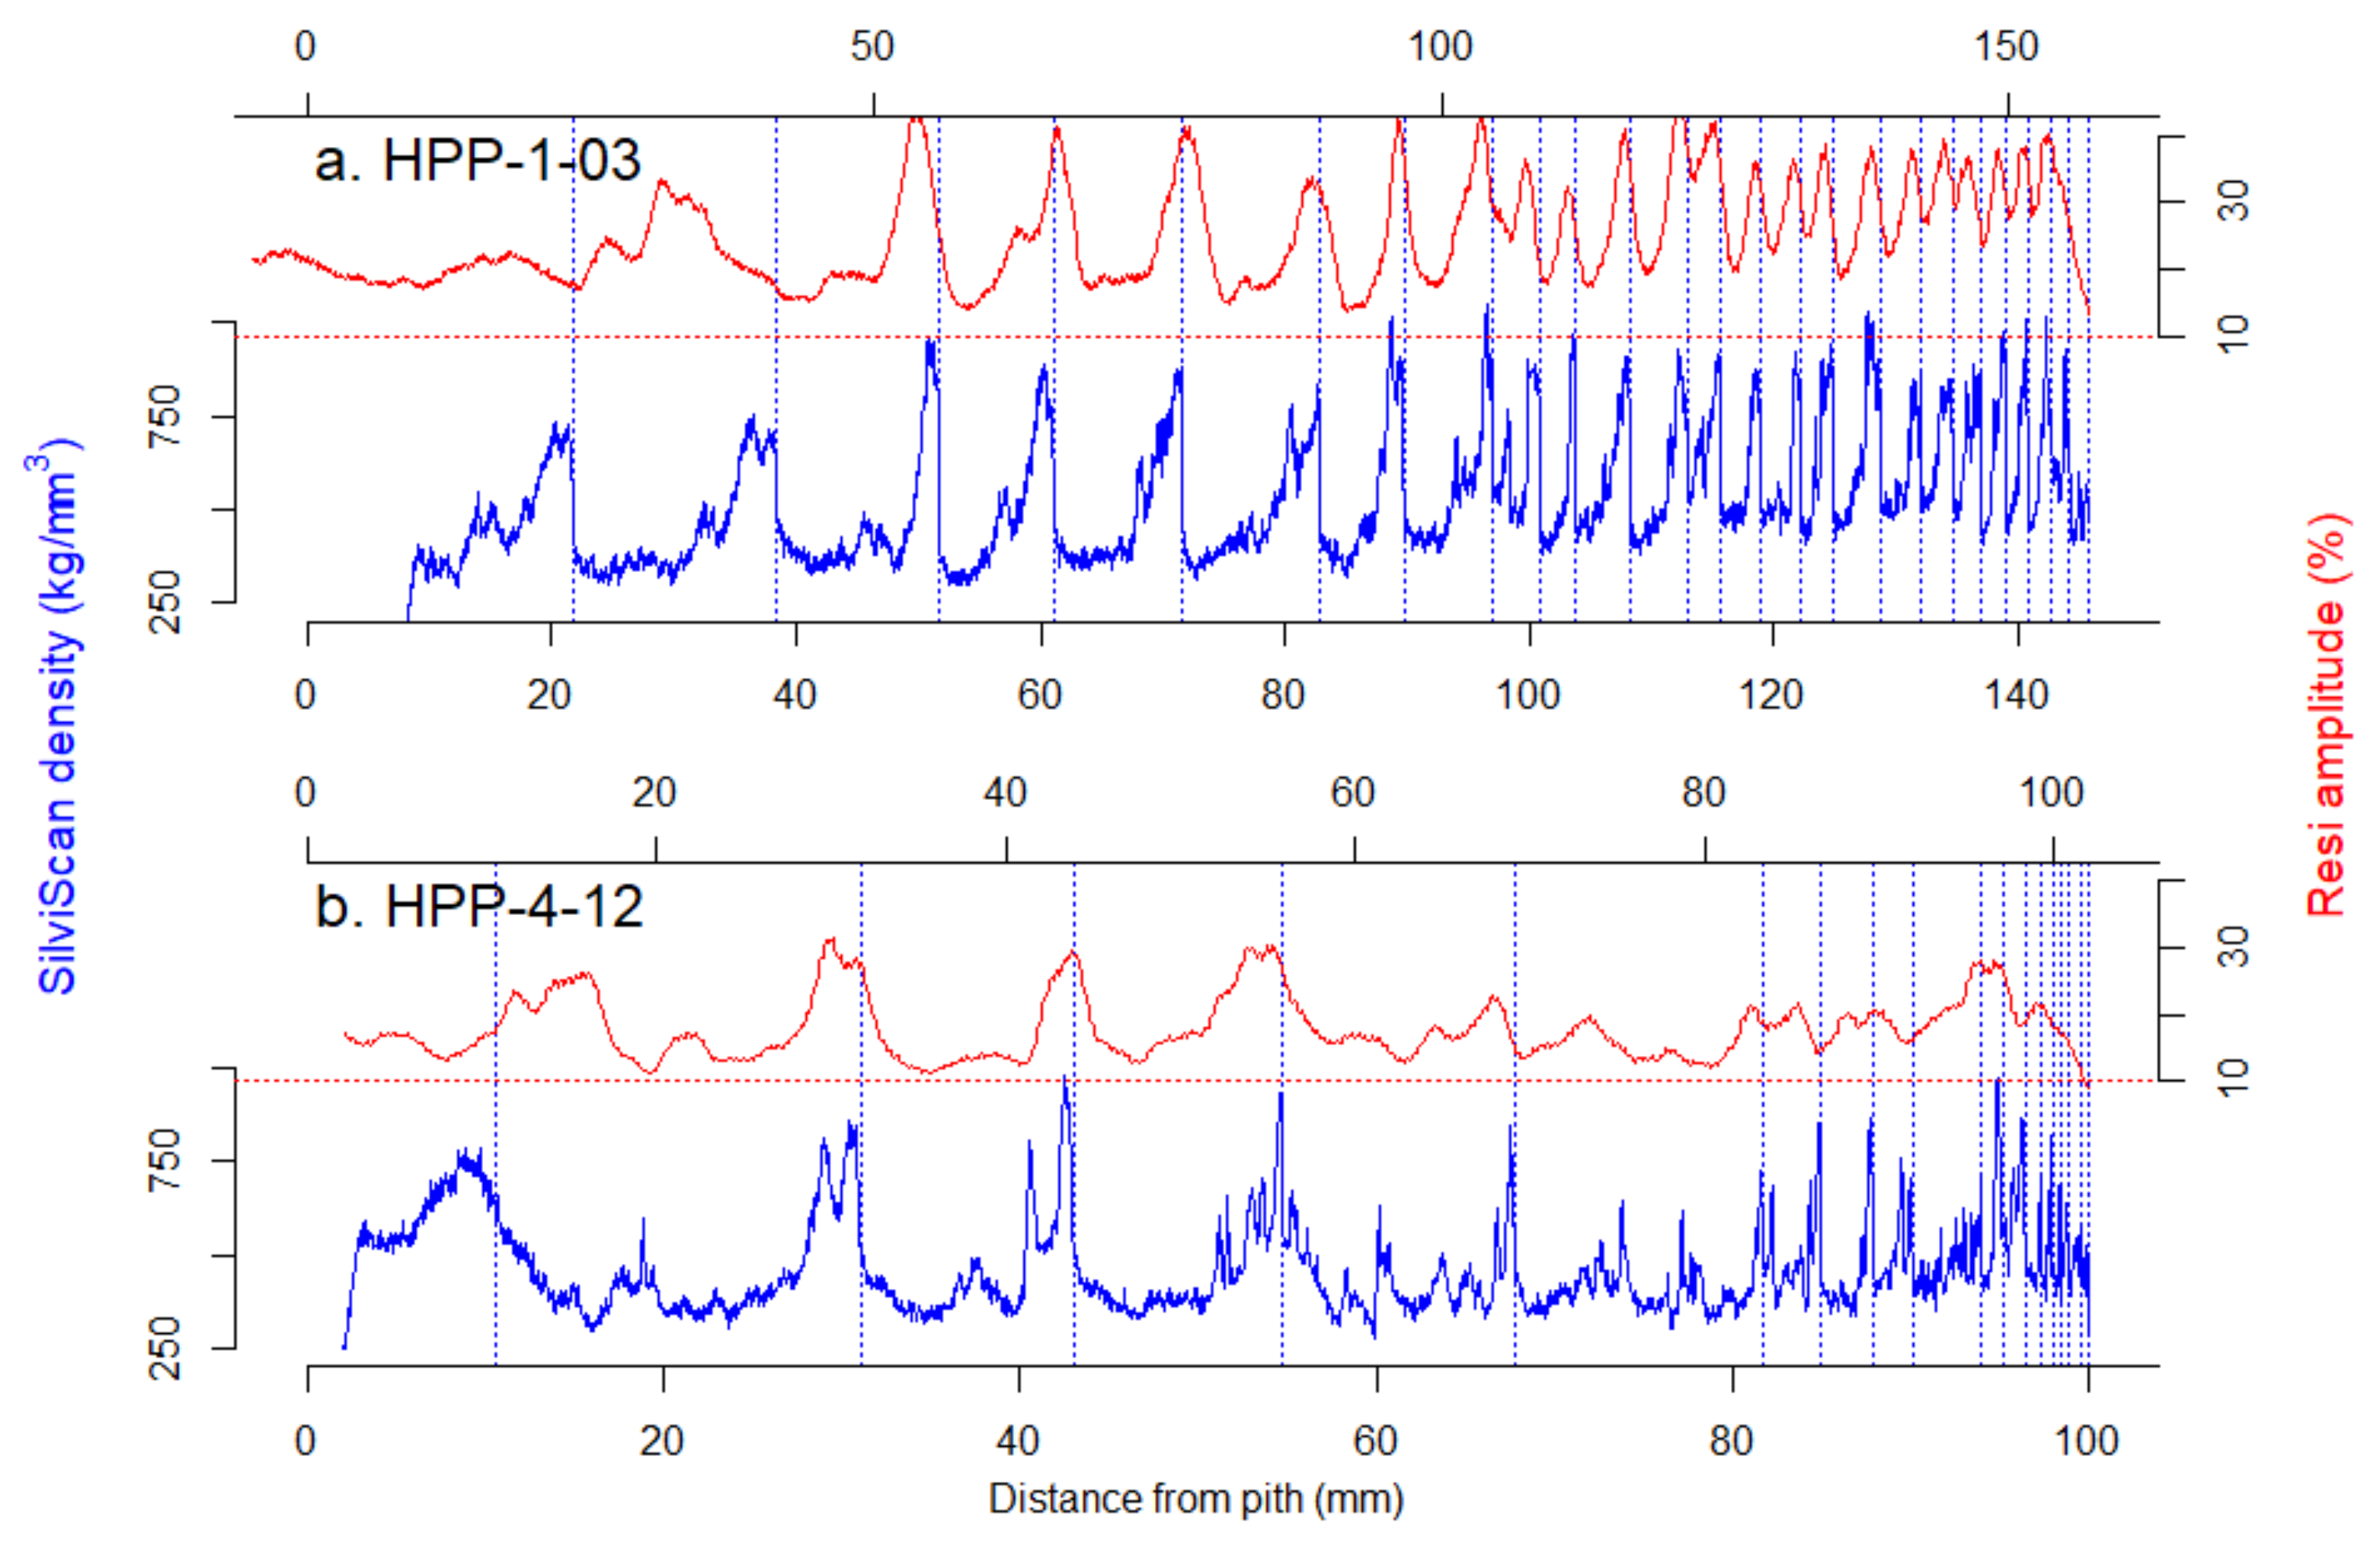
3.4. Non-Linear Baseline Correction of Resi Traces

The Resi traces collected here were on standing trees; thus, bark effects may be a contributing factor to the depth and magnitude of the lower density predictions over the initial depth of drilling. The radial pattern of the density differences for this study were examined when bark thickness was added to the segment data (Figure 9a) and a logarithmic model fitted to the relationship as defined below. Adjusting the Resi-derived basic density accordingly increased the variance explained to 74% (Figure 9b) and removed the under-prediction of basic density in the first segment (Figure 9c). The adjustment became zero at around 50 mm from the start of the Resi trace. Given the variation in bark thickness, the contrast between bark density and wood density and consequent effects on needle friction, and the degree to which this effect should be accounted for requires further investigation.

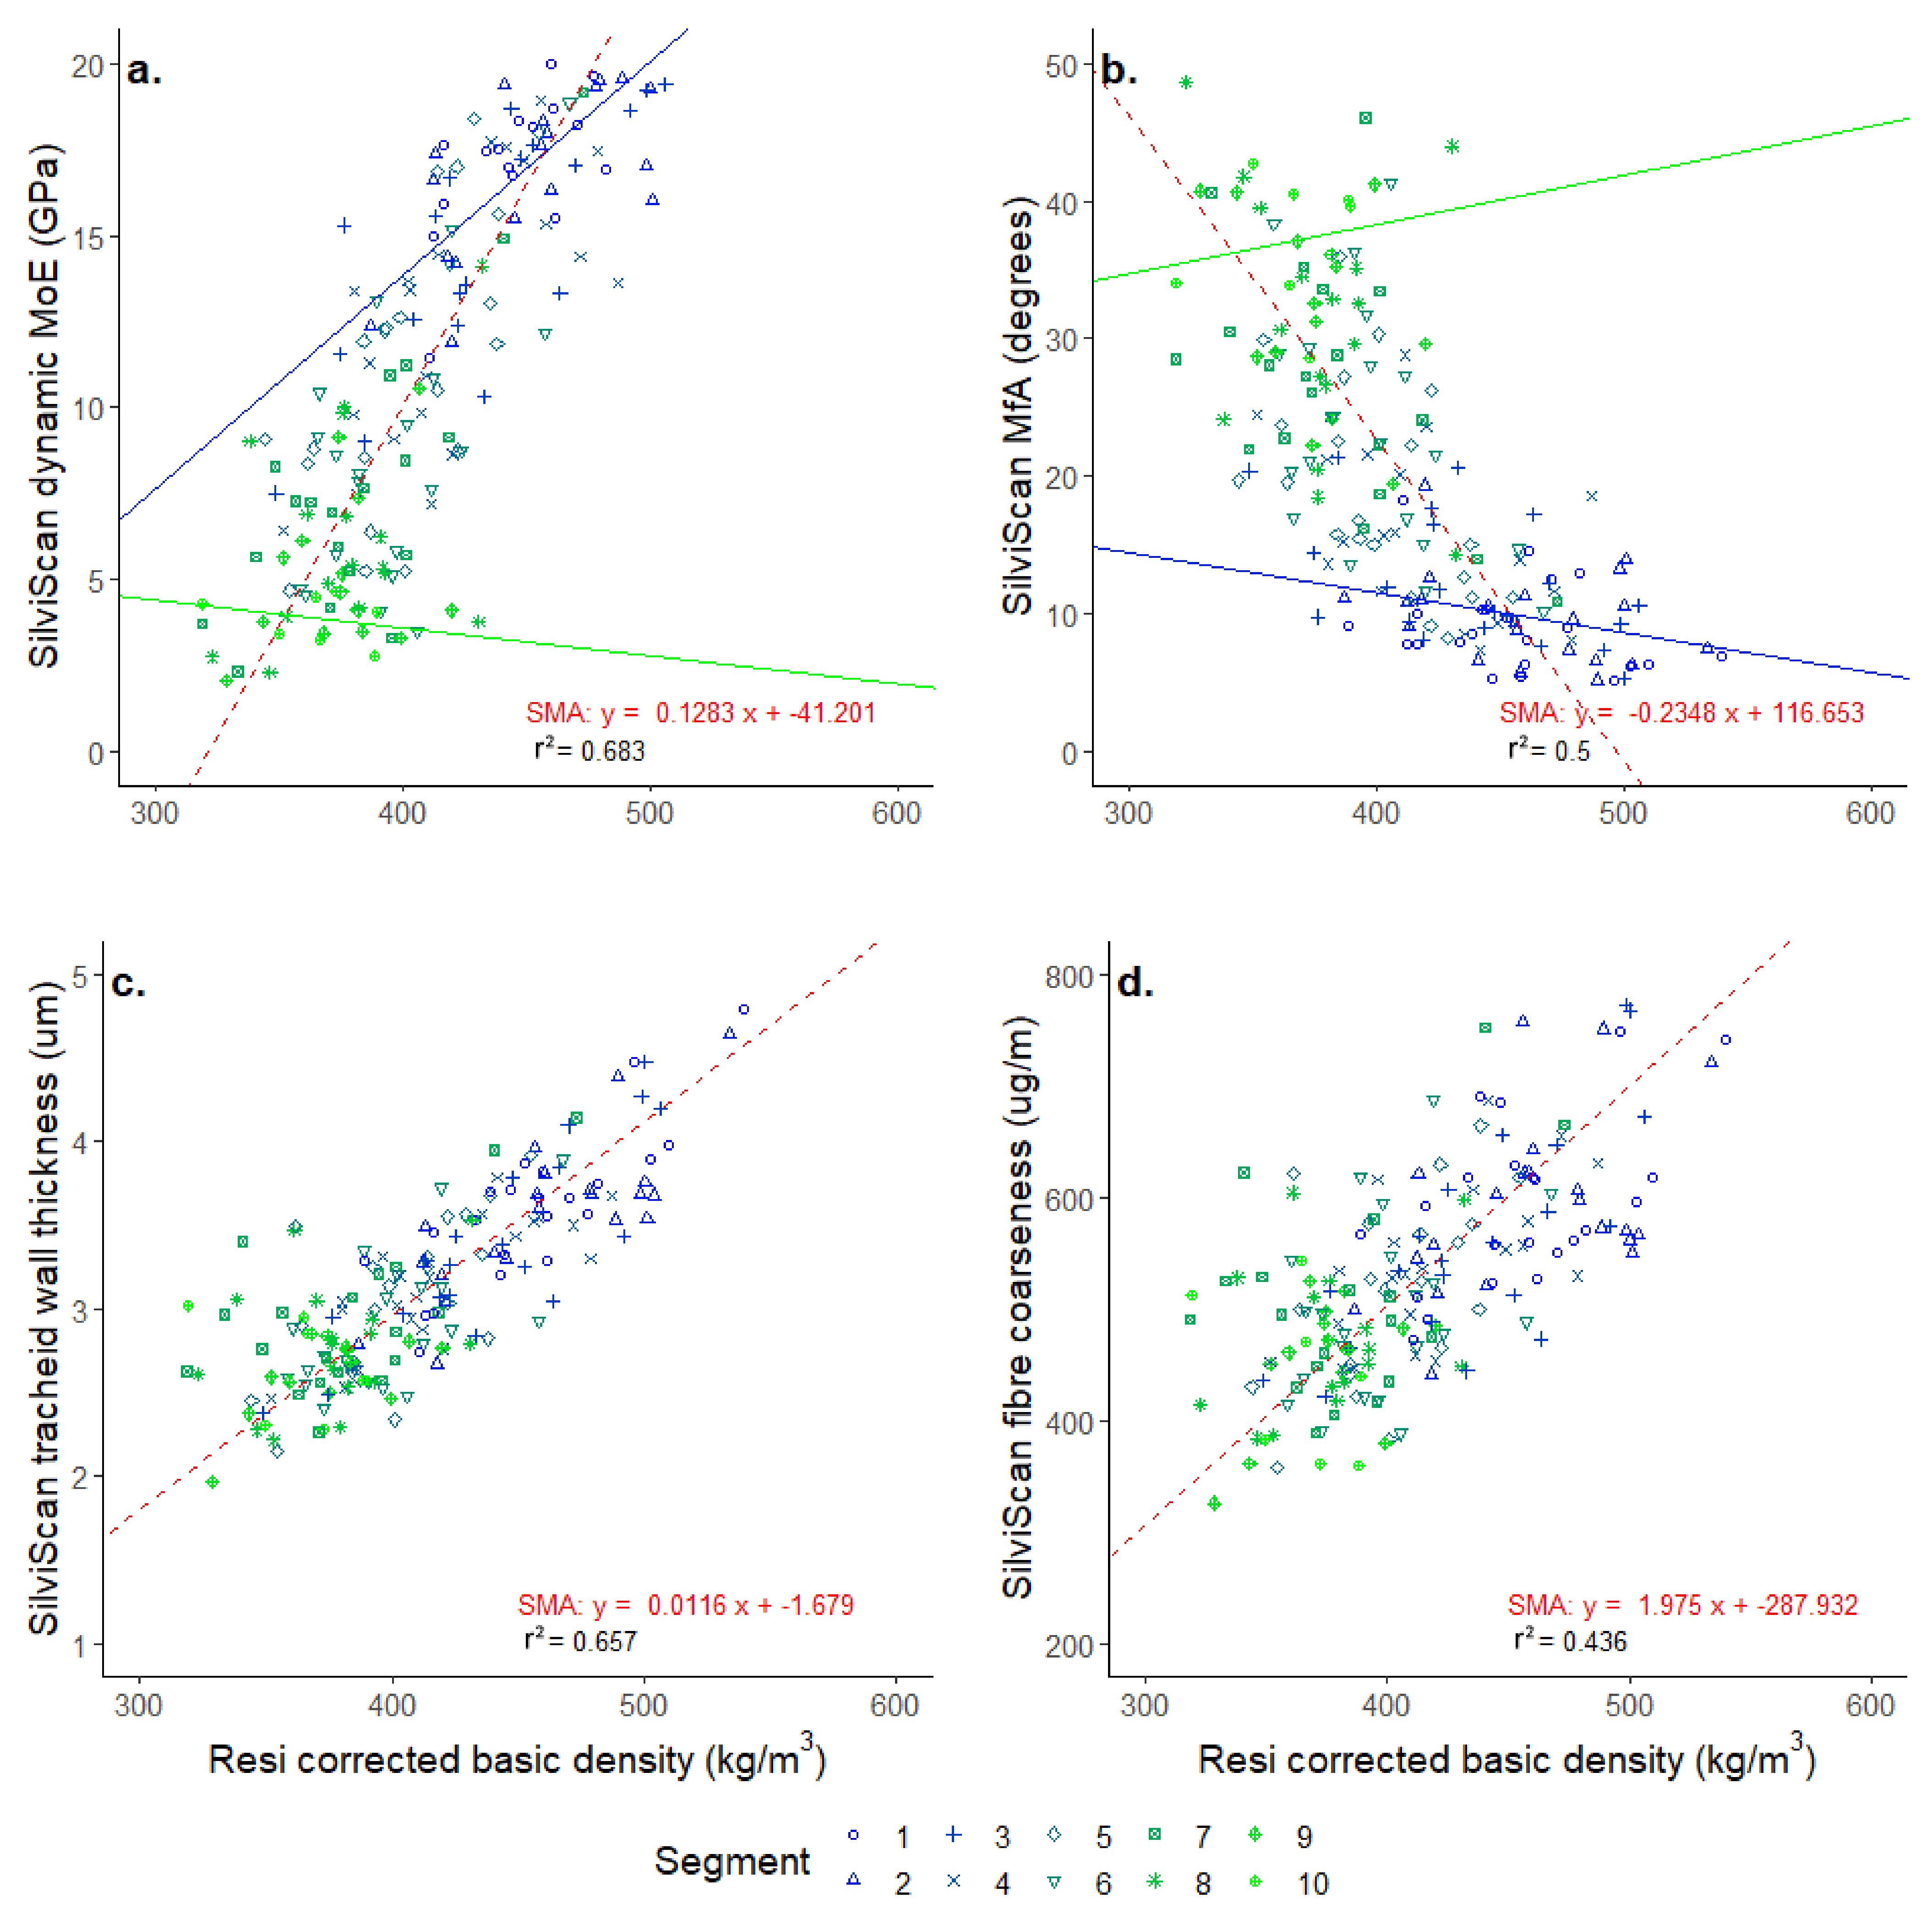
3.5. Comparisons with Other Wood Properties

SilviScan has the ability to measure a range of wood properties directly (e.g., density, radial and tangential cell diameter, and microfibril angle (MfA)) and indirectly (e.g., dynamic MoE, fibre wall thickness, fibre coarseness and specific surface area). Resi measures turning resistance, which is strongly correlated with basic density.
At the radial mean level, Resi amplitude explained only 15% of the variance in SilviScan dynamic MoE (data not shown). However, at the segment mean level, baseline-corrected Resi basic density explained 68% of the variance in the segment mean MoE (Figure 10a), 66% of the variance in fibre wall thickness (Figure 10c) and 43% of the variance in fibre coarseness (Figure 10d). Although there is no obvious reason why Resi amplitude would be affected by microfibril angle variation, through co-linearity between MfA and density, Resi-predicted density explained 50% of the variance in the MfA (Figure 10b).
Looking at the variance in Resi basic density and MfA within segments in those furthest from the bark (segments 9 & 10), it was evident that the relationship between basic density and MoE progressively disappeared as one approached the pith. The regression relationship between Resi density and MoE (Figure 10a) and MfA (Figure 10b) is shown as solid lines within segments 2 and 10. The positive slope in the segment 10 relationship between density and MfA may reflect a compression wood influence where density and MfA might be expected to increase together.

4. Discussion

The primary objective of this study was to explore the accuracy of the radial variation of the Resi data by comparison with radial variation obtained from SilviScan cores taken adjacent to the Resi sampling point. The radial sampling interval of the Resi (0.1 mm) combined with the lack of clarity of the annual ring boundaries in the samples did not allow this to be obtained using annual ring means as originally intended. Radial segments of a 10 mm width were used instead. Resi values were strongly and linearly correlated with those from SilviScan apart from a slight tendency to underestimate density over the first few centimetres. Resi values were also strongly correlated with SilviScan-measured MoE, albeit the relationship was weaker in segments closer to the pith.
The commercial use of resistance drilling for wood quality assessment is rapidly becoming part of routine inventory within much of the Australian plantation estate [13,14,18]. Interest is also growing elsewhere, with a range of companies utilizing web-based platforms for processing Resi data (Downes, pers. comm.). The strength of the correlation between Resi amplitude and basic density has been demonstrated in a range of other studies [25,26,27,28,29,30], and it is now used routinely in Australian tree breeding applications for that purpose [16,17,31,32]. Non-destructive evaluation of standing trees for wood quality has had a long history of development [7,20,33,34], and the main barrier to uptake has been cost of data collection and analysis. Application of resistance drilling combined with dedicated software for rapid, automated processing of large numbers of Resi traces has reduced the cost per tree to less than AUD 1 per tree, making it operationally cost-effective. The direction of the application has been on the estimation of plot or site mean basic density and MoE of the standing forest as an indicator or predictor of sawn board product and value. As such, the focus has been on the average wood property of the stem or log. The data here support the previous work, that the mean Resi amplitude value is strongly correlated with the mean basic density of the sampled tree at the point of sampling.
Building from this, current research is directed towards assessing radial variation in wood density with a view to better understand the effects of age and silviculture on radial patterns of variation, given their importance in defining commercial value [5,13]. A noted feature of the Resi trace is the presence of resistance on the needle after it exits the tree on the opposite side. This is attributable in large part to friction on the 1.5 mm diameter needle shaft resulting from the accumulation of drill chips. Many analyses involving resistance drilling employ a linear baseline correction [18,28], which assumes the linear accumulation of friction (resistance) from the beginning of the trace to the point of exit. The measurement of the magnitude of the resistance can be calculated and corrected after the needle exits the stem or log. However, given the shape of the cutting head of the needle and the radial variation in wood anatomy, chemistry, basic density and growth stresses within the tree, it is unlikely that the baseline correction is strictly linear. Previous work [19] had identified that the first 28–30 mm of the Resi trace tended to underestimate the basic density if a linear baseline correction was employed. Thus, the under-prediction of the first segment (Figure 8b) and the possible tendency for subsequent values to be over-predicted are important to quantify and in some applications, correct for. It is probable that the under-prediction is related to the progressive accumulation of drill chips around the needle shaft from the point of entry, interacting with the shape of the first 10 mm of the drilling needle. Therefore, an additional aspect for investigation is the effect of bark thickness on the non-linear corrections. Gendvilas et al. [19] used discs with bark removed; thus, the Resi traces started in wood immediately beneath the cambium.
This study has demonstrated that, compared to data generated by SilviScan, the radial variation in basic density derived from Resi traces can be relied on as an accurate indication of radial trends in radiata pine. This has also been demonstrated in other species [35]. Commercial interest in basic density is commonly used as a surrogate for understanding variance in log and board MoE, for which it is a good surrogate in mature, close-to-harvest trees. SilviScan has demonstrated its ability to provide robust measures of dynamic MoE [2], which have been shown to provide good indications of the sawn board outcome of logs [5]. In this study the Resi basic density was shown to be a good predictor of mean MoE at the individual segment level in segments further from the pith. Likewise, Sharapov et al. [36] also found good relationships between Resi amplitude and MoE of wood from a mix of four different species, including both softwoods and hardwoods. It has been noted in unpublished trials of younger trees that Resi density is a poorer predictor of stem MoE compared to acoustic data collected using devices such as FibreGen’s ST300 [7]. A current focus of this study is the conditions of stand age and silviculture when Resi estimates provide a commercially useful indicator of standing tree MoE.

5. Conclusions

  • Radial estimates of basic density in radiata pine derived from calibrated Resi traces are reasonably accurate representations of the true variation.
  • Estimated basic density values derived from annual means or segment means can be used to describe the within-tree pattern of wood density variance.
  • Further work is needed to better define the non-linear nature of the baseline correction needed to account for the reduced density in the first 30–50 mm. The extent to which this is affected by factors such as:
    material density (e.g., bark vs. wood);
    wood type (short-fibred hardwoods vs long-fibred softwoods);
    chip thickness (defined by RPM and feed speed sampling conditions);
    stand age.

Author Contributions

Conceptualization, G.M.D., D.M.D. and J.J.H.; methodology, G.M.D., D.M.D., D.J.L. and J.J.H.; formal analysis, G.M.D. and J.J.H.; resources, G.M.D., D.W. and P.M.; data collection, G.M.D., P.M., M.L. and J.J.H.; writing—original draft preparation, G.M.D.; writing—review and editing, G.M.D., J.J.H., D.M.D., M.L., P.M., D.W. and D.J.L.; project administration, D.J.L., G.M.D., D.W. and M.L.; funding acquisition, G.M.D., D.J.L. and D.W. All authors have read and agreed to the published version of the manuscript.

Funding

This research was funded by Forestry and Wood Products Australia project VNB459-1718 and PNB548-2021.

Data Availability Statement

The data and R code used in this study is available at https://github.com/GeoffDownes/Resi_SilviScanStudy (accessed on 18 April 2022). The original manuscript was drafted as an RMarkdown document which contains the source code used to analyse and process data and produce the figures.

Acknowledgments

This analysis was conducted as part of an FWPA-Industry project using Resi and SilviScan data collected during a previous FWPA-Industry funded project (VNB459-1718). It was overseen by the industry steering committee of the projects. Permission to sample trees was provided by Forest Corporation New South Wales.

Conflicts of Interest

The authors declare no conflict of interest.

References

  1. Evans, R. Rapid Measurement of the Transverse Dimensions of Tracheids in Radial Wood Sections from Pinus Radiata. Holzforshung 1994, 48, 168–172. [Google Scholar] [CrossRef]
  2. Evans, R. Wood Stiffness by X-ray Diffractometry. In Characterization of the Cellulosic Cell Wall; Stokke, D.D., Groom, L.H., Eds.; John Wiley & Sons: Oxford, UK, 2008; pp. 138–146. [Google Scholar]
  3. Evans, R.; Downes, G.; Menz, D.; Stringer, S. Rapid Measurement of Variation in Tracheid Transverse Dimensions in a Radiata Pine Tree. Appita J. 1995, 48, 134–138. [Google Scholar]
  4. Wang, X. Recent Advances in Nondestructive Evaluation of Wood. In-Forest Wood Quality Assessments. Forests 2021, 12, 949. [Google Scholar] [CrossRef]
  5. McKinley, R.; Ball, R.; Downes, G.; Fife, D.; Gritton, D.; Ilic, J.; Koehler, A.; Morrow, A.; Pongracic, S. Resource Evaluation for Future Profit: Wood Property Survey of the Green Triangle Region; CSIRO Client Report 1385; CSIRO Forestry and Forest Products: Canberra, Australia, 2003. [Google Scholar]
  6. Jayawickrama, K.J.S. Breeding Radiata Pine for Wood Stiffness: Review and Analysis. Aust. For. 2001, 64, 51–56. [Google Scholar] [CrossRef]
  7. Schimleck, L.; Dahlen, J.; Apiolaza, L.A.; Downes, G.; Emms, G.; Evans, R.; Moore, J.; Pâques, L.; Van den Bulcke, J.; Wang, X. Non-Destructive Evaluation Techniques and What They Tell Us about Wood Property Variation. Forests 2019, 10, 728. [Google Scholar] [CrossRef] [Green Version]
  8. Downes, G.M.; Nyakuengama, J.G.; Evans, R.; Northway, R.; Blakemore, P.; Dickson, R.L.; Lausberg, M. Relationship between Wood Density, Microfibril Angle and Stiffness in Thinned and Fertilized Pinus Radiata. IAWA J. 2002, 23, 253–265. [Google Scholar] [CrossRef]
  9. Nyakuengama, J.G.; Downes, G.M.; Ng, J. Growth and Wood Density Responses to Later-Age Fertilizer Application in Pinus Radiata. IAWA J. 2002, 23, 431–448. [Google Scholar] [CrossRef]
  10. Ivković, M.; Gapare, W.; Wu, H.; Espinoza, S.; Rozenberg, P. Influence of Cambial Age and Climate on Ring Width and Wood Density in Pinus Radiata Families. Ann. For. Sci. 2013, 70, 525–534. [Google Scholar] [CrossRef] [Green Version]
  11. Wu, H.X.; Ivkovic, M.; Gapare, W.J.; Matheson, A.C.; Baltunis, B.S.; Powell, M.B.; McRae, T.A. Breeding for Wood Quality and Profit in Pinus Radiata: A Review of Genetic Parameter Estimates and Implications for Breeding and Deployment. N. Z. J. For. Sci. 2008, 38, 56–87. [Google Scholar]
  12. Downes, G.M.; Drew, D.M.; Moore, J.; Lausberg, M.; Harrington, J.; Elms, S.; Watt, D.; Holtorf, S. Fwpa Report Pnc325-1314: Evaluating and Modelling Radiata Pine Wood Quality in the Murray Valley Region; Forest and Wood Products Australia: Melbourne, Australia, 2016; p. 151. [Google Scholar]
  13. Bailleres, H.; Lee, D.; Kumar, C.; Psaltis, S.; Hopewell, G.; Brancheriau, L. Improving Returns from Southern Pine Plantations through Innovative Resource Characterisation; Forest & Wood Products Australia Limited: Melbourne, Australia, 2019. [Google Scholar]
  14. Downes, G.M.; Drew, D.M.; Lee, D. Fwpa Project Vnb459-1718: Validated Softwood Stiffness Predictions Using Iml-Resi and Ecambium; Forest and Wood Products Australia: Melbourne, Australia, 2019; p. 160. [Google Scholar]
  15. Gendvilas, V.; Downes, G.M.; Neyland, M.; Hunt, M.; Harrison, P.A.; Jacobs, A.; Williams, D.; O’Reilly-Wapstra, J. Thinning Influences Wood Properties of Plantation-Grown Eucalyptus nitens at Three Sites in Tasmania. Forests 2021, 12, 1304. [Google Scholar] [CrossRef]
  16. Fundova, I.; Funda, T.; Wu, H.X. Non-Destructive Assessment of Wood Stiffness in Scots Pine (Pinus Sylvestris L.) and Its Use in Forest Tree Improvement. Forests 2019, 10, 491. [Google Scholar] [CrossRef] [Green Version]
  17. Nickolas, H.; Williams, D.; Downes, G.; Harrison, P.A.; Vaillancourt, R.E.; Potts, B.M. Application of Resistance Drilling to Genetic Studies of Growth, Wood Basic Density and Bark Thickness in Eucalyptus globulus. Aust. For. 2020, 83, 172–179. [Google Scholar] [CrossRef]
  18. Downes, G.M.; Lausberg, M.; Potts, B.M.; Pilbeam, D.L.; Bird, M.; Bradshaw, B. Application of the Iml Resistograph to the Infield Assessment of Basic Density in Plantation Eucalypts. Aust. For. 2018, 81, 177–185. [Google Scholar] [CrossRef]
  19. Gendvilas, V.; Downes, G.M.; Neyland, M.; Hunt, M.; Jacobs, A.; O’reilly-Wapstra, J. Friction Correction When Predicting Wood Basic Density Using Drilling Resistance. Holzforschung 2020, 75, 508–516. [Google Scholar] [CrossRef]
  20. Downes, G.M.; Hudson, I.L.; Raymond, C.A.; Dean, G.H.; Michell, A.J.; Schimleck, L.R.; Evans, R.; Muneri, A. Sampling Plantation Eucalypts for Wood and Fibre Properties; CSIRO Publishing: Melbourne, Australia, 1997. [Google Scholar]
  21. Siau, J.F. Wood: Influence of Moisture on Physical Properties; Department of Wood Science and Forest Products, Virginia Polytechnic: Blacksburg, VA, USA, 1995. [Google Scholar]
  22. R Core Team. R: A Language and Environment for Statistical Computing; R Foundation for Statistical Computing: Vienna, Austria, 2020. [Google Scholar]
  23. Allaire, J.J.; Xie, Y.; McPherson, J.; Luraschi, J.; Ushey, K.; Atkins, A.; Wickham, H.; Cheng, J.; Chang, W.; Iannone, R. Rmarkdown: Dynamic Documents for R; R Package Version 2. 2022. Available online: https://cran.r-project.org/package=rmarkdown (accessed on 18 April 2022).
  24. RStudio. Rstudio: Integrated Development for R; PBC: Boston, MA, USA, 2012. [Google Scholar]
  25. Rinn, F.; Schweingruber, F.H.; Schär, E. Resistograph and X-ray Density Charts of Wood. Comparative Evaluation of Drill-Resistance Profiles and X-ray Density Charts of Different Wood Species. Holzforschung 1996, 50, 303–311. [Google Scholar] [CrossRef]
  26. Sharapov, E.; Chernov, V.; Toropov, A.; Smirnova, E. The Impact of Moisture Content on Accuracy of Wood Properties Evaluation by Drilling Resistance Measurement Method. Lesnoy Zhurnal 2016, 2, 7–18. [Google Scholar]
  27. Sharapov, E.; Brischke, C.; Militz, H. Assessment of Preservative-Treated Wooden Poles Using Drilling-Resistance Measurements. Forests 2020, 11, 20. [Google Scholar] [CrossRef] [Green Version]
  28. Fundova, I.; Funda, T.; Wu, H.X. Non-Destructive Wood Density Assessment of Scots Pine (Pinus sylvestris L.) Using Resistograph and Pilodyn. PLoS ONE 2018, 13, e0204518. [Google Scholar] [CrossRef]
  29. Kloppenburg, A.M. Density Determination of Tropical Hardwoods with the Resistograph. Master’s Thesis, Delft University of Technology, Delft, The Netherlands, 2018. [Google Scholar]
  30. Gao, S.; Wang, X.; Brashaw, B.K.; Ross, R.J.; Wang, L. Rapid Assessment of Wood Density of Standing Tree with Nondestructive Methods—A Review. In Proceedings of the 2012 International Conference on Biobase Material Science and Engineering (BMSE), Changsha, China, 21–23 October 2012. [Google Scholar]
  31. Eckard, J.T.; Isik, F.; Bullock, B.; Li, B.; Gumpertz, M. Selection Efficiency for Solid Wood Traits in Pinus taeda Using Time-of-Flight Acoustic and Micro-Drill Resistance Methods. For. Sci. 2010, 56, 233–241. [Google Scholar]
  32. Walker, T.D.; Isik, F.; McKeand, S.E. Genetic Variation in Acoustic Time of Flight and Drill Resistance of Juvenile Wood in a Large Loblolly Pine Breeding Population. For. Sci. 2019, 65, 469–482. [Google Scholar] [CrossRef]
  33. Mahon, J.M.; Jordan, L.; Schimleck, L.R.; Clark, A.; Daniels, R.F. A Comparison of Sampling Methods for a Standing Tree Acoustic Device. South. J. Appl. For. 2009, 33, 62–68. [Google Scholar] [CrossRef] [Green Version]
  34. Schimleck, L.R.; Evans, R. Estimation of Wood Stiffness of Increment Cores by near Infrared Spectroscopy: The Development and Application of Calibrations Based on Selected Cores. IAWA J. 2002, 23, 217–224. [Google Scholar] [CrossRef]
  35. Tomczak, K.; Tomczak, A.; Jelonek, T. Measuring Radial Variation in Basic Density of Pendulate Oak: Comparing Increment Core Samples with the Iml Power Drill. Forests 2022, 13, 589. [Google Scholar] [CrossRef]
  36. Sharapov, E.; Brischke, C.; Militz, H.; Smirnova, E. Prediction of Modulus of Elasticity in Static Bending and Density of Wood at Different Moisture Contents and Feed Rates by Drilling Resistance Measurements. Eur. J. Wood Wood Prod. 2019, 77, 833–842. [Google Scholar] [CrossRef]
Figure 1. Locations of the nine sample sites in northern NSW, Australia.
Forests 13 00751 g001
Figure 2. Twenty trees were selected as sawlogs from each site. Plugs were inserted in the outerwood core sampling hole to assist in identifying individual butt logs in the log yard, and on three trees per site full radius cores were taken for SilviScan analyses.
Forests 13 00751 g002
Figure 3. Disc cross section illustrating the effect on measured radial length of SilviScan profiles (yellow line) and Resi traces (red line). The white arrow and asterisk indicate the direct bark-to-pith trajectory obtained from the SilviScan analyses (see text for details).
Forests 13 00751 g003
Figure 4. A typical surface image used by SilviScan to determine fibre dimensions on the right-hand side. On the left is a SilviScan bark-to-pith strip prepared from the increment core that was missing the pith. The red arrows illustrate the orientation of the rays (and the direction of the pith), that are vertically aligned in the microscope image used by SilviScan. The width of the radial strip in the left-hand image is 2 mm. The right-hand image from top to bottom represents 1 mm of radial distance.
Forests 13 00751 g004
Figure 5. The correlation between outerwood core basic density and (a) mean outerwood Resi amplitude and (b) outerwood SilviScan means was strong. (c) Resi values were likewise strongly correlated with the SilviScan outerwood values.
Forests 13 00751 g005
Figure 6. SilviScan sample length (a) and basic density (b) were strongly correlated with the pith-to-bark length and mean resistance determined from the Resi trace.
Forests 13 00751 g006
Figure 7. Narrow and false ring structures made accurate annual ring detection impossible in many samples, especially in the lower-resolution Resi (upper red) traces compared to the SilviScan (lower blue) profiles. (a) good correspondence between the Resi traces and SS profiles and evident. In contrast (b) illustrates a samples where annual ring structure is unclear in both the Resi and SS data. Blue vertical lines indicate annual ring positions allocated in SilviScan profiles.
Forests 13 00751 g007
Figure 8. (a) The mean Resi-predicted density of 20 mm segments was compared to the SilviScan density values for each Resi instrument. (b) The effect of distance from the cambium on the difference between SilviScan and Resi mean basic density.
Forests 13 00751 g008
Figure 9. (a) The differences between segment and SilviScan density values plotted as distance from the entry into the bark. (b) Mean corrected Resi-predicted density of 10 mm segments compared to the SilviScan density values. (c) The logarithmic correction removed the under-prediction of the first segment.
Forests 13 00751 g009
Figure 10. Resi-corrected density was strongly correlated with (a) SilviScan MoE, (b) MfA, (c) tracheid wall thickness and (d) fibre coarseness. The solid lines in (a,b) indicate the slope of the regressions within segments 2 (close to bark) and 10 (close to pith).
Forests 13 00751 g010
Table 1. Site data for SilviScan and Resi analysis.
SiteAnnual Rainfall (mm)Elevation (mASL)Plant YearInitial Stocking (sph)Thinning YearThinned Stocking (sph)Previous Land UseResidual Stocking (sph)No.Trees
1952118919911122NANAForest112220
2927122119881288NANAForest100720
38321066198610802001600Pasture41921
482366919871100NANAPasture45220
584996419911100NANAPasture107320
69069291986815NANAForest81522
79491042198711001992600Pasture48621
89521204199011002004/2011800Forest29420
976376819851100NANAPasture54920
Publisher’s Note: MDPI stays neutral with regard to jurisdictional claims in published maps and institutional affiliations.

