Article

Effects of Nitrogen and Phosphorus Additions on Soil N2O Emissions and CH4 Uptake in a Phosphorus-Limited Subtropical Chinese Fir Plantation

1
State Key Laboratory of Subtropical Silviculture, Zhejiang A&F University, Hangzhou 311300, China
2
College of Environmental and Resource Sciences, Zhejiang A&F University, Hangzhou 311300, China
3
The Forestry Industry Development Administration, Xinyu 338000, China
*
Author to whom correspondence should be addressed.
Submission received: 12 April 2022 / Revised: 14 May 2022 / Accepted: 15 May 2022 / Published: 17 May 2022

Abstract

:
Increased nitrogen (N) inputs in subtropical forest ecosystems were widely reported. Extra N additions were reported to cause nutrient imbalance and phosphorus (P) limitation in many tropical and subtropical forests, and further result in changes in soil nitrous oxide (N2O) and methane (CH4) fluxes. Here, we conducted experiments with N (high N addition: 15 g N/m2, HN), P (low: 5 g P/m2, LP; high: 15 g P/m2, HP) and their interactive (HNLP and HNHP) treatments to investigate how N and P additions affected CH4 and N2O exchanges in an N-rich Chinese fir plantation (Cunninghamia lanceolata), and further explored the underlying mechanisms through the structural equation model (SEM) analysis. The results indicated that N addition alone (HN) significantly (p < 0.05) increased the soil N2O emissions by 30.15% and 80.47% over annual and 4-month periods, mainly owing to the elevated NH4+-N content. P addition alone (LP and HP) did not significantly affect the soil N2O emissions as compared with the control. The SEM analysis indicated that increased N2O emissions under N addition were primarily explained by the increase in available N and contributed more to the stimulated NH4+-N contents. N and P interactive additions slightly (not significant) stimulated the N2O emissions as compared with that under the N addition alone treatment. High-dose P addition significantly increased the soil CH4 uptake by 15.80% and 16.23% under the HP and HNHP treatments, respectively, while N addition alone and low P addition (LP and HNLP) did not significantly affect CH4 uptake as compared with the control. The increased water-soluble organic carbon and microbial biomass carbon explained the increased CH4 uptake under high P addition. The fertilization effects on N2O emissions and CH4 uptake mainly occurred in the first 4 months and diminished after that. Our results suggested that the direction, magnitude and timing of the N and P addition effects on N2O emissions and CH4 uptake would depend on the soil nutrient status and plant–microbial competition for N and P in subtropical forests.

1. Introduction

Global warming has led to frequent extreme climates and natural disasters worldwide [1]. Carbon dioxide (CO2), methane (CH4) and nitrous oxide (N2O) are the three most important greenhouse gases that contribute to global warming [2,3,4,5]. The methane concentration in the atmosphere increases at 5.7 ppb/year [6], while the N2O concentration increases at a rate of 0.8 ppb/year [7]. At present, methane contributes about 20% to global warming [8], while N2O contributes more than 5% to global warming [1]. It is important to identify and quantify the source, sink and factors controlling the levels of atmospheric CH4 and N2O.
Most of the atmospheric N2O is produced and consumed by soil processes [9,10]. Soil N availability is the main driver of N2O production. Many previous studies indicated that terrestrial soil N2O emissions have been increasing since the industrial era and is primarily due to the elevated N deposition and fertilization [3,11,12,13]. The potential mechanisms regulating the responses of soil N2O production and consumption to elevated N inputs were well summarized [10,14,15]. Phosphorus (P) availability is another important factor controlling N2O emissions in forest ecosystems [12,16]. P is generally found to be the main limiting nutrient in the tropical and subtropical forest ecosystems due to the low P supply from highly weathered soil and relatively high N input, which stimulates more P uptake by plants and microbes [17]. Microbial processes, including nitrification or denitrification, were also suggested to be limited by P availability [16,18]. Many previous studies indicated that P addition can effectively reduce soil N2O emissions stimulated by N addition [12,16,19,20,21]. These studies indicated that P addition may result in increases in plant N uptake or microbial N immobilization, and thus, reduce the soil N availability for N2O production. However, there are a few reports showing that P addition only slightly reduces or even enhances N2O emissions under an N addition condition. These studies argued that P addition can stimulate soil N cycling and alleviate P limitation on nitrifying and denitrifying bacteria, and thus, enhance the N2O emissions [18,19,22,23,24,25,26]. Shen and Zhu [15] conducted a meta-analysis of the effects of both N and P additions on N2O emissions and concluded that P addition significantly reduced soil N2O emissions under elevated N input; however, their meta-analysis only collected 30 studies and a few of them indicated P addition increased N2O emissions under N addition. More studies are needed to uncover the underlying mechanisms controlling N2O emissions under both N and P additions.
At present, the location and strength of soil CH4 sources and sinks are poorly constrained [27]. In well-drained soils, CH4 oxidation normally dominates [28]. Soil environmental factors, the soil microbe community, and carbon and nutrient availability generally control soil CH4 oxidation [29,30,31]. The ammonium-oxidizing and methanotrophic bacteria are responsible for CH4 oxidation [27]. Nitrogen input was been found to inhibit soil CH4 uptake in forests [32,33,34,35,36,37]. High concentrations of inorganic N, especially ammonium (NH4+), were reported to inhibit the methanotrophic activity and high contents of nitrate (NO3) can inhibit methanogenesis [28,34,38,39]. In a meta-analysis, Liu and and Greaver [10] concluded that N addition reduced CH4 uptake by 38% based on a meta-analysis of N addition experiments due to changes in the activity of methanotrophs and methanogens. However, N availability can also limit the metabolic activities of methanotrophic bacteria [40,41]; therefore, some studies also showed that N addition can stimulate CH4 uptakes in N-limited forest soils [42,43].
In addition to N availability, P is a critical nutrient for methanotrophic bacteria and methanogenic archaea. Much less information is available on the effects of P availability on soil CH4 fluxes, especially for forests [27,44]. Both stimulation and inhibition were found for P addition effects on forest CH4 uptake [35,45,46,47]. For example, in a heavily fertilized subtropical forest, P addition alleviated the effects of added N on CH4 uptake and stimulated root growth and soil methanotrophy activity [35,37,46], and thus, increased the CH4 uptake. Furthermore, inhibitive effects on CH4 uptake may be also due to the decreases in soil P availability caused by increases in soil acidity following N inputs [45,47].
Forest soil releases about 2.7–5.4 Tg N/year as N2O, accounting for about 38% of terrestrial emissions [48], among which, about 14% is from subtropical forests [49]. In addition, upland subtropical forests are important CH4 sinks [11]. Recent studies indicated that N2O emissions and CH4 fluxes from subtropical forests may be underestimated due to insufficient field measurements [50,51,52]. Direct evidence of soil N and P availability on soil N2O and CH4 emissions in the subtropical forests is even less [16,19]. Subtropical China has received very high atmospheric N deposition [53], and a recent meta-analysis study [15] indicated that this region is mostly N-rich and P-limited. It is necessary to understand how N and P additions affect N2O and CH4 fluxes under this continuous high-dose N input. Several studies were conducted for addressing the effects of N, P and their combined additions on forest soil N2O and CH4 fluxes in subtropical China [12,19,26,35,47,50,54,55,56,57,58]. Contrasting results were found for the effects, suggesting that our understanding of the mechanisms that lead to elevated N and P inputs affecting the direction, magnitude and timing of N2O and CH4 fluxes in N-rich and P-limited subtropical forests are not clearly understood. More experimental studies are needed to unravel these mechanisms.
In this study, we conducted a manipulative experiment to investigate N and P addition and their interactions on soil CH4 and N2O emissions in a subtropical plantation forest in southern China. Based on the results of previous studies, we hypothesized that (1) N addition inhibits CH4 uptake due to increased soil N availability, (2) P addition reduces soil N2O emissions due to stimulated activities of soil microbes from the relief of P limitation under ambient N condition, (3) P addition stimulates CH4 uptake due to stimulated microbial activities and (4) P addition alleviates N2O emissions under N addition.

2. Materials and Methods

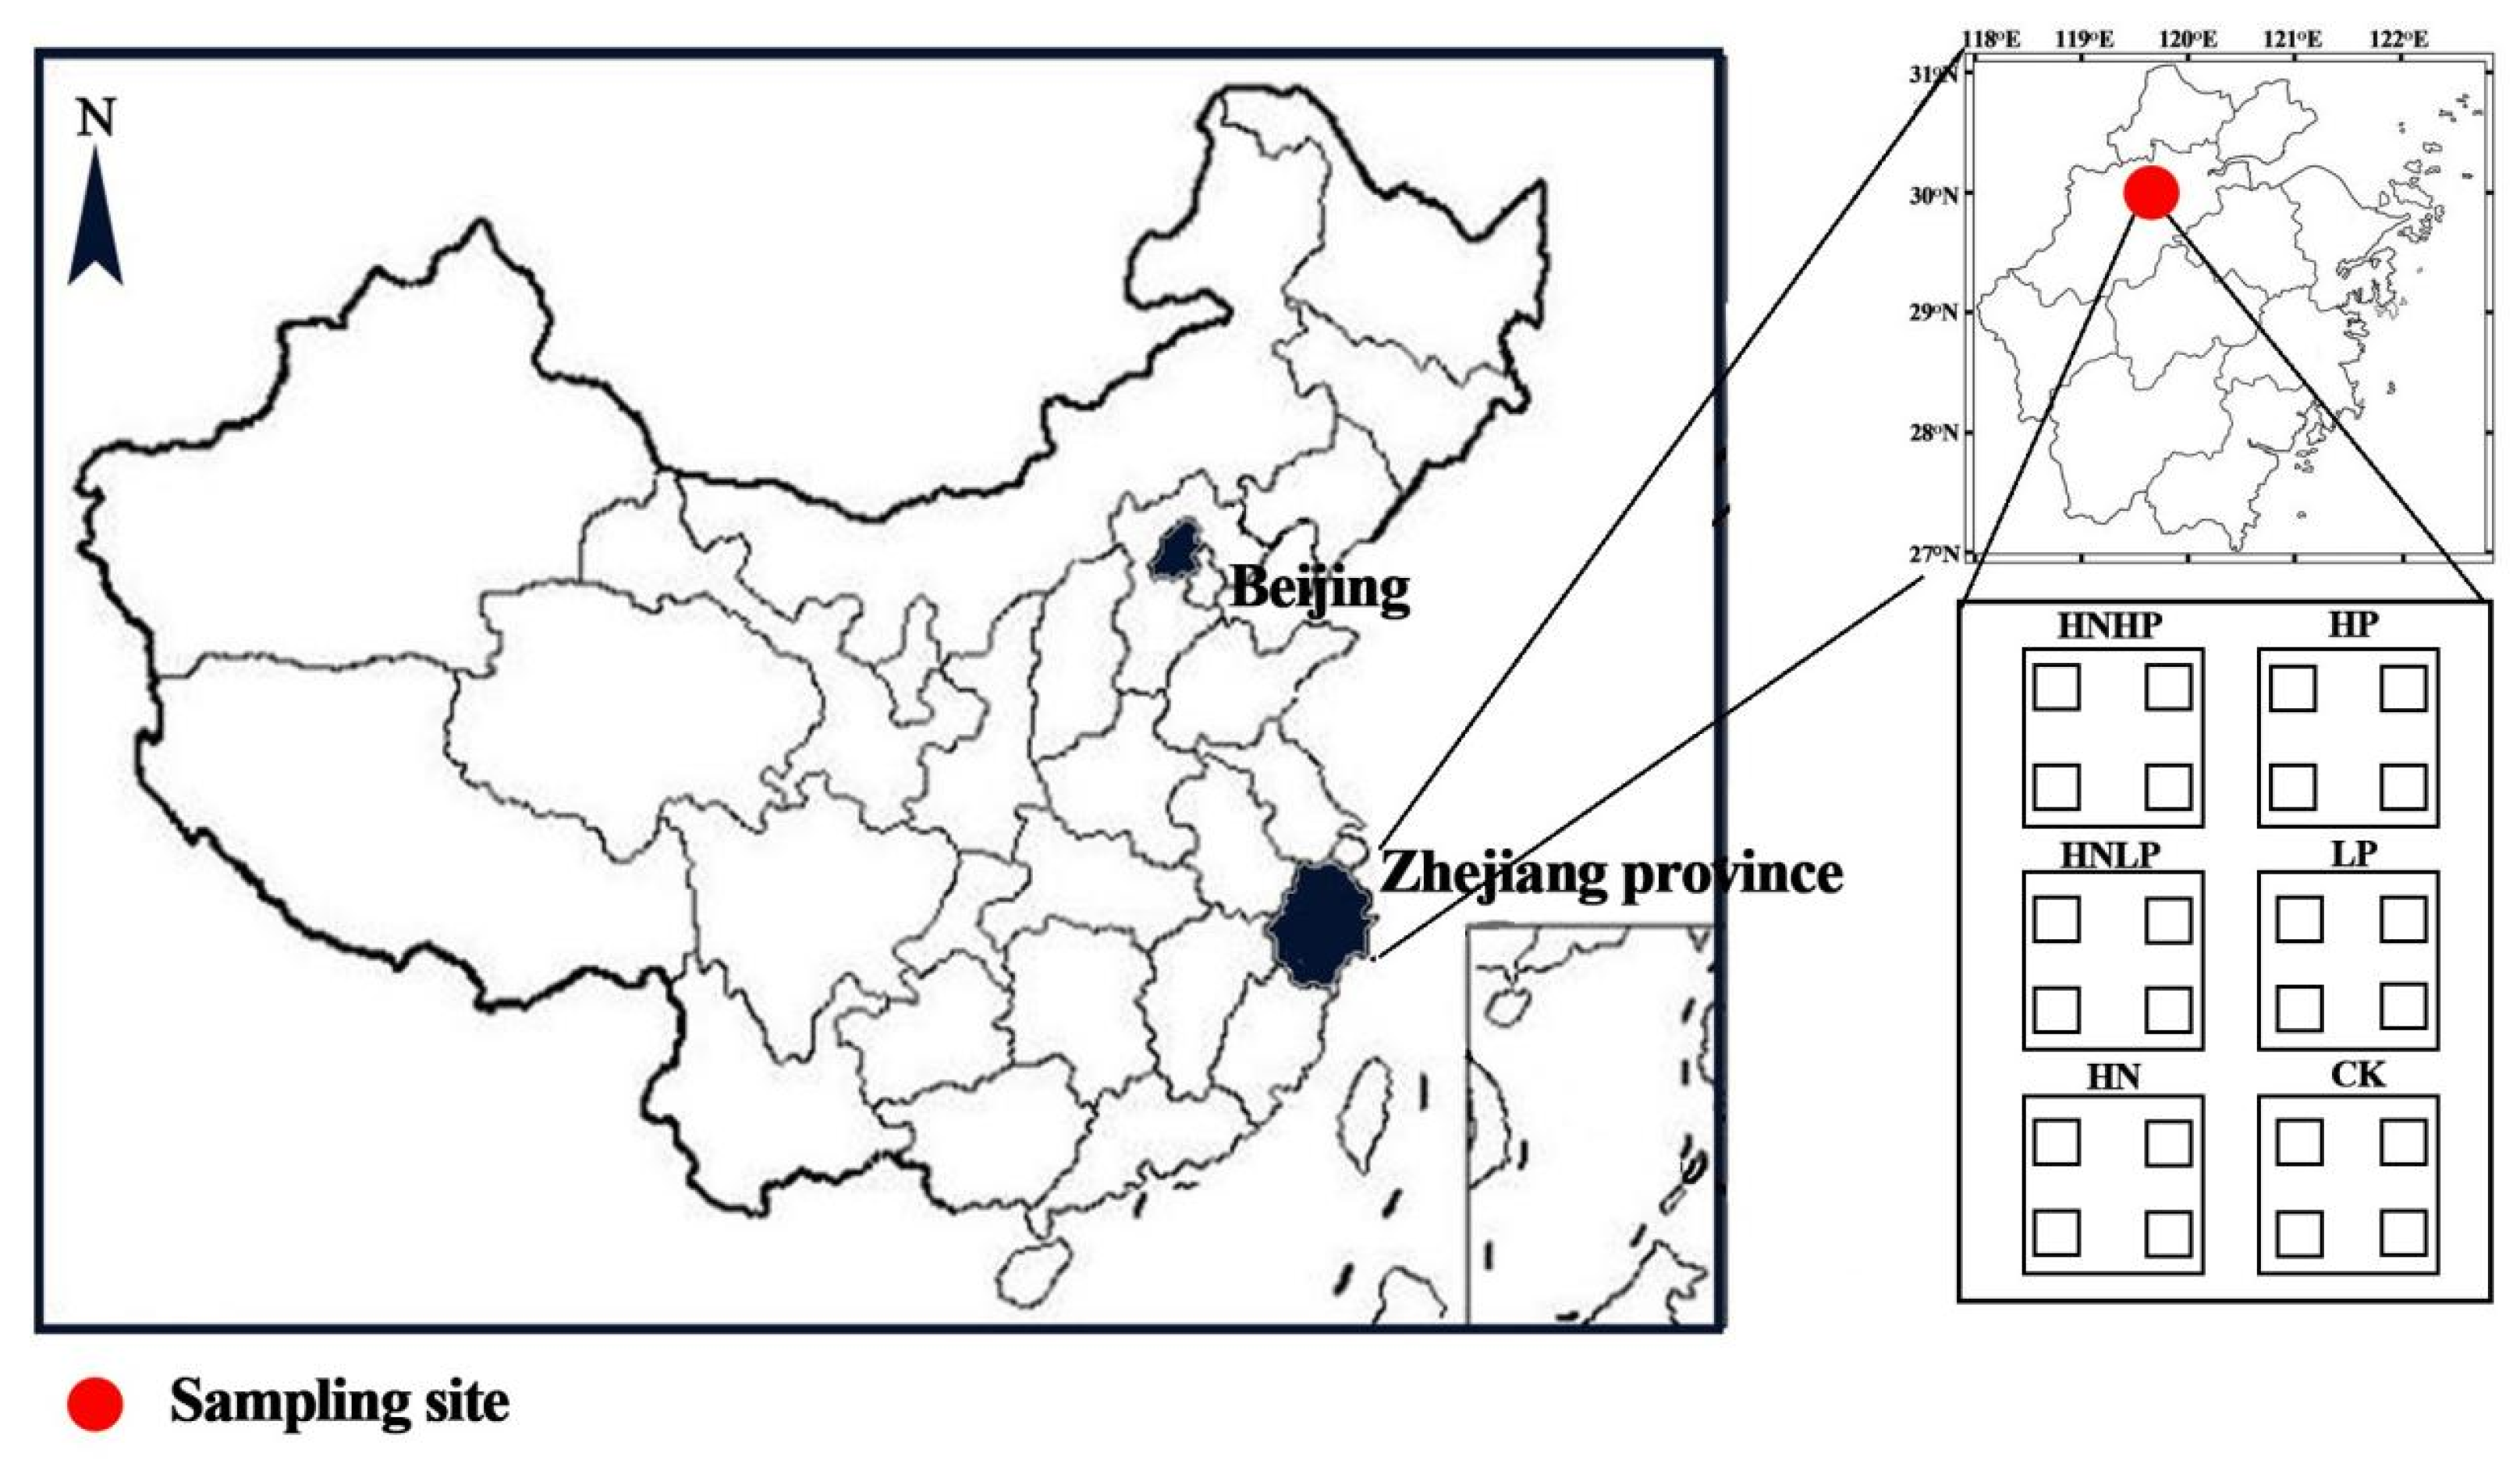
2.1. Site Description

The study site was located at Wulitou forest station (119.67° E and 30.21° N), Hangzhou City, Zhejiang Province, China (Figure 1). The study site has a subtropical monsoon climate, with an average annual temperature of 16.4 °C and rainfall of 1614 mm. The mean altitude is 175 m and the annual sunshine hours are 1847.3 h [59]. The study plots were selected from a planted pure Chinese fir (Cunninghamia lanceolata) forest (dominating at 90%), with a few Moso bamboo (Phyllostachys Edulis) trees scattered around. The aspect of the sample plot is southwest, and the slope is less than 15°. The mean stand density is 1311 stems·ha−1, the average DBH (diameter at breast height) and tree height are 10.9 cm and 7.7 m, respectively. The content of soil organic carbon (SOC) in the 20 cm layer is 15.40 g·kg−1, soil total P is 0.36 g·kg−1, soil total N (TN) is 0.86 g·kg−1, pH is 4.45 and soil bulk density is 1.32 g/cm3. The leaf N:P ratio is 23.89. According to the N:P ratio [60], this forest can be determined as N-rich and P-limited since the N:P ratio is greater than 16 [17]. The soil NH4+-N and NO3-N concentrations are 12.62 and 3.71 mg.kg−1, respectively. The soil belongs to the Ferralsols (Oxisols) soil type and the texture is composed of coarse sand (>250 μm; 67%), fine sand (53 μm~250 μm; 19%) and silty clay (<53 μm; 14%). The annual atmospheric N deposition was 3.16 g N/m2/year in 2016 at the study site [53].

2.2. Experimental Design

Six plots with a 20 m × 20 m area were established on 15 February 2019 in the selected 10-year-old Chinese fir forest (Figure 1). All plots were far away from the forest edge and were separated by a 5 m buffer zone to avoid the impacts of adjacent treatments. The static chamber method was used to collect CH4 and N2O gases. The static chamber is divided into two parts, a top chamber (30 cm for length, width and height) and a base (20 cm height; 10 cm width), both of which were made of PVC hard plastic board. Four static chambers were established at the four corners of each plot, which served as four replicates in each treatment. The static chamber base was deployed on 15 February 2019 and inserted 10 cm into the ground. The chamber design and techniques were described in many previous studies [12,35].
Six treatments were applied:
(1)
Control (CK);
(2)
Add 15 g N/m2 (HN);
(3)
Add 15 g N/m2 and 5 g P/m2 (HNLP);
(4)
Add 5 g P/m2 (LP);
(5)
Add 15 g N/m2 and 15 g P/m2 (HNHP);
(6)
Add 15 g P/m2 (HP).
The fertilizer types were urea (CO(NH2)2) for N and sodium hydrogen phosphate (NaH2PO4) for P. We chose analytical grade P chemicals to prevent the addition of micronutrients, such as molybdenum, that may influence other processes not attributable to P. According to our preliminary test before the experimental design, the ambient soil available N, atmospheric N deposition and leaf N:P ratios were very high. According to the C:N:P stoichiometric balance, the soil in the study site could be determined as N-rich and P-limited, which was also indicated by Du et al. [17]. Therefore, only a high N addition level (15 g N/m2) was applied. The low and high P treatment levels were determined according to the previous studies in subtropical China [12,26,55]. Each plot was divided into four 5 m × 5 m grids, and fertilizer was evenly applied in each grid. During the fertilizer application, each chamber base area received the respective amount of fertilizer. The fertilizer was applied on 20 March 2019. No rainfall occurred within 5 days after fertilization.

2.3. Soil Sampling and Chemical Analyses

Soil samples were taken at three-month intervals from 19 March 2019 (1 day before treatments) to 20 May 2020. Three soil cores at a 0–20 cm soil depth were collected around each chamber using a soil corer (2.5 cm inner diameters), and mixed as one soil sample; therefore, four soil samples were taken for each plot. Soil samples were sieved using a 2 mm sifter to remove litter, rocks and roots. A portion of the soil samples was stored at 4 °C, and the rest was air-dried for chemical analysis.
Soil pH was measured using solutions with a soil–water ratio of 1:2.5 using a pH meter (Mettler Toledo, Switzerland). SOC was measured using dichromate oxidation and titration with ferrous ammonium sulfate [61]. Soil microbial biomass C (MBC) and N (MBN) were measured using the chloroform fumigation–K2SO4 extraction method [62]. Water-soluble soil organic carbon (WSOC) was extracted with 0.5 M K2SO4 and analyzed using a total carbon analyzer (Shimadzu model TOC-500, Kyoto, Japan) [63]. The total N concentration was measured using semimicro-Kjeldahl digestion, and the total P concentration was measured spectrophotometrically after HClO4-H2SO4 digestion [61]. The KCl extraction–indophenol blue colorimetric method was used to extract and determine the soil NH4+-N, and the KCl extraction–ultraviolet spectrophotometric method was used to extract and determine the NO3-N concentration.

2.4. Leaf and Litter Sampling and Chemical Analysis

The fresh leaves and floor litter were sampled twice (before and after treatments) during the study period. The leaf and litter samples were dried for 48 h at 80 °C to a constant mass and ground into powder. The leaf and litter C concentrations were determined using the potassium dichromate–sulfuric acid digestion method. The leaf and litter N concentrations were extracted using HClO4-H2SO4 digestion and determined by the Kjeldahl method. The leaf and litter P concentrations were determined by HClO4-H2SO4 method.

2.5. Greenhouse Gases (GHGs) Data Collection and Measurements

The first GHGs sampling was conducted on 20 March 2019 (before treatments), and then gas sampling was conducted monthly at the end of each month. Due to the influences of COVID-19, the gas collections were stopped in January, February and March 2020. During each sampling, the removable chamber top was covered on the fixed base to form a closed environment. A running fan was placed at the bottom of each static chamber to stir the air to evenly mix the gas. Gas samples were collected between 9:00 and 11:00 am. Gas samples were collected four times at 5, 15, 25 and 35 min after chamber deployment using a 100 mL plastic syringe; 20 mL gas samples were injected into sealed pre-evacuated glass vials (12 mL). The CH4 and N2O were simultaneously measured using a gas chromatograph (model 7890A, Agilent, Wilmington, NC, USA) equipped with a flame ionization detector and an electron capture detector.
CH4 and N2O fluxes were estimated using their respective linear changes in concentrations over time. The gas flux calculation formula is [64]:
F = ρ V A P P o T o T d C t d t
where F is the net gas exchange flux (mg/(m2·h)); ρ is the gas density under standard conditions (kg/m3); V is the effective volume of the sampling chamber (m3); A is the soil area covered by the sampling chamber (m2); T and To are the chamber temperature and standard state temperature (°C) during the observation, respectively; and P and Po are the atmospheric pressure and standard atmospheric pressure (kPa), respectively, during the observation. d C t d t is the slope of the gas mass concentration in the chamber with respect to time [65,66].

2.6. Measurement of Microclimatic Factors

During each sampling of GHGs, the soil temperature and moisture, as well as atmospheric temperature and humidity, at each chamber were measured simultaneously. A thermometer and hygrometer was used to measure the atmospheric temperature and humidity next to each static chamber. Soil moisture (SM) and temperature (ST) at a depth of 0–10 cm were monitored with a TRIME pico32 monitor (Ettlingen, Germany).

2.7. Data Analysis Method

We used Microsoft Excel for the preliminary data processing and R 4.0.2 (R Core Team, 2016, Auckland, New Zealand) for data processing and statistical analysis. Before the statistical analysis, all data were tested for normality (Kolmogorov–Smirnov’s test) and homoscedasticity (Levene’s test). ANOVA analysis [67] and Tukey’s HSD test were used to test the treatment effects on soil properties and CH4 and N2O fluxes.
The structural equation model (SEM) was used to analyze different hypothetical approaches to explain the effects of treatments on CH4 and N2O fluxes. In the SEM analysis, the maximum likelihood estimation method was used to fit the model. The adequacy of the model was determined using the χ2 test and root-square-mean errors of approximation (RMSEA). An insignificant χ2 test (p < 0.05) and lower RMSEA (p > 0.05) showed that the model fits were appropriate. The basic steps of the SEM model analysis were as follows: First, we established the model and preliminarily checked the fitting structure of the model and the significance of the regression coefficient. Second, we adjusted the model repeatedly until the fitting standard was within the standard range (the smaller the RMSEA, the better). Finally, the results of the model were analyzed and explained. IBM SPSS Amos 23.0 (SPSS Inc., New York, NY, USA) was used for all statistical analyses and SEM analysis. A p-value < 0.05 was used to indicate statistically significant differences in this study.

3. Results

3.1. Changes in Soil Physical and Chemical Properties

The soil moisture showed large seasonal variability and the variation patterns were similar between different treatments, with generally lower moisture in the HNLP plots (Figure 2). The soil temperature showed the same monthly variations under the CK and treatments. Overall, the treatments had no significant (p > 0.05) impacts on soil moisture and temperature. Compared with the control, soil NH4+-N concentration significantly increased under the HN and HNLP treatments, while no significant changes occurred under the LP, HNHP and HP treatments (Table 1). The soil NO3-N significantly increased under the HNHP treatment, while there was no significant difference between other treatments. Compared with the control, the soil microbial biomass carbon (MBC) concentrations under all treatments except for the HN and HNLP significantly increased. The microbial biomass nitrogen (MBN) was significantly lower under all treatments except for the HN treatment, indicating that the P addition significantly stimulated N uptake by plant roots and reduced the N availability for microbial immobilization. After one year of fertilization treatments, leaf N concentrations did not significantly change for all treatments, with higher concentrations under HNLP and HNHP treatments. The leaf P concentrations significantly increased under the P addition treatments (LP, HP, HNLP and HNHP), while they slightly (p > 0.05) increased under the HN treatment. The HP and HNHP treatments had the largest increase in leaf P concentration, indicating a P limitation on plant growth at the study site.

3.2. Monthly Dynamics of Soil CH4 and N2O Fluxes

The soil N2O emissions showed large variations between the months (Figure 3a). Compared with the control, soil N2O emissions significantly increased within the first 4 months (from April to July 2019) under the HN, HNLP and HNHP treatments (Table 2), and the effects stabilized after that. The N2O emissions and their monthly patterns were similar under the HN, HNLP and HNHP treatments, while they were similar under the CK, LP and HP treatments. The P addition alone (i.e., LP and HP) did not significantly affect the monthly N2O dynamics as compared with the control.
The monthly soil CH4 uptakes displayed even larger monthly variations than the N2O emissions (Figure 3b). The monthly variation patterns under different treatments were similar. Compared with the control, the soil CH4 uptakes increased within the first 4 months under all treatments and the effects were stabilized after that. Our results indicated that the N and P addition effects on the N2O and CH4 fluxes only lasted for a short period (about 4 months) at the study site.

3.3. Overall Effects of N and P Addition Treatments

Compared with the control, the annual mean N2O emissions significantly (p < 0.05) increased by 31.15%, 36.57% and 41.51% under the HN, HNLP and HNHP treatments, respectively, while there were no significant changes under the LP and HP treatments (Table 2). This indicated that P addition alone did not significantly alter the soil N2O emissions in this N-rich Chinese fir plantation (Table 3). N2O emissions were higher under the HNLP and HNHP treatments; however, the differences were not significant. The effects of N and P additions on N2O emissions were more obvious during the first 4 months after the treatments. Two-way ANOVA indicated that only N addition promoted N2O emissions, and there was no significant interactive effect between the N and P additions (Table 3).
The impacts of N and P additions on CH4 uptake were different from the N2O emissions. Compared with the control, the annual mean CH4 uptake significantly (p < 0.05) increased by 16.23% and 15.80% under the HNHP and HP treatments, respectively, while there were no significant changes under the HN, LP and HNLP treatments. This indicated that the N addition alone and low-dose P addition did not significantly affect the CH4 uptake in the Chinese fir forest. There was no significant difference between HNHP and HP treatments, further implying that the increased CH4 uptake was mainly due to P addition, and the ANOVA analysis also demonstrated that the effects of N addition and N-P interaction on CH4 absorption were not statistically significant (Table 3).

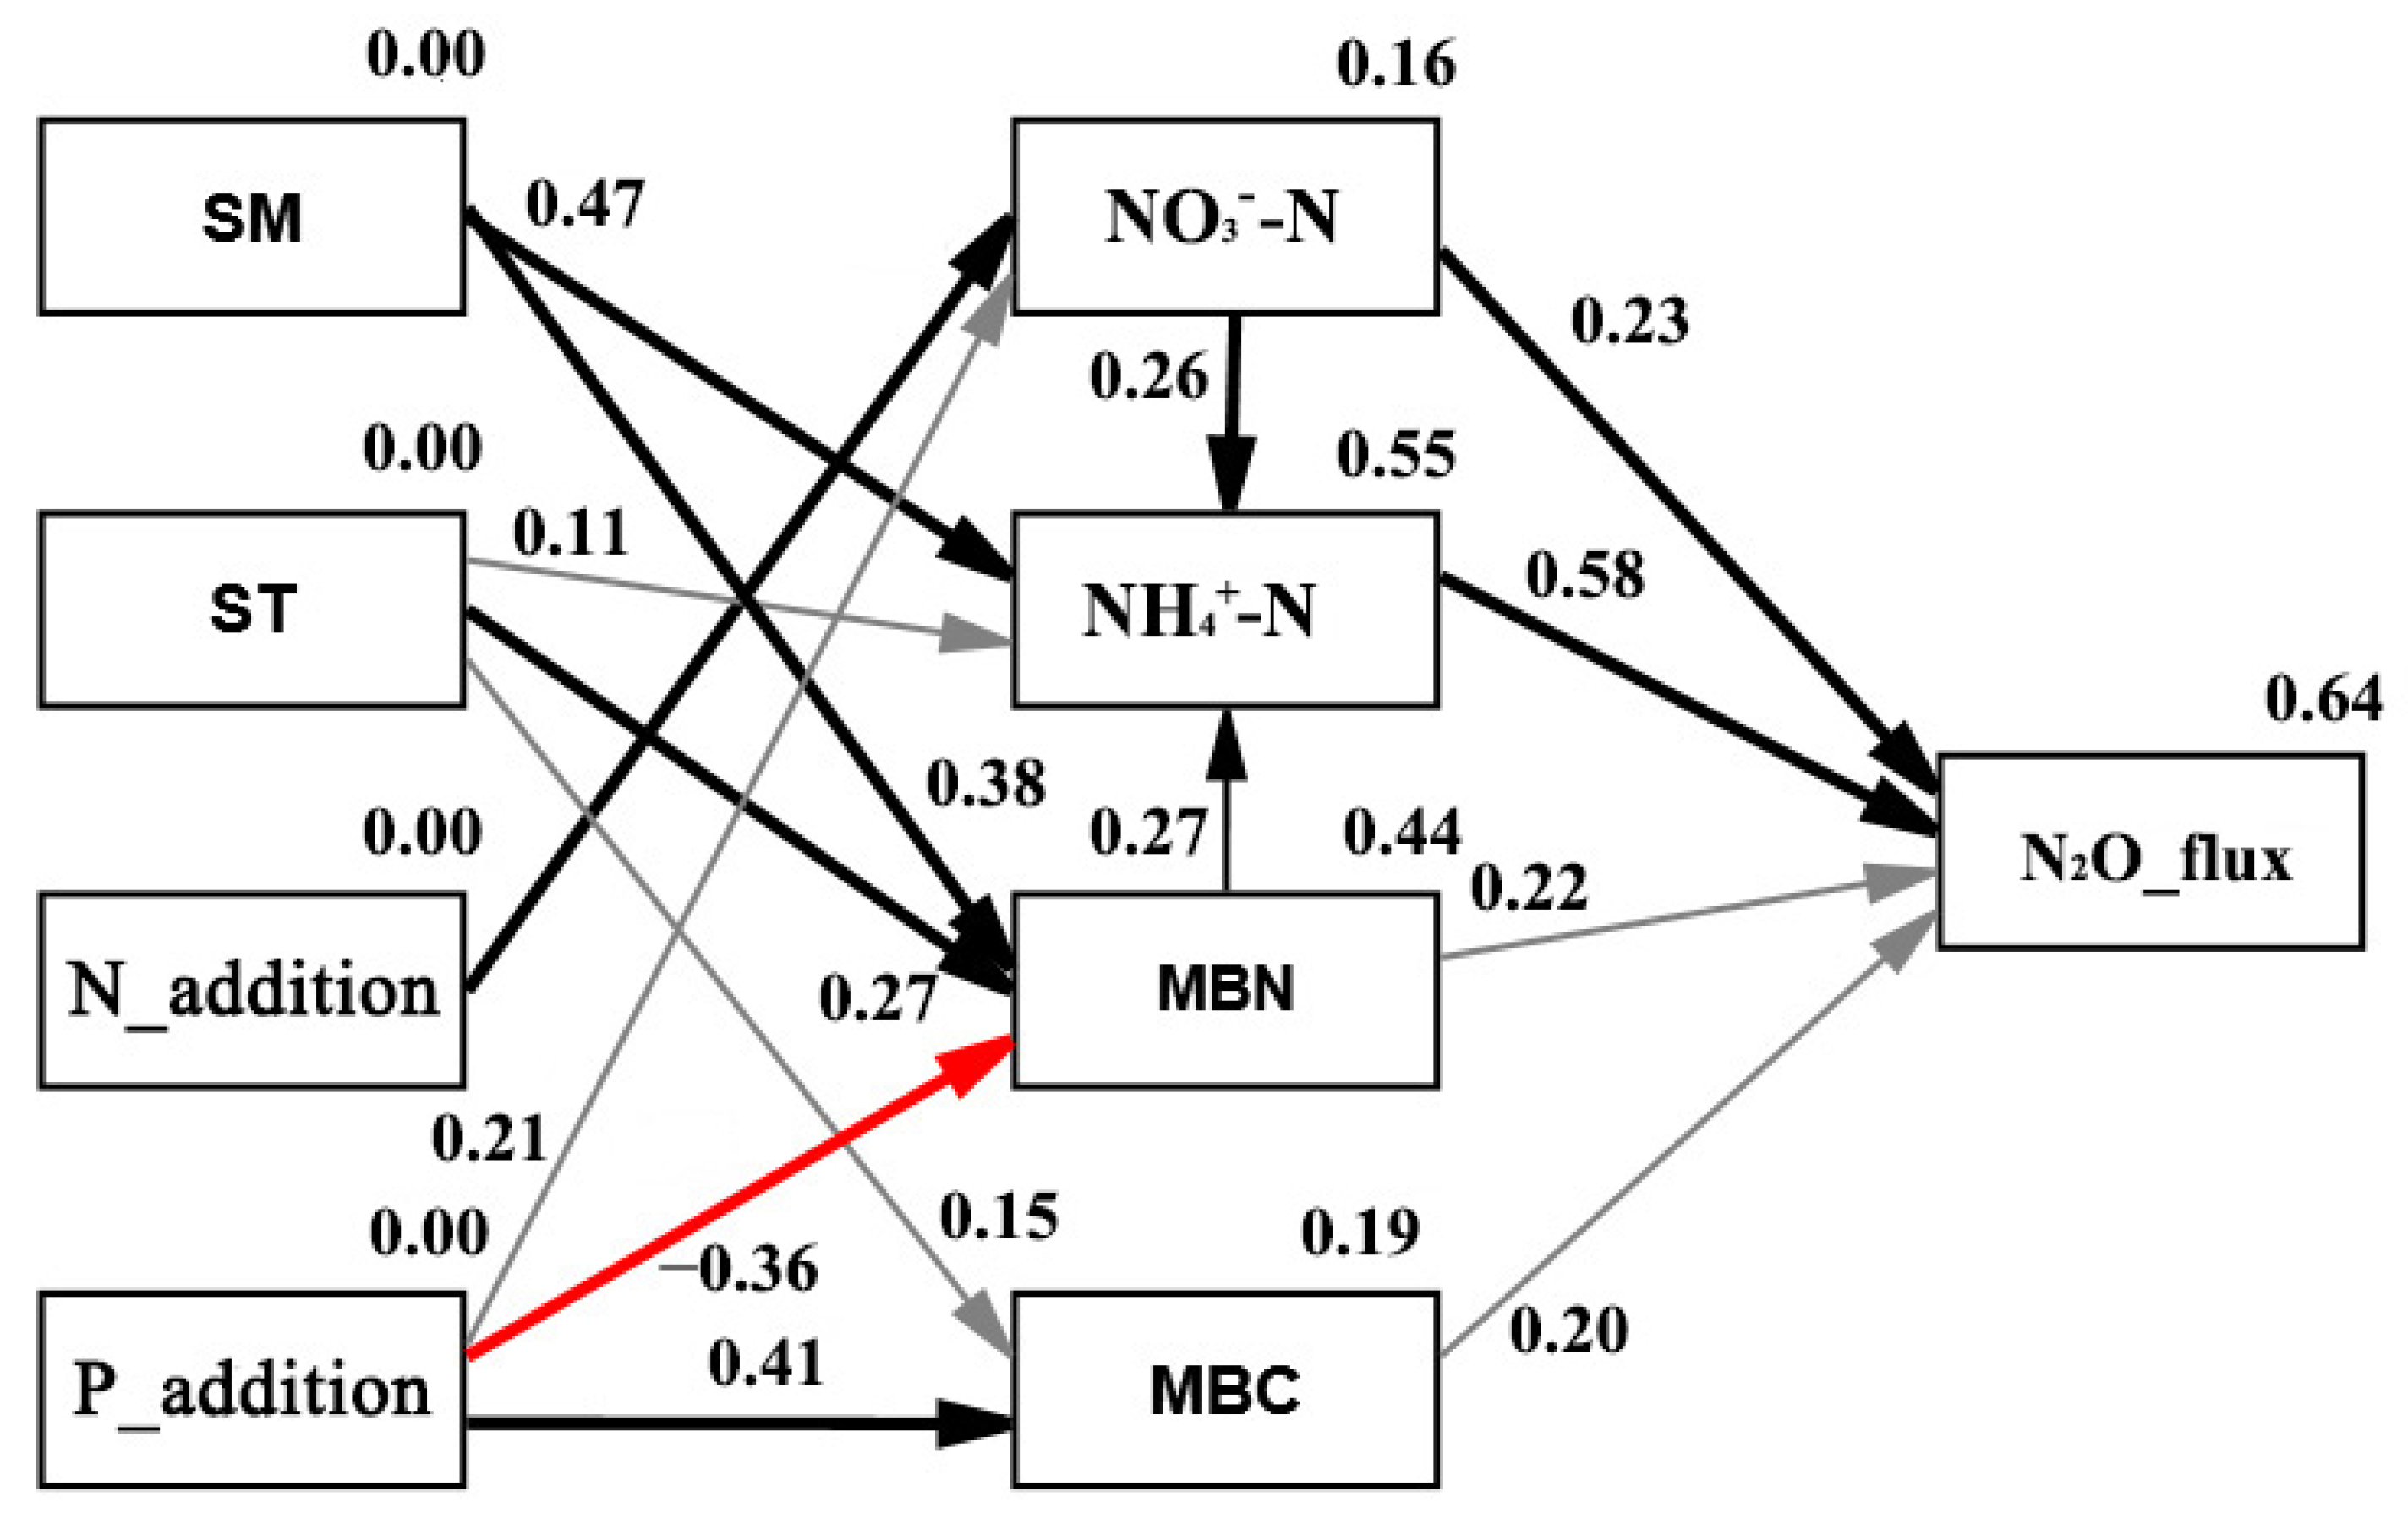
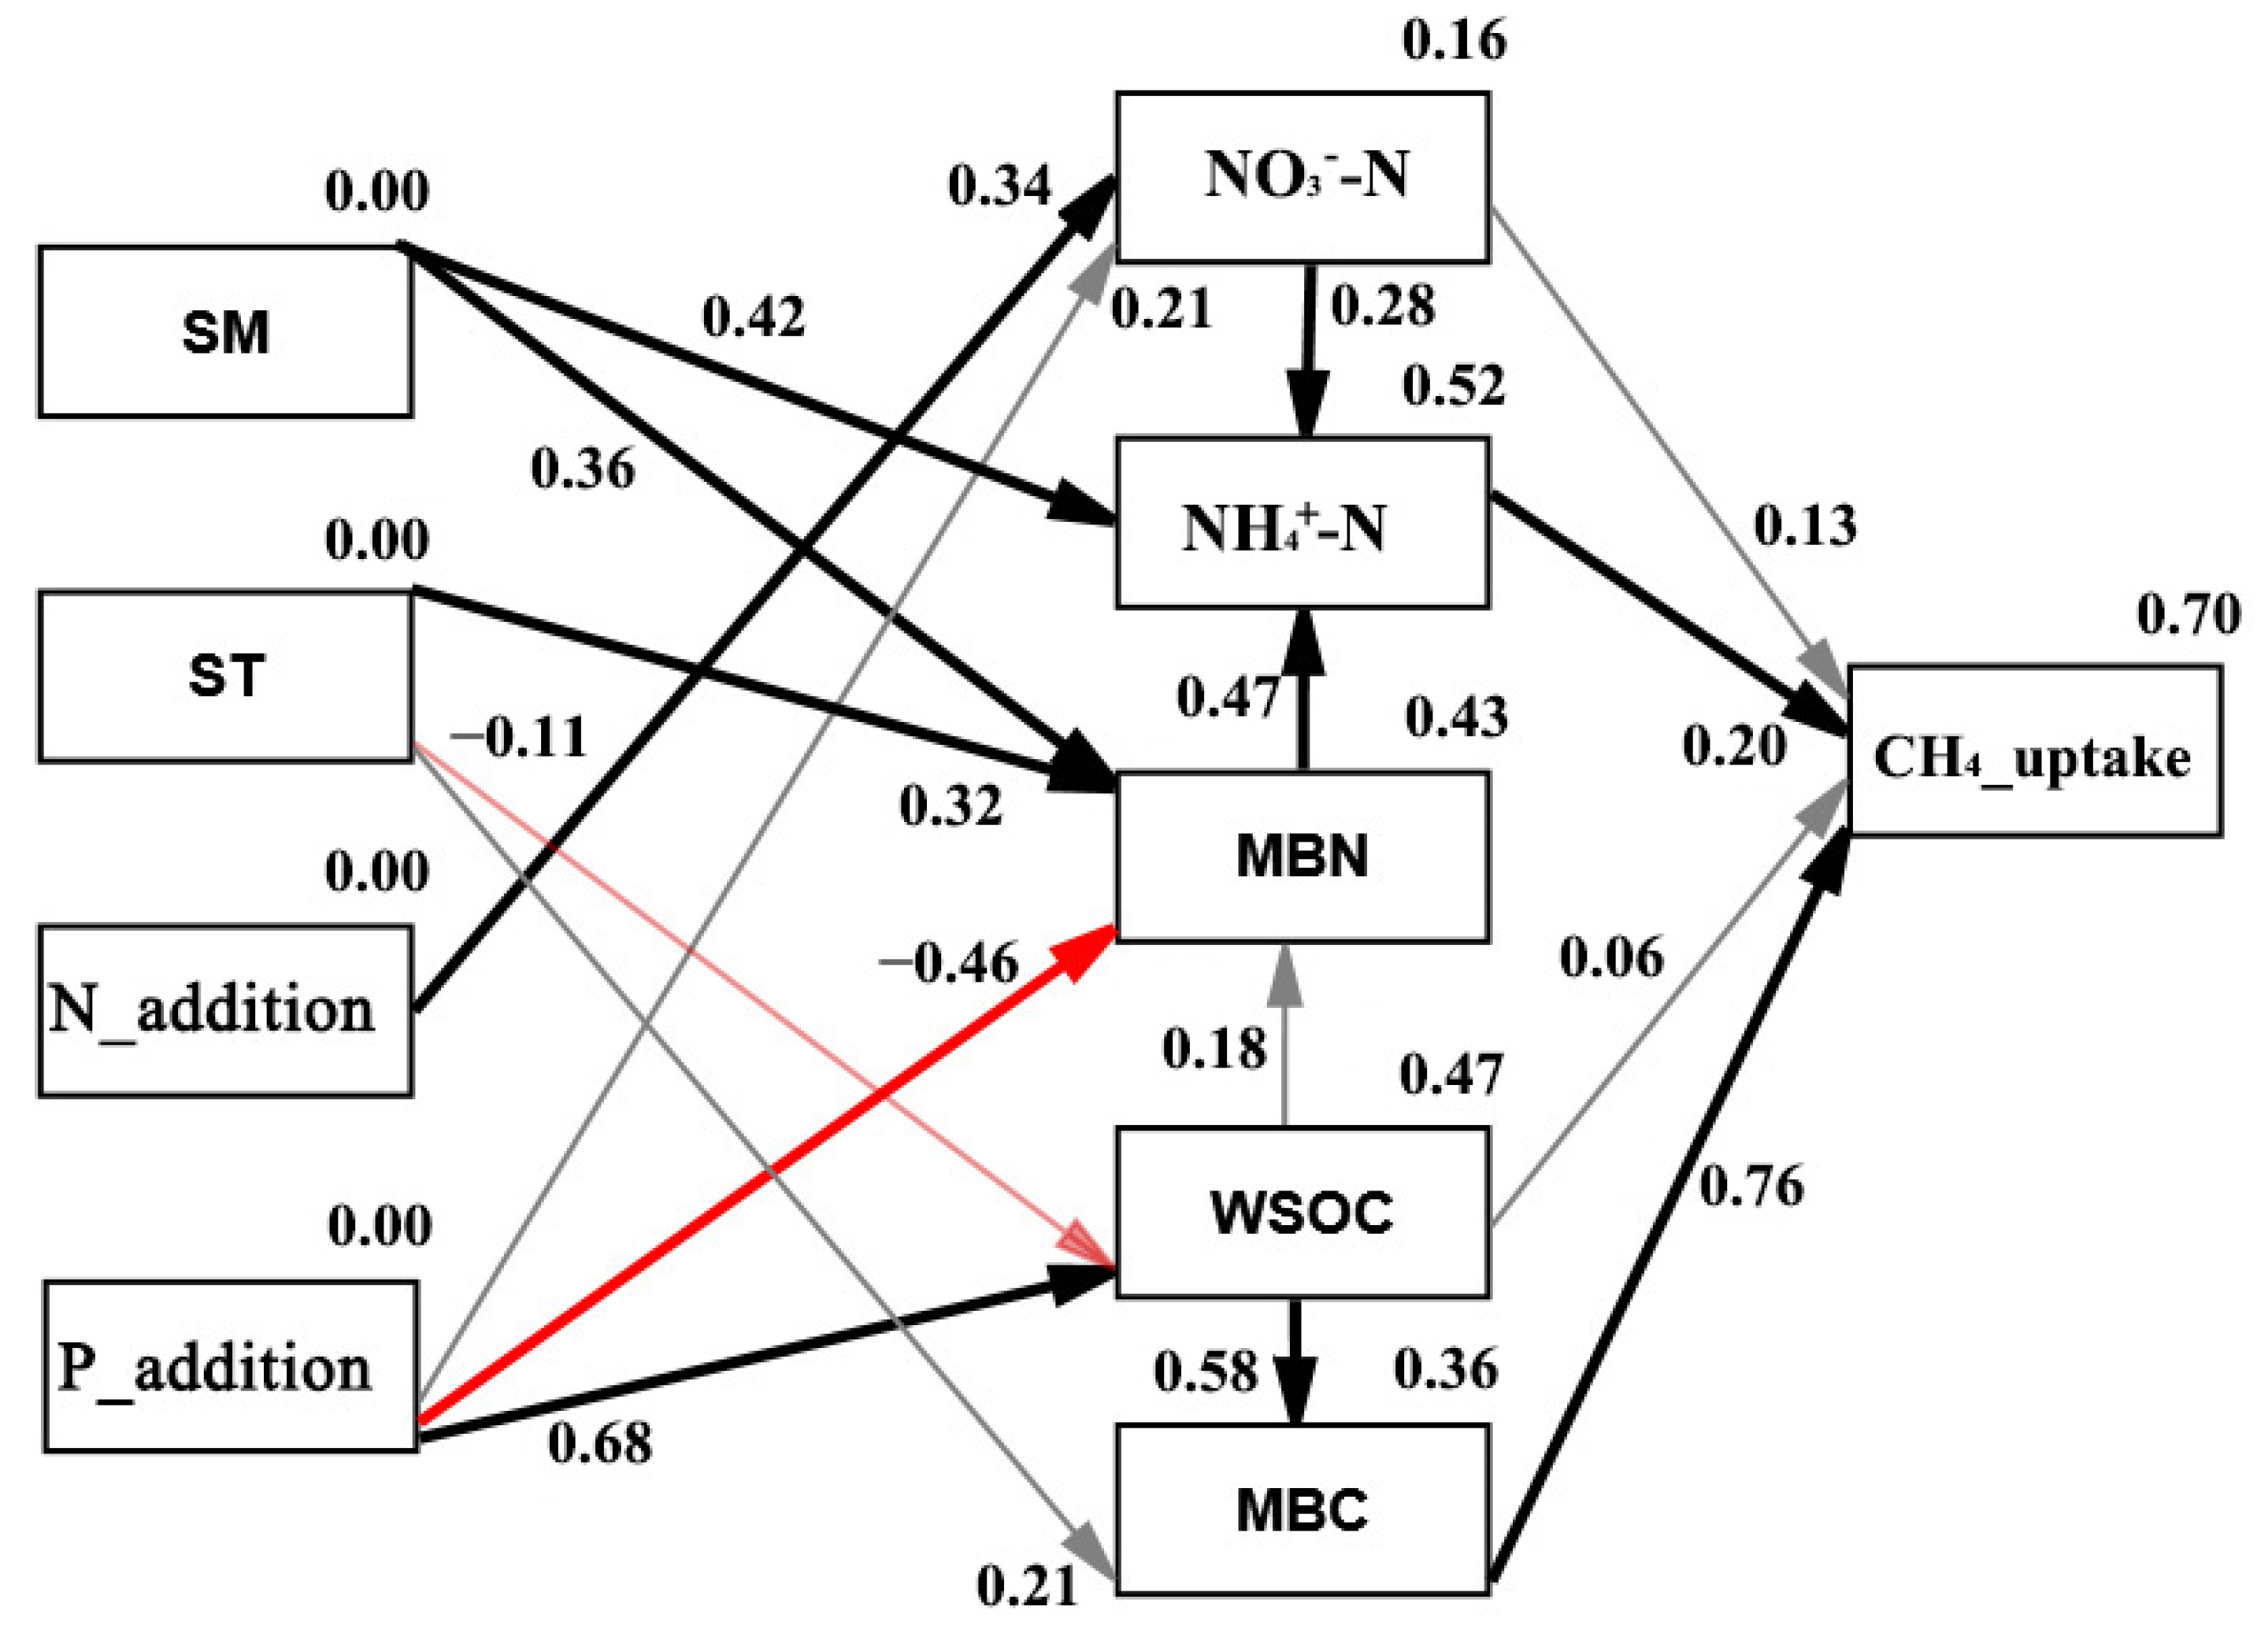
3.4. Pathway Determining N2O Emissions and CH4 Uptakes under N and P Additions

The SEM analysis was conducted to identify the causal effects of different contributing factors on CH4 and N2O fluxes after the N and P additions (Figure 4). The SEM results indicated that about 64% of the soil N2O variations under the N and P treatments were explained by the soil nutrient and environmental factors, namely, the ST (soil temperature), SM (soil moisture), NO3-N, NH4+-N, MBC, MBN and WSOC, which indicated that other factors not included in this study contributed about 36% of the variations. The N addition directly increased NO3-N and indirectly increased NH4+-N, which further significantly enhanced N2O emissions. The P addition significantly reduced MBN but increased the MBC, and both effects counteracted each other and resulted in non-significant impacts on the N2O emissions. The N addition only slightly interacted with the P addition to affect the NO3-N concentrations, resulting in non-significant interactive effects on the N2O emissions.
The SEM results indicated that about 70% of the soil CH4 variations under the N and P treatments were explained by the considered factors (Figure 5). The N addition significantly and positively affected NO3-N and further indirectly affected the NH4+-N concentrations but had non-significant impacts on the CH4 uptake. It was interesting that the P addition had no significant direct impact on the soil NH4+-N. The P addition significantly increased the WSOC and further increased the MBC, resulting in significant increases in the CH4 uptake; therefore, the P addition indirectly increased the CH4 uptake. The P addition also significantly reduced the MBN and further affected the NH4+-N concentrations, resulting in reduced CH4 uptake. No significant N and P addition interactive effects on the CH4 uptake were found.

4. Discussion

4.1. Effect of N Addition on N2O and CH4 Fluxes and the Controlling Mechanisms

We found that the N addition alone could significantly increase N2O emissions, but the effects only lasted for about 4 months. The high N addition caused 31.15% and 80.47% increases in N2O emissions over the annual and first 4-month periods. Under a similar N addition level, Li et al. [7] found that N addition increased N2O emissions by 21.1%, which was significantly lower than our result. This may have been because our study site was N-rich and contained forests with high soil N availability, while their study site was N-limited. Under a similar N-rich soil condition and N addition level, Zhang et al. [56] and Wang et al. [19] found that N addition stimulated 58% and 44.5% increases in N2O emission, respectively. In several meta-analyses, Liu and Greaver [10], Shen and Zhu [15] and Deng et al. [68] reported that N addition can globally cause about 216%, 101% and 91% increases in N2O emissions, respectively. Our results were more close to the studies from Shen and Zhu [15] and Deng et al. [68]. N addition levels, fertilizer types and the length of the study period strongly affect the drawn conclusions [15]. Under the HN and HNLP treatments, N addition significantly increased the soil NH4+-N concentrations; while under HNHP, N addition significantly increased the soil NO3-N, suggesting that the increased N2O emissions could result from either nitrification or denitrification processes. The SEM analysis further indicated that the increased NO3-N contributed less than the NH4+-N to the N2O emissions. This was also shown in many previous studies [15,29,33,45]. We found that the N2O emissions increased by 250% during the first month, and then the effects stabilized, indicating that the observation period significantly affected the responses of N2O emissions to N addition. The N-rich condition and high N leaching due to acid soil and high rainfall may explain the short-term responses of increased N2O emissions under N addition.
The first hypothesis stating that N addition inhibits CH4 uptake was not supported. Our results indicated that N addition did not significantly influence the CH4 uptake for both the first 4-month and annual periods. Many previous studies also showed that N addition had no significant effect on soil CH4 uptake [57,69,70]. In a plantation forest in subtropical China, Zheng et al. [47] also found that N addition did not significantly affect CH4 uptake. Studies found that increased NH4+ and NO3 under N addition can inhibit the bacterial oxidation activities, and thus, reduce the CH4 uptake [10,33,36]. In our study, both the NH4+ and NO3 concentrations under N addition alone (Table 1) did not significantly differ from the control plot because the soil was N-rich. In addition, the WSOC and MBC were the precursors for CH4 oxidation microbes [34,39,40], which our SEM analysis confirmed. Previous studies indicated that N addition can provide carbon compounds to the soil through the root-priming effect, which may change the WSOC content in the soil [39]. Li et al. [71] also found that N addition can significantly affect the WSOC in a bamboo forest. In addition, methanotrophs consume plant-derived carbon compounds through root exudation, resulting in an increased soil MBC [72]. Wang et al. [73] indicated that long-term N addition can significantly reduce the MBC and MBN. However, in our study, we found that N addition alone did not significantly affect both the WSOC and MBC (Table 1). In summary, our study did not find both inhibitive effects from the increased available N and stimulated effects from the increased WSOC and MBC under the N addition alone treatment.

4.2. Effect of P Addition on N2O and CH4 Fluxes and the Controlling Mechanisms

The second hypothesis stating that P addition alone could reduce N2O emissions under ambient conditions was not supported in this study. Our study results were consistent with the study results of Zheng et al. [12] for three forests in tropical China. However, our study results were inconsistent with many previous studies. These studies either found that P addition increased [18,19,25,26,74] or decreased forest soil N2O emissions [15,20,21,24,74,75]. The impact directions of P addition on soil N availability and MBN were the key explanations for the decreased or increased effects on N2O emissions [27]. Our study found no significant changes in soil total inorganic N (NH4+ and NO3) after the P addition alone treatment (Table 1). In addition, our SEM analysis also indicated that the MBN could slightly and negatively contribute to the N2O emissions. We found that the P addition significantly reduced the MBN under P addition due to the stimulated growth of plant roots and reduced availability of N for microbial immobilization, which explained the slightly but not statistically higher N2O emissions under the P addition alone.
The third hypothesis stating that P addition could enhance CH4 uptake was partially supported in this study. We found that the high-dose P addition significantly stimulated CH4 uptake, while the low-dose P addition only slightly (not significant) enhanced the CH4 uptake over both the annual and first 4-month periods (Table 2). Our study was consistent with many previous studies [16,35,37,55,76], in which they argued that P addition stimulates root growth and soil methanogenic bacteria activity, and thus, increases CH4 uptake. Our study found that the stimulated CH4 uptake was mainly due to the stimulated MBC and WSOC concentrations under the high-dose P addition treatments (HP and HNHP; Table 1). The SEM analysis (Figure 5) also confirmed that P addition could directly increase the WSOC and indirectly increase the MBC. The increased MBC explained about 76% of the increased CH4 uptake. In addition, we found that the reduced MBN due to the P addition could further result in reduced NH4+-N, lessening the inhibitive effects of NH4+-N on the CH4 uptake. This was also reported in many previous studies [10,47]. The reduced MBN explained about 20% of the increased CH4 uptake. In summary, the combination of increased MBC and decreased MBN could mainly explain the increases in CH4 uptake under high-dose P addition treatments (HP and HNHP). The WSOC concentrations under the LP treatment and the MBC under the HNLP treatment were not significantly different from the control (Table 1), which explained the non-significant effects of the low-dose P treatments (LP and HNLP) on the CH4 uptake.

4.3. Interactive Effects of N and P Addition on N2O and CH4 Fluxes

The fourth hypothesis stating that P addition could reduce N2O emissions and increase CH4 uptake under N addition was not supported in this study. In contrast, HNHP and HNLP slightly increased the N2O emissions as compared with the HN treatment, although the difference was not significant. Under similar N and P addition levels, Zheng et al. [12] found that N and P addition significantly reduced N2O emissions as compared with the N addition alone treatment in an old-growth forest, but no interaction effects were found in the younger mixed and planted forests. In the meta-analysis, Shen and Zhu [15] found that P addition can slightly (not significant) reduce N2O emissions by 6% under N addition, while it significantly reduces N2O emissions by 14% under ambient N conditions. The previous studies indicated that the effect direction and magnitude of N and P interactive additions on soil N2O emissions would mainly be determined by the two contrary processes: (1) increased plant N uptake or microbial N immobilization, and thus, reduced soil N availability for N2O production; and (2) stimulated soil N cycling and alleviated P limitation on nitrifying and denitrifying bacteria, and thus, enhanced N2O emissions. Through the SEM analysis (Figure 4), our study found that N and P additions interactively affected the NH4+-N concentrations. N addition indirectly stimulated NH4+-N concentrations, while P addition indirectly reduced NH4+-N concentrations by decreasing the MBN concentration. The positive effects from the N addition counteracted the negative effects from the P addition, resulting in no significant interactive effects between P and N additions on N2O emissions. This was also confirmed by the two-way ANOVA results (Table 3). However, due to a lack of enough long-term studies, our understanding of the universal mechanisms controlling the interactive effects between P and N additions is still unclear [12].
Our study also did not observe an interactive effect between the N and P additions on the CH4 uptake. Our study was inconsistent with some previous studies. For example, Zhang et al. [35] suggested that nitrogen addition would inhibit CH4 uptake, while P addition would promote CH4 uptake. After combined nitrogen and phosphorus fertilization, P counteracted the inhibitory effect of N; therefore, their study concluded that N and P additions had no significant effect on CH4 uptake. In another study, Gao et al. [26] indicated that CH4 uptake in N and P addition plots was lower than that under N alone and P alone addition plots, implying an additive effect on inhibiting CH4 uptake in a mixed forest in subtropical China. Martinson et al. [27] indicated that the N and P additions increased soil CH4 uptake in tropical montane forests. Through the SEM analysis (Figure 5) and ANOVA (Table 3), we found that the N and P interactive effects on the CH4 uptake were similar to those on the N2O emissions. Namely, the N and P additions also interactively affected CH4 uptake via their impacts on the NH4+-N concentrations. The negative effects from the N addition counteracted the positive effects from the P addition, resulting in no significant interactive effects between the P and N additions on the CH4 uptake. The inhibiting effects of NH4+-N on CH4 uptake was widely observed [26,35,36,41]. The change magnitude and direction in soil pH values and microbial community under N and P co-additions were suggested to be other main causes for the different responses of CH4 uptakes [77,78,79]; unfortunately, our study did not include these two factors. Due to fewer previous studies, more and longer-term experimental data are needed to confirm our inferences on the controlling mechanisms of their interactive effects.

5. Conclusions

Under four hypotheses, our study conducted one and half years of manipulative experiments to investigate the effects of different levels of N and P additions on soil N2O and CH4 fluxes in an N-rich and P-limited subtropical Chinese fir plantation. Unlike many previous reports, we observed that the P addition slightly increased the N2O emissions after the N addition. Although the stimulation effect was not significant due to the long-lasting effects of P addition, longer-term experiments are needed to further validate our conclusions. The ANOVA analysis indicated that the N and P additions did not have significant interactive effects on both N2O and CH4 fluxes. Based on the structural equation model, our study further revealed the controlling mechanisms from the perspectives of soil available N, WSOC and microbial activities. Our results were partially consistent with and partially contradicted previous reports. The previous studies in subtropical and tropical forests displayed very different directions and magnitudes for the N and P addition effects on both N2O and CH4 fluxes. Caution is needed when considering P fertilization as a management choice to reduce N2O emissions and increase CH4 uptake in this region. Our findings provide complementary evidence and mechanisms to the research of forest soil N2O and CH4 fluxes and have important implications for adaptive forest management strategies to mitigate global warming potential. In addition, different research sites with varying soil properties and forest types should be taken into consideration in the future.

Author Contributions

Conceptualization, G.C.; methodology, B.L. and G.C.; formal analysis, B.L. and X.L.; investigation, B.L., X.L. and H.J.; data curation, B.L., X.L. and H.J.; writing—original draft preparation, B.L. and G.C; writing—review and editing, G.C., X.L. and H.J.; visualization, B.L.; supervision, G.C.; project administration, G.C.; funding acquisition, G.C. All authors have read and agreed to the published version of the manuscript.

Funding

This research was funded by the Natural Science Foundation of Zhejiang Province (grant number LY20C030001), the Scientific Research Foundation of Zhejiang A&F University (grant number 2034020080) and the Overseas Expertise Introduction Project for Discipline Innovation (111 Project; grant number D18008).

Institutional Review Board Statement

Not applicable.

Informed Consent Statement

Not applicable.

Data Availability Statement

The data presented in this study are contained within the article.

Conflicts of Interest

The authors declare no conflict of interest.

References

  1. IPCC. Climate Change 2014: Mitigation of Climate Change. Contribution of Working Group III to the Fifth Assessment Report of the Intergovernmental Panel on Climate Change; Cambridge University Press: Cambridge, UK; New York, NY, USA, 2014. [Google Scholar]
  2. Jassal, R.S.; Black, T.A.; Trofymow, J.A.; Roy, R.; Nesic, Z. Soil CO2 and N2O flux dynamics in a nitrogen-fertilized Pacific Northwest Douglas-fir stand. Geoderma 2010, 157, 118–125. [Google Scholar] [CrossRef]
  3. Tian, H.; Lu, C.; Ciais, P.; Michalak, A.M.; Canadell, J.G.; Saikawa, E.; Huntzinger, D.N.; Gurney, K.R.; Sitch, S.; Zhang, B. The terrestrial biosphere as a net source of greenhouse gases to the atmosphere. Nature 2016, 531, 225–228. [Google Scholar] [CrossRef] [PubMed] [Green Version]
  4. Tian, H.; Yang, J.; Xu, R.; Lu, C.; Canadell, J.G.; Davidson, E.A.; Jackson, R.B.; Arneth, A.; Chang, J.; Ciais, P. Global soil nitrous oxide emissions since the preindustrial era estimated by an ensemble of terrestrial biosphere models: Magnitude, attribution, and uncertainty. Glob. Chang. Biol. 2019, 25, 640–659. [Google Scholar] [CrossRef] [Green Version]
  5. Tian, H.; Xu, R.; Canadell, J.G.; Thompson, R.L.; Winiwarter, W.; Suntharalingam, P.; Davidson, E.A.; Ciais, P.; Jackson, R.B.; Janssens-Maenhout, G. A comprehensive quantification of global nitrous oxide sources and sinks. Nature 2020, 586, 248–256. [Google Scholar] [CrossRef] [PubMed]
  6. Nisbet, E.G.; Dlugokencky, E.J.; Manning, M.R.; Lowry, D.; Fisher, R.E.; France, J.L.; Michel, S.E.; Miller, J.B.; White, J.W.C.; Vaughn, B. Rising atmospheric methane: 2007–2014 growth and isotopic shift. Glob. Biogeochem. Cycles 2016, 30, 1356–1370. [Google Scholar] [CrossRef] [Green Version]
  7. Li, R.D.; Zhang, K.; Su, D.; Lu, F.; Wan, W.X.; Wang, X.K.; Zheng, H. Effects of nitrogen application on soil greenhouse gas fluxes during the growing season of Eucalyptus plantations. Acta Ecol. Sin. 2015, 35, 5931–5939. [Google Scholar]
  8. Zhang, P.D.; Li, X.R.; Yang, Y.L.; Zheng, Y.H.; Wang, L.S. Analysis of the benefits of greenhouse gas emission reduction in China’s large and medium-sized biogas projects. Trans. Chin. Soc. Agric. Eng. 2008, 24, 1–8. [Google Scholar]
  9. Mosier, A.R. Soil processes and global change. Biol. Fertil. Soils 1998, 27, 221–229. [Google Scholar] [CrossRef]
  10. Liu, L.; Greaver, T.L. A review of nitrogen enrichment effects on three biogenic GHGs: The CO2 sink may be largely offset by stimulated N2O and CH4 emission. Ecol. Lett. 2009, 12, 1103–1117. [Google Scholar] [CrossRef]
  11. Tian, H.; Chen, G.; Lu, C.; Xu, X.; Ren, W.; Zhang, B.; Banger, K.; Tao, B.; Pan, S.; Liu, M. Global methane and nitrous oxide emissions from terrestrial ecosystems due to multiple environmental changes. Ecosyst. Health Sustain. 2015, 1, 1–20. [Google Scholar] [CrossRef] [Green Version]
  12. Zheng, M.; Zhang, T.; Liu, L.; Zhu, W.; Zhang, W.; Mo, J. Effects of nitrogen and phosphorus additions on nitrous oxide emission in a nitrogen-rich and two nitrogen-limited tropical forests. Biogeosciences 2016, 13, 3503–3517. [Google Scholar] [CrossRef] [Green Version]
  13. Li, D.; Liu, Q.; Yin, H.; Luo, Y.; Hui, D.F. Differential responses and controls of soil CO2 and N2O fluxes to experimental warming and nitrogen fertilization in a subalpine coniferous spruce (Picea asperata Mast.) plantation forest. Forests 2019, 10, 808. [Google Scholar] [CrossRef] [Green Version]
  14. Butterbach-Bahl, K.; Baggs, E.M.; Dannenmann, M.; Kiese, R.; Zechmeister-Boltenstern, S. Nitrous oxide emissions from soils: How well do we understand the processes and their controls? Philos. Trans. R. Soc. B 2013, 368, 20130122. [Google Scholar] [CrossRef] [PubMed]
  15. Shen, Y.; Zhu, B. Effects of nitrogen and phosphorus enrichment on soil N2O emission from natural ecosystems: A global meta-analysis. Environ.Pollut. 2022, 301, 118993. [Google Scholar] [CrossRef]
  16. Mori, T.; Ohta, S.; Ishizuka, S.; Konda, R.; Wicaksono, A.; Heriyanto, J.; Hamotani, Y.; Gobara, Y.; Kawabata, C.; Kuwashima, K. Soil greenhouse gas fluxes and C stocks as affected by phosphorus addition in a newly established Acacia mangium plantation in Indonesia. For. Ecol. Manag. 2013, 310, 643–651. [Google Scholar] [CrossRef]
  17. Du, E.Z.; Terrer, C.; Pellegrini, A.F.A.; Ahlstrom, A.; van Lissa, C.J.; Zhao, X.; Xia, N.; Wu, X.H.; Jackson, R.B. Global patterns of terrestrial nitrogen and phosphorus limitation. Nat. Geosci. 2020, 13, 221–226. [Google Scholar] [CrossRef]
  18. Mori, T.; Ohta, S.; Ishizuka, S.; Konda, R.; Wicaksono, A.; Heriyanto, J.; Hardjono, A. Effects of phosphorus addition on N2O and NO emissions from soils of an Acacia mangium plantation. Soil Sci. Plant Nutr. 2010, 56, 782–788. [Google Scholar] [CrossRef] [Green Version]
  19. Wang, F.; Li, J.; Wang, X.; Zhang, W.; Zou, B.; Neher, D.A.; Li, Z. Nitrogen and phosphorus addition impact soil N2O emission in a secondary tropical forest of south China. Sci. Rep. 2014, 4, 5615. [Google Scholar] [CrossRef] [Green Version]
  20. Mori, T.; Ohta, S.; Ishizuka, S.; Konda, R.; Wicaksono, A.; Heriyanto, J. Phosphorus application reduces N2O emissions from tropical leguminous plantation soil when phosphorus uptake is occurring. Biol. Fertil. Soils 2014, 50, 45–51. [Google Scholar] [CrossRef]
  21. Zhang, W.; Zhu, X.; Luo, Y.; Rafique, R.; Chen, H.; Huang, J.; Mo, J. Responses of nitrous oxide emissions to nitrogen and phosphorus additions in two tropical plantations with N-fixing vs non-N-fixing tree species. Biogeosciences 2014, 11, 4941–4951. [Google Scholar] [CrossRef] [Green Version]
  22. Minami, K.; Fukushi, S. Effecfs of phosphate and calcium carbonate application on emission of N2O from soils under aerobic conditions. Soil Sci. Plant Nutr. 1983, 29, 517–524. [Google Scholar] [CrossRef]
  23. Falkiner, R.A.; Khanna, P.K.; Raison, R.J. Effect of superphosphate addition on N mineralization in some Australian forest soils. Soil Res. 1993, 31, 285–296. [Google Scholar] [CrossRef]
  24. Baral, B.R.; Kuyper, T.W.; Van-Groenigen, J.W. Liebig’s law of the minimum applied to a greenhouse gas: Alleviation of P-limitation reduces soil N2O emission. Plant Soil 2014, 374, 539–548. [Google Scholar] [CrossRef]
  25. White, J.R.; Reddy, K.R. Influence of nitrate and phosphorus loading on denitrifying enzyme activity in everglades wetland soils. Soil Sci. Soc. Am. 1999, 63, 1945–1954. [Google Scholar] [CrossRef] [Green Version]
  26. Gao, W.; Yang, H.; Li, S.; Kou, L. Responses of soil CO2, CH4 and N2O fluxes to N, P, and acid additions in mixed forest in subtropical China. J. Resour. Ecol. 2017, 8, 154–164. [Google Scholar]
  27. Martinson, G.O.; Müller, A.K.; Matson, A.L.; Corre, M.D.; Veldkamp, E. Nitrogen and phosphorus control soil methane uptake in tropical montane forests. J. Geophys. Res. Biogeosci. 2021, 126, e2020JG005970. [Google Scholar] [CrossRef]
  28. Conrad, R. Microbial ecology of methanogens and methanotrophs. Adv. Agron. 2007, 96, 1–63. [Google Scholar]
  29. Mosier, A.R.; Parton, W.J.; Phongpan, S. Long-term large N and immediate small N addition effects on trace gas fluxes in the Colorado shortgrass steppe. Biol. Fertil. Soils 1998, 28, 44–50. [Google Scholar]
  30. Zhuang, Q.; Chen, M.; Xu, K.; Tang, J.; Saikawa, E.; Lu, Y.; Melillo, J.M.; Prinn, R.G.; McGuire, A.D. Response of global soil consumption of atmospheric methane to changes in atmospheric climate and nitrogen deposition. Glob. Biogeochem. Cycles 2013, 27, 650–663. [Google Scholar] [CrossRef]
  31. Jang, I.; Lee, S.; Zoh, K.D.; Kang, H. Methane concentrations and methanotrophic community structure influence the response of soil methane oxidation to nitrogen content in a temperate forest. Soil Biol. Biochem. 2011, 43, 620–627. [Google Scholar] [CrossRef]
  32. Maljanen, M.; Jokinen, H.; Saari, A.; Strömmer, R.; Martikainen, P.J. Methane and nitrous oxide fluxes, and carbon dioxide production in boreal forest soil fertilized with wood ash and nitrogen. Soil Use Manag. 2006, 22, 151–157. [Google Scholar] [CrossRef]
  33. Hawthorne, I.; Johnson, M.S.; Jassal, R.S.; Black, T.A.; Grant, N.J.; Smukler, S.M. Application of biochar and nitrogen influences fluxes of CO2, CH4 and N2O in a forest soil. J. Environ. Manag. 2017, 192, 203–214. [Google Scholar] [CrossRef] [PubMed]
  34. Reay, D.S.; Nedwell, D.B. Methane oxidation in temperate soils: Effects of inorganic N. Soil Biol. Biochem. 2004, 36, 2059–2065. [Google Scholar]
  35. Zhang, T.; Zhu, W.; Mo, J.; Liu, L.; Dong, S. Increased phosphorus availability mitigates the inhibition of nitrogen deposition on CH4 uptake in an old-growth tropical forest, southern China. Biogeosciences 2011, 8, 2805–2813. [Google Scholar] [CrossRef] [Green Version]
  36. Fender, A.C.; Pfeiffer, B.; Gansert, D.; Leuschner, C.; Daniel, R.; Jungkunst, H.F. The inhibiting effect of nitrate fertilisation on methane uptake of a temperate forest soil is influenced by labile carbon. Biol. Fertil. Soils 2012, 48, 621–631. [Google Scholar] [CrossRef] [Green Version]
  37. Xu, X.; Inubushi, K. Effects of N sources and methane concentrations on methane uptake potential of a typical coniferous forest and its adjacent orchard soil. Biol. Fertil. Soils 2004, 40, 215–221. [Google Scholar] [CrossRef]
  38. Wang, Z.-P.; Ineson, P. Methane oxidation in a temperate coniferous forest soil: Effects of inorganic N. Soil Biol. Biochem. 2003, 35, 427–433. [Google Scholar] [CrossRef]
  39. Aronson, E.L.; Helliker, B.R. Methane flux in non-wetland soils in response to nitrogen addition: A meta-analysis. Ecology 2010, 91, 3242–3251. [Google Scholar] [CrossRef]
  40. Bender, M.; Conrad, R. Effect of CH4 concentrations and soil conditions on the induction of CH4 oxidation activity. Soil Biol. Biochem. 1995, 27, 1517–1527. [Google Scholar] [CrossRef]
  41. Bodelier, P.L.E.; Laanbroek, H.J. Nitrogen as a regulatory factor of methane oxidation in soils and sediments. FEMS Microbiol. Ecol. 2004, 47, 265–277. [Google Scholar] [CrossRef]
  42. Steinkamp, R.; Butterbach-Bahl, K.; Papen, H. Methane oxidation by soils of an N limited and N fertilized spruce forest in the Black Forest, Germany. Soil Biol. Biochem. 2001, 33, 145–153. [Google Scholar] [CrossRef]
  43. Börjesson, G.; Nohrstedt, H. Fast recovery of atmospheric methane consumption in a Swedish forest soil after single-shot N-fertilization. For. Ecol. Manag. 2000, 134, 83–88. [Google Scholar] [CrossRef]
  44. Veraart, A.J.; Steenbergh, A.K.; Ho, A.; Kim, S.Y.; Bodelier, P.L.E. Beyond nitrogen: The importance of phosphorus for CH4 oxidation in soils and sediments. Geoderma 2015, 259, 337–346. [Google Scholar] [CrossRef]
  45. Hall, S.J.; Matson, P.A. Nitrogen oxide emissions after nitrogen additions in tropical forests. Nature 1999, 400, 152–155. [Google Scholar] [CrossRef]
  46. Xu, M.; Chen, S.L.; Fang, H.J.; Yu, G.R.; Gao, W.L.; Wang, Y.S.; Dang, X.S.; Li, L.S. Low-level nitrogen addition promotes net methane uptake in a boreal forest across the great Xing’an mountain region. Sci. Silvae Sin. 2014, 60, 973–981. [Google Scholar] [CrossRef] [Green Version]
  47. Zheng, M.H.; Zhang, T.; Liu, L.; Zhang, W.; Lu, X.K.; Mo, J.M. Effects of nitrogen and phosphorus additions on soil methane uptake in disturbed forests. J. Geophys. Res. Biogeosci. 2016, 121, 3089–3100. [Google Scholar] [CrossRef]
  48. IPCC. Climate Change 2007: The Physical Science Basis. Contribution of Working Group I to the Fourth Assessment Report of the Intergovernmental Panel on Climate Change; Cambridge University Press: Cambridge, UK, 2007. [Google Scholar]
  49. IPCC. Climate Change 2001: The Scientific Basis, Intergovernmental Panel on Climate Change, Working Group 3, Third Assessment Report; Cambridge University Press: Cambridge, UK, 2001. [Google Scholar]
  50. Xie, D.; Si, G.; Zhang, T.; Mulder, J.; Duan, L. Nitrogen deposition increases N2O emission from an N-saturated subtropical forest in southwest China. Environ. Pollut. 2018, 243, 1818–1824. [Google Scholar] [CrossRef]
  51. Zhu, J.; Mulder, J.; Wu, L.P.; Meng, X.X.; Wang, Y.H.; Dörsch, P. Spatial and temporal variability of N2O emissions in a subtropical forest catchment in China. Biogeosciences 2013, 10, 1309–1321. [Google Scholar] [CrossRef] [Green Version]
  52. Li, M.; Cui, Y.; Fu, Y.; Li, N.; Tang, X.; Liu, X.; Run, Y. Simulating the potential sequestration of three major greenhouse gases in China’s natural ecosystems. Forests 2020, 11, 128. [Google Scholar] [CrossRef] [Green Version]
  53. Yu, G.R.; Jia, Y.L.; He, N.P.; Zhu, J.X.; Chen, Z.; Wang, Q.F.; Piao, S.L.; Liu, X.J.; He, H.L.; Guo, X.B.; et al. Stabilization of atmospheric nitrogen deposition in China over the past decade. Nat. Geosci. 2019, 12, 424–429. [Google Scholar] [CrossRef]
  54. Mo, J.; Zhang, W.; Zhu, W.; Gundersen, P.; Fang, Y.T.; Li, D.J.; Wang, H. Nitrogen addition reduces soil respiration in a mature tropical forest in southern China. Glob. Chang. Biol. 2008, 14, 403–412. [Google Scholar] [CrossRef]
  55. Yu, L.; Wang, Y.; Zhang, X.; Dörsch, P.; Mulder, J. Phosphorus addition mitigates N2O and CH4 emissions in N-saturated subtropical forest, SW China. Biogeosciences 2017, 14, 3097–3109. [Google Scholar] [CrossRef] [Green Version]
  56. Zhang, W.; Mo, J.; Yu, G.; Fang, Y.; Li, D.; Lu, X.; Wang, H. Emissions of nitrous oxide from three tropical forests in southern China in response to simulated nitrogen deposition. Plant Soil 2008, 306, 221–236. [Google Scholar] [CrossRef]
  57. Zhang, W.; Mo, J.; Zhou, G.; Gundersen, P.; Fang, Y.; Lu, X.; Zhang, T.; Dong, S. Methane uptake responses to nitrogen deposition in three tropical forests in southern China. J. Geophys. Res. Atmos. 2008, 113, D11116. [Google Scholar] [CrossRef] [Green Version]
  58. Zhang, K.; Zhu, Q.; Liu, J.; Wang, M.; Zhou, X.; Li, M.; Peng, C. Spatial and temporal variations of N2O emissions from global forest and grassland ecosystems. Agric. For. Meteorol. 2019, 266, 129–139. [Google Scholar] [CrossRef]
  59. Zhang, Q.X.; Chen, J.; Wang, X.T.; Wang, N.; Bai, S.B. Short-term response of Chinese fir plantation soil greenhouse gas emissions to Phyllostachys edulis invasion and logging. J. Zhejiang A F Univ. 2021, 38, 703–711. [Google Scholar]
  60. McGroddy, M.E.; Daufresne, T.; Hedin, L.O. Scaling of C:N:P stoichiometry in forests worldwide: Implications of terrestrial redfield-type ratios. Ecology 2004, 85, 2390–2401. [Google Scholar] [CrossRef]
  61. Bao, S.D. Soil Agrochemical Analysis; China Agricultural Publishing House: Beijing, China, 2010. [Google Scholar]
  62. Vance, E.D.; Brookes, P.C.; Jenkinson, D.S. An extraction method for measuring soil microbial biomass C. Soil Biol. Biochem. 1987, 19, 703–707. [Google Scholar] [CrossRef]
  63. Vargas, R.; Baldocchi, D.D.; Bahn, M.; Hanson, P.J.; Hosman, K.P.; Kulmala, L.; Pumpanen, J.; Yang, B. On the multi-temporal correlation between photosynthesis and soil CO2 efflux: Reconciling lags and observations. New Phytol. 2011, 191, 1006–1017. [Google Scholar] [CrossRef]
  64. Wang, Y.; Liu, G.; Wang, Y.; Sun, Y.; Xue, M. Simultaneous measurement of CO2, CH4 and N2O emission from terrestrial ecosystem with one improved gas chromatography. Tech. Equip. Environ. Pollut. Control 2003, 4, 84–90. [Google Scholar]
  65. Fang, S.; Lin, D.; Tian, Y.; Hong, S. Thinning intensity affects soil-atmosphere fluxes of greenhouse gases and soil nitrogen mineralization in a lowland poplar plantation. Forests 2016, 7, 141. [Google Scholar] [CrossRef] [Green Version]
  66. Liu, L.; Liu, Y.; Wen, X.; Wang, Y. Soil CH4 emission flux from artificial coniferous forest in red soil hilly area of Qianyanzhou. Chin. J. Plant Ecol. 2008, 32, 431–439. [Google Scholar]
  67. Hansen, M.C.; Potapov, P.V.; Moore, R.; Hancher, M.; Turubanova, S.A.; Tyukavina, A.; Thau, D.; Stehman, S.V.; Goetz, S.J.; Loveland, T.R.; et al. High-resolution global maps of 21st-century forest cover change. Science 2013, 342, 850–853. [Google Scholar] [CrossRef] [PubMed] [Green Version]
  68. Deng, L.; Huang, C.B.; Kim, D.G.; Shangguan, Z.P.; Wang, K.B.; Song, X.Z.; Peng, C.H. Soil GHG fluxes are altered by N deposition: New data indicate lower N stimulation of the N2O flux and greater stimulation of the calculated C pools. Glob. Chang. Biol. 2020, 26, 2613–2629. [Google Scholar] [CrossRef] [PubMed] [Green Version]
  69. Ambus, P.; Robertson, G.P. The effect of increased N deposition on nitrous oxide, methane and carbon dioxide fluxes from unmanaged forest and grassland communities in Michigan. Biogeochemistry 2006, 79, 315–337. [Google Scholar] [CrossRef]
  70. Mori, A.; Hojito, M.; Kondo, H.; Matsunami, H.; Scholefield, D. Effects of plant species on CH4 and N2O fluxes from a volcanic grassland soil in Nasu, Japan. Soil Sci. Plant Nutr. 2005, 51, 19–27. [Google Scholar] [CrossRef]
  71. Li, Y.; Jiang, P.K.; Liu, J.; Wang, X.; Wu, J.; Ye, G.; Zhou, G. Effect of fertilization on water-soluble organic C, N, and emission of greenhouse gases in the soil of Phyllostachys edulis stands. Sci. Silvae Sin. 2010, 12, 165–170. [Google Scholar]
  72. Kuzyakov, Y.; Friedel, J.K.; Stahr, K. Review of mechanisms and quantification of priming effects. Soil Biol. Biochem. 2000, 32, 1485–1498. [Google Scholar] [CrossRef]
  73. Wang, C.; Lu, X.; Mori, T.; Mao, Q.; Zhou, K.; Zhou, G.; Nie, Y.; Mo, J. Responses of soil microbial community to continuous experimental nitrogen additions for 13 years in a nitrogen-rich tropical forest. Soil Biol. Biochem. 2018, 121, 103–112. [Google Scholar] [CrossRef]
  74. Mori, T.; Yokoyama, D.; Kitayama, K. Contrasting effects of exogenous phosphorus application on N2O emissions from two tropical forest soils with contrasting phosphorus availability. SpringerPlus 2016, 5, 1237. [Google Scholar] [CrossRef] [Green Version]
  75. Schwenke, G.D.; Herridge, D.F.; Scheer, C.; Rowlings, D.W.; Haigh, B.M.; McMullen, K.G. Greenhouse gas (N2O and CH4) fluxes under nitrogen-fertilised dryland wheat and barley on subtropical Vertosols: Risk, rainfall and alternatives. Soil Res. 2016, 54, 634–650. [Google Scholar] [CrossRef] [Green Version]
  76. Liu, L.; Gundersen, P.; Zhang, T.; Mo, J. Effects of phosphorus addition on soil microbial biomass and community composition in three forest types in tropical China. Soil Biol. Biochem. 2012, 44, 31–38. [Google Scholar] [CrossRef]
  77. Wang, J.H.; Liu, J.S.; Yu, J.B.; Wang, J.D. Effects of nitrogen and phosphorus fertilizers on soil microbial biomass carbon and nitrogen in black soil corn farm ecosystem. J. Soil Water Conserv. 2004, 18, 35–38. [Google Scholar]
  78. Yue, P.; Li, K.; Gong, Y.; Hu, Y.; Mohammat, A.; Christie, P.; Liu, X. A five-year study of the impact of nitrogen addition on methane uptake in alpine grassland. Sci. Rep. 2016, 6, 32064. [Google Scholar] [CrossRef] [PubMed] [Green Version]
  79. Zhang, L.H.; Yuan, F.H.; Bai, J.H.; Duan, H.T.; Gu, X.Y.; Hou, L.Y.; Huang, Y.; Yang, M.G.; He, J.S.; Zhang, Z.H.; et al. Phosphorus alleviation of nitrogen-suppressed methane sink in global grasslands. Ecol. Lett. 2020, 23, 821–830. [Google Scholar] [CrossRef] [PubMed]
Figure 1. Location of the study area and experimental design (six treatments with four replicates).
Forests 13 00772 g001
Figure 2. Monthly soil moisture (cm3/cm3) and rainfall (mm; left) and soil temperature (°C; right) under different treatments. Error bars denote the standard deviations (n = 4).
Forests 13 00772 g002
Figure 3. Monthly dynamics of soil N2O ((a); µg·N2O/m2·h) and CH4 ((b); µg·CH4/m2·h) fluxes under different treatments. Error bars represent standard deviations of mean CH4 and N2O fluxes (n = 4).
Forests 13 00772 g003
Figure 4. The structural equation model explaining the direct and indirect effects of N and P additions and soil properties on soil N2O fluxes across all treatments. SEM model parameters: χ2 = 18.11, df = 18, RMSEA = 0.008 and GFI = 0.90. Black and wide arrows indicate significant positive relationships and red arrows indicate significant negative relationships (p < 0.05). The thin and light-colored arrows indicated insignificant effects. Numbers on arrows are standardized path coefficients. The width of an arrow indicates the relative strength of the causal influence.
Forests 13 00772 g004
Figure 5. The structural equation model explaining the direct and indirect effects of N and P additions and soil properties on soil CH4 uptakes across all treatments. The SEM model parameters: χ2 = 15.27, df = 25, RMSEA = 0.000 and GFI = 0.93. Black and wide arrows indicate significant positive relationships and red arrows indicate significant negative relationships (p < 0.05). The thin and light-colored arrows indicate insignificant effects. Numbers on arrows are standardized path coefficients. The width of an arrow indicates the relative strength of the causal influence.
Forests 13 00772 g005
Table 1. The carbon and nutrient concentrations in the Chinese fir plantation under different treatments. Note: the numbers in the parenthesis are the standard deviations (n = 5). Different letters between treatments denote significant (p < 0.05) differences.
VariablesCKLPHPHNHNLPHNHP
NH4+ (mg/kg)12.62 (0.76) b11.61 (0.86) b12.80 (1.17) b14.22 (1.97) a14.87 (2.08) a12.88 (1.36) b
NO3 (mg/kg)3.71 (0.076) b4.78 (0.42) ab3.86 (0.18) b4.46 (0.36) b4.80 (0.33) ab5.89 (0.30) a
MBN (mg/kg)54.21 (9.47) a22.23 (1.35) b24.08 (1.17) b54.53 (9.26) a32.39 (4.36) b28.55 (4.18) b
MBC (mg/kg)137.55 (9.13) b173.94 (18.94) a206.76 (15.56) a158.65 (11.44) ab159.07 (7.74) ab198.59 (12.70) a
WSOC (mg/kg)46.93 (2.88) c80.20 (3.52) ab96.48 (5.85) a62.69 (5.16) c63.37 (2.02) bc91.50 (3.85) a
Leaf N (g/kg)7.55 (0.11) a8.00 (0.27) a7.05 (0.30) a7.96 (0.81) a8.75 (0.99) a9.22 (0.86) a
Soil TN (g/kg)0.86 (0.036) a0.90 (0.040) a0.91 (0.043) a1.04 (0.095) a1.00 (0.097) a1.00 (0.082) a
SOC (%)1.55 (0.031) ab1.67 (0.10) ab1.86 (0.12) a1.47 (0.06) b1.81 (0.11) ab1.57 (0.048) ab
Soil TP (g/kg)0.13 (0.014) b0.14 (0.010) b0.23 (0.024) a0.13 (0.011) b0.13 (0.008) b0.15 (0.025) ab
Table 2. Average N2O emissions and CH4 uptakes in a subtropical Chinese fir plantation over the first 4 months and the entire study period. Different letters denote significant (p < 0.05) differences between treatments.
TreatmentsN2O (μg/m2·h)CH4 (μg/m2·h)N2O (μg/m2·h)CH4 (μg/m2·h)
4 MonthsAll Months
CK32.06 (11.69) b−34.92 (7.74) a30.63 (12.42) a−35.06 (7.22) a
HN57.86 (15.13) a−35.37 (6.47) a40.17 (17.98) b−35.58 (7.12) a
HNLP63.30 (16.73) a−39.74 (7.03) ab41.83 (21.23) b−37.23 (8.07) ab
LP38.08 (8.02) b−43.42 (8.51) bc32.57 (13.93) a−38.28 (9.04) ab
HNHP61.09 (13.52) a−49.94 (6.52) c43.346 (19.55) b−40.75 (9.76) b
HP37.15 (9.09) b−51.03 (7.37) c32.88 (13.39) a−40.60 (10.83) b
Table 3. Two-way ANOVA for mean N2O emissions and CH4 uptakes over the first 4 months and all months under the N and P treatments in the subtropical Chinese fir plantation. F: mean square ratio, P: p-value.
TreatmentsN EffectP EffectN × P Interaction
FPFPFP
N2O4 months86.44<0.051.620.200.040.96
All months25.92<0.050.690.500.040.96
CH44 months0.870.3533.30<0.050.610.54
All months0.020.909.52<0.050.220.80
Publisher’s Note: MDPI stays neutral with regard to jurisdictional claims in published maps and institutional affiliations.

