Article

Parsing Long-Term Tree Recruitment, Growth, and Mortality to Identify Hurricane Effects on Structural and Compositional Change in a Tropical Forest

by
Jiaying Zhang
1,*,
Tamara Heartsill-Scalley
2 and
Rafael L. Bras
1
1
School of Civil and Environmental Engineering, Georgia Institute of Technology, Atlanta, GA 30332, USA
2
International Institute of Tropical Forestry, USDA Forest Service, Río Piedras, PR 00926, USA
*
Author to whom correspondence should be addressed.
Submission received: 18 April 2022 / Revised: 13 May 2022 / Accepted: 17 May 2022 / Published: 19 May 2022
(This article belongs to the Section Natural Hazards and Risk Management)

Abstract

:
After hurricane disturbances in tropical forests, the size structure and species composition are affected by immediate mortality, and subsequent recruitment and individual growth. Often, immediate post-disturbance stand-level data are presented but understanding of the components that affect changes in growth and longer-term responses to forest structure and composition are lacking. To answer questions about how mortality, recruitment, and growth change among successional Plant Functional Types (PFT) through time after a hurricane disturbance, we use long-term census data (1989–2014) collected in the Luquillo Experimental Forest, Puerto Rico. We developed an algorithm to fill missing diameter data from the long-term data set that was collected three months after Hurricane Hugo; and subsequently at five-year intervals. Both the immediate hurricane-induced mortality and subsequent mortality were lower in stems with larger diameters, but varied among successional PFTs Early, Mid, Late, and Palm. Tree growth rates were observed to decrease with time since the hurricane disturbance. Five years after the hurricane, mortality was minimal but then increased gradually with time. In contrast, recruitment was highest five years after the hurricane and then decreased with time. The palm Prestoea montana became the most abundant species in the forest after the hurricane, as it had the lowest immediate hurricane-induced and subsequent mortality, and the highest recruitment. Twenty-five years after the hurricane, the palm and the Late PFT dominate the forest after shifting species composition from pre-hurricane conditions.

1. Introduction

Hurricanes have major effects on tropical forests [1,2,3,4,5,6]. Hurricane-force winds (compounded and aided by heavy rains, saturated soils, and loosened roots [4,7]) uproot and snap trees, break branches, and defoliate surrounding vegetation. The results are gaps in the forest and hence increasing light levels within the forest canopy [8]. Defoliation may recover in months to years [9,10,11,12,13,14], but forest structure and composition may shift over decades following three stages of species succession [15,16,17,18,19]. Early successional (pioneer) species establish and recruit in open gaps formed after hurricane disturbances, growing rapidly in the high light environment. Mid successional species, which have intermediate growth rate and are somewhat shade tolerant, gradually substitute early successional species as the gaps close and the canopy recovers. Late successional species, which have low growth rates and are shade tolerant, reach the canopy, and become dominant in the plant community as the forest matures until the next disturbance.
Forest composition and structure are also critical to hurricane-induced mortality–less wind-resistant structure and composition would lead to higher mortality, especially when combined with higher exposure to hurricane winds [20]. Under the changing climate, hurricanes are expected to increase and become more intense over the Atlantic Ocean [21,22]. Damage from higher intensity and more frequent hurricane disturbances will change the structure and composition of the forest, inevitably affecting the resulting succession patterns and hence the conditions at the time of subsequent disturbances. Therefore, it is critical to understand the drivers of forest structure and composition during the succession.
A previous study pointed out that the demographic components such as recruitment, tree growth, and mortality drive the changes in biomass of second-growth tropical forests during the secondary succession [23]. Specifically, the biomass change was largely driven by tree growth in the early successional stage, and growth and mortality in the late successional stage. However, the forest structure and composition are not investigated. To understand how demographic components (mortality, recruitment, growth) contribute to the observed changes in forest composition and structure after a disturbance, we investigate the effects of hurricane Hugo on long-term patterns of forest structure and composition on a mature secondary forest at the Bisley Experimental Watersheds in the Luquillo Experimental Forest in Puerto Rico using long-term tree census observations.
Furthermore, topography affects species distribution and forest mortality from hurricane disturbances [11,12,13,14,15,24], and thus forest structure and composition in the long term. However, whether the demographic rates during the succession after a hurricane disturbance vary with topography has not been investigated. Therefore, we will also investigate the species distribution and demographic rates on different topographic settings (including valleys, ridges, and slopes) using the tree census observations at the study site.
The objectives of this study are to investigate the effects of hurricane Hugo on long-term patterns of forest structure and composition of a mature secondary forest in the Luquillo Experimental Forest in Puerto Rico. We examine the demographic dynamics of the most abundant species, and of successional Plant Functional Types (PFT)–Early, Mid, Late, and Palm–as palms are abundant components of tropical forests, have allometry and life history traits that appear to be important for hurricane disturbances, and are distinct from trees [25,26,27].

2. Materials and Methods

2.1. Study Site

The Bisley Experimental Watersheds (hereafter Bisley; 18°20′ N, 65°50′ W) are located in the Luquillo Experimental Forest, northeastern Puerto Rico. Bisley is part of the Luquillo Long Term Ecological Research (LTER) program and data sets from on-going and previous research are available (https://luquillo.lter.network/data-catalog/ accessed on 17 April 2022) [28]. The forest site ranges between 260 to 400 m above sea level, with a steep landscape that receives an average of 3500 mm precipitation per year, and it is exposed to storms, hurricanes, landslides, Saharan dust, and deposition from Caribbean volcanic activity [29,30].
The forest type at Bisley is found in other Caribbean islands [24,31] and it is locally known as tabonuco or DacryodesSloanea vegetation association. The dominant species are Dacryodes excelsa (also known as tabonuco), Sloanea berteriana, and Prestoea montana var. acuminata, hereafter referred to as Prestoea montana [14,29]. The distribution of watershed-scale species composition, aboveground biomass, and forest turnover at Bisley have been associated to the characteristic geomorphic/terrain settings at the site: ridges, slopes, and valleys [14,32]. The geomorphology, soils, and disturbance history of Bisley are described in detail elsewhere [14,32,33,34,35].
The forest at Bisley had timber selectively removed, supported local-scale charcoal production and subsistence agriculture [33], and was noted to have sustained damage by Hurricanes San Felipe in 1928 and San Cipriano in 1932 (reported by Gerhart 1934 in [33]). Hurricane Hugo (category 3), passed over the site on 18 September 1989, was the largest storm to affect the area since the 1930s, and resulted in significant damage to the forest [29]. By the time of Hurricane Hugo, Bisley was a mature secondary forest that had recovered its stem density and basal area after selective logging. Hence, the recovery of the forest from Hurricane Hugo is defined as secondary succession (a natural disturbance in mature native secondary forest) [36]. After Hugo in 1989, nine other named storms and hurricanes have passed near the area [30,37], but only Hurricane Georges (category 3), in 1998, resulted in localized defoliation and minimal mortality in the study area [14,38]. The most recent hurricanes at Bisley–Irma and Maria (September 2017)–are addressed in separate studies [20].

2.2. Diameter and Species Observations

Eighty-five permanent plots were established at Bisley in 1989 and censuses were conducted three months before Hurricane Hugo (pre-Hugo 1989), three months after the hurricane (post-Hugo 1989), and every five years since then (1994, 1999, 2004, 2009, and 2014). The pre-Hugo census was started in late 1988 and was completed in the summer of 1989 (three months before the hurricane), the post-Hugo census was started three months after Hugo and completed within five months. Other censuses were started in April and completed between June and July of their respective year. In addition, six more plots were established in 1994–one in 2009, and three in 2014–making 95 plots in total. The plots are 10-m diameter circles and 40 m apart in a grid extending over 13 hectares. The topographic location of each plot is recorded (i.e., valley, slope, and ridge). Stems in the plots with diameter at breast height (1.3 m above the ground) (DBH) equal to or greater than 2.5 cm were tagged, the species were identified, DBH measured (with a precision of 0.1 cm), and heights (H) of the two tallest stems per plot were measured. The tag number of each stem is unique at the plot level and provides the year the stem was first recorded in the census. The pre-Hugo 1989 census was completed three months before the hurricane, and the post-Hugo 1989 census was started three months after the hurricane, thus they directly measure the immediate mortality caused by the hurricane–mortality meaning that no recovery was found in later censuses.
The plots at Bisley were initially established to explore watershed scale biomass and forest standing stocks and protocols appropriate for that purpose were used. Previous studies at this site investigated the relative changes in standing stocks, estimates on stem density, basal area, aboveground biomass, and species richness and diversity in relation to succession after Hurricane Hugo [14,29,39,40]. Those studies, however, lacked long-term analyses of mortality, recruitment, and growth rates in response to hurricane disturbance.

2.3. Plant Functional Types (PFT) of Species

Sixty-six species were identified, including a species of herb (a banana species Musa x paradisiaca), a palm species Prestoea montana, two species of tree-ferns (Cyathea arborea and C. portoricensis), and 62 species of trees. The banana species disappeared from the forest after Hurricane Hugo in 1989. We categorized species into successional plant functional types (PFT) based on their documented response to disturbances [40,41,42,43,44]. The classification into PFT is a complementary approach to understand forest recovery and succession, and to contribute to on-going modeling efforts of vegetation dynamics [45,46,47]. The classifications of PFT have important applications for predictive ecology and modeling, serving to reduce the large numbers of plant species into a smaller quantity of functional classes based on ecological concepts [48,49]. Building upon a previous work [44], in a study of this same forest (Luquillo Experimental Forest) and same forest type (tabonuco), the species of trees and tree-ferns are categorized into one of three tropical successional PFTs: Early, Mid, or Late (Table S1 for the PFT of each species). Early PFT includes species that establish and recruit in open canopy and gaps formed after disturbances and grow rapidly in the high light environment. Mid PFT includes species that have intermediate growth rates and are somewhat shade tolerant. Late PFT includes species that have low growth rates and are shade tolerant. Very few species were not classified by previous studies [41,42,43,44], and in the rare case that a species was still not classified after the above two steps, we assigned a PFT to the species based on descriptions of successional traits such as seed characteristics, recruitment, and growth [50,51].
Previous studies have either excluded palms from analyses [52] or considered palms as a mid or late successional species [41,42,43,44]. However, the palm Prestoea montana possesses some early successional traits, such as low “wood” density and high fecundity under open canopy [53,54], allowing them to recruit quickly when the canopy opens; and some late successional traits, such as tolerance to shade [26], which favor their growth and survival when the canopy closes. Therefore, following a previous study [20], we separate the palm species from the three broadly used successional PFTs and categorize it as Palm PFT.

2.4. Data Analyses

We estimated the missing values in the dataset (Supplementary Information S1) and calculated lower bounds for the measurement error (Supplementary Information S2). To study the mortality and recruitment changes with time since disturbance, we calculated the recruitment rate of each PFT in each five-year census interval, and the mortality rate of each PFT and of each DBH class. The recruitment rate was calculated as the percentage of the number of newly recruited stems to the number of stems that were alive in the previous census. Similarly, the mortality was calculated as the percentage of the number of stems that existed in the previous census but not in the current census to the number of stems that existed in the previous census. The immediate hurricane-induced mortality was calculated as the percentage of the number of stems that existed in pre-Hugo census but not in post-Hugo census to the number of stems that existed in pre-Hugo census.
Diameter growth was calculated as the diameter measurement difference between two consecutive five-year-interval censuses. Given the sampling rate of the census, our estimates of growth were cm per 5-years but expressed as cm per year (cm yr−1) of each standing stem. The relative stem diameter growth rate (%) was calculated as the ratio of the absolute diameter growth rate to the previous-census diameter, expressed as a percentage. Similarly, we calculated the absolute basal area growth rates (cm2 yr−1) of each stem. Aboveground biomass (AGB) of each tree was calculated as A G B = exp ( 2.475 ln ( D B H ) 2.399 ) following the equations from Scatena et al. [29]. The growth rates of each species and PFT during each census interval were analyzed to identify the differences among species and among PFTs, and their changes with time since disturbance. Mortality and growth rates were calculated for each stem separately, and then grouped according to PFT. Note that height growth is more significant than diameter growth for the palm species [53,54]. However, since we do not have height information for all palms, we did not calculate the height growth for palms.
Lastly, to explore forest community structure and composition over 25 years, we selected the most abundant species to quantify the proportional changes in species composition. The most abundant species were defined as those whose individual abundance accounts for more than 5% of the total abundance in the forest in one or more censuses. Seven species were selected as abundant: two Early species (Cecropia schreberiana (CECSCH) and Psychotria berteriana (PSYBER)), one Mid species (Ocotea leucoxylon (OCOLEU)), three Late species (Sloanea berteriana (SLOBER), Dacryodes excelsa (DACEXC), and Cyathea portoricensis (CYAPOR)), and the Palm species (Prestoea montana, PREMON). The seven species in total account for 62%, 60%, 74%, 67%, 65%, 64%, and 66% of the total abundance in each of the seven censuses, respectively.
To identify the effect of topography on species distribution, we calculated the averages of the proportion of each species across plots with the same topographic setting; slopes, valleys, and ridges [38]. The species proportion in a plot is defined as the ratio between the number of stems of the species to the total number of stems in the plot. To identify the effect of topography on demographic rates, we calculated the distribution of growth rate for stems within each topographic setting and tested the difference of the distribution between any two settings using two-sample t test. For mortality and recruitment, we calculated the rates using plots with the same topographic settings and tested the difference of the rates between any two settings using a z-score test [55] following Zhang et al. [20].

3. Results

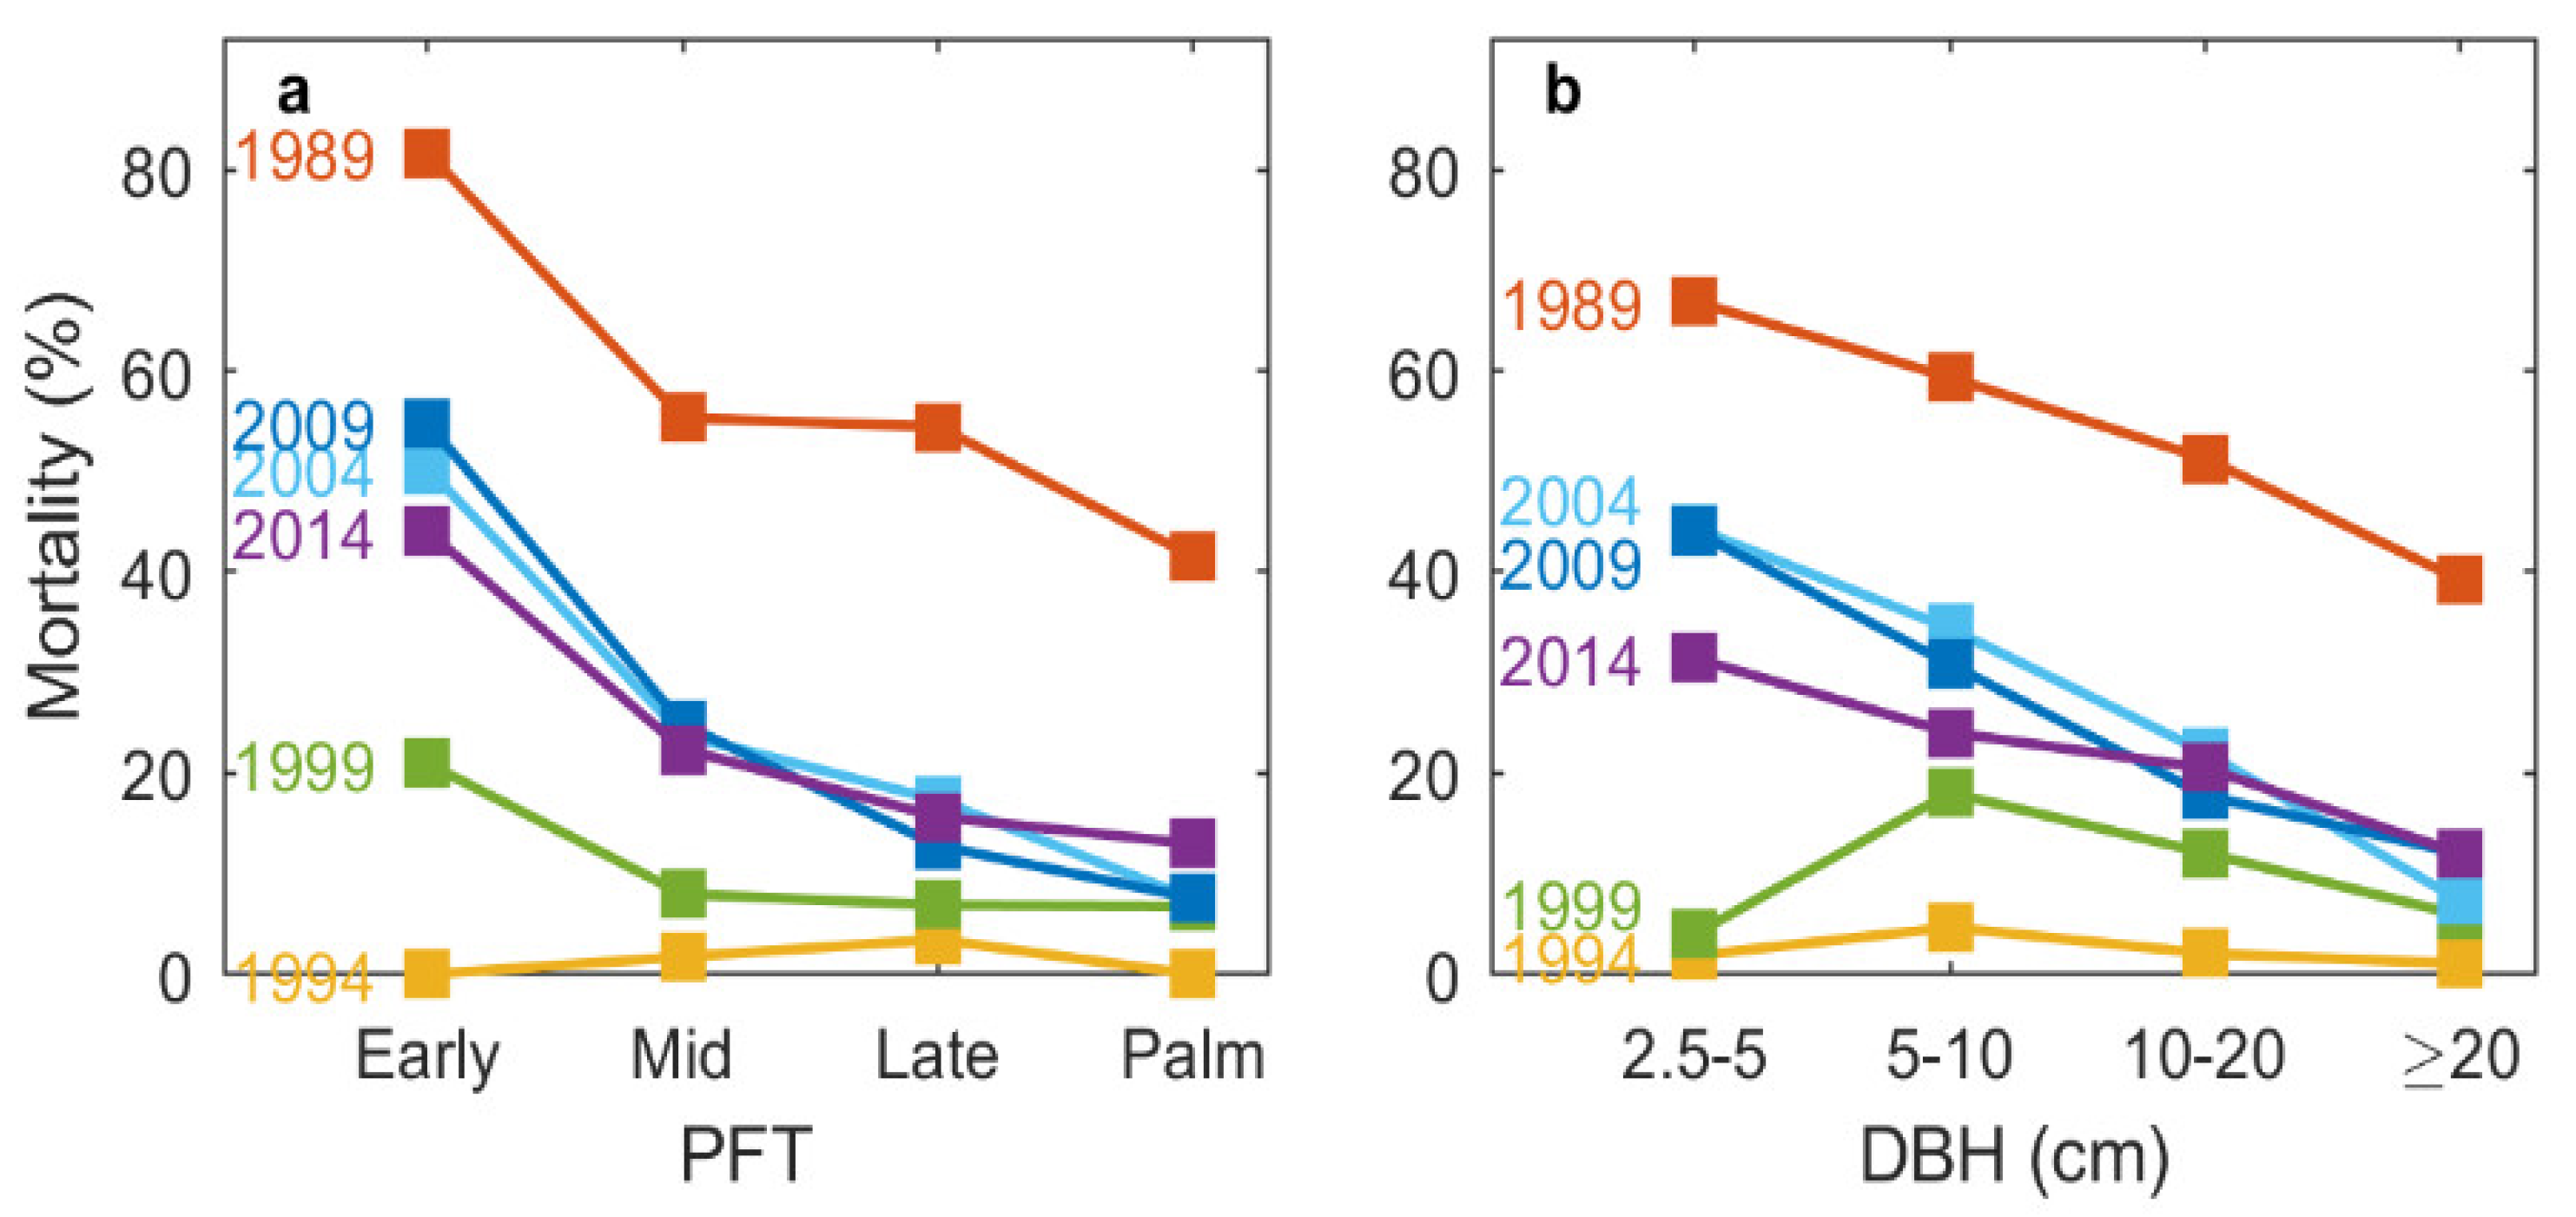
3.1. Mortality and Recruitment over the Course of 25 Years

The overall immediate stem mortality from Hurricane Hugo (1989) was 58%. Mortality varied among PFTs, with Early PFT having the highest (82%), followed by Mid (55%), then Late (54%), and with Palm (42%) having the lowest mortality value (Figure 1a) overall. Immediate hurricane-induced mortality and subsequent mortality varied by diameter classes (Figure 1b). Smaller stems had higher mortality than larger stems for all censuses except censuses 1994 and 1999, where intermediate diameter stems (DBH between 5 and 10 cm) had the highest mortality among the four diameter classes.
Five years after Hurricane Hugo (1994), all PFTs recruited new stems into the census. Early PFT had the highest recruitment rate (1665%), followed by Palm (95%), then Mid (45%), and then Late (16%) (Table 1). Meanwhile, mortality was very low for all PFTs (0%, 2%, 3%, and 0% for Early, Mid, Late, and Palm, respectively) five years after the hurricane (Figure 1a). Ten years after the disturbance (1999), the recruitment rate of Early (104%) decreased significantly, Palm (86%) decreased slightly, while Late (44%) and Mid (132%) increased significantly (Table 1). Although mortality was observed in more than half of the stems immediately after the hurricane, the decrease in basal area and aboveground biomass was only 42% and 40%, respectively (Table 2). After 15–20 years, the recruitment rate for the three successional PFTs decreased (5%, 8%, 10% for Early, Mid, and Late, respectively), while mortality increased (55%, 25%, 13% for Early, Mid, and Late PFTs, respectively); however, Palm had the highest recruitment rate (15%) and lowest mortality rate (8%) among the four PFTs (Table 1; Figure 1a). After 25 years, the recruitment rate and mortality rate became stable (Table 1; Figure 1a). The mortality of Palm remained the smallest among the four PFTs throughout the 25 years since the hurricane (Figure 1a).

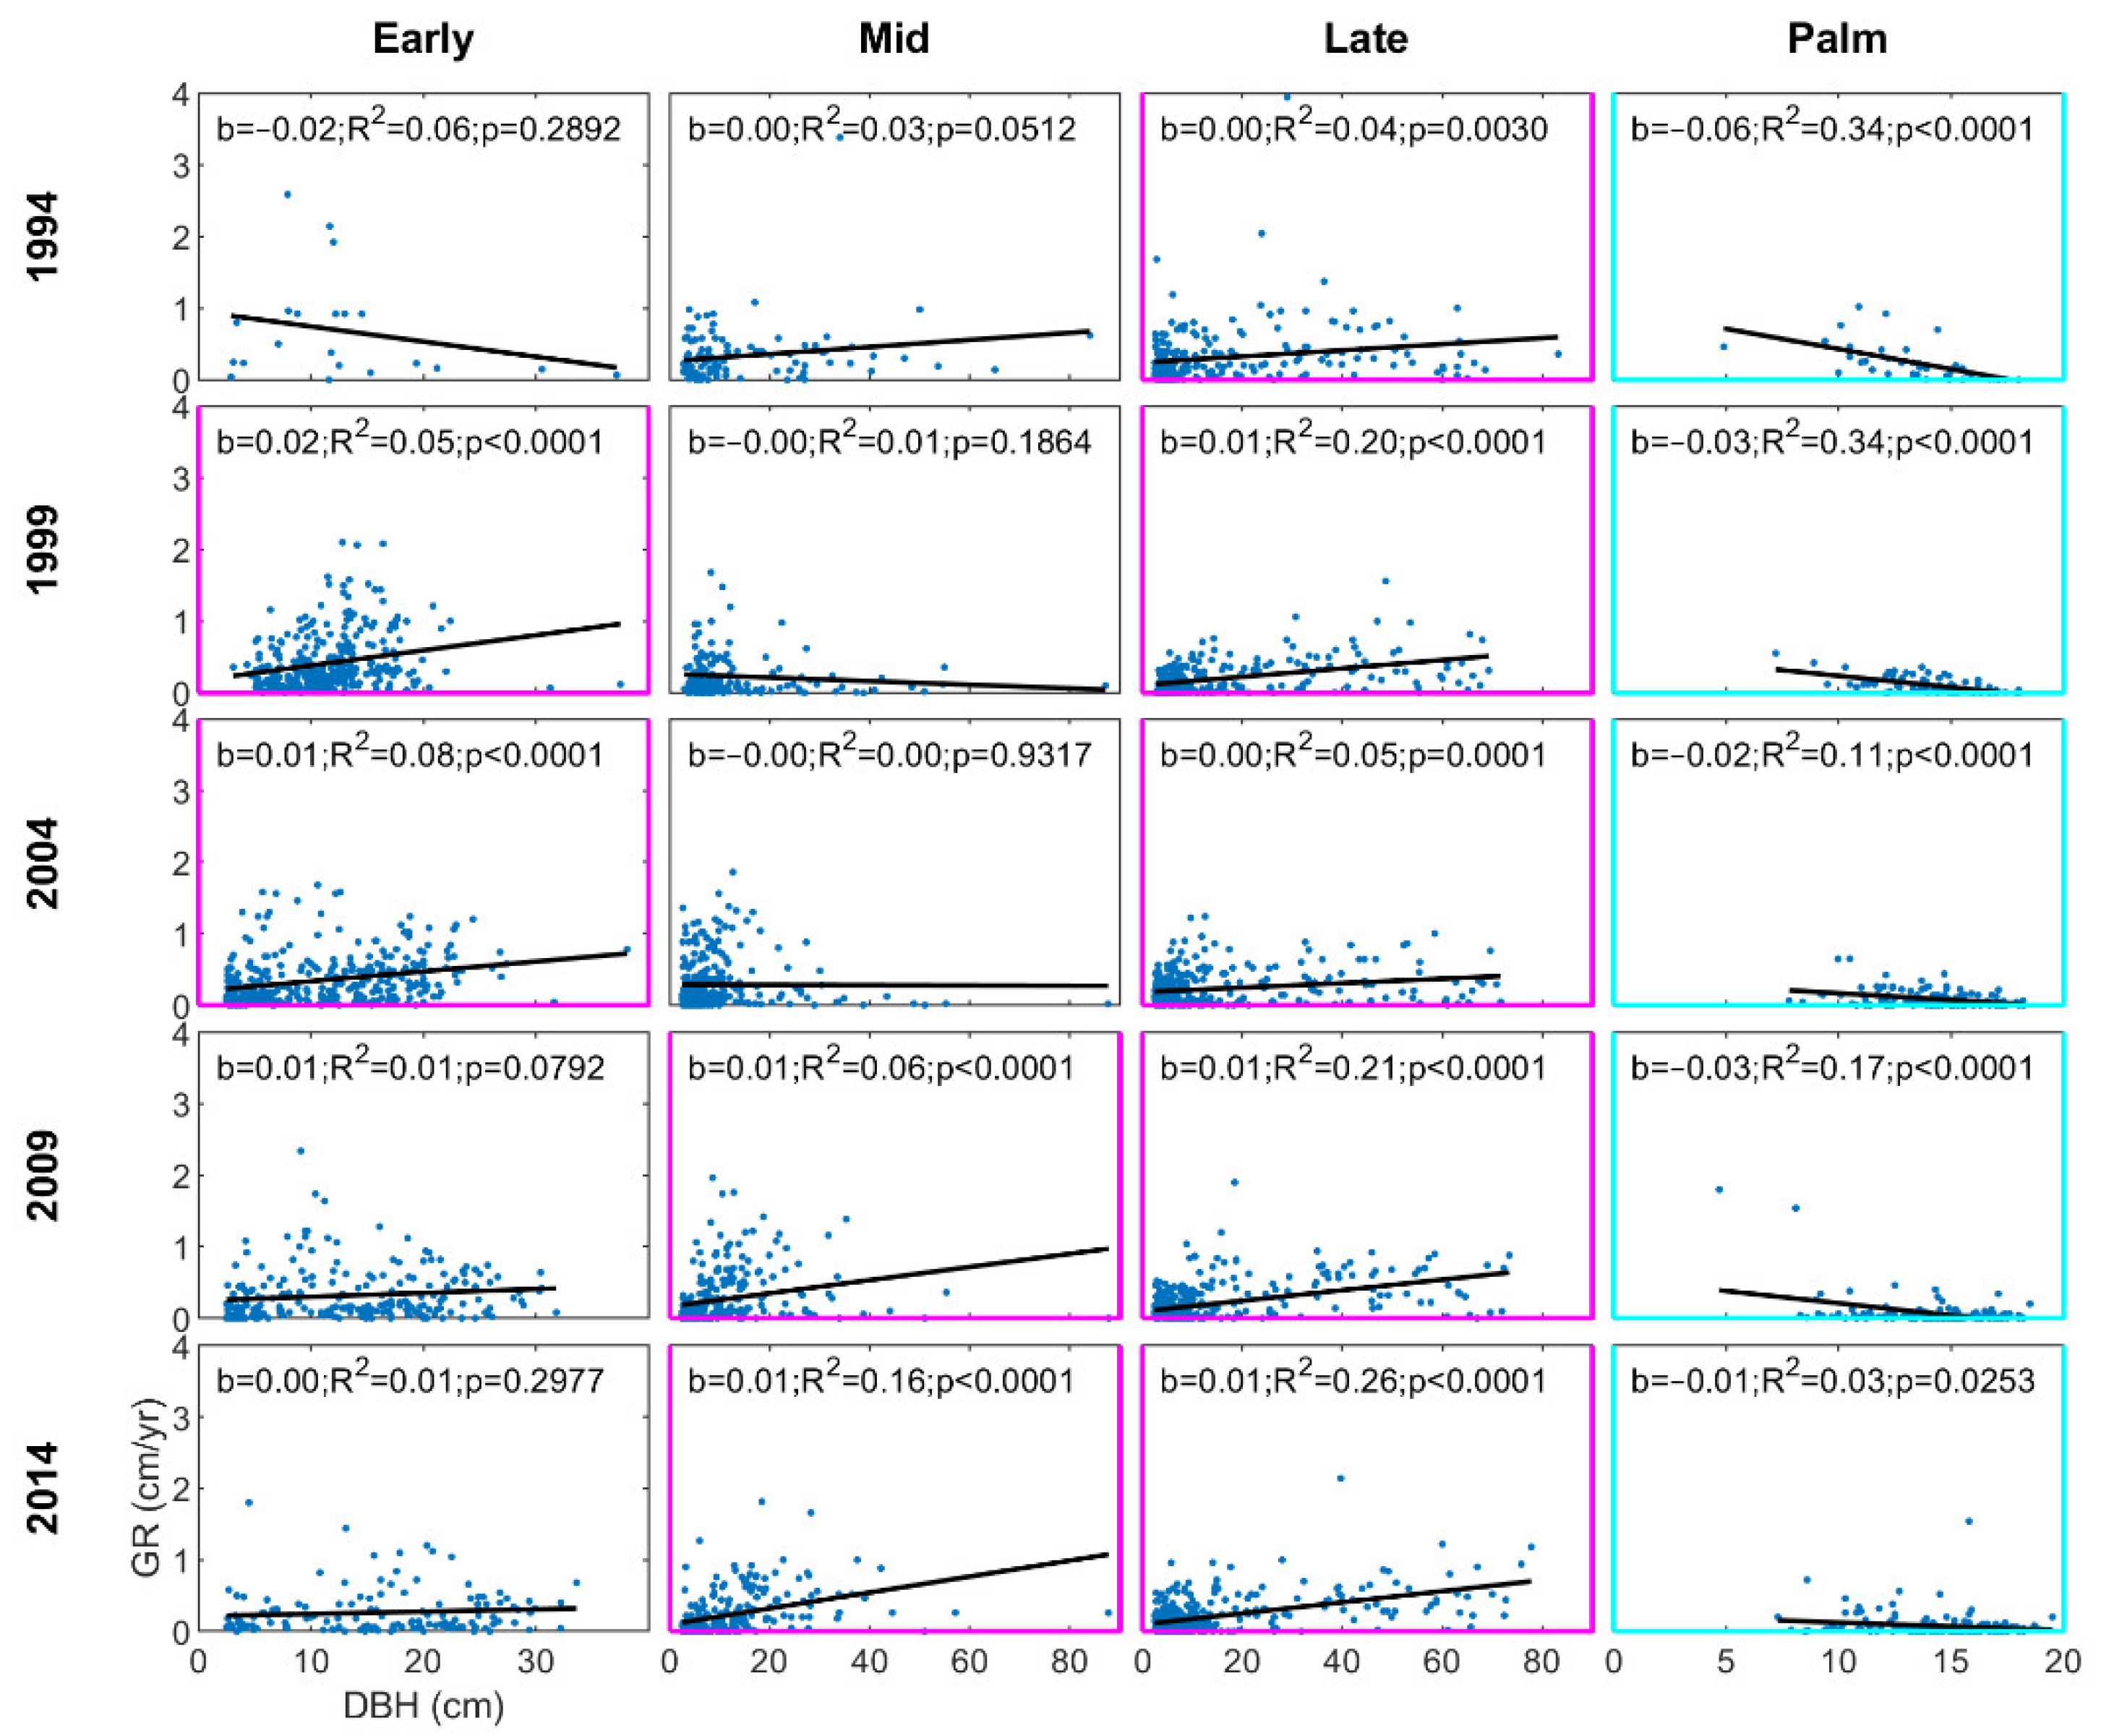
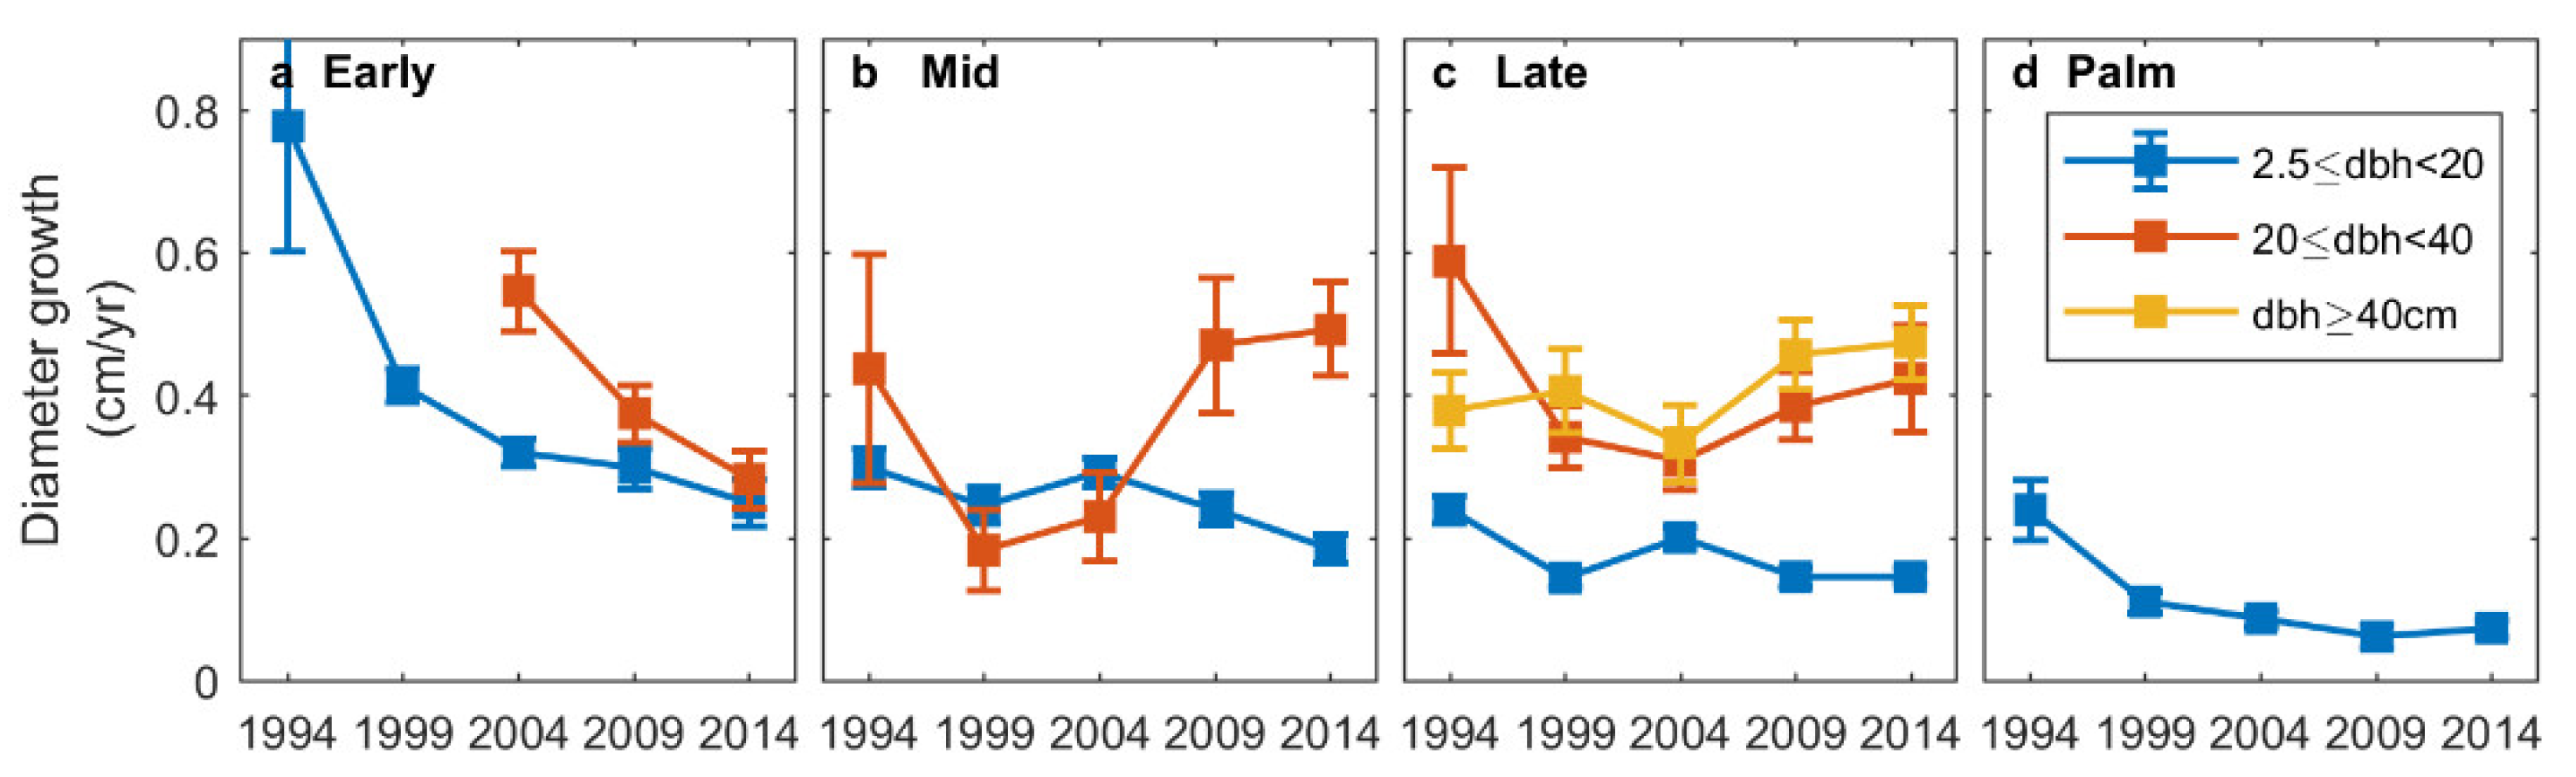
3.2. Diameter Growth Rates

For all stems during the 25-year study period, average diameter growth rate decreased as time after the disturbance increased: 0.33 ± 0.02 cm yr−1 in 1994, 0.28 ± 0.01 cm yr−1 in 1999, 0.26 ± 0.01 cm yr−1 in 2004, 0.22 ± 0.01 cm yr−1 in 2009, and 0.19 ± 0.01 cm yr−1 in 2014. The differences between any two censuses are significant (p < 0.05) according to two-sample t test, except for censuses 1999 and 2004 (p = 0.1437), and censuses 2009 and 2014 (p = 0.0891). Growth rates also varied among PFTs and among stem sizes (Figure 2). The growth rate of the Palm PFT decreased with diameter (negative regression coefficient b) and the negative correlation was significant (p < 0.05) in all censuses. The growth rate of the three successional PFTs generally increased with diameter (positive regression coefficient b). The positive correlation of growth rate and diameter was significant (p < 0.05) in all censuses for the Late PFT. In contrast, the positive correlation of growth rate and diameter was significant only 10 and 15 years after the hurricane (1999 and 2004) for the Early PFT, and 20 and 25 years after the hurricane (2009 and 2014) for the Mid PFT (Figure 2). However, in the cases with a statistically significant regression coefficient, the coefficient of determination and the regression coefficient itself are very small, denoting a very weak relationship.
For all stems with diameter less than 20 cm, the average growth rate was the highest in census 1994, five years after the hurricane. Average growth rate decreased with time since the hurricane disturbance for all PFTs, especially for the Early and Palm PFTs (Figure 3). For stems with diameter between 20 and 40 cm, the growth rate of the Early PFT decreased with time since disturbance (Figure 3a), while the growth rate of the Mid and Late PFTs first decreased and then increased with time since disturbance (Figure 3b,c). For stems with DBH larger than 40 cm, the growth rate of Late increased with time since disturbance.
Larger stems have lower relative growth rates as observed in Late PFT stems (Figure S6c). Like the absolute growth rate, the relative growth rate also decreased with time since disturbance, especially for Early and Palm PFTs, and Mid and Late PFTs with small diameters (Figure S6a–d). Basal area growth is derived from diameter and is highly correlated with diameter growth (Figure S6e–h).

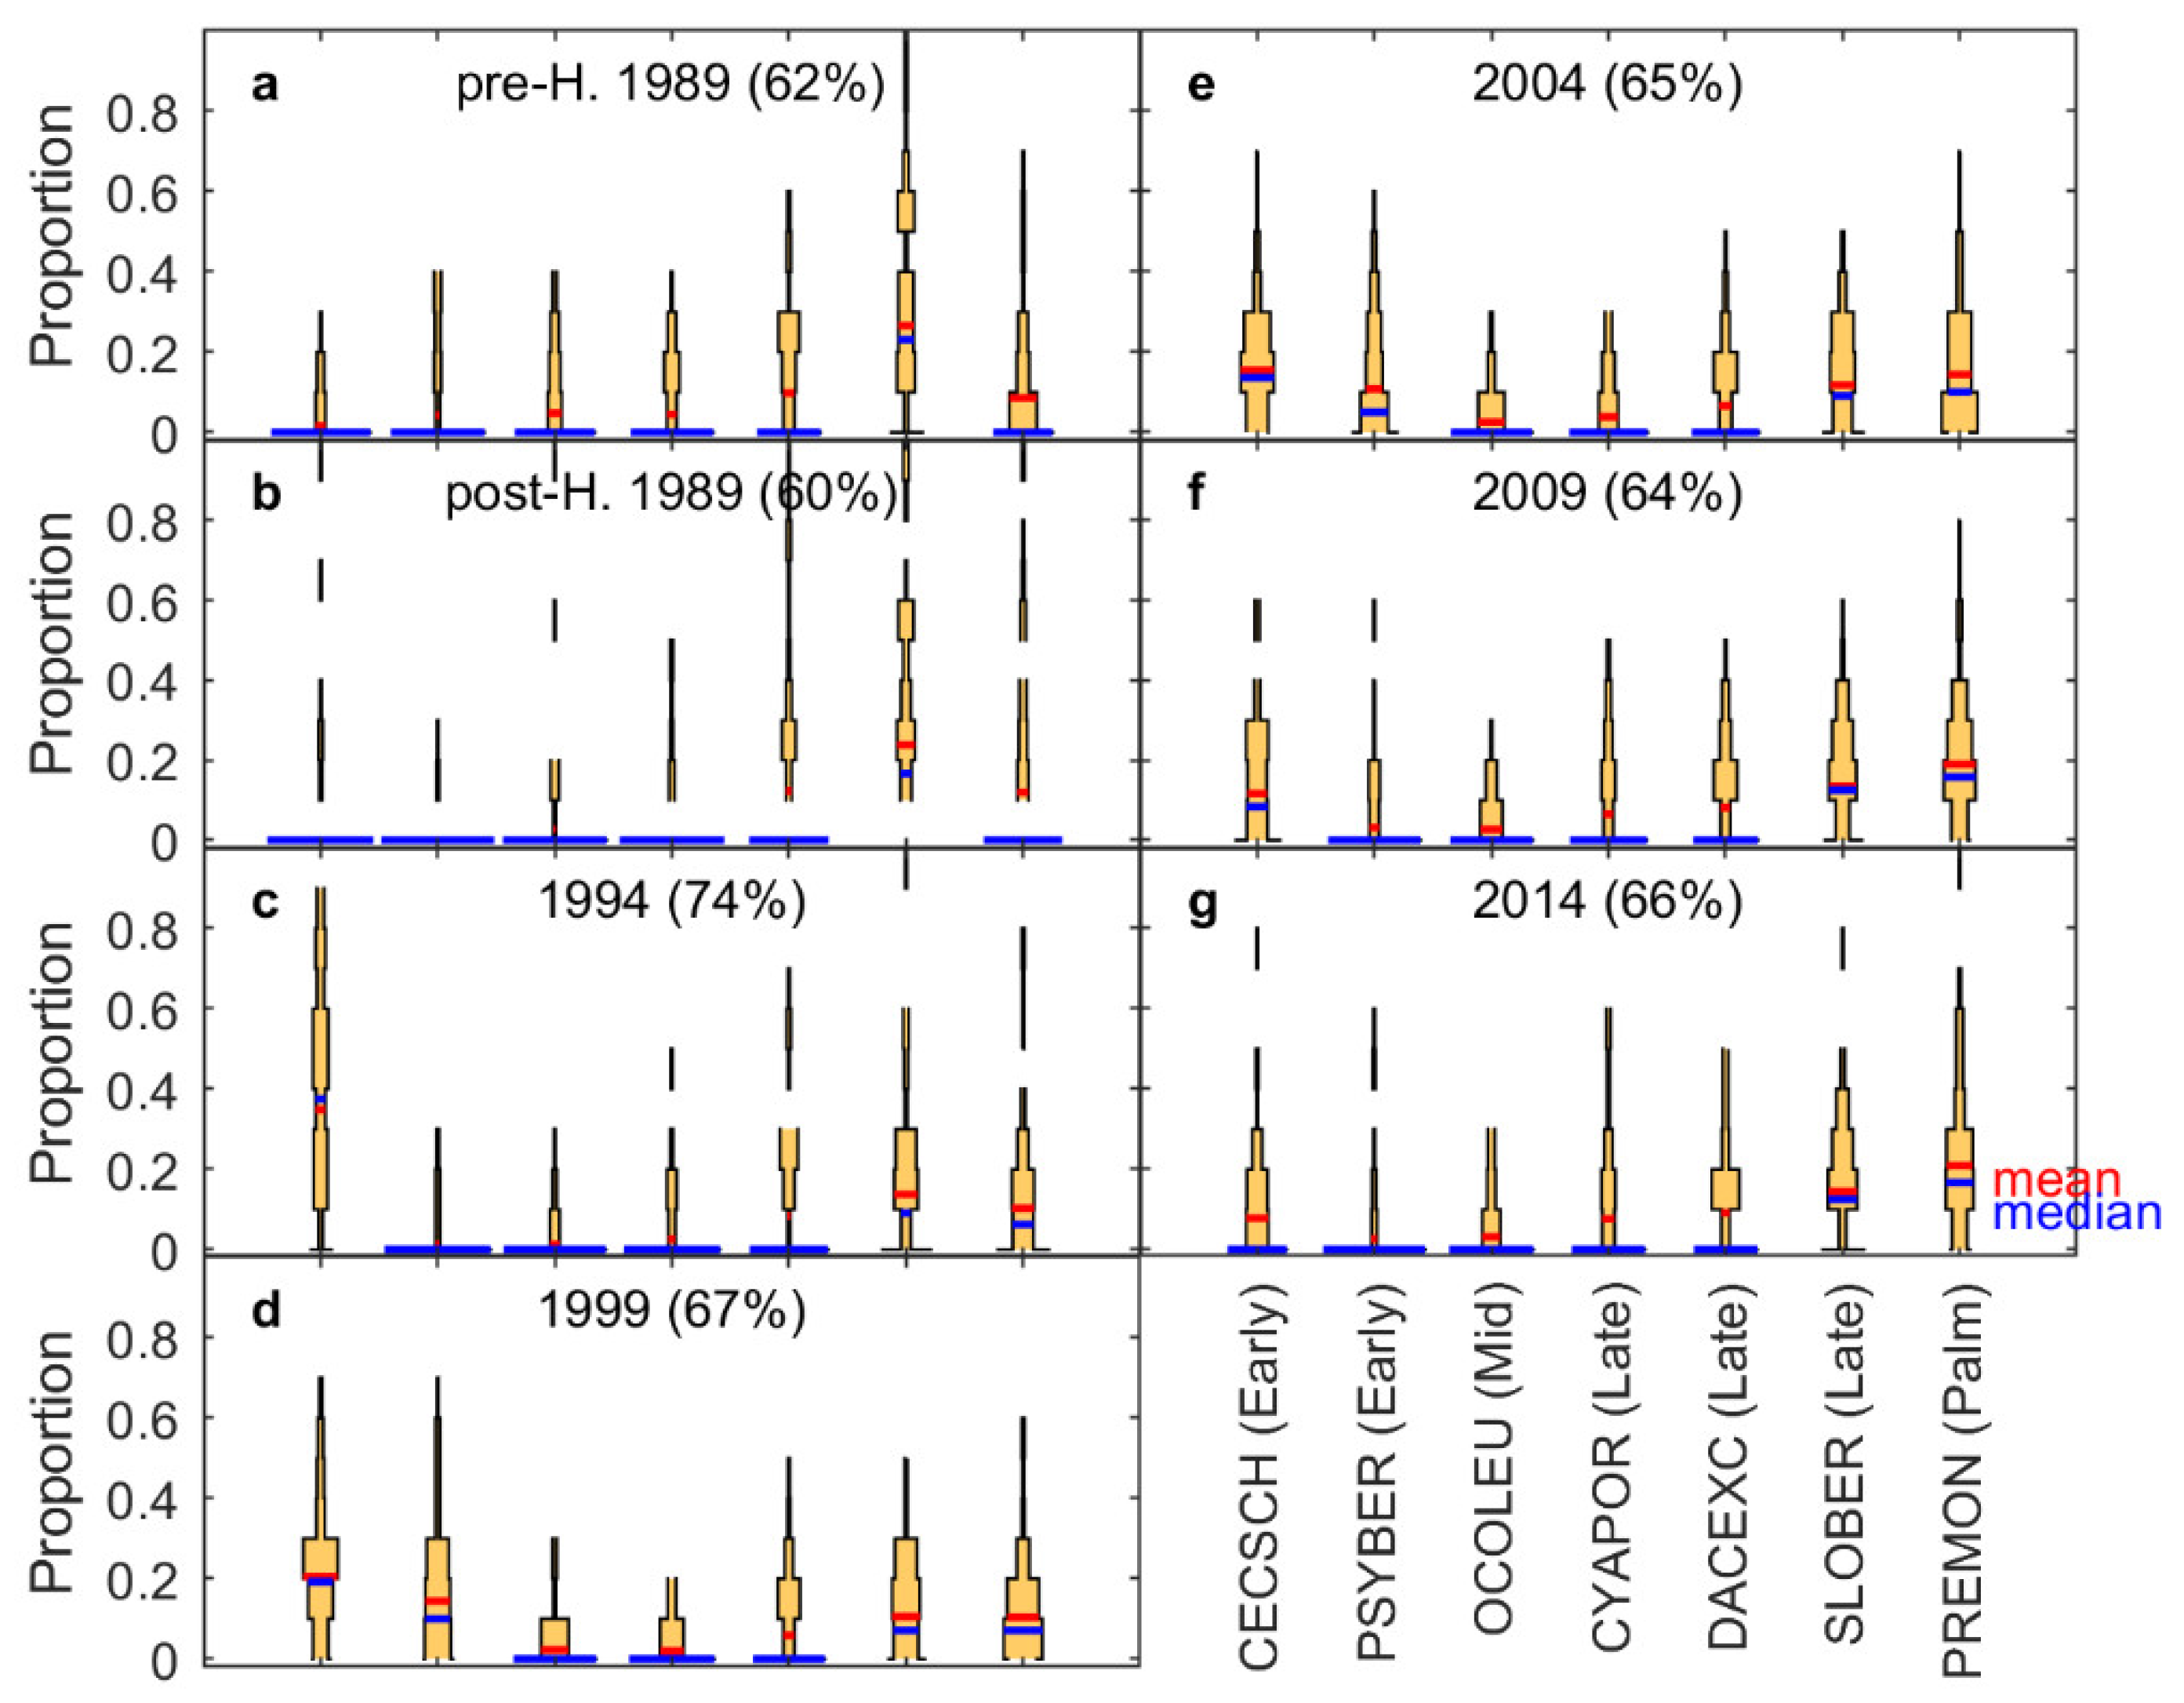
3.3. Shifts in Species Composition

Shifts in species composition of the forest were quantified by focusing on the proportions of the seven most abundant species through time (Figure 4). In terms of abundance, the forest was originally dominated by two Late successional species, Sloanea berteriana (SLOBER) and Dacryodes excelsa (DACEXC) (Figure 4a). For the ten years following Hurricane Hugo (Figure 4c,d), Early successional species Cecropia schreberiana (CECSCH) and Psychotria berteriana (PSYBER) recruited and increased and then started to decrease 20 and 25 years later (Figure 4f,g). Mid successional species Ocotea leucoxylon (OCOLEU), which was less abundant after the hurricane (Figure 4b), recruited and increased in proportion ten years after the hurricane (Figure 4d) and then maintained its abundance (Figure 4e–g). The Late successional species SLOBER and DACXEC also began to increase their abundance 15 years after the hurricane, surpassing the Early successional CECSCH and PSYBER, then maintaining their abundance 25 years later (Figure 4e–g). Another Late successional species, the tree-fern Cyathea portoricensis (CYAPOR), surpassed its pre-disturbance abundance and became a dominant species in the forest in 2014 (Figure 4g). The Palm species PREMON increased its dominance in the forest after the disturbance (Figure 4b) and continued to increase throughout the 25 years after the disturbance and became the most abundant species in the forest by 2014 (Figure 4c–g).

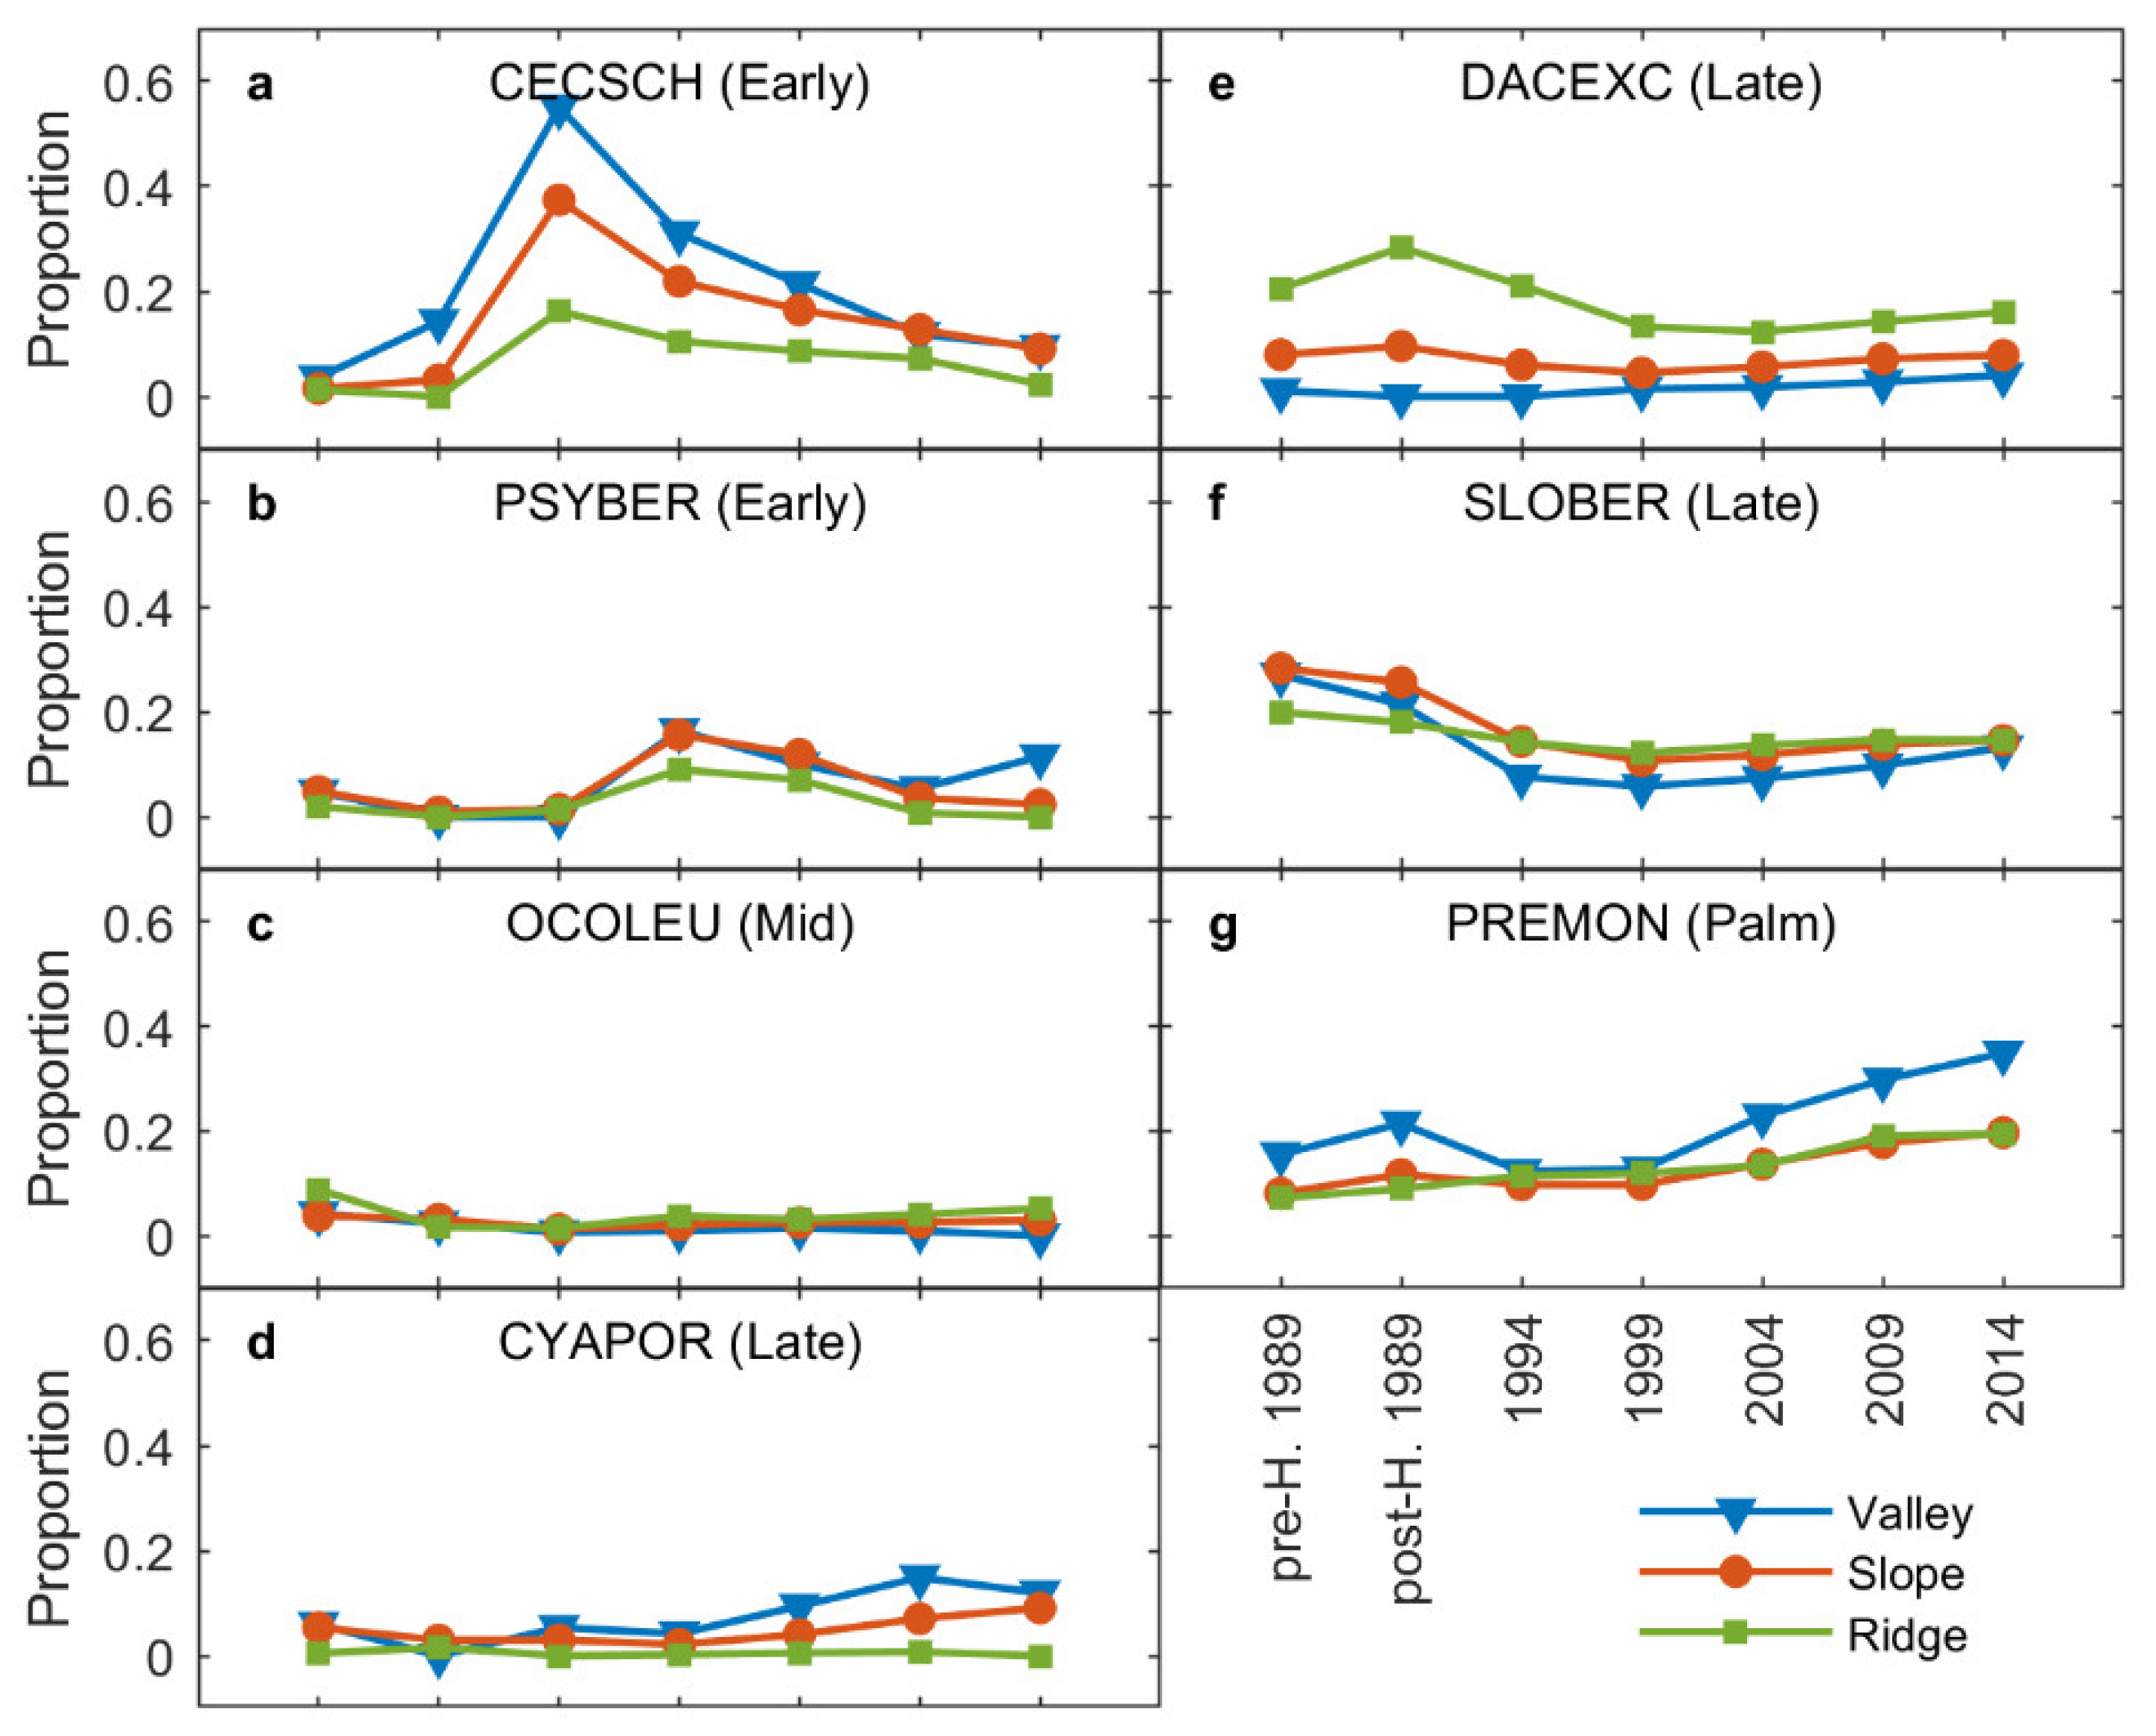
3.4. Impact of Topography

The demographic rates vary among the topographic settings (i.e., valley, ridge, and slope) (Tables S2–S4). Specifically, Mid PFT has significantly lower growth rate on ridges (0.18 cm yr−1) than on slopes (0.29 cm yr−1) (p < 0.0001), Late PFT has significantly lower growth rate on valleys (0.16 cm yr−1) than on ridges (0.25 cm yr−1) (p = 0.0053), and Palm PFT has significantly higher growth rates on valley plots (0.16 cm yr−1) than on slope plots (p = 0.0015). Mortality was generally lower on ridges than on slopes or valleys, and the difference was significant in 1989 (p = 0.0001), 2004 (p < 0.0001), and 2009 (p = 0.0022). Recruitment was the highest in valleys in the first five years after the hurricane (1994; p < 0.0001). These variations are linked with the shifts of species distribution among the topographic settings after the hurricane disturbance (Figure 5).
The Early successional species CECSCH increased its proportional abundance in valleys and slopes, but never dominated on ridges (Figure 5a). The proportion of CECSCH in ridge plots is significantly lower than that in valley or slope plots (p < 0.0001). The tree fern CYAPOR (Figure 5d) increased the proportion of its abundance in valleys and slopes after the hurricane. The proportion of CAYPOR in valley/slope plots is significantly higher than in ridge plots (p < 0.0001). This is in contrast to the Late successional species DACEXC, which had significantly lower proportion in plots in valleys and slopes than in plots on ridges (p < 0.0001). This dominant topographical distribution of the Late species DACEXC remained unchanged during the 25-year post-hurricane study (Figure 5e). The palm PREMON was more abundant in valley plots (Figure 5g) before the hurricane and increased its proportional abundance in valley plots as time after the hurricane increased. The proportion of PREMON in valley plots is significantly higher than slope plots (p = 0.0011) and ridge plots (p = 0.0091). Further, palms recruited and maintained a significant abundance in all the topographical settings and an increase in proportion of palms relative to all stems was recorded in every census up to 25 years after the hurricane (Figure 5g).

4. Discussion

4.1. Patterns of Forest Structure following a Hurricane Disturbance

Changes in recruitment, growth, and mortality through time explain Hurricane Hugo’s long-term effects on the forest structure and composition. Variation in the immediate mortality among PFTs and among stem sizes resulted in an immediate change of forest size structure and species composition. The variation in diameter growth and recruitment with time resulted in a shift in size structure as the forest recovered. Before Hurricane Hugo, the forest at Bisley was dominated by Late PFT with diameters less than 10 cm (Figure 6). Because Early had the highest mortality and Palm had the lowest mortality among the four PFTs during the hurricane disturbance, Early PFT decreased in abundance right after the hurricane, while Palm increased its proportion in the forest. As smaller stems had higher immediate mortality, the size structure of the forest shifted from being dominated by small stems (2.5–5 cm) to a uniformly distributed size structure immediately post hurricane (Figure 6). In an experimental manipulative study of hurricane effects, Shiels et al. [3] found that forest responses to hurricane effects were driven by changes in the canopy structure and openness of the canopy, more than from fallen hurricane debris. In our study, when the canopy opened due to the disturbance, both Early and Palm had higher recruitment than mortality, which resulted in increases in their abundance five years after the disturbance. Twenty years after the hurricane disturbance, the forest was again dominated by Late PFT with diameters less than 10 cm, which may be the beginning of the self-thinning stage until it is interrupted by the next disturbance [56,57]. These changes in PFT abundances have been documented in other tropical forests in response to changes in climate [58]. In our study system, the response to changes in the post-disturbance abiotic environment, inherently altered forest composition which in turn lead to concomitant changes in forest structure. Despite these shifts, the proportion of larger stems from the Late PFT did not change significantly throughout the 25-year study period. The maintenance of “non-pioneer” or Late PFT is associated to their documented post-hurricane resistance responses including resprouting or direct regeneration [57,59,60].

4.2. Composition Dynamics of Dominant Species and Plant Functional Types

Changes in subsequent mortality and recruitment among the PFTs resulted in further shifts of species composition in the forest. As the canopy closed with progression of successional trajectories after the hurricane disturbance, the mortality rate of all PFTs increased. This brought compositional change, as mortality rates of Early and Mid PFTs exceeded their recruitment rates. Meanwhile the consistently lower mortality and higher recruitment of Palm resulted in making it the most dominant species during the post-hurricane successional trajectory, as palms increased in all topographic settings (ridge, slope, valley) in the forest, and tolerated shade under a closing canopy which contributed to their low subsequent/background mortality. The resistant and resilient characteristics of palms favored their dominance in the successional post-hurricane forest, and this is reflected in their distribution in the steep, sloped and rugged montane terrain [4,54,61]. Twenty years after the disturbance (in 2009), mortality rates of Late and Palm began to exceed their recruitment rates, which decreased their relative total abundance in the forest.
Although there was an increase in Palm during post-hurricane succession, it occurred within the established hierarchical dominance of the same species that consistently remained the most abundant in the forest during the 25-year period of documented succession. The Late PFT species–D. excelsa and S. berteriana–are characteristic species that define the vegetation association of this forest type [24], and they maintained proportional dominance along with the increase in palm abundance. Burslem et al. [17] also found that over a 30-year period, there was a constancy of the most abundant species after a hurricane disturbance. The observed heterogeneity of species composition and shift in abundances of the dominant species at the study site may respond to changes in the forest environment during succession. Changes in forest climate and abiotic environment, similar to those observed in post-hurricane canopy and associated understory light conditions, have been identified as drivers of change in PFT successional patterns [62]. Local topographical variation in tropical forests has been known to mediate structure and composition [63,64], and also play a role in the effects from disturbances such as hurricanes and climatic conditions [14,38,65,66].

4.3. Concluding Remarks

In this study, we linked the changes in structure and composition of the forest with the changes in demographic components (i.e., recruitment, growth, and mortality). We showed that the structural and compositional change in the first 5–10 years after the disturbance were due to the high recruitment of Early successional species, which leads to compositional change where Early PFT dominates, and to structural change where small stems dominate the forest. During succession, mortality increases with time due to canopy closing, which is mostly from new recruits, leading to the forest thinning and structural change to a median-size dominated forest. The growth rate decreases with time, making the basal area and aboveground biomass accumulation slow. Even though the biomass and basal area are reaching steady state, the structure and composition are still changing with different recruitment and mortality rates among different PFTs. Throughout the 25 years of this study, Early PFT consistently maintained the highest mortality and Palm had the lowest. The low hurricane-induced mortality, high recruitment rate, and low subsequent mortality of palms explain their increased abundance in the forest after the hurricane disturbance and during the following decades. Palms have demonstrated resistance and resilience to hurricane disturbance [4,61,67], and are likely to maintain their high abundance in the forest with frequent hurricane disturbances in the future, unless density dependent mortality sets in as with the effect of pathogens [68].
A warming climate will probably lead to increased intensity and frequency of hurricanes that make landfall [21,22]. In fact, before the forest could fully recover after Hurricane Hugo, the successional trajectory of the forest was reset by two subsequent hurricanes, Irma and María, in 2017. The way forests respond to future disturbances will be affected by the size structure and species composition [20], which are continually changing in response to past disturbances [6,38,69]. Tropical forests worldwide continue to be important carbon sinks and contribute to climate change mitigation [70]. Therefore, enhancing knowledge about tropical forest structural and compositional responses to hurricane disturbances under a changing climate is fundamental to understanding their future outcomes and their complex role in the global carbon balance [71,72,73,74,75].

Supplementary Materials

The following are available online at https://0-www-mdpi-com.brum.beds.ac.uk/article/10.3390/f13050796/s1, Supplementary Information S1: Diameter-Filling Algorithm for Missing Data; Supplementary Information S2: Diameter Measurement Error; Figure S1: Boxplot of diameter (DBH) of recruited stems (a) and diameter growth rates (cm 5 years−1) of standing stems (b) for the four plant functional types (PFT; Early, Mid, Late, and Palm) using the Bisley Experimental Watersheds data set with unadjusted data negative growth rates. The boxplots show outliers (three standard deviations from the mean), and 0th, 25th, 50th, 75th, 100th quantiles of the data without outliers; Figure S2: Flow chart decision diagram of the algorithm for filling missing diameter (DBH) of individual stems. Reference stems are from a template set, where DBH data of individual stems has no missing values in all census years (1989 to 2014). d i represents DBH at i t h census year, and x represents missing-DBH census year(s), and m and n represent two none-missing-DBH census years that are closest to year x ; Figure S3: Time series of Basal Area (m2 ha−1), Stem Density (# ha−1), and Growth Rate (cm yr−1) per each Plant Functional Type (PFT). Adjusted/filled data set in circle symbols with hatched lines and the unadjusted/with missing values data set in square symbols and solid line. The X-axis shows the census years. For growth rates, the year in the x-axis indicates the first census used to calculate five-year-interval growth rate (converted to cm yr−1 by dividing 5). For example, 1989 means the growth rate (cm yr−1) between 1989 and 1994, averaged for all trees in the same PFT.; Figure S4: Measurement error (cm) of diameter. (a) Histogram of errors and the mean value of the measurement error. (b) Scatter plot of errors and the corresponding diameter (DBH) values. The Spearman’s correlation coefficient (r) between the measurement error and DBH and the corresponding p-value (p) are shown for routine error (<2 cm) and processing error (≥2 cm); Figure S5: The scatter plots of distribution of measurement error and diameter (DBH) for 29 out of 65 species. Species shown are only those that had more than three samples of measurement error. The Spearman’s correlation coefficient (r) between measurement error and DBH and the corresponding p-value (p) are calculated for each species. The species that has a significant correlation SLOBER (p < 0.05) is boxed in red; Figure S6: Relative diameter growth rate (ad) and basal area (eh), in five censuses for each diameter (DBH) size of (a) Early, (b) Mid, (c) Late, and (d) Palm PFTs. The markers and the bars indicate the mean and standard error, respectively; only values with more than 10 samples are shown. Lines in between square symbols are used for ease of visual connection of sample points and do not represent data; Table S1: Code, Genus and species, Family, and Plant Function Type (PFT) of each species, listed in the order of descending abundance in the forest for each PFT. The scientific name of species follows the Integrated Taxonomic Information System (https://www.itis.gov/ accessed on 17 April 2022); Table S2: Growth rates (mean and standard error; cm yr−1) of each PFT in each topographic settings: valley, slope, and ridge. If the difference between two settings for a PFT is significant at 99% confidence level (p < 0.01), then the growth rate is marked with a letter: “v” means significantly different from valley plots, “s” means significantly different from slope plots, and “r” means significantly different from the ridge; Table S3: Same as Table S2, but for the mortality rate (%); Table S4: Same as Table S2, but for the recruitment rate (%). References [76,77,78,79,80,81,82,83,84,85,86,87,88,89] are cited in the supplementary materials.

Author Contributions

Conceptualization, J.Z. and R.L.B.; Data curation, T.H.-S.; Formal analysis, J.Z.; Funding acquisition, R.L.B.; Investigation, J.Z. and T.H.-S.; Methodology, J.Z. and R.L.B.; Project administration, R.L.B.; Resources, T.H.-S.; Software, J.Z.; Supervision, R.L.B.; Validation, J.Z., T.H.-S. and R.L.B.; Visualization, J.Z.; Writing–original draft, J.Z.; Writing–review & editing, J.Z., T.H.-S. and R.L.B. All authors have read and agreed to the published version of the manuscript.

Funding

This work is part of the doctoral thesis of Jiaying Zhang (2021, Georgia Tech). This work was supported by the National Science Foundation (project EAR1331841) and K. Harrison Brown Family Chair. The USDA Forest Service International Institute of Tropical Forestry works in collaboration with the University of Puerto Rico. Field data spanning 25 years were collected by Carlos R. Estrada-Pinto, Carlos Rivera, Ivette Pérez, Carlos Domínguez-Cristóbal, Gisel Reyes, Fred N. Scatena, L.E. Migenis, Juan Ramírez, Iván Vicens, Nelson Repollet, Samuel Moya, Reneé J. Beymer, Angel Colón, Carlos Torrens, Vivian Vera, Humberto Robles, and T. Heartsill Scalley. We thank Ariel E. Lugo from USDA Forest Service International Institute of tropical Forestry, Humfredo Marcano-Vega from USDA Forest Service SRS Forest Inventory and Analysis, Paul Moorcroft from Harvard University, and Ignacio Rodriguez-Iturbe from Texas A&M University for reviewing our manuscript and providing valuable comments prior to submission to the journal. We thank anonymous reviewers for providing thorough and constructive comments.

Institutional Review Board Statement

Not applicable.

Informed Consent Statement

Not applicable.

Data Availability Statement

All datasets used in this study are publicly available online. The unadjusted (with field missing values) and the adjusted (with algorithm-filled values) files of the dataset used in this work are accessible in the USDA Research Data Archive https://0-doi-org.brum.beds.ac.uk/10.2737/RDS-2022-0025 (accessed on 17 April 2022). All data and code used are also accessible at http://hydrology.gatech.edu/ (accessed on 17 April 2022).

Acknowledgments

This research was supported in part by the U.S. Department of Agriculture, Forest Service. The findings and conclusions in this publication are those of the authors and should not be construed to represent any official USDA or U.S. government policy.

Conflicts of Interest

The authors declare no conflict of interest.

References

  1. Lugo, A.E. Visible and invisible effects of hurricanes on forest ecosystems: An international review. Austral Ecol. 2008, 33, 368–398. [Google Scholar] [CrossRef]
  2. Flynn, D.F.; Uriarte, M.; Crk, T.; Pascarella, J.B.; Zimmerman, J.K.; Aide, T.M.; Ortiz, M.A.C. Hurricane disturbance alters secondary forest recovery in Puerto Rico. Biotropica 2010, 42, 149–157. [Google Scholar] [CrossRef]
  3. Shiels, A.B.; Gonzalez, G.; Lodge, D.L.; Willing, M.R.; Zimmerman, J.K. Cascading effects of canopy opening and debris deposition from a large-scale hurricane experiment in a tropical rain forest. BioScience 2015, 65, 871–881. [Google Scholar] [CrossRef] [Green Version]
  4. Uriarte, M.; Thompson, J.; Zimmerman, J.K. Hurricane Maria tripled stem breaks and doubled tree mortality relative to other major storms. Nat. Commun. 2019, 10, 1362. [Google Scholar] [CrossRef] [Green Version]
  5. Hogan, J.A.; A Feagin, R.; Starr, G.; Ross, M.; Lin, T.-C.; O’Connell, C.; Huff, T.P.; A Stauffer, B.; Robinson, K.L.; Lara, M.C.; et al. A research framework to integrate cross-ecosystem responses to tropical cyclones. BioScience 2020, 70, 477–489. [Google Scholar] [CrossRef]
  6. Lin, T.C.; Hogan, J.A.; Chang, C.T. Tropical cyclone ecology: A scale-link perspective. Trends Ecol. Evol. 2020, 35, 594–604. [Google Scholar] [CrossRef] [PubMed] [Green Version]
  7. Hall, J.; Muscarella, R.; Quebbeman, A.; Arellano, G.; Thompson, J.; Zimmerman, J.K.; Uriarte, M. Hurricane-induced rainfall is a stronger predictor of tropical forest damage in Puerto Rico than maximum wind speeds. Sci. Rep. 2020, 10, 4318. [Google Scholar] [CrossRef]
  8. Everham, M.E., III; Brokaw, N.V.L. Forest damage and recovery from catastrophic wind. Bot. Rev. 1996, 62, 113–185. [Google Scholar] [CrossRef]
  9. Frangi, J.L.; Lugo, A.E. Hurricane damage to a flood plain forest in the Luquillo Mountains of Puerto Rico. Biotropica 1991, 23, 324–335. [Google Scholar] [CrossRef]
  10. Walker, L.R. Tree damage and recovery from hurricane Hugo in Luquillo Experimental Forest, Puerto Rico. Part A. special issue: Ecosystem, plant, and animal responses to hurricanes in the Caribbean. Biotropica 1991, 23, 379–385. [Google Scholar] [CrossRef]
  11. Pascarella, J.B.; Aide, T.M.; Zimmerman, J.K. Short-term response of secondary forests to hurricane disturbance in Puerto Rico, USA. For. Ecol. Manag. 2004, 199, 379–393. [Google Scholar] [CrossRef]
  12. Bellingham, P.J.; Tanner, E.V.J. The influence of topography on tree growth, mortality, and recruitment in a tropical montane forest. Biotropica 2000, 32, 378–384. [Google Scholar] [CrossRef]
  13. Feeley, K.J.; Davies, S.J.; Perez, R.; Hubbell, S.P.; Foster, R.B. Directional changes in the species composition of a tropical forest. Ecology 2011, 92, 871–882. [Google Scholar] [CrossRef] [PubMed] [Green Version]
  14. Heartsill Scalley, T.; Scatena, F.N.; Lugo, A.E.; Moya, S.; Estrada, C.R. Changes in structure, composition, and nutrients during 15 years of hurricane-induced succession in a subtropical wet forest in Puerto Rico. Biotropica 2010, 42, 455–463. [Google Scholar] [CrossRef]
  15. Tanner, E.V.J.; Rodriguez-Sanchez, F.; Healey, J.R.; Holdaway, R.J.; Bellingham, P.J. Long-term hurricane damage effects on tropical forest tree growth and mortality. Ecology 2014, 95, 2974–2983. [Google Scholar] [CrossRef] [Green Version]
  16. Weaver, P.L. Forest changes after hurricanes in Puerto Rico Luquillo Mountains. Interciencia 1989, 14, 181–192. [Google Scholar]
  17. Burslem, D.F.; Whitmore, T.C.; Brown, G.C. Short-term effects of cyclone impact and long-term recovery of tropical rain forest on Kolombangara, Solomon Islands. J. Ecol. 2000, 88, 1063–1078. [Google Scholar] [CrossRef]
  18. Vandermeer, J.; de la Cerda, I.G. Height dynamics of the thinning canopy of a tropical rain forest: 14 years of succession in a post-hurricane forest in Nicaragua. For. Ecol. Manag. 2004, 199, 125–135. [Google Scholar] [CrossRef]
  19. Bonan, G. “[Plant Strategies]” in Ecological Climatology: Concepts and Applications, 3rd ed.; Cambridge University Press: New York, NY, USA, 2016; pp. 291–314. [Google Scholar]
  20. Zhang, J.; Heartsill-Scalley, T.; Bras, R.L. Forest Structure and Composition Are Critical to Hurricane Mortality. Forests 2022, 13, 202. [Google Scholar] [CrossRef]
  21. Bender, M.A.; Knutson, T.R.; Tuleya, R.E.; Sirutis, J.J.; Vecchi, G.A.; Garner, S.T.; Held, I.M. Modeled impact of anthropogenic warming on the frequency of intense Atlantic hurricanes. Science 2010, 327, 454–458. [Google Scholar] [CrossRef] [Green Version]
  22. Wang, S.; Toumi, R. More tropical cyclones are striking coasts with major intensities at landfall. Sci. Rep. 2022, 12, 1–7. [Google Scholar] [CrossRef] [PubMed]
  23. Rozendaal, D.M.A.; Chazdon, R.L. Demographic drivers of tree biomass change during secondary succession in northeastern Costa Rica. Ecol. Appl. 2015, 25, 506–516. [Google Scholar] [CrossRef] [PubMed]
  24. Beard, J.S. The Natural Vegetation of the Windward and Leeward Islands; Oxford Forestry Memoirs; 21 Clarendon Press: Oxford, UK, 1949; p. 192. [Google Scholar]
  25. Gregory, F.A.; Sabat, A.M. The effect of hurricane disturbance on the fecundity of Sierra palms (Pretoea montana). Bios 1996, 67, 135–139. [Google Scholar]
  26. Ma, R.-Y.; Zhang, J.-L.; Cavaleri, M.A.; Sterck, F.; Strijk, J.S.; Cao, K.-F. Convergent evolution towards high net carbon gain efficiency contributes to the shade tolerance of palms (Arecaceae). PLoS ONE 2015, 10, e0140384. [Google Scholar] [CrossRef] [Green Version]
  27. Muscarella, R.; Emilio, T.; Phillips, O.L.; Lewis, S.L.; Slik, F.; Baker, W.J.; Couvreur, T.L.P.; Eiserhardt, W.L.; Svenning, J.C.; Affum-Baffoe, K.; et al. The global abundance of tree palms. Glob. Ecol. Biogeogr. 2020, 29, 1495–1514. [Google Scholar] [CrossRef]
  28. McDowell, W.H.; Leon, M.C.; Shattuck, M.D.; Potter, J.D.; Heartsill-Scalley, T.; González, G.; Shanley, J.B.; Wymore, A.S. Luquillo Experimental Forest: Catchment science in the montane tropics. Hydrol. Process. 2021, 35, e14146. [Google Scholar] [CrossRef]
  29. Scatena, F.N.; Silver, W.; Siccama, T.; Johnson, A.; Sanchez, M.J. Biomass and nutrient content of the Bisley Experimental Watersheds, Luquillo Experimental Forest, Puerto Rico, before and after hurricane Hugo, 1989. Biotropica 1993, 25, 15–27. [Google Scholar] [CrossRef]
  30. Heartsill Scalley, T.; Scatena, F.N.; Estrada, C.; McDowell, W.H.; Lugo, A.E. Disturbance and long-term patterns of rainfall and throughfall nutrient fluxes in a subtropical forest in Puerto Rico. J. Hydrol. 2007, 33, 472–485. [Google Scholar] [CrossRef]
  31. DeWalt, S.J.; Ickes, K.; James, A. Forest and community structure of tropical sub-montane rain forests on the island of Dominica, Lesser Antilles. Caribb. Nat. 2016, 1, 116–137. [Google Scholar]
  32. Scatena, F.N.; Lugo, A.E. Geomorphology, disturbance, and the soil and vegetation of two subtropical wet steepland watersheds of Puerto Rico. Geomorphology 1995, 13, 199–213. [Google Scholar] [CrossRef]
  33. Scatena, F.N. An introduction to the physiography and history of the Bisley Experimental Watersheds in the Luquillo Mountains of Puerto Rico. In General Technical Report SO-72; U.S. Department of Agriculture, Forest Service, Southern Forest Experiment Station: New Orleans, LA, USA, 1989; 22p. [Google Scholar] [CrossRef]
  34. García-Montiel, D.C.; Scatena, F.N. The effect of human activity on the structure and composition of a tropical forest in Puerto Rico. For. Ecol. Manag. 1994, 63, 57–78. [Google Scholar] [CrossRef]
  35. Royo, A.A.; Heartsill-Scalley, T.; Moya, S.; Scatena, F.N. Non-arborescent vegetation trajectories following repeated hurricane disturbance: Ephemeral versus enduring responses. Ecosphere 2011, 2, 77. [Google Scholar] [CrossRef] [Green Version]
  36. Lugo, A.E.; Helmer, E. Emerging forests on abandoned land: Puerto Rico’s new forests. For. Ecol. Manag. 2004, 190, 145–161. [Google Scholar] [CrossRef] [Green Version]
  37. Heartsill Scalley, T.; Scatena, F.N.; Moya, S.; Lugo, A.E. Long-term dynamics of organic matter and elements exported as coarse particulates from two Caribbean montane watersheds. J. Trop. Ecol. 2012, 28, 127–139. [Google Scholar] [CrossRef]
  38. Ostertag, R.; Silver, W.L.; Lugo, A.E. Factors affecting mortality and resistance to damage following hurricanes in a rehabilitated subtropical moist forest. Biotropica 2005, 37, 16–24. [Google Scholar] [CrossRef]
  39. Scatena, F.N.; Moya, S.; Estrada, C.; Chinea, J.D. The first five years in the reorganization of aboveground biomass and nutrient use following hurricane Hugo in the Bisley Experimental Watersheds, Luquillo Experimental Forest, Puerto Rico. Biotropica 1996, 28, 424–440. [Google Scholar] [CrossRef]
  40. Scalley, T.H. Insights on forest structure and composition from long-term research in the Luquillo mountains. Forests 2017, 8, 204. [Google Scholar] [CrossRef] [Green Version]
  41. Schowalter, T.D.; Ganio, L.M. Invertebrate communities in a tropical rain forest canopy in Puerto Rico following hurricane Hugo. Ecol. Entomol. 1999, 24, 191–201. [Google Scholar] [CrossRef]
  42. Uriarte, M.; Canham, C.D.; Thompson, J.; Zimmerman, J.K.; Brokaw, N. Seedling recruitment in a hurricane-driven tropical forest: Light limitation, density-dependence and the spatial distribution of parent trees. J. Ecol. 2005, 93, 291–304. [Google Scholar] [CrossRef]
  43. Muscarella, R.; Uriarte, M.; Forero-Montaña, J.; Comita, L.; Swenson, N.G.; Thompson, J.; Nytch, C.J.; Jonckheere, I.; Zimmerman, J.K. Life-history trade-offs during the seed-to-seedling transition in a subtropical wet forest community. J. Ecol. 2013, 101, 171–182. [Google Scholar] [CrossRef]
  44. Feng, X.; Uriarte, M.; González, G.; Reed, S.; Thompson, J.; Zimmerman, J.K.; Murphy, L. Improving predictions of tropical forest response to climate change through integration of field studies and ecosystem modeling. Glob. Chang. Biol. 2018, 24, e213–e232. [Google Scholar] [CrossRef] [PubMed]
  45. Köhler, P.; Ditzer, T.; Huth, A. Concepts for the aggregation of tropical tree species into functional types and the application to Sabah’s lowland rain forests. J. Trop. Ecol. 2000, 16, 591–602. [Google Scholar] [CrossRef]
  46. Duckworth, J.C.; Kent, M.; Ramsay, P.M. Plant functional types: An alternative to taxonomic plant community description in biogeography? Prog. Phys. Geogr. 2000, 24, 515–542. [Google Scholar] [CrossRef]
  47. Semenova, G.V.; van der Maarel, E. Plant functional types–a strategic perspective. J. Veg. Sci. 2000, 11, 917–922. [Google Scholar] [CrossRef]
  48. Verheijen, L.M.; Aerts, R.; Bönisch, G.; Kattge, J.; Van Bodegom, P.M. Variation in trait trade-offs allows differentiation among predefined plant functional types: Implications for predictive ecology. New Phytol. 2016, 209, 563–575. [Google Scholar] [CrossRef] [PubMed]
  49. Wigley, B.J.; Charles-Dominique, T.; Hempson, G.P.; Stevens, N.; te Beest, M.; Archibald, S.; Bond, W.J.; Bunney, K.; Coetsee, C.; Donaldson, J.; et al. A handbook for the standardised sampling of plant functional traits in disturbance-prone ecosystems, with a focus on open ecosystems. Aust. J. Bot. 2020, 68, 473–531. [Google Scholar] [CrossRef]
  50. Devoe, N.N. Differential Seeding and Regeneration in Openings and Beneath Closed Canopy in Sub-Tropical Wet Forest. Ph.D. Dissertation, Yale University, New Haven, CT, USA, 1989; 307p. [Google Scholar]
  51. Lugo, A.E.; Zimmerman, J.K. Ecological life histories. In Tropical Tree Seed Manual. Agriculture Handbook; Vozzo, J.A., Ed.; USDA Forest Service: Washington, DC, USA, 2002; pp. 191–213. [Google Scholar]
  52. Kunstler, G.; Falster, D.; Coomes, D.A.; Hui, F.; Kooyman, R.M.; Laughlin, D.C.; Poorter, L.; Vanderwel, M.; Vieilledent, G.; Wright, S.J.; et al. Plant functional traits have globally consistent effects on competition. Nature 2016, 529, 204–207. [Google Scholar] [CrossRef] [Green Version]
  53. Lugo, A.E.; Batlle, C.T.R. Leaf production, growth rate, and age of the palm Prestoea montana in the Luquillo Experimental Forest, Puerto Rico. J. Trop. Ecol. 1987, 3, 151–161. [Google Scholar] [CrossRef]
  54. Lugo, A.E.; Francis, J.K.; Frangi, J.L. Prestoea montana (R. Graham) Nichols. Sierra palm. Palmaceae Palm Family; Technical Report SO-ITF-SM-82; US Department of Agriculture, Forest Service, International Institute of Tropical Forestry: Rio Piedras, Puerto Rico, USA, 1998.
  55. Montgomery, D.C.; Runger, G.C. Large-sample tests on the difference in population proportions. In Applied Statistics and Probability for Engineers, 7th ed.; Wiley: New York, NY, USA, 2018; pp. 274–275. ISBN 978-1-119-40036-3. [Google Scholar]
  56. Crow, T.R. A rainforest chronicle: A 30-year record of change in structure and composition at El Verde, Puerto Rico. Biotropica 1980, 12, 42–55. [Google Scholar] [CrossRef]
  57. Zimmerman, J.K.; Everham, E.M., III; Waide, R.B.; Lodge, D.J.; Taylor, C.M.; Brokaw, N.V.L. Responses of tree species to hurricane winds in subtropical wet forest in Puerto Rico: Implications for tropical tree life histories. J. Ecol. 1994, 82, 911–922. [Google Scholar] [CrossRef]
  58. Condit, R.; Hubbell, S.P.; Lafrankie, J.V.; Sukumar, R.; Manokaran, N.; Foster, R.B.; Ashton, P.S. Species-area and species-individual relationships for tropical trees: A comparison of three 50-ha plots. J. Ecol. 1996, 84, 549–562. [Google Scholar] [CrossRef] [Green Version]
  59. Basnet, K.; Scatena, F.N.; Likens, G.E.; Lugo, A.E. Ecological consequences of root grafting in tabonuco (Dacryodes excelsa) trees in the Luquillo Experimental Forest, Puerto Rico. Biotropica 1993, 25, 28–35. [Google Scholar] [CrossRef]
  60. Yih, K.; Boucher, D.H.; Vandermeer, J.H.; Zamora, N. Recovery of the rain forest of southeastern Nicaragua after destruction by hurricane Joan. Biotropica 1991, 23, 106–113. [Google Scholar] [CrossRef]
  61. Lugo, A.E.; Frangi, J.L. Long-term response of Caribbean palm forests to hurricanes. Caribb. Nat. 2016, 1, 157–175. [Google Scholar]
  62. Lohbeck, M.; Poorter, L.; Martínez-Ramos, M.; Rodriguez-Velázquez, J.; van Breugel, M.; Bongers, F. Changing drivers of species dominance during tropical forest succession. Funct. Ecol. 2014, 28, 1052–1058. [Google Scholar] [CrossRef]
  63. Jucker, T.; Caspersen, J.; Chave, J.; Antin, C.; Barbier, N.; Bongers, F.; Dalponte, M.; van Ewijk, K.Y.; Forrester, D.I.; Haeni, M.; et al. Allometric equations for integrating remote sensing imagery into forest monitoring programmes. Glob. Chang. Biol. 2017, 23, 177–190. [Google Scholar] [CrossRef] [Green Version]
  64. Fortunel, C.; Lasky, J.R.; Uriarte, M.; Valencia, R.; Wright, S.J.; Garwood, N.C.; Kraft, N.J.B. Topography and neighborhood crowding can interact to shape species growth and distribution in a diverse Amazonian forest. Ecology 2018, 99, 2272–2283. [Google Scholar] [CrossRef]
  65. Muscarella, R.; Kolyaie, S.; Morton, D.C.; Zimmerman, J.K.; Uriarte, M. Effects of topography on tropical forest structure depend on climate context. J. Ecol. 2020, 108, 145–159. [Google Scholar] [CrossRef]
  66. Zambrano, J.; Arellano, G.; Swenson, N.G.; Staniczenko, P.P.; Thompson, J.; Fagan, W.F. Analyses of three-dimensional species associations reveal departures from neutrality in a tropical forest. Ecology 2022, e3681. [Google Scholar] [CrossRef]
  67. Lugo, A.E.; Scatena, F.N. Background and catastrophic tree mortality in tropical moist, wet, and rain forests. Biotropica 1996, 28, 585–599. [Google Scholar] [CrossRef]
  68. Baroni, T.J.; State University of New York College at Cortland, Cortland, New York, NY, USA; Larsson, K.-H.; University of Oslo, Natural History Museum, Oslo, Norway; Lodge, D.J.; USDA Forest Service, Luquillo, Puerto Rico, FL, USA. Personal communication, 2022.
  69. Xi, W. Synergistic effects of tropical cyclones on forest ecosystems: A global synthesis. J. For. Res. 2015, 26, 1–21. [Google Scholar] [CrossRef]
  70. Harris, N.L.; Gibbs, D.A.; Baccini, A.; Birdsey, R.A.; de Bruin, S.; Farina, M.; Fatoyinbo, L.; Hansen, M.C.; Herold, M.; Houghton, R.A.; et al. Global maps of twenty-first century forest carbon fluxes. Nat. Clim. Chang. 2021, 11, 234–240. [Google Scholar] [CrossRef]
  71. Chave, J.; Andalo, C.; Brown, S.; Cairns, M.A.; Chambers, J.Q.; Eamus, D.; Fölster, H.; Fromard, F.; Higuchi, N.; Kira, T.; et al. Tree allometry and improved estimation of carbon stocks and balance in tropical forests. Oecologia 2005, 145, 87–99. [Google Scholar] [CrossRef] [PubMed]
  72. Keller, M.; Palace, M.; Hurtt, G. Biomass estimation in the Tapajos National Forest, Brazil: Examination of sampling and allometric uncertainties. For. Ecol. Manag. 2001, 154, 371–382. [Google Scholar] [CrossRef]
  73. Baccini, A.; Walker, W.; Carvalho, L.; Farina, M.; Sulla-Menashe, D.; Houghton, R.A. Tropical forests are a net carbon source based on aboveground measurements of gain and loss. Science 2017, 358, 230–234. [Google Scholar] [CrossRef] [PubMed] [Green Version]
  74. Claeys, F.; Gourlet-Fleury, S.; Picard, N.; Ouédraogo, D.-Y.; Tadesse, M.G.; Hérault, B.; Baya, F.; Bénédet, F.; Cornu, G.; Mortier, F. Climate change would lead to a sharp acceleration of Central African forests dynamics by the end of the century. Environ. Res. Lett. 2019, 14, 044002. [Google Scholar] [CrossRef]
  75. McDowell, N.G.; Allen, C.D.; Anderson-Teixeira, K.; Aukema, B.H.; Bond-Lamberty, B.; Chini, L.; Clark, J.S.; Dietze, M.; Grossiord, C.; Hanbury-Brown, A.; et al. Pervasive shifts in forest dynamics in a changing world. Science 2020, 29, eaaz9463. [Google Scholar] [CrossRef]
  76. Luke, D.; McLaren, K.; Wilson, B. Modeling hurricane exposure in a Caribbean lower montane tropical wet forest: The effects of frequent, intermediate disturbances and topography on forest structural dynamics and composition. Ecosystems 2016, 19, 1178–1195. [Google Scholar] [CrossRef]
  77. Yap, S.L.; Davies, S.J.; Condit, R. Dynamic response of a Philippine dipterocarp forest to typhoon disturbance. J. Veg. Sci. 2016, 27, 133–143. [Google Scholar] [CrossRef]
  78. McLaren, K.; Luke, D.; Tanner, E.; Bellingham, P.J.; Healey, J.R. Reconstructing the effects of hurricanes over 155 years on the structure and diversity of trees in two tropical montane rainforests in Jamaica. Agric. For. Meteorol. 2019, 276, 107621. [Google Scholar] [CrossRef]
  79. Michener, W.K.; Jones, M.B. Ecoinformatics: supporting ecology as a data-intensive science. Trends Ecol. Evol. 2012, 27, 85–93. [Google Scholar] [CrossRef] [PubMed] [Green Version]
  80. Michener, W.K.; Porter, J.; Servilla, M.; Vanderbilt, K. Long term ecological research and information management. Ecol. Inform. 2011, 6, 13–24. [Google Scholar] [CrossRef]
  81. Condit, R.; Ashton, P.; Bunyavejchewin, S.; Dattaraja, H.S.; Davies, S.; Esufali, S.; Ewango, C.; Foster, R.; Gunatilleke, I.A.U.N.; Gunatilleke, C.V.S.; et al. The importance of demographic niches to tree diversity. Science 2006, 313, 98–101. [Google Scholar] [CrossRef] [Green Version]
  82. Clark, J.S.; Wolosin, M.; Dietze, M.; Ibanez, I.; LaDeau, S.; Welsh, M.; Kloeppel, B. Tree growth inference and prediction from diameter censuses and ring widths. Ecol. Appl. 2007, 17, 1942–1953. [Google Scholar] [CrossRef] [PubMed]
  83. Zhang, J.; Scalley, T.H.; Bras, R.L. Tree censuses at Bisley Experimental Watersheds before and after Hurricane Hugo. In Fort Collins, CO: Forest Service Research Data Archive; Forest Service: Washington, DC, USA, 2022. [Google Scholar] [CrossRef]
  84. Uriarte, M.; Canham, C.D.; Thompson, J.; Zimmerman, J.K. A neighborhood analysis of tree growth and survival in a hurricane-driven tropical forest. Ecol. Monogr. 2004, 74, 591–614. [Google Scholar] [CrossRef]
  85. Kozlowski, T.T.; Winget, C.H. Diurnal and seasonal variation in radii of tree stems. Ecology 1964, 45, 149–155. [Google Scholar] [CrossRef]
  86. Raffelsbauer, V.; Spannl, S.; Peña, K.; Pucha-Cofrep, D.; Steppe, K.; Bräuning, A. Tree circumference changes and species-specific growth recovery after extreme dry events in a montane rainforest in Southern Ecuador. Front. Plant Sci. 2019, 10, 342. [Google Scholar] [CrossRef]
  87. Hogan, J.A.; McMahon, S.M.; Buzzard, V.; Michaletz, S.T.; Enquist, B.J.; Thompson, J.; Swenson, N.G.; Zimmerman, J.K. Drought and the interannual variability of stem growth in an aseasonal, everwet forest. Biotropica 2009, 51, 139–154. [Google Scholar] [CrossRef] [Green Version]
  88. Condit, R.; Hubbell, S.P.; Foster, R.B. Mortality and growth of a commercial hardwood ‘el cativo’, Prioria copaifera, in Panama. For. Ecol. Manage. 1993, 62, 107–122. [Google Scholar] [CrossRef]
  89. Forest Service. USDA National Core Field Guide; Volume I: Field Data Collection Procedures for Phase 2 Plots; Forest Inventory and Analysis; Version 8.0; Forest Service: Washington, DC, USA, 2018. [Google Scholar]
Figure 1. The mortality of (a) different PFTs and (b) different diameter (DBH) classes in each census at Bisley Experimental Watersheds, Luquillo, Puerto Rico. The mortality in 1989 refers to the immediate hurricane-induced mortality, and that in other census years refers to the mortality from the previous census year to current census year.
Forests 13 00796 g001
Figure 2. Scatter plots of diameter (DBH) growth rates (GR, cm per year) and DBH values (cm) for the four PFTs in the five censuses at Bisley Experimental Watersheds, Luquillo, Puerto Rico. The linear regression of GR on DBH for each PFT and census is estimated, and the regression coefficient (b), the coefficient of determination (R2), and the p-value are shown in the panels. Linear regression models that are significant at 95% confidence interval (p < 0.05) are identified with a blue box for negative regression coefficient and a magenta for positive coefficient. Grey boxes do not have statistically significant coefficients.
Forests 13 00796 g002
Figure 3. Diameter growth rates (cm per year) in five censuses for each diameter (DBH) size of (a) Early, (b) Mid, (c) Late, and (d) Palm PFTs. The markers and the bars indicate the mean and standard error, respectively; only values with more than 10 samples are shown.
Forests 13 00796 g003
Figure 4. The probability density proportions for the seven most abundant species in each of the seven censuses at Bisley Experimental Watersheds, Luquillo, Puerto Rico. The seven censuses are (a) Pre-Hugo 1989, (b) post-Hugo 1989, (c) 1994, (d) 1999, (e) 2004, (f) 2009, and (g) 2014. The percentage of the abundance comprised by the top seven species in the forest per census is shown in parenthesis at the top of each panel. The x-axes are the seven species, with plant functional type (PFT) in parentheses, and the y-axes represent the proportion in 10 bins from 0.0001 to 1 and one bin for 0 proportion. The width of the yellow area represents the probability for each proportion bin; red and blue lines are the mean and median values of the proportion for all the 85 plots. A value of 0-median for a species indicates that the species is absent in more than half of the plots for that census.
Forests 13 00796 g004
Figure 5. Mean values of species proportion across plots grouped by different topographic settings: valleys, slopes, and ridges. The x-axes are the seven census years, and the y-axes are the proportion. The seven most abundant species are (a) CECSCH: Cecropia Schreberiana, (b) PSYBER: Psychotria berteriana, (c) OCOLEU: Ocotea leucoxylon, (d) CYAPOR: Cyathea portoricensis, (e) DACEXC: Dacryodes excelsa, (f) SLOBER: Sloanea berteriana, and (g) PREMON: Prestoea montana. For taxonomic plant families and PFTs classification, please see Table S1.
Forests 13 00796 g005
Figure 6. Bar chart of stem abundance (#) in each census at Bisley Experimental Watersheds, Luquillo, Puerto Rico. The stem abundance is calculated as the total number of stems in the 85 plots that were established in pre-Hugo 1989. For each census along the horizontal axis, the stem abundance is composed of four diameter (DBH) classes identified by the stacked bar pattern fills, and within those are the four plant functional types (PFTs) represented in colors.
Forests 13 00796 g006
Table 1. Recruitment rate (%) for each PFT during any two consecutive censuses of the 85 continually censused plots at Bisley Experimental Watersheds, Luquillo, Puerto Rico.
EarlyMidLatePalm
1989–19941665.0044.7416.4594.74
1994–1999104.82131.9044.0686.49
1999–200419.7218.6332.9636.84
2004–20094.667.519.9015.12
2009–201413.338.0410.459.73
Table 2. Averages and standard deviations (in parentheses) of stem density, basal area, and aboveground biomass for the 85 continually censused plots in the Bisley Experimental Watersheds.
Census YearStem Density (# ha−1)Basal Area (m2 ha−1)Aboveground Biomass (Mg ha−1)
Pre-Hugo 19891440 (702)38 (33)255 (271)
Post-Hugo 1989604 (398)22 (26)152 (211)
19941275 (569)32 (28)199 (226)
19992254 (928)36 (26)217 (205)
20042072 (756)38 (25)228 (210)
20091645 (648)39 (27)238 (224)
20141440 (642)39 (29)246 (240)
Publisher’s Note: MDPI stays neutral with regard to jurisdictional claims in published maps and institutional affiliations.

