Article

Towards the Third Millennium Changes in Siberian Triple Tree-Ring Stable Isotopes

by
Olga V. Churakova (Sidorova)
1,2,*,
Marina V. Fonti
1,2,
Valentin V. Barinov
1,
Mikhail S. Zharkov
1,
Anna V. Taynik
1,
Tatyana V. Trushkina
3,
Alexander V. Kirdyanov
1,4,
Alberto Arzac
1 and
Matthias Saurer
2
1
Siberian Federal University, 660041 Krasnoyarsk, Russia
2
Swiss Federal Institute for Forest, Snow and Landscape Research WSL, 8903 Birmensdorf, Switzerland
3
Reshetnev Siberian State University of Science and Technology, Krasnoyarsky Rabochy 31, 660037 Krasnoyarsk, Russia
4
V.N. Sukachev Institute of Forest, SB RAS, Akademgorodok 50, 660036 Krasnoyarsk, Russia
*
Author to whom correspondence should be addressed.
Submission received: 21 May 2022 / Revised: 10 June 2022 / Accepted: 11 June 2022 / Published: 15 June 2022
(This article belongs to the Special Issue Stable Isotopes in Dendroecology)

Abstract

:
Significant air temperature and precipitation changes have occurred since the 2000s in vulnerable Siberian subarctic regions and urged updates of available chronologies towards the third millennium. It is important to better understand recent climatic changes compared to the past decades, centuries and even millennia. In this study, we present the first annually resolved triple tree-ring isotope dataset (δ13C, δ18O and δ2H) for the eastern part of the Taimyr Peninsula (TAY) and northeastern Yakutia (YAK) from 1900 to 2021. We found that the novel and largely unexplored δ2H of larch tree-ring cellulose was linked significantly with δ18O for the YAK site, which was affected by averaged April–June air temperatures and evaporation. Simulated by the Land Surface Processes and Exchanges (LPX-Bern 1.0) model, the water fraction per year for soil depths at 0–20 and 20–30 cm was significantly linked with the new eco-hydrological tree-ring δ2H data. Our results suggest increasing evapotranspiration and response of trees’ water relation to rising thaw water uptake from lower (20–30 cm) soil depth. A positive effect of July air temperature on tree-ring δ18O and a negative impact of July precipitation were found, indicating dry conditions. The δ13C in larch tree-ring cellulose for both sites showed negative correlations with July precipitation and relative humidity, confirming dry environmental conditions towards the third millennium.

Graphical Abstract

1. Introduction

During the past two decades, large-scale data synthesis efforts by the international Past Global Changes PAGES2k network have produced robust estimations of regional to global air temperature patterns for the past 2000 years, projecting a 1.5–2° worldwide warming in the future and further northward expansion of forest ecosystems [1,2]. Progress on the synthesis of global hydroclimate proxies has also been achieved during the past few years [3,4,5]. However, many of the records do not cover the most recent years, which were particularly affected by climate change. Furthermore, the water cycle is spatially heterogeneous and creates a complex target compared to surface air and ocean temperature. At the same time, different climate archives track changes in different aspects of the water cycle in different ways. For example, the amount of annual or summer precipitation and soil water available for vegetation at any given location on the Earth’s surface is governed not just by atmospheric processes that deliver moisture to the region, but also by topography and permafrost availability [6]. It is, therefore, crucial to have detailed and updated information for various important regions of the globe, such as the Siberian permafrost area.
The increase in global air temperature results in the thaw of permafrost, i.e., ground which is frozen continuously below 0 °C for at least two consecutive years [7]. Permafrost covers a quarter of the Northern Hemisphere (NH) land surface and contains twice the amount of carbon currently present in the atmosphere [7]. Consequently, trees growing on permafrost soils in the Siberian subarctic are sensitive to climate change due to a low precipitation input of ca. 200–250 mm/year and a short vegetation season (45–60 days) [8,9,10]. Furthermore, as temperature increases, vapour pressure deficit (VPD) will likely rise in subarctic ecosystems, resulting in increased evapotranspiration, particularly affecting the water relations in trees [11]. Specifically, evapotranspiration plays an essential role in soil–plant–atmosphere interaction, being an important component in water and energy balances, representing up to 65% of global surface precipitation [12].
In subarctic regions, the rate of recent climate warming has been most rapid, and the generally reliable association between tree-ring width and summer climate has been demonstrated to break down, potentially linked to warming-induced drought stress [13,14,15,16]. This phenomenon is referred to as the “divergence problem” (DP) in dendrochronological literature [15]. The emergence of the DP has stimulated the search for additional tree-ring climate proxies in subarctic regions, including tree-ring stable isotopes [17,18,19,20,21,22,23,24,25].
Both stable carbon (δ13C) and oxygen (δ18O) isotopes have been proven as very useful proxies for deciphering temperature control on plant responses [26,27], while δ18O is a powerful indicator of rainfall events [28]. Recent studies showed that δ2H in tree-ring cellulose is more than a temperature proxy and can contain information about eco-hydrological changes and tree physiology [25,29,30,31,32,33,34].
Recent paleoclimatic reconstructions based on tree-ring stable isotopes of subarctic conifers were limited to the 2000s or at the latest 2010 and largely absent for δ2H [23,24,25,27,34,35,36,37,38]. However, significant air temperature and precipitation changes that occurred since the 2000s urged data updates towards the third millennium to better understand recent climatic changes compared to the past.
In this study, we aim to test our hypotheses that tree-ring stable isotopes from the Siberian subarctic respond mainly to moisture changes over the past decades of the third millennium, which are linked to the strong summer temperature signal under climate change. Climatic changes during the past decades (1990–2020) emphasise strong spring and summer atmospheric drying increase along with a reduction in summer precipitation and relative humidity in the Siberian subarctic. The possible shift from a temperature-limited to moisture-limited environment in the Siberian subarctic forests can be explained by increasing permafrost thaw depth and depletion of superficial water sources, causing decoupling mechanisms in the response of conifer trees to summer air temperature. To test these hypotheses, we developed annually resolved hydrogen (2H/1H) isotope chronologies in larch tree-ring cellulose from 1900 to 2021 and prolonged available stable carbon (12C/13C) and oxygen (18O/16O) isotope time series up to 2020 for the Taimyr (TAY) and 2021 for the Yakutia (YAK) study sites.

2. Materials and Methods

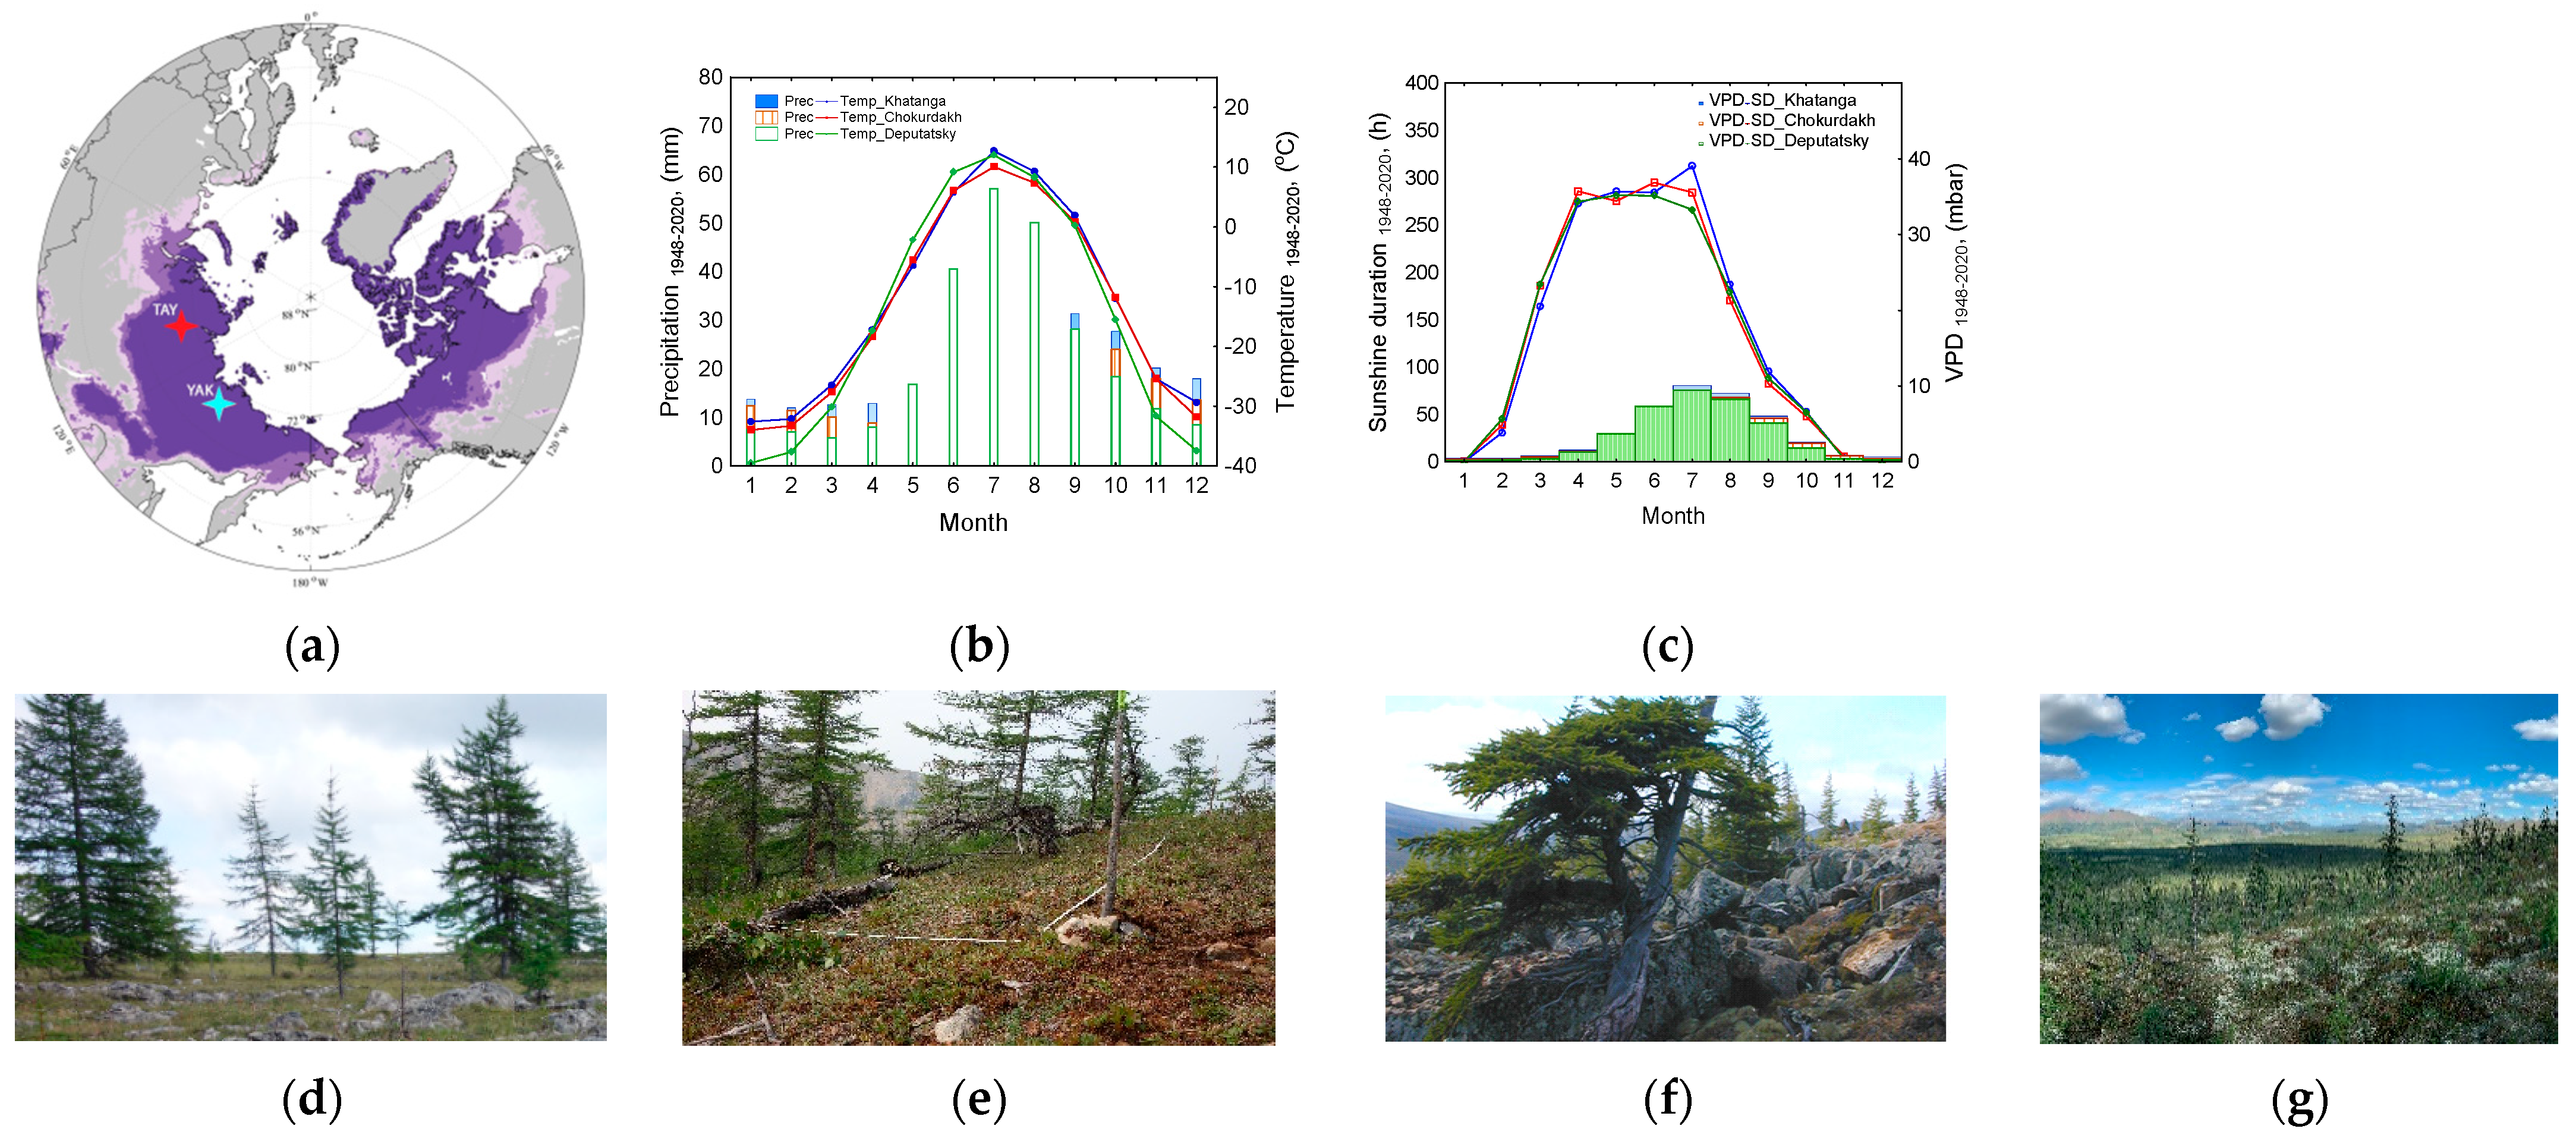
2.1. Subarctic Study Sites

The study sites are located in the permafrost zone in the eastern part of the Taimyr Peninsula (TAY—70° N, 102° E) and Yakutia (YAK—69–70° N, 139–148° E) (Figure 1a). According to the Köppen classification, both sites are characterised by extremely cold subarctic climate conditions.
The annual air temperature is −14.0 °C for YAK according to the local Chokurdakh and Deputatsky weather station data for the period from 1948 to 2021, and −12.7°C for TAY based on the Khatanga weather station. A low amount of annual precipitation is recorded for YAK (245 mm/year) and for TAY (275 mm/year) (Figure 1b). The average date of the last spring frost day is June 12 for TAY, while in YAK it is earlier, on May 25 and June 5. The average length of the frost-free period in the Siberian subarctic ranges from 40 to 70 days for the period 1948 to 2021. The annual sum of sunshine duration (S) ranges from 1660 h at YAK to 1689 h at TAY (www.meteo.ru, access on 25 March 2022). Maximum sunny hours are recorded mainly during spring and summer (April–July) (Figure 1c).
The organic layer at the YAK site is ca. 6.5 cm; permafrost thaw depth in July reaches a maximum of 40 cm. At the TAY site, the permafrost thaw depth reaches up to 60 cm in sunny places in the middle of July [9].
Tree cores from the dominant larch species without visible scars and double pick crone Larix gmelinii Rupr. Rupr. and Larix cajanderii Mayr. were collected during several expeditions in 2009 [20,25] and 2021 in the Taimyr Peninsula: Kotuy (TAY, 70° N, 102° E); in northeastern Yakutia, the Sakha Republic in 2004 (YAK—70° N, 148° E) [24] and in 2021 in Deputatsky (YAK—69° N, 139° E) (Figure 1d–f). Trees were selected from open locations without visual wildfire impact.

2.2. Weather Station Data

For each study site, monthly air temperature, precipitation, vapour pressure deficit (VPD) and sunshine duration (S) data were obtained from Aisori meteo http://aisori-m.meteo.ru/waisori/index0.xhtml, accessed on 25 March 2022, for the local weather stations: Chokurdakh 70° N, 147° E, 11 m asl (station code 21946), Deputatsky, 69° N, 139° E, 282 m asl (YAK, station code 24076); Khatanga 71°59′ N, 102°28′ E, 33 m asl (TAY, station code 20891) for the common period from 1966 to 2021. Our previous study showed that gridded data from the Climate Research Unit, CRU TS4.03, from 1900 to 2021 are highly correlated with air temperature, while poorly correlated with precipitation and vapour pressure deficit (VPD) [40]. Therefore, we used a combination of the local and gridded data for air temperature obtained from CRU for the period from 1900 to 2021. Precipitation, vapour pressure deficit and sunshine duration data were used only from the local weather stations for the period from 1966 to 2021.

2.3. Sample Preparation

Resins contained in the wood were extracted from all the collected tree cores over 40 h in a Soxhlet apparatus containing 96% ethanol to facilitate the tree-ring width measurements. Subsequently, the tree cores were washed in distilled water and air-dried [41]. The upper surface of the tree cores was removed with a core-microtome [42] to allow the observation of tree rings under magnification. Before digitising, all segments were checked for quality on a STEMI 2000-C microscope (Carl Zeiss, Jena, Germany). Next, the surface of the samples was scanned in reflected light at 20× or 30× magnification (depending on the size of tree rings) using an AXIO zoom V16 microscope (Carl Zeiss, Germany) equipped with a motorized slide. The resulting images were then stitched in the ZEN software package (Carl Zeiss, Germany), and tree-ring widths were measured in CooRecorder 9.3 (CR) [43]. Graphical cross-dating of the tree-ring width (TRW) time series was performed in CDendro 9.3 [43].

2.4. Stable Carbon, Oxygen and Hydrogen Isotope Analyses

Annual tree rings were split manually using a scalpel under a binocular (Leica, Microsystems, GmbH, Wetzlar, Germany) for eight trees and a minimum of two cores for each tree. Because of narrow rings, samples were pooled together for each year. For cellulose extraction, each wood subsample was enclosed in a filter bag (F57, Ankom Technology, NY, USA) and washed twice for 2 h in 5% NaOH to remove the remaining lipids, resins and hemicellulose. A 7% NaClO2 treatment was then performed for 36 h to remove the lignin, according to the method described by Loader et al. 1997 [44]. Samples were dried in the oven for 24 h at 50 °C, then homogenised using ultrasound and freeze-dried under vacuum. Extracted tree-ring cellulose samples were weighed (ca. 1.0 mg) into silver capsules for simultaneous carbon (13C/12C) and oxygen (18O/16O) isotope measurements using PYRO Cube (Elementar, Langenselbold, Germany).
Equilibration with water of known isotopic composition, followed by high temperature pyrolysis [33] was applied to determine the 2H/1H isotopic ratios of carbon-bound hydrogen. The isotopic ratios are expressed in the conventional delta notation (δ) expressed in (‰) relative to the international standards (Equation (1)):
δsample = (Rsample/Rstandard − 1) × 1000
where Rsample is the ratio of 13C/CYC or 18O/16O or 2H/1H in the sample and Rstandard is the ratio either of 13C/12C in the Vienna Pee Dee Belemnite (VPDB) for carbon, or for 18O/16O in the Vienna Standard Mean Ocean Water (VSMOW) for oxygen and hydrogen.
The precision for stable isotopes (±0.1‰ for δ13C, ±0.3‰ for δ18O and ±2‰ for δ2H) is based on a large number of measurements of the standard material and quality control (n = 99). The δ13C atmospheric CO2 correction [45] was applied for the period from 1900 to 2021 Common Era (CE); no specific corrections for the δ2H and δ18O were applied.

2.5. Merging Stable Isotope Chronologies

Newly obtained δ13C and δ18O tree-ring larch cellulose chronologies for YAK (1990–2021) and TAY (1990–2020) were used to prolong earlier published δ13C and δ18O time series for the period from 1900 to 2004 for YAK [20,25] and from 1900 to 2009 for the TAY [24] sites.
To obtain continuous chronologies we applied a merging method based on the overlapping period [46], where the chronologies were normalised (z-score) relative to the zero and then averaged.

2.6. Statistical Analysis

Pearson correlation (r), t-test and time-series analyses were performed in Statistica Software TIBCO v.13.5. Time-series analysis (no trend) was applied to remove trends for the merged averaged chronologies. After trend removal, we used residual chronologies to perform climate analysis.
Climatic analysis between stable isotope chronologies from eastern Taimyr (TAY) and Yakutia (YAK) and monthly air temperature (Temp), precipitation (Prec), vapour pressure deficit (VPD) and sunshine duration (S), from September previous year to August current one, were calculated for the period from 1951 to 2000 CE. In addition, spatial correlation analysis within a gridded net from 60–80° N and 20–150° E was performed using KNMI Climate Explorer data and stable carbon, oxygen and hydrogen isotopes in tree-ring cellulose ([47], https://climexp.knmi.nl/, status accessed on 9 May 2022).

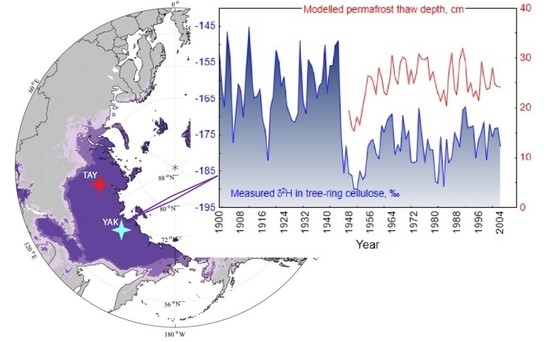
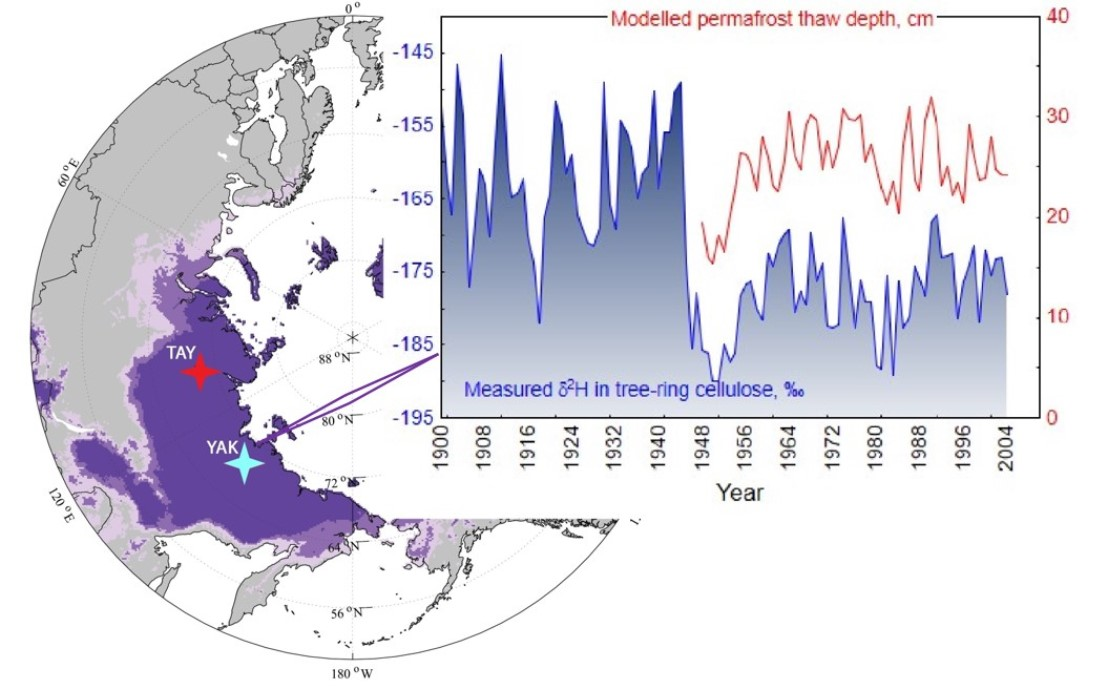
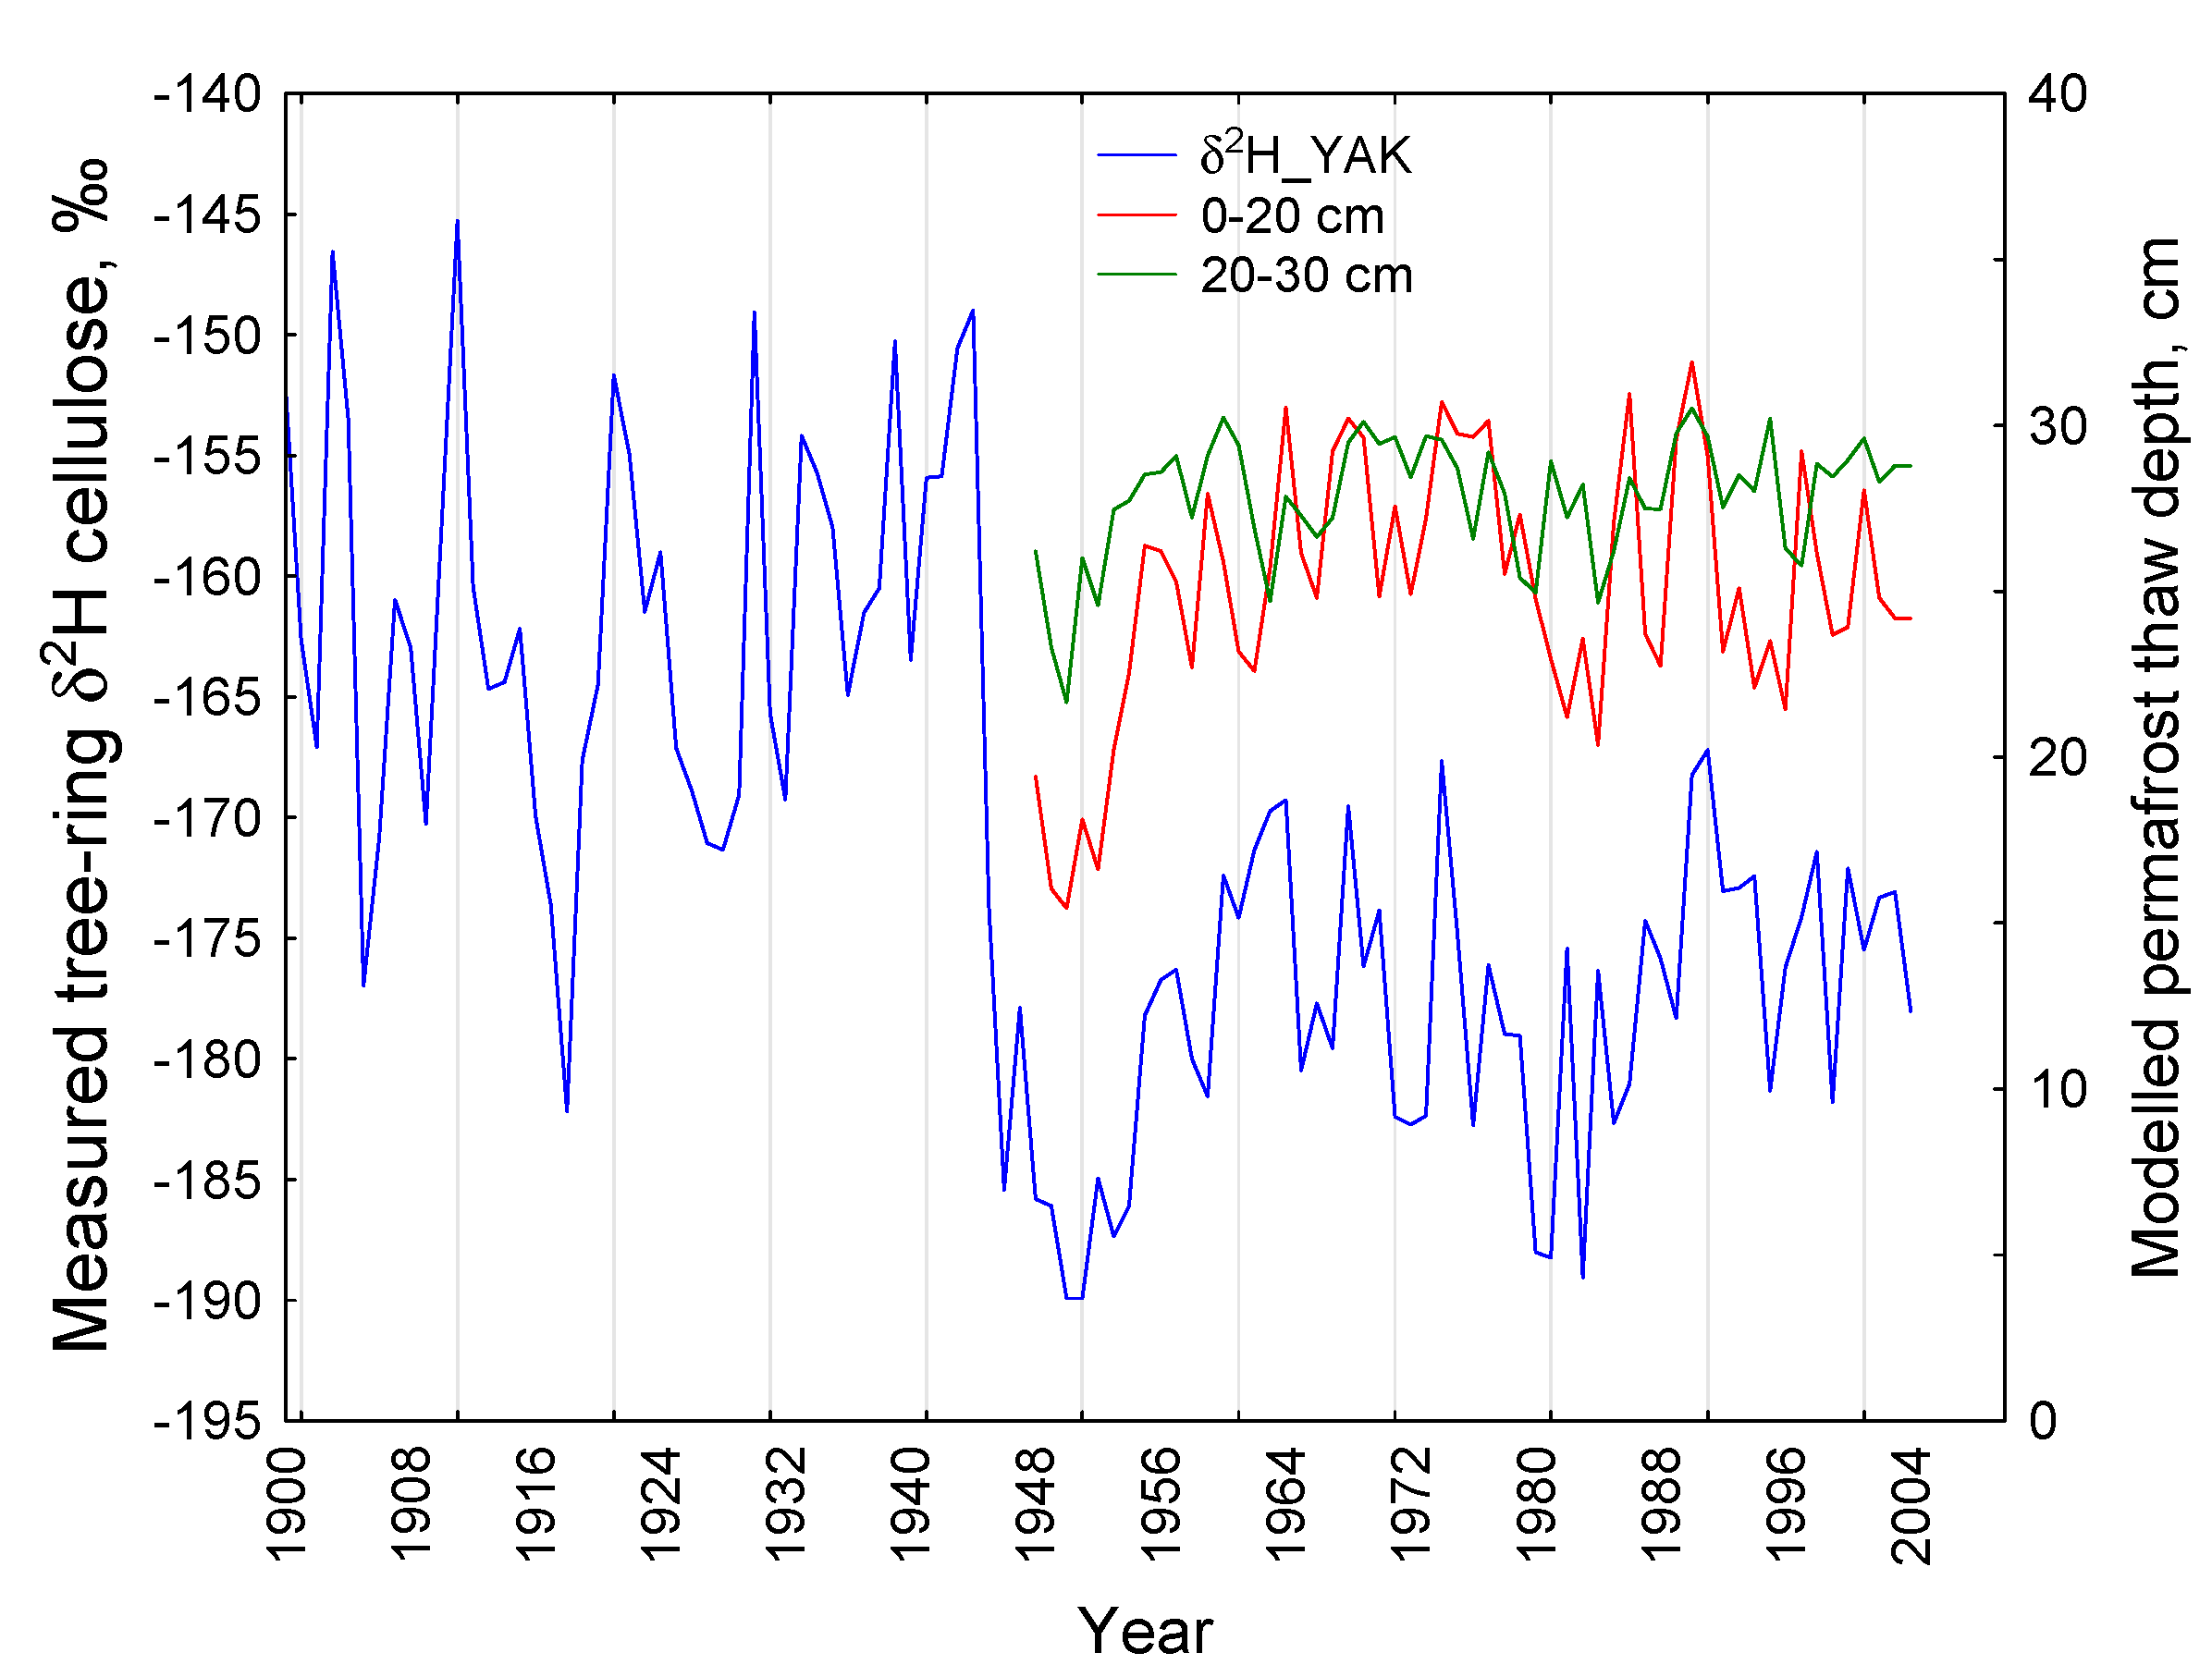
2.7. Modelled Water Fraction at Permafrost Thaw Depths

To better understand the nature of relationships between newly developed hydrogen proxy and water origin, a correlation analysis between modelled annual water fraction at different permafrost thaw depths (0–20, 20–30, 30–50, 50–70, 70–100, 100–150, 150–200 cm) for the period 1948 to 2004 was performed. Water fraction was simulated using the Land Surface Processes and Exchanges (LPX-Bern 1.0) model, which was developed and tested at the University of Bern, Switzerland [48,49,50]. The LPX-Bern model describes vegetation cover, carbon and nitrogen dynamics in soil and vegetation and water exchange, CO2, methane, and nitrous oxide between the atmosphere and the land [48,49,50]. The model is calibrated globally for various soil surfaces, vegetation types and ecosystems. It is a process model based on simple physics, geography, biology and biogeochemistry principles, which was evaluated against observations and tested for the sensitivity of the key outputs (for more details see Wania et al. [51]).
Permafrost simulation in the LPX-Bern model uses 8 types of mineral soils [51]. The greatest impact on heat transfer is the separation into mineral soils (7 types) and organic soil (1 peatland soil type) due to the difference in porosity and thus water storage capacity. In this study, we used a generic mineral soil type (“medium texture”) [51]. All other parameters were used as in the published version of the model, here most importantly for permafrost [51] and photosynthesis [52]. The permafrost module within LPX-model has been compared to active layer thickness at 20 sites from the Circumpolar Active Layer Monitoring Network (CALMN), where 8 sites are in Russia and 3 of these sites are in Yakutia [49,50,51]. Modelled seasonal soil temperatures, thaw depths, δ18O in soil and leaf water and water vapour [39,53,54] have been compared to measurements at four stations in the circumpolar region. In our early study [50], we calibrated the LPX-model for the YAK site and tested inter-annual variability of thaw depth with data from a nearby Yakutsk site [53].

3. Results

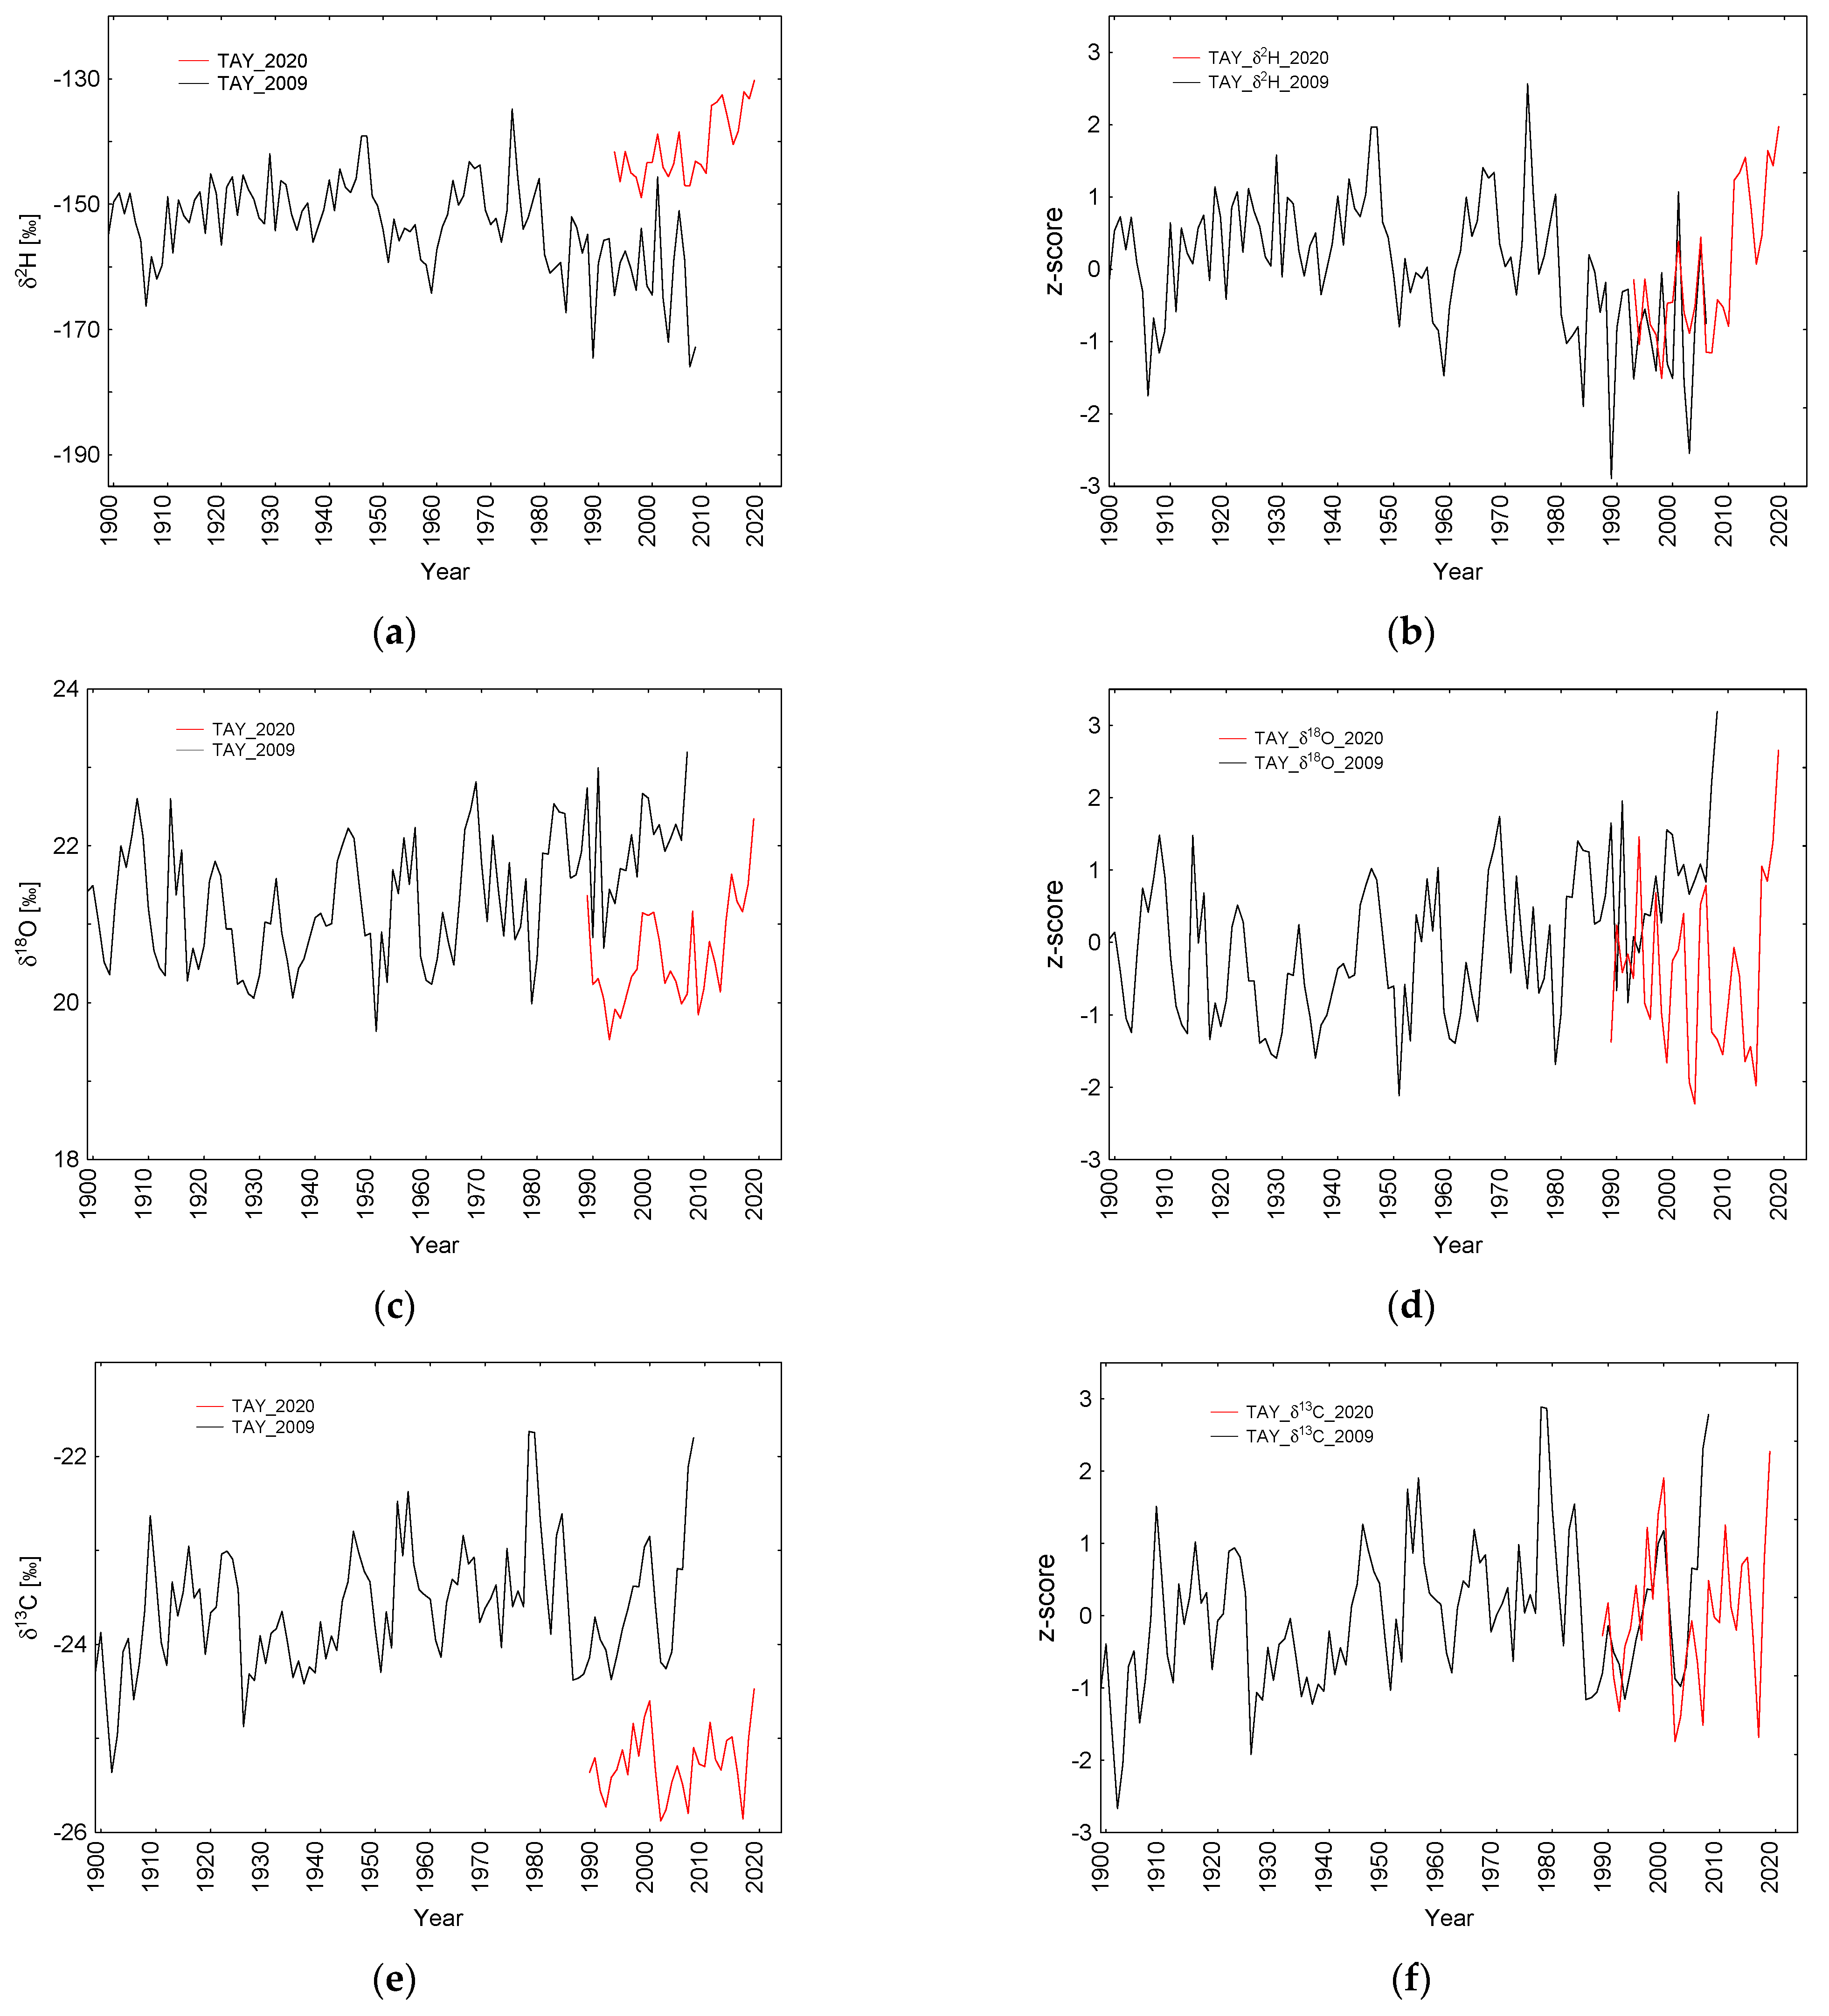
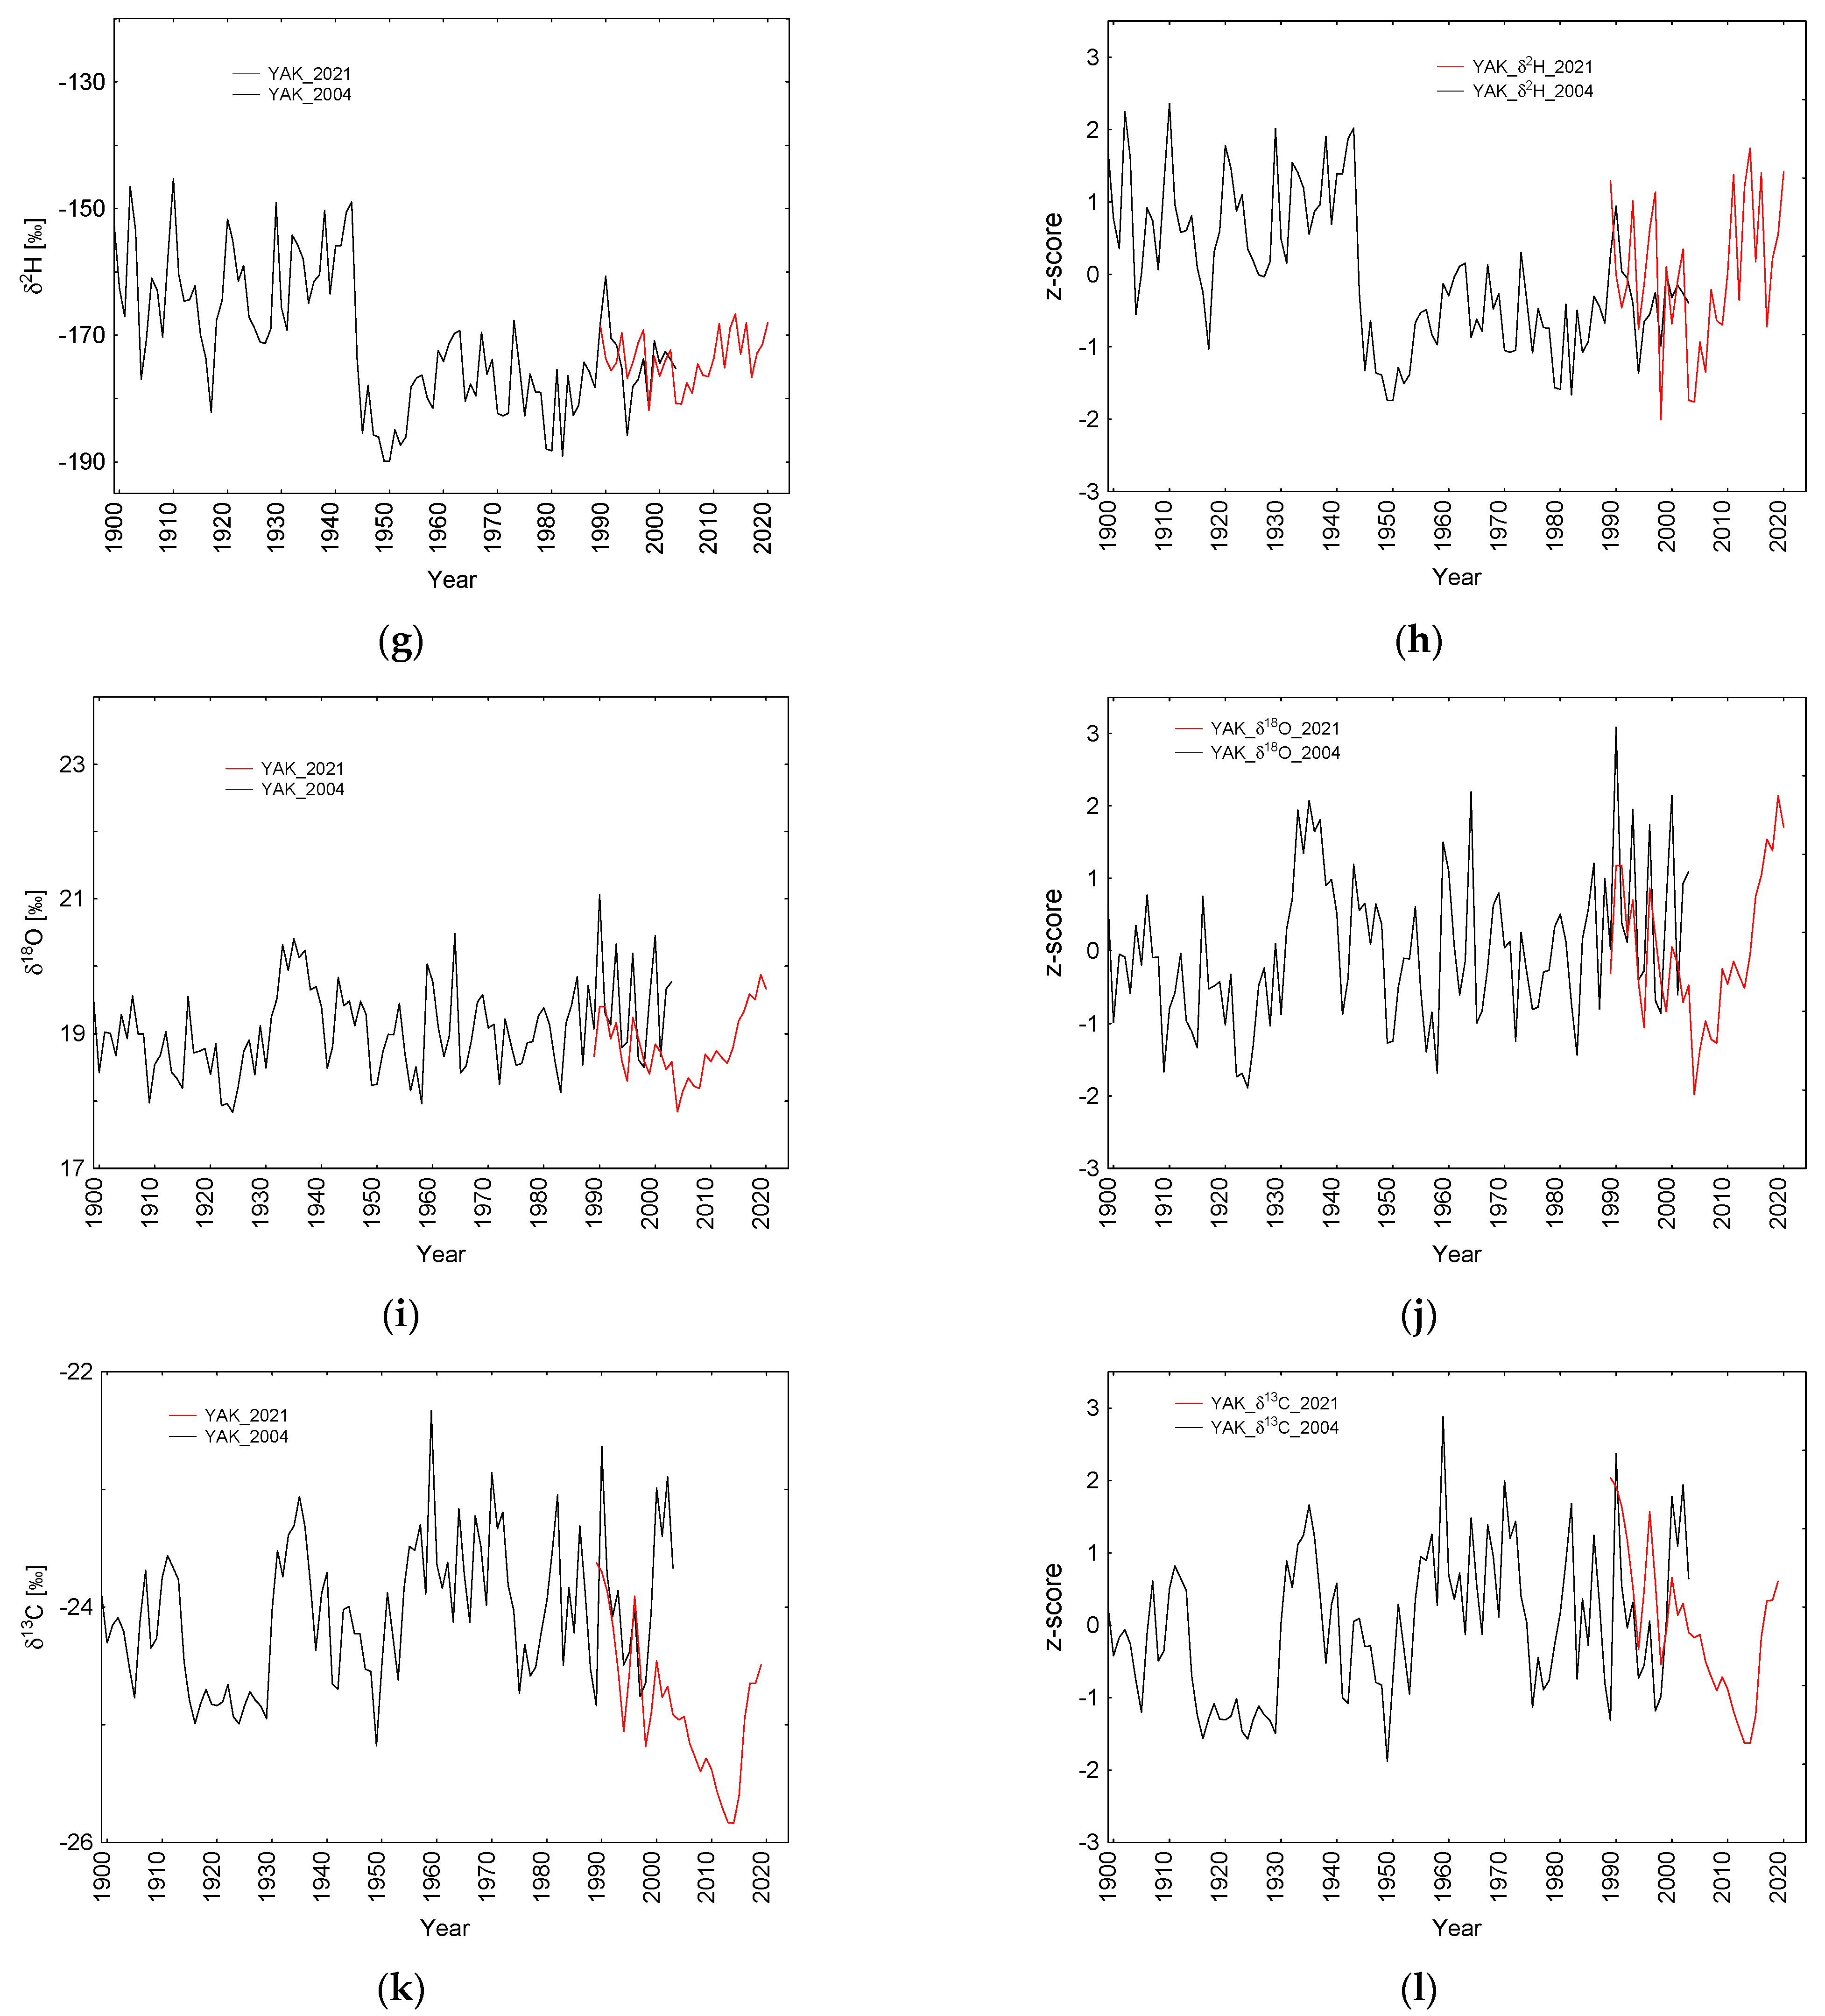
3.1. Prolongation of Annually Resolved Tree-Ring δ13C, δ18O, δ2H Chronologies

New stable carbon (δ13C) and oxygen (δ18O) isotope chronologies of larch tree-ring cellulose were obtained for both Siberian sites in TAY (Figure 2c,e) and in YAK (Figure 2i,k) for the period 1990–2020 and 1990–2021, respectively. The hydrogen chronologies (δ2H) were developed for the period from 1900 to 2020 for TAY (Figure 2a) and 1900–2021 for YAK (Figure 2g). To merge earlier published δ13C and δ18O data from YAK [20,25] and TAY [24] (Figure 2, black lines), we normalised chronologies relative to zero (z-score) (Figure 2d,f,j,l) and prolonged chronologies to 2020 for TAY and 2021 for YAK, respectively (Figure 2, red lines). Newly obtained δ2H chronologies for both study sites from 1990 to 2020 for TAY and 1990 to 2021 for YAK were obtained (Figure 2a,g in red) and merged relative to zero (z-score) with earlier obtained chronologies from the same regions [24] for TAY and [20,25] for YAK (Figure 2b,h, black line), accordingly.
Considering the merged total chronologies, we found drastic changes in δ2H values around the 1950s for YAK with a slight tendency to increase towards the year 2021. Clearly higher δ18O values are recorded for TAY (Figure 2c) compared to a lower value in YAK (Figure 2i). The δ13C data show a decreasing trend towards the 21st century for both the TAY (Figure 2e) and YAK sites, with a more pronounced and drastic decrease for YAK (Figure 2k).
Increasing δ2H, δ18O and δ13C values were observed during the period from 1951 to 2020 compared to 1900–1950 (Figure 2b,d,f,h,j,l). However, YAK—δ2H values are lower (Figure 2h) and vary significantly compared to the TAY—δ2H (20.6 ‰, p = 0.001, F-ratio variance (1.85) df = 241, n = 121, confidence −95% (−22.76) and confidence +95% (−18.38) (Figure 2b) site along with more stable δ18O values (Figure 2d).
The lower stable isotope values were found for YAK for δ2H and δ18O compared to TAY (Table 1). The lowest values were found for YAK—δ2H. For TAY, mean δ2H values did not change during the studied periods, however, TAY—δ18O increased towards 1951–2020 on 2.1‰ (Table 1). For YAK—δ2H for the period 1951–2020 become 5‰ lower compared to the whole studied period 1900–2020. Mean, maximum and minimum values did not change significantly during the two periods (1951–2020 and 1900–2020).
Residual stable isotope chronologies (no trends) were used for the correlation analysis between parameters and sites. A positive significant correlation (r = 0.21, p = 0.023) between δ2H and δ18O from YAK was revealed for the period from 1900 to 2021 and for the period 1951 to 2021 (r = 0.34, p = 0.004); no significant correlations between δ2H and δ18O from TAY were revealed.

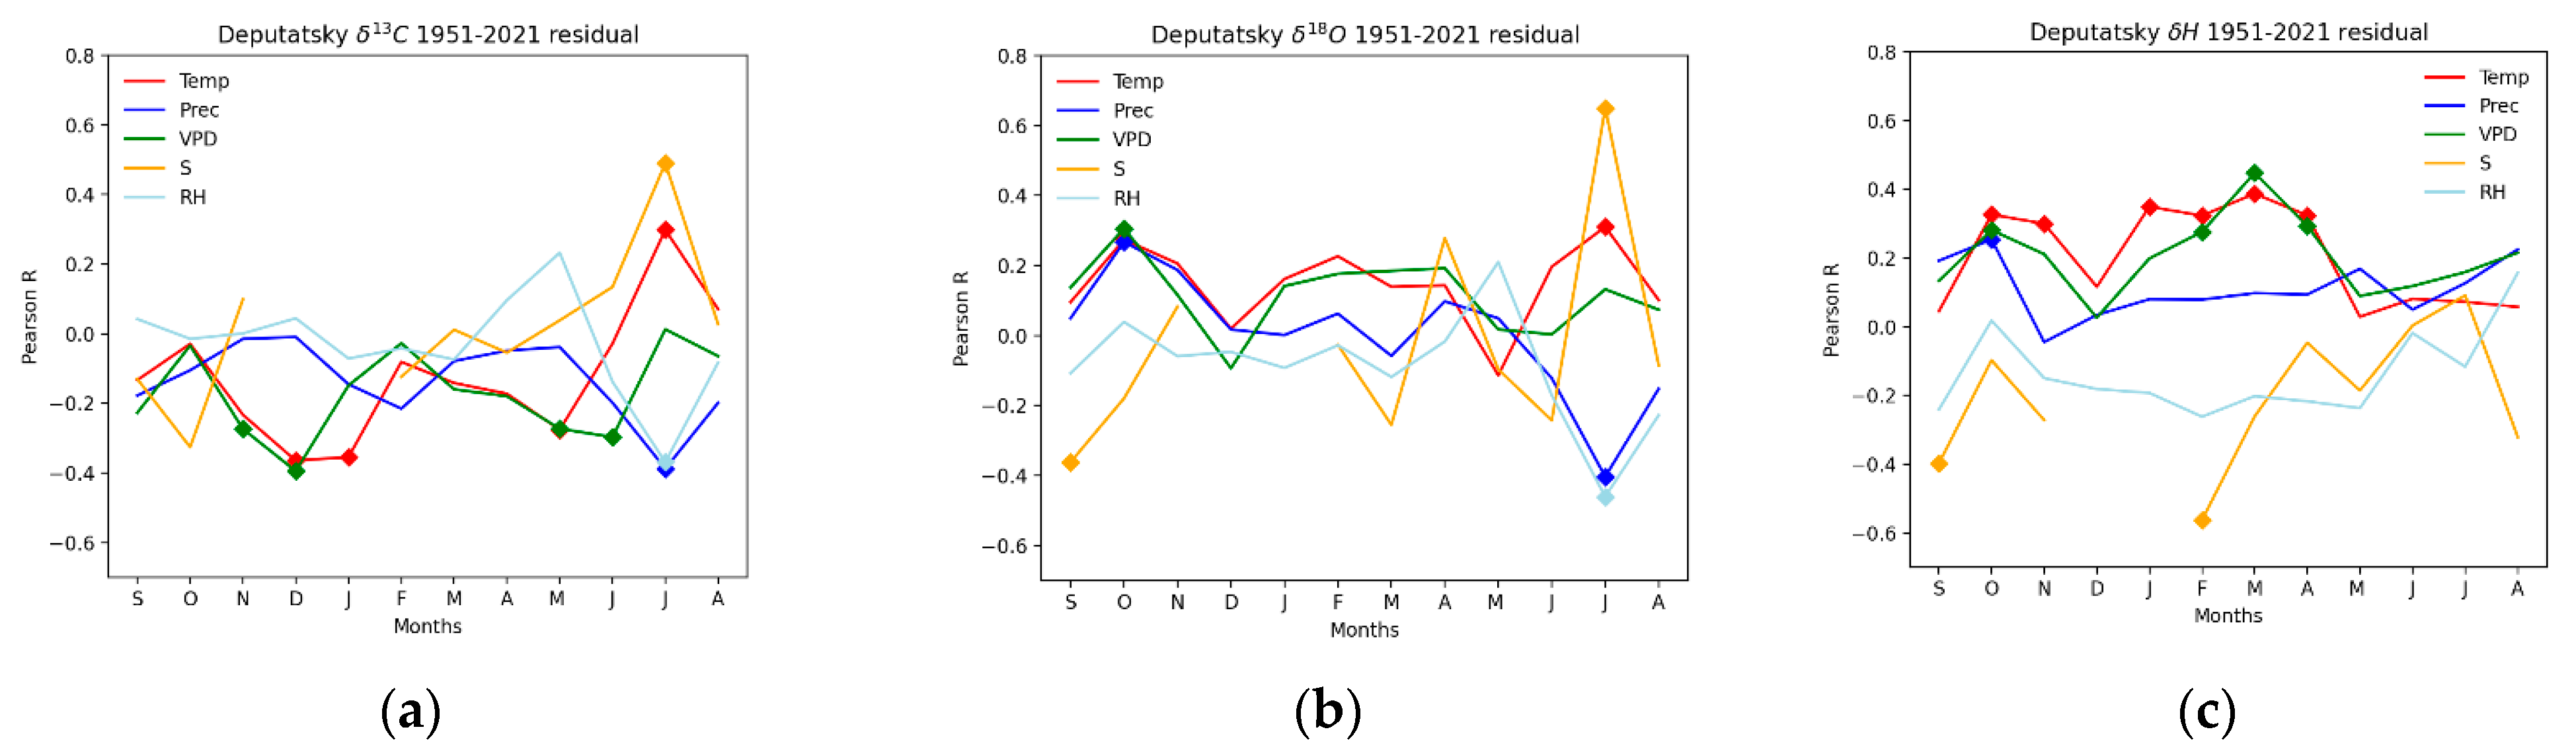
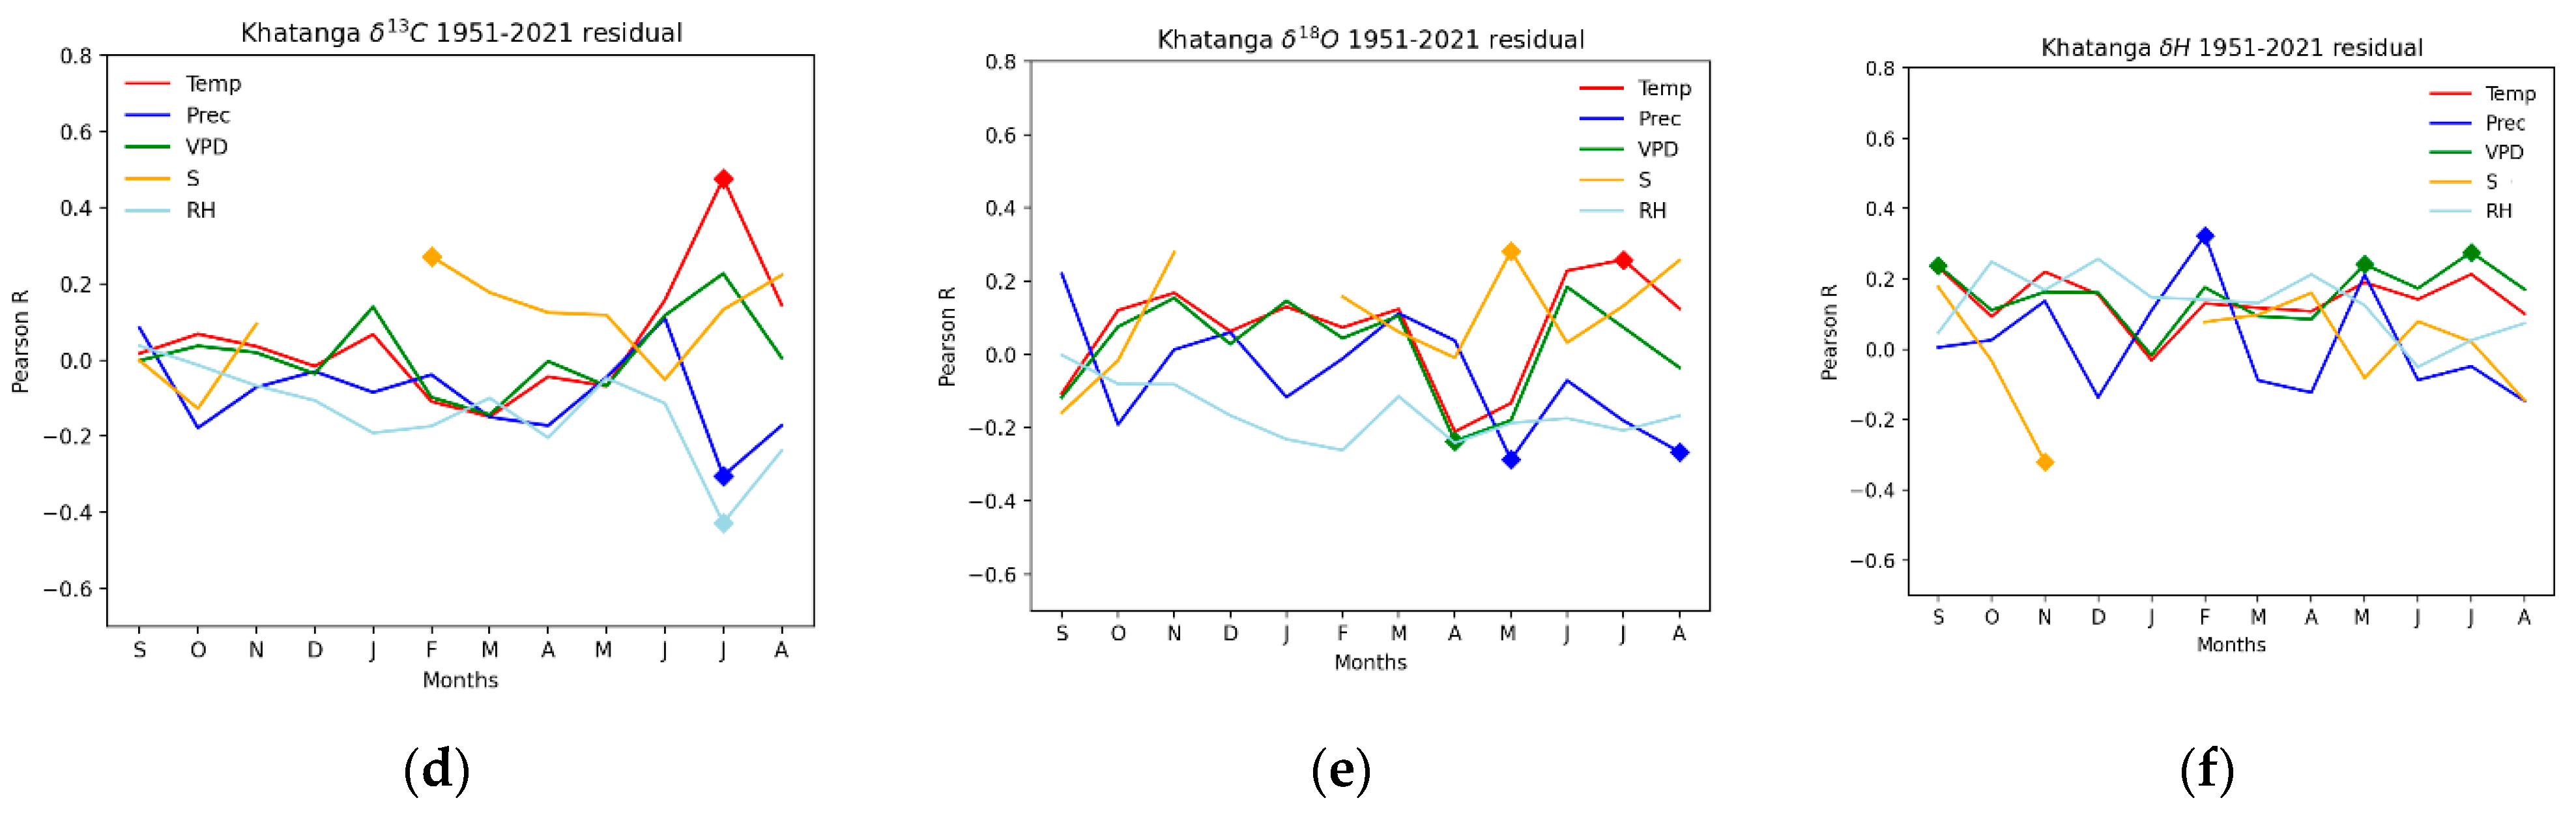
3.2. Climate Analysis between Residual Stable Isotope Time Series and Local Weather Station Data

3.2.1. Carbon Isotopes (δ13C)

Significant positive correlations (p < 0.0001) between δ13C in tree-ring cellulose and July temperature were revealed for both the YAK and TAY study regions for the period 1951–2020 (Figure 3a,d). At the same time, negative correlations were found between δ13C versus July precipitation and relative humidity. Furthermore, VPD impacts significantly the variation of carbon isotopes in tree-ring cellulose in November–December of the previous year and May–June of the current one in YAK only (Figure 3a).

3.2.2. Oxygen Isotopes (δ18O)

The δ18O tree-ring cellulose chronologies capture the July temperature signal for both the YAK and TAY study sites (Figure 3b,e), similar to δ13C time series (Figure 3a,d). July precipitation is negatively correlated with YAK—δ18O (Figure 3b), while May and August are negatively correlated with TAY—δ18O (Figure 3e). Sunshine duration is highly correlated with YAK—δ18O (r = 0.74; p = 0.0001) (Figure 3b) and to a lesser degree in May for TAY—δ18O (Figure 3e). Positive significant correlations were found between YAK—δ18O and VPD along with precipitation in October of the previous year. A negative correlation was revealed between VPD in April and TAY—δ18O (Figure 3e).

3.2.3. Hydrogen Isotopes (δ2H)

The YAK—δ2H dataset shows significant positive correlations with the autumn temperature of the previous year and winter–spring temperatures of the current one, along with positive correlations of VPD in February, March and April (Figure 3c). A strong negative correlation between sunshine duration in February and δ2H (r = −0.6; p = 0.0001) was found. No significant correlation between TAY—δ2H and air temperature was detected (Figure 3f). However, positive correlations were found between TAY—δ2H and VPD in May and July as well as September of the previous year. A moderate positive correlation between winter precipitation in February and TAY—δ2H was also revealed (Figure 3f).

3.3. LPX-Modelled Annual Water Fraction Permafrost Thaw Depth

Significant correlations were found between tree-ring δ2H cellulose versus modelled water fraction of thawed soil at 0–20 and 20–30 cm depths (r = 0.49 and r = 0.42; p < 0.001), respectively (Figure 4). Even stronger significant correlations were found between residual δ2H in tree-ring cellulose and modelled water fraction at thaw depths at 0–20 cm (r = 0.58, p = 0.000) and 20–30 cm (r = 0.46; p = 0.000).

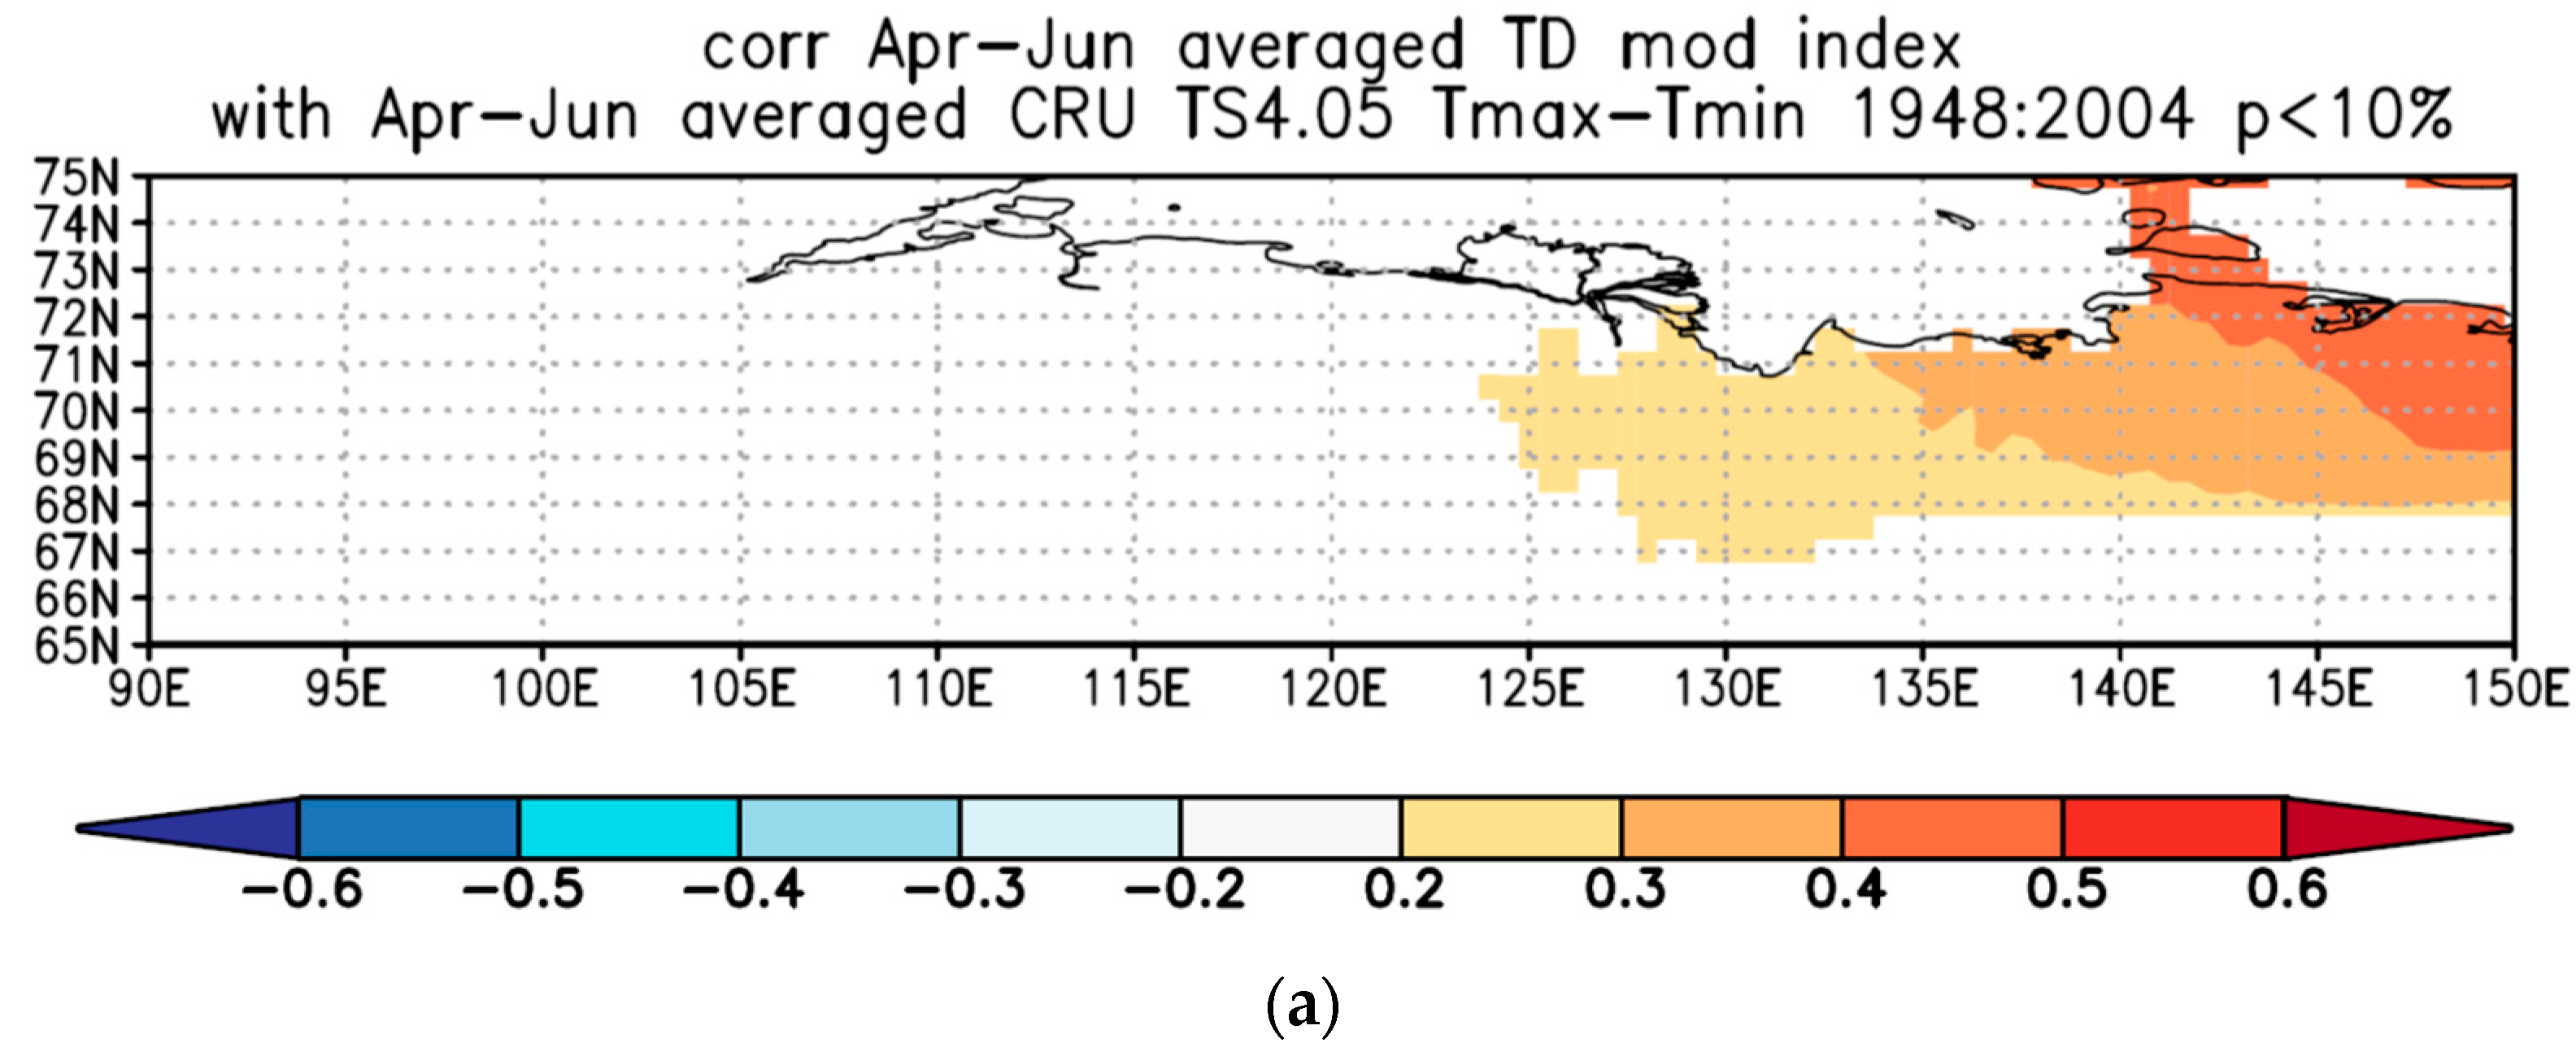
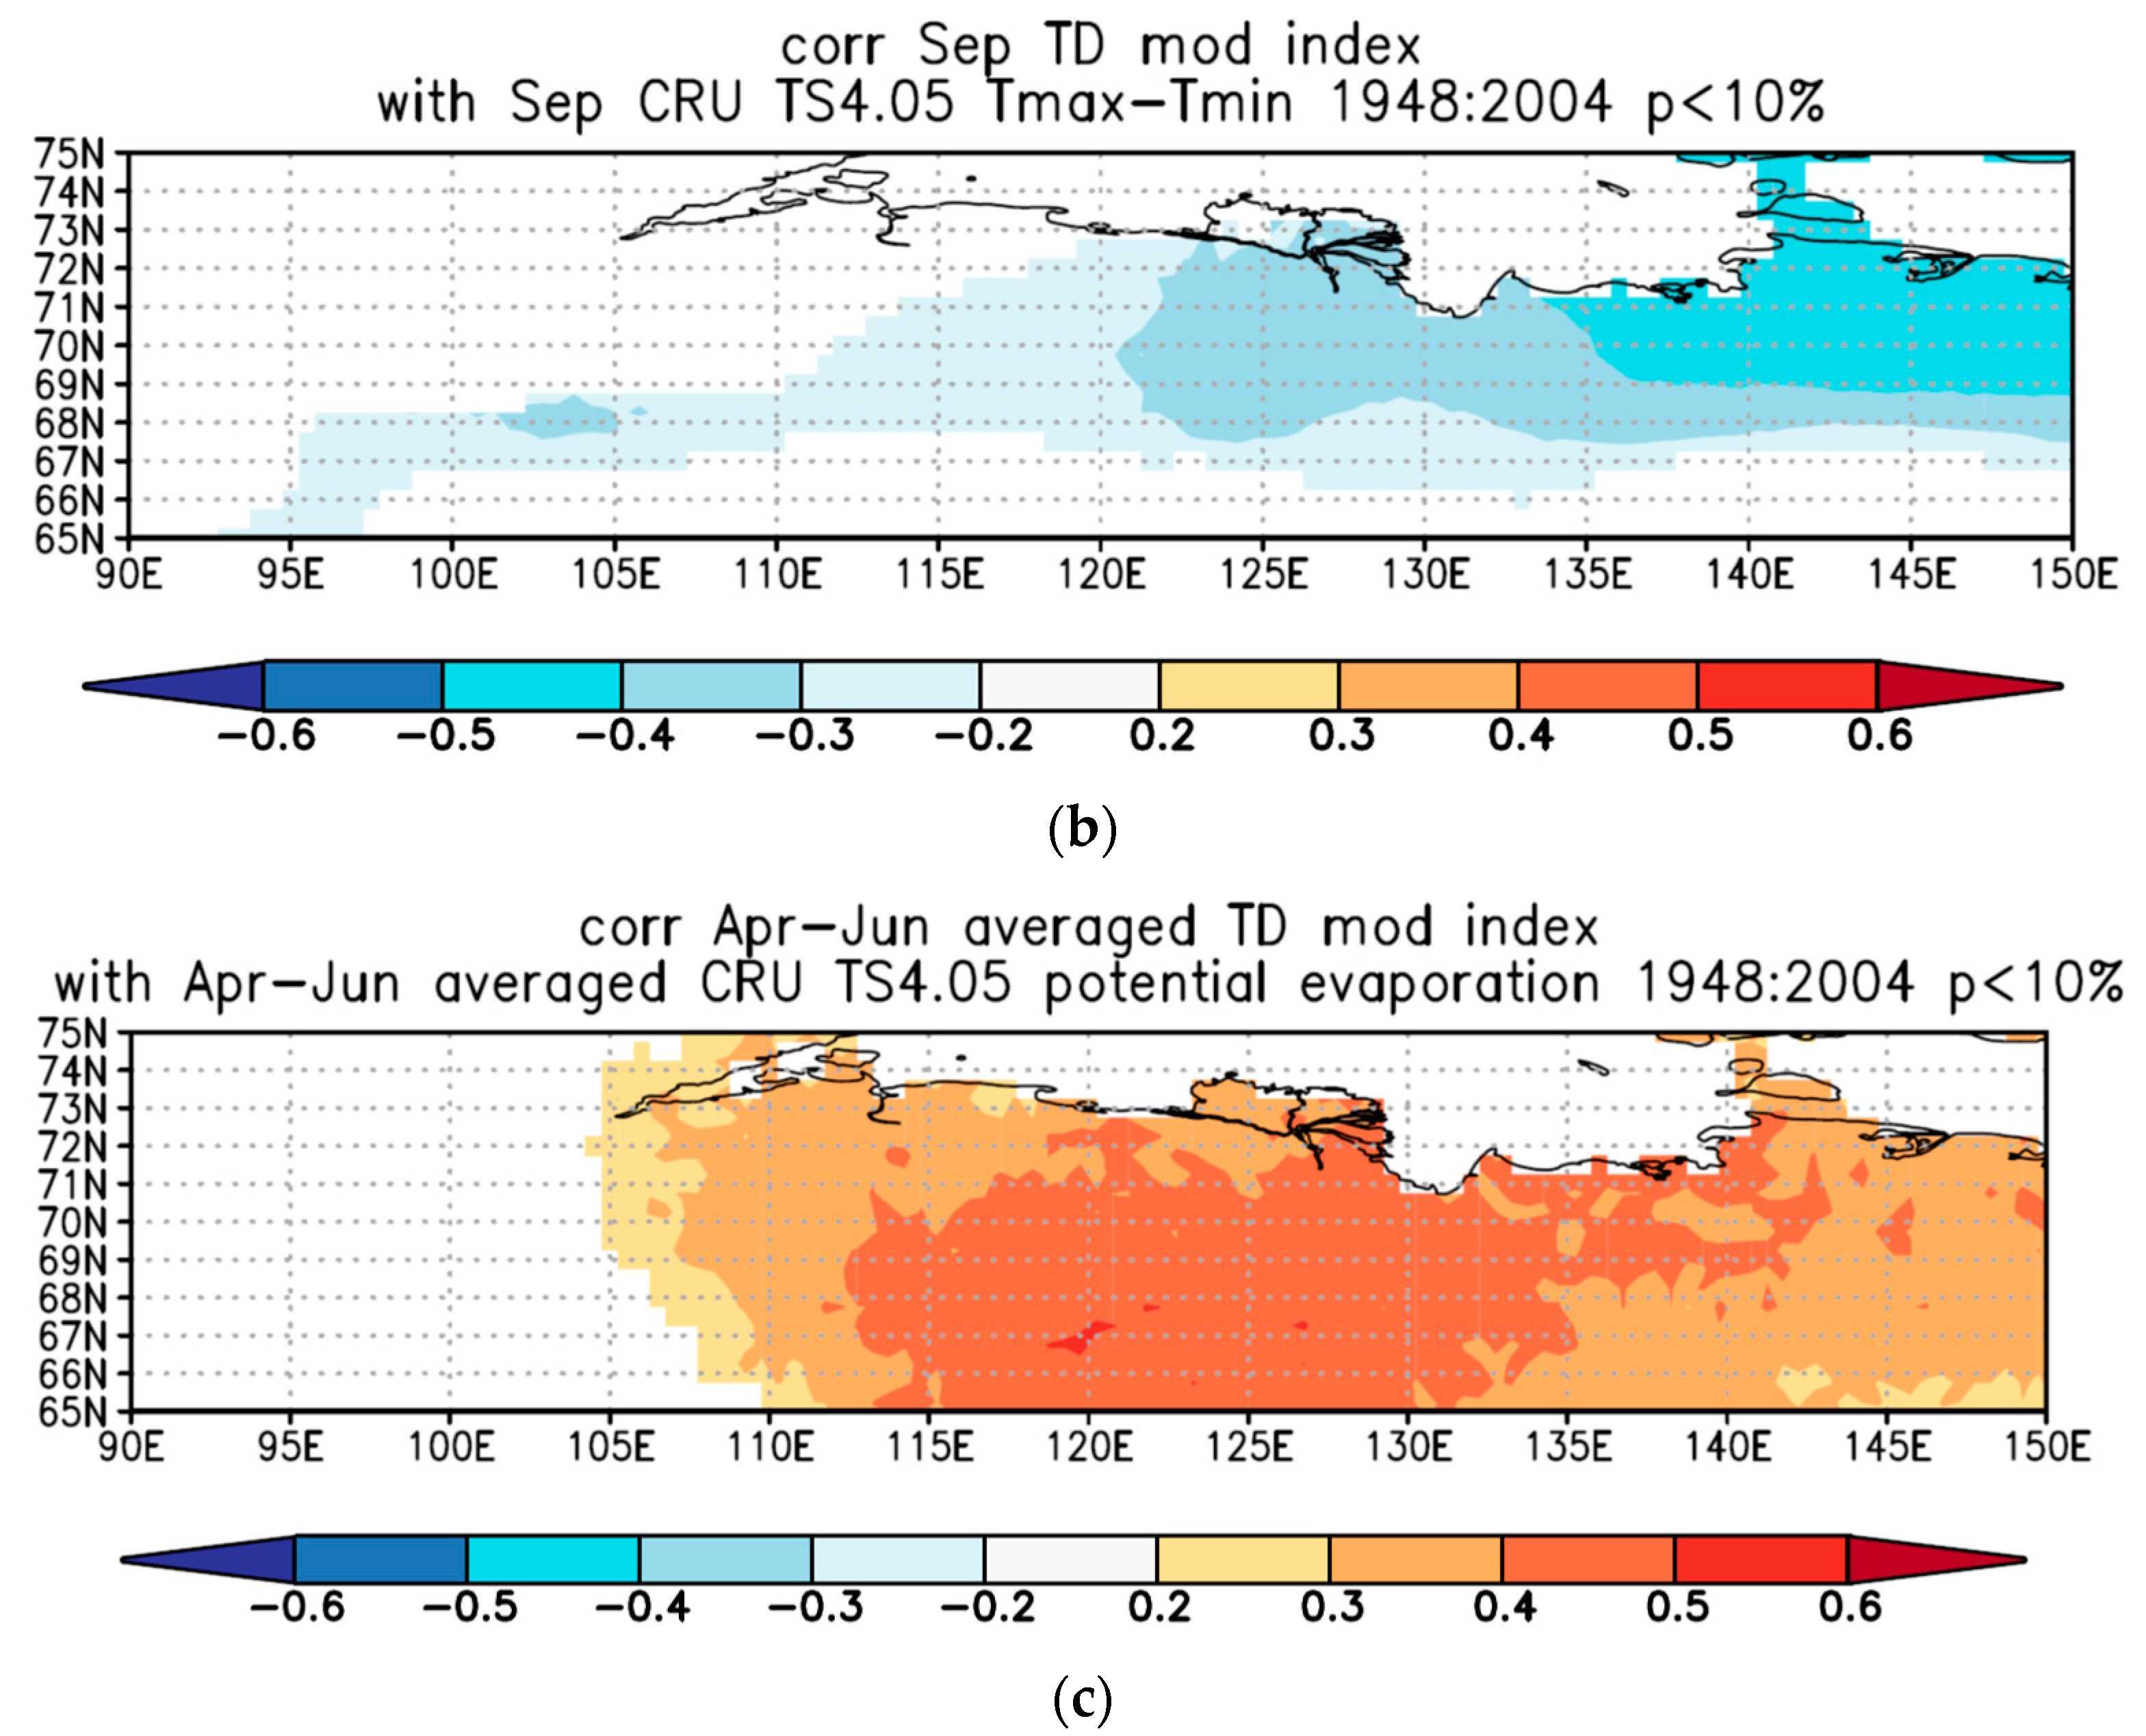
3.4. Spatial Correlation Analysis

Spatial correlation analysis between the modelled water fraction at 20–30 cm permafrost thaw depth and climate parameters within the gridded net 65−75° N and 90–150° E, available for the period 1948–2004, was performed (Figure 5). The modelled water fraction showed positive correlations with differences between maximum and minimum (Tmax–Tmin) values of averaged April–June air temperature within the range of correlations from r = 0.2 to r = 0.5; p < 0.01 (Figure 5a). While negative correlations between Tmax–Tmin in September and modelled water fraction from r = −0.2 to r = −0.5; p < 0.01 with distribution on a large area were found (Figure 5b). A large spatial distribution within 65−75° N, 105−150° E was also revealed with averaged April–June potential evapotranspiration (Figure 5c).

4. Discussion

Newly developed and prolonged triple stable isotope chronologies into the third millennium provided information about the impact of the autumn and winter–spring air temperatures for YAK and winter precipitation changes for TAY recorded in hydrogen isotopes, which were not revealed in carbon and oxygen tree-ring series. July air temperatures and sunshine duration impact significantly stable oxygen and carbon isotope variability. It became clear that larch trees from both Siberian sites experienced increasing drought conditions during the hot, sunny and dry summers in recent decades.
Increasing drought conditions are confirmed by statistical analysis with carbon isotopes. Positive correlations between δ13C and July air temperature as well as with sunshine duration and negative correlations with July precipitation and relative humidity were revealed. This type of correlation between δ13C and drought is well established from mechanistic studies investigating isotope fractionations during photosynthesis as well as field studies worldwide [12,39]. An increasing number of sunshine duration hours also impacts leaf temperature and evapotranspiration under air temperature increase [55].
Forest ecosystem hydrology can be strongly affected by evaporation, which can be limited by seasonal precipitation changes and location [30,49]. The potential effects of increased evaporative demand could be drought waves and increased frequency of modern wildfires, particularly in central Siberia [56,57,58] but also worldwide [59,60].
A positive link between δ18O variations at YAK and autumn VPD as well as autumn precipitation, indicates high water availability for trees during this time of the year. However, by the end of the season, in August, trees cannot further utilise this water because cold temperatures prohibit physiological activity. In contrast, this water source can be considered as a water buffer with water available for the next spring–summer and made available for trees’ water uptake. Simulated by the LPX-Bern model, water fractions of thawed permafrost at 0–20 and 20–30 cm depths showed water access for larch trees reflected in tree-ring δ2H cellulose time series. The spatial distribution of correlation coefficients between modelled water fraction and thawed permafrost depth at 0–20 cm further showed a strong effect of the averaged difference between Tmax–Tmin of April–June air temperatures and evaporation, confirming a link with temperature and evaporation increase. Owing to the short vegetation season in the Siberian subarctic (45–60 days) with the threshold temperature period of +5 °C [8], impact of September air temperature on thawed permafrost depth at 0–20 cm showed negative correlations, which can be explained by freezing soil back at this depth. Our finding is also in line with Fedorov-Davydov [61], who reported that the active soil layer freezes mostly from above, as in our case study at the 0–20 cm depth, while in cool summers it may freeze partly from underlying permafrost layers at 20–30 cm.
Our results, therefore, provide new information on the dynamics of continuous permafrost in the vast subarctic territory, which can act as a buffer for water availability, where it is either a source (during warm periods) or a sink (during frost events). To derive eco-hydrological information (e.g., precipitation, permafrost-thawed and snowmelt water, soil-active-layer water and relative humidity) from trees, the dual tree-ring δ2H and δ18O can be a promising approach for better understanding these eco-hydrological processes.
The interaction of the hydrological influences for larch trees growing on permafrost with precipitation and freezing and thawing of soil layers at different depths is crucial for trees’ water relation and water uptake. Therefore, recent changes may significantly affect tree growth at the study sites under a reduced amount of precipitation and simultaneous temperature and VPD increase. Our earlier study showed that, based on the LPX-Bern modelled annual soil water fraction, there was not much variability in the soil depths > 100 cm and minor influence on both carbon and oxygen isotopes [50]. In contrast, high variability was found for soil depths between 10–20 cm, which correlated significantly with δ13C, measured in wood (r = 0.36; p < 0.01) only, indicating that larch trees are influenced and have access to water from the active soil layer only [50]. This is in line with a study from central Siberia, where a significant link between soil water and oxygen isotope composition was found [60]. Our newly developed δ2H eco-hydrological proxy showed a significant link with modelled water fraction at 0–20 and 20–30 cm permafrost thaw depths, which clearly demonstrates that trees under drought have potential for water uptake from the thawed permafrost water.
Studies on tree-ring δ18O variation from Siberian sites were recently conducted [20,21,26], showing teleconnection patterns with the Arctic oscillation index via summer precipitation. Such large-scale atmospheric circulation patterns are thought to be responsible for drought in the Siberian subarctic and the increased frequency of modern wildfires [62]. Therefore, the water isotopes (δ18O, δ2H) can also be related to global temperature, precipitation changes and altered atmospheric circulation patterns, resulting in wet or dry weather extremes on regional and global scales.
We conclude that regional studies in the Siberian subarctic can deepen our understanding of the processes related to deuterium fractionation during cellulose synthesis, suggesting δ2H as an eco-hydrological proxy, and may improve the quality of climate reconstructions in subarctic forest ecosystems when combined with other proxies. This information will help to explain the decoupling mechanisms between air temperature and boreal tree growth. The significant shift from temperature to water-limited tree growth is linked to eco-hydrological changes that can be explained by permafrost degradation and the availability of additional water sources for trees, such as thawed permafrost water and the extensive development of thermokarst lakes in both subarctic regions under global warming.

Author Contributions

Conceptualization, O.V.C.; methodology, O.V.C., M.S., T.V.T., A.V.T. and M.V.F.; software, M.S.Z.; validation, O.V.C., M.S.Z., M.S. and M.V.F.; formal analysis, O.V.C., M.S.Z., M.S., M.V.F. and V.V.B.; investigation, O.V.C., M.S.Z., M.S. and M.V.F.; resources, O.V.C., M.S.Z., M.S., M.V.F., A.A. and A.V.K.; data curation, O.V.C. and M.S.Z.; writing—original draft preparation, all authors; supervision, project administration and funding acquisition O.V.C. All authors have read and agreed to the published version of the manuscript.

Funding

This research was funded by the Russian Science Foundation (RSF) grant number 21-17-00006 titled “Hydrogen isotopes and deuterium excess (d-excess) in conifer tree-ring cellulose as indicator of extreme eco-hydrological changes in boreal forests (ECO-HYDROTREE)”.

Institutional Review Board Statement

The study has been conducted in line with the institutional regulations and policy.

Informed Consent Statement

The study does not fall under human research act. There are no ethical, legal or confidential issues.

Data Availability Statement

Dataset is available under CC-BY 4.0 license in Zenodo repository doi:10.5281/zenodo.6635877.

Acknowledgments

The authors are grateful to Alexander Bondarev from V.N. Sukachev Institute of Forest, Krasnoyarsk, Russia for providing larch tree cores from Taimyr site.

Conflicts of Interest

The authors declare no conflict of interest. The funders had no role in the design of the study; in the collection, analyses, or interpretation of data; in the writing of the manuscript, or in the decision to publish the results.

References

  1. Fischer, H.; Meissner, K.J.; Mix, A.C.; Abram, N.J.; Austermann, J.; Brovkin, V.; Capron., E.; Colombaroli, D.; Daniau, A.-L.; Dyez, K.A.; et al. Palaeoclimate constraints on the impact of 2 °C anthropogenic warming and beyond. Nat. Geos. 2018, 11, 474–485. [Google Scholar] [CrossRef]
  2. Neukom, R.; Barboza, L.A.; Erb, M.P.; Shi, F.; Emile-Geay, J.; Evans, M.N.; Franke, J.; Kaufman, D.S.; Lücke, L.; Rehfeld, K.; et al. Consistent multi-decadal variability in global temperature reconstructions and simulations over the Common Era. Nat. Geogr. 2019, 12, 643. [Google Scholar]
  3. PAGES Hydro2k Consortium. Comparing proxy and model estimates of hydroclimate variability and change over the Common Era. Clim. Past. 2017, 13, 1851–1900. [Google Scholar] [CrossRef] [Green Version]
  4. Ljungqvist, F.C.; Piermattei, A.; Seim, A.; Krusic, P.J.; Buntgen, U.; He, M.; Kirdyanov, A.V.; Luterbacher, J.; Schneider, L.; Schneider, L.; et al. Ranking of tree-ring based hydroclimate reconstructions of the past millennium. Quat. Sci. Rev. 2020, 230, 106074. [Google Scholar] [CrossRef]
  5. Konecky, B.L.; McKay, N.P.; Churakova (Sidorova), O.V.; Comas-Bru, L.; Dassié, E.; DeLong, K.; Falster, G.; Fischer, M.; Jones, M.D.; Jonkers, L.; et al. The Iso2k Database: A global compilation of paleo-δ18O and δ2H records to aid understanding of Common Era climate. Earth Syst. Sci. Data 2020, 12, 2261–2288. [Google Scholar] [CrossRef]
  6. Bowen, G.J.; Cai, Z.; Fiorella, R.P.; Putman, A.L. Isotopes in the water cycle: Regional- to global-scale patterns and applications. Annu. Rev. Earth Planet. Sci. 2019, 47, 453–479. [Google Scholar] [CrossRef] [Green Version]
  7. Bowden, B.B. Climate change in the Arctic—Permafrost, thermokarst, and why they matter to the non-Arctic World. Geogr. Comp. 2010, 4, 1553–1566. [Google Scholar] [CrossRef]
  8. Abaimov, A.P.; Bondarev, A.I.; Zyryanova, O.A.; Shitova, S.A. Lesa Krasnoyarskogo Zapolyar’ya (Forests of Krasnoyarsk Region North of the Arctic Circle); Nauka: Novosibirsk, Russia, 1997; p. 208. [Google Scholar]
  9. Vaganov, E.A.; Hughes, M.K.; Shashkin, A.V. Growth Dynamics of Conifer Tree Rings: Images of Past and Future Environments; Springer: Berlin/Heidelberg, Germany, 2006; p. 353. [Google Scholar]
  10. Boike, J.; Kattenstroth, B.; Abramova, K.; Bornemann, N.; Chetverova, A.; Fedorova, I.; Fröb, K.; Grigoriev, M.; Grüber, M.; Kutzbach, L.; et al. Baseline characteristics of climate, permafrost and land cover from a new permafrost observatory in the Lena Rive Delta, Siberia (1998–2011). Biogeosciences 2013, 10, 2105–2128. [Google Scholar] [CrossRef] [Green Version]
  11. Cable, J.M.; Ogle, K.; Bolton, R.W.; Bolton, W.R.; Bentley, L.P.; Romanovsky, V.; Iwata, H.; Harazono, Y.; Welker, J. Permafrost thaw affects boreal deciduous plant transpiration through increased soil water, deeper thaw and warmer soil. Ecohydrology 2014, 7, 982–997. [Google Scholar] [CrossRef]
  12. Wang, K.; Dickinson, R.E. A review of global terrestrial evapotranspiration: Observation, modeling, climatology, and climatic variability. Rev. Geophys. 2012, 50, 2011RG000373. [Google Scholar] [CrossRef]
  13. Briffa, K.; Schweingruber, F.; Osborn, T.J.; Shiyatov, S.G.; Vaganov, E.A. Reduced sensitivity of recent tree-growth to temperature at Northern high latitudes. Nature 1998, 391, 678–682. [Google Scholar] [CrossRef]
  14. Wilmking, M.; Juday, G.P.; Barber, V.A.; Zald, H.S.J. Recent climate warming forces contrasting growth responses of white spruce at treeline in Alaska through temperature thresholds. Glob. Chang. Biol. 2004, 10, 1724–1736. [Google Scholar] [CrossRef]
  15. D’Arrigo, R.D.; Wilson, R.; Liepert, B.; Cherubini, P. On the ‘Divergence Problem’ in Northern Forests: A review of the tree-ring evidence and possible causes. Glob. Plant. Chang. 2008, 60, 289–305. [Google Scholar] [CrossRef]
  16. Porter, T.J.; Pisaric, M.F.J.; Kokelj, S.V.; deMontigny, P. A ring-width-based reconstruction of June–July minimum temperatures since AD 1245 from white spruce stands in the Mackenzie Delta region, northwestern Canada. Quat. Res. 2013, 80, 167–179. [Google Scholar] [CrossRef] [Green Version]
  17. Barber, V.A.; Juday, G.P.; Finney, B.P. Reduced growth of Alaskan white spruce in the twentieth century from temperature-induced drought stress. Nature 2000, 405, 668–673. [Google Scholar] [CrossRef]
  18. Saurer, M.; Siegwolf, R.; Schweingruber, F.H. Carbon isotope discrimination indicates improving water-use efficiency of trees in northern Eurasia over the last 100 years. Glob. Chang. Biol. 2004, 10, 2109–2121. [Google Scholar] [CrossRef]
  19. Sidorova, O.V.; Siegwolf, R.; Saurer, M.; Shashkin, A.V.; Knorre, A.A.; Prokushkin, A.S.; Vaganov, E.A.; Kirdyanov, A.V. Do centennial tree-ring and stable isotope trends of Larix gmelinii (Rupr.) indicate increasing water shortage in the Siberian north? Oecologia 2009, 161, 825–835. [Google Scholar] [CrossRef] [Green Version]
  20. Sidorova, O.V.; Siegwolf, R.; Saurer, M.; Naurzbaev, M.; Shashkin, A.V.; Vaganov, E.A. Spatial patterns of climatic changes in the Eurasian north reflected in Siberian larch tree-ring parameters and stable isotopes. Glob. Chang. Biol. 2010, 16, 1003–1018. [Google Scholar] [CrossRef] [Green Version]
  21. Gagen, M.; McCarroll, D.; Jalkanen, R.; Loader, N.J.; Robertson, I.; Young, G.H.F. A rapid method for the production of robust millennial length stable isotope tree-ring series for climate reconstruction. Glob. Plant. Chang. 2011, 82–83, 96–103. [Google Scholar] [CrossRef]
  22. Porter, T.J.; Pisaric, M.F.J.; Field, R.D.; Kokelj, S.V.; Edwards, T.W.D.; deMontigny, P.; Healy, R.; LeGrande, A.N. Spring-summer temperatures since AD 1780 reconstructed from stable oxygen isotope ratios in white spruce tree-rings from the Mackenzie Delta, northwestern Canada. Clim. Dyn. 2014, 42, 771–785. [Google Scholar] [CrossRef] [Green Version]
  23. Loader, N.J.; Young, G.H.F.; Grudd, H.; McCarroll, D. Stable carbon isotopes from Torneträsk, norther Sweden provide a millennial length reconstruction of summer sunshine and its relationship to Arctic circulation. Quat. Sci. Rev. 2013, 62, 97–113. [Google Scholar] [CrossRef]
  24. Churakova (Sidorova), O.V.; Corona, C.; Fonti, M.; Guillet, S.; Saurer, M.; Siegwolf, R.T.W.; Stoffel, M.; Vaganov, E.A. Recent atmospheric drying in Siberia is not unprecedented over the last 1500 years. Sci. Rep. 2020, 10, 15024. [Google Scholar]
  25. Churakova (Sidorova), O.V.; Fonti, M.V.; Trushkina, T.V.; Zharkov, M.S.; Taynik, A.V.; Barinov, V.V.; Porter, T.J.; Saurer, M. Hydrogen isotopes in boreal conifers as indicator of extreme hydrological changes. AGU Fall Meet. 2021, 8, 796127. [Google Scholar]
  26. Roden, J.S.; Lin, G.; Ehleringer, J.R. A mechanistic model for interpretation of hydrogen and oxygen isotopic ratios in tree-ring cellulose. Geochim. Cosmochim. Acta 2000, 64, 21–35. [Google Scholar] [CrossRef]
  27. McCarroll, D.; Loader, N.J. Stable isotopes in tree rings. Quat. Sci. Rev. 2004, 23, 771–801. [Google Scholar] [CrossRef]
  28. Mellat, M.; Bailey, H.; Mustonen, K.-R.; Marttila, H.; Klein, E.S.; Gribanov, K.; Bret-Harte, M.S.; Chupakov, A.V.; Divine, D.V.; Else, B.; et al. Hydroclimatic controls on the isotopic (δ18O, δ2H, d-excess) traits of pan-arctic summer rainfall events. Front. Earth Sci. 2021, 9, 651731. [Google Scholar] [CrossRef]
  29. Voelker, S.L.; Brooks, J.R.; Meinzer, F.C.; Roden, J.; Pazdur, A.; Pawelczyk, S.; Hartsough, P.; Snyder, K.; Plavcova, L.; Šantrůček, J. Reconstructing relative humidity from plant δ18O and δD as deuterium deviations from the global meteoric water line. Ecol. Appl. 2014, 24, 960–975. [Google Scholar] [CrossRef]
  30. Kimak, A.; Leuenberger, M. Are carbohydrate storage strategies of trees traceable by early–latewood carbon isotope differences? Trees 2015, 29, 859–870. [Google Scholar] [CrossRef] [Green Version]
  31. Arosio, T.; Ziehmer-Wenz, M.M.; Nicolussi, K.; Schlüchter, C.; Leuenberger, M.C. Investigating masking effects of age trends on the correlations among tree-ring proxies. Forests 2021, 12, 1523. [Google Scholar] [CrossRef]
  32. Lehmann, M.M.; Vitali, V.; Schuler, P.; Leuenberger, M.; Saurer, M. More than climate: Hydrogen isotope ratios in tree rings as novel plant physiological indicator for stress conditions. Dendrochronologia 2021, 65, 125788. [Google Scholar] [CrossRef]
  33. Schuler, P.; Cormier, M.; Werner, R.A.; Buchmann, N.; Gessler, A.; Vitali, V.; Saurer, M.; Lehmann, M.M. A high temperature water vapor equilibration method to determine non-exchangeable hydrogen isotope ratios of sugar, starch, and cellulose. Plant Cell Environ. 2022, 45, 12–22. [Google Scholar] [CrossRef] [PubMed]
  34. Vitali, V.; Martinez-Sancho, E.; Treydte, K.; Andreu-Hayles, L.; Dorado-Linan, I.; Gutierrez, E.; Helle, G.; Leuenberger, M.; Loader, N.J.; Rinne-Garmston, K.T.; et al. The unknown third—Hydrogen isotopes in tree-ring cellulose across Europe. Sci. Total Environ. 2022, 813, 152281. [Google Scholar] [CrossRef] [PubMed]
  35. Gagen, M.; McCarroll, D.; Loader, N.J.; Robertson, I.; Jalkanen, R.; Anchukaitis, K.J. Exorcising the `segment length curse’: Summer temperature reconstruction since AD 1640 using non-detrended stable carbon isotope ratios from pine trees in northern Finland. Holocene 2007, 17, 435–446. [Google Scholar] [CrossRef]
  36. Young, G.H.F.; McCarroll, D.; Loader, N.J.; Gagen, M.H.; Kirchhefer, A.J.; Demmler, J.C. Changes in atmospheric circulation and the Arctic Oscillation preserved within a millennial length reconstruction of summer cloud cover from northern Fennoscandia. Clim. Dyn. 2012, 39, 495–507. [Google Scholar] [CrossRef]
  37. Gagen, M.; Zorita, E.; McCarroll, D.; Zahn, M.; Young, G.; Robertson, I. North Atlantic summer storm tracks over Europe dominated by internal variability over the past millennium. Nat. Geogr. 2016, 9, 630–635. [Google Scholar] [CrossRef]
  38. Helama, S.; Arppe, L.; Timonen, M.; Mielikäinen, K.; Oinonen, M. A 7.5 ka chronology of stable carbon isotopes from tree rings with implications for their use in palaeo-cloud reconstruction. Glob. Plant. Chang. 2018, 170, 20–33. [Google Scholar] [CrossRef]
  39. Churakova (Sidorova), O.V.; Porter, T.J.; Kirdyanov, A.V.; Myglan, V.S.; Fonti, M.V.; Vaganov, E.A. Stable isotopes in tree rings of foreal forests. In Stable Isotopes in Tree Rings. Inferring Physiological, Climatic and Environmental Responses; Siegwolf, R.T.W., Brooks, R., Roden, J., Saurer, M., Eds.; Springer Nature: Berlin, Germany; Switzerland AG: Zürich, Switzerland, 2022; pp. 581–603. ISBN 978-3-030-92697-7. [Google Scholar]
  40. Zharkov, M.S.; Fonti, M.V.; Trushkina, T.V.; Barinov, V.V.; Taynik, A.V.; Porter, T.J.; Saurer, M.; Churakova (Sidorova), O.V. Mixed temperature-Moisture Signal in δ18O Records of Boreal Conifers from the Permafrost Zone. Atmosphere 2021, 12, 1416. [Google Scholar] [CrossRef]
  41. Cook, E.R.; Kairiukstis, L. Methods of Dendrochronology—Applications in the Environmental Sciences; Springer: Dordrecht, The Netherlands, 1990. [Google Scholar]
  42. Gärtner, H.; Nievergelt, D. The core-microtome: A new tool for surface preparation on cores and time series analysis of varying cell parameters. Dendrochronologia 2010, 28, 85–92. [Google Scholar] [CrossRef]
  43. Larsson, L. CooRecorder and Cdendro Programs of the CooRecorder/Cdendro Package Version 7.6. 2013. Available online: http://www.cybis.se/forfun/dendro/ (accessed on 1 November 2021).
  44. Loader, N.J.; Robertson, I.; Barker, A.C.; Switsur, V.R.; Waterhouse, J.S. An improved technique for the batch processing of small whole wood samples to α-cellulose. Chem. Geol. 1997, 136, 313–317. [Google Scholar] [CrossRef]
  45. Francey, R.J.; Allison, C.E.; Etheridge, D.M.; Trudinger, C.M.; Enting, I.G.; Leuenberger, M.; Langenfelds, R.L.; Michel, E.; Steele, L.P. A 1000-year high precision record of δ13C in atmospheric CO2. Tellus 1999, 51, 170–193. [Google Scholar] [CrossRef] [Green Version]
  46. Hangartner, S.; Kress, A.; Saurer, M.; Frank, D.; Leuenberger, M. Methods to merge overlapping tree-ring isotope series to generate multi-centennial chronologies. Chem. Geol. 2012, 294–295, 127–134. [Google Scholar] [CrossRef]
  47. Harris, I.; Osborn, T.J.; Jones, P.; Lister, D. Version 4 of the CRU TS monthly high-resolution gridded multivariate climate dataset. Sci. Data 2020, 7, 109. [Google Scholar] [CrossRef] [PubMed] [Green Version]
  48. Spahni, R.; Joos, F.; Stocker, B.D.; Steinacher, M.; Yu, Z.C. Transient simulations of the carbon and nitrogen dynamics in northern peatlands: From the Last Glacial Maximum to the 21st century. Clim. Past 2013, 9, 1287–1308. [Google Scholar] [CrossRef] [Green Version]
  49. Stocker, B.D.; Roth, R.; Joos, F.; Spahni, R.; Steinacher, M.; Zaehle, S.; Bouwman, L.; Xu, R.; Prentice , I.C. Multiple greenhouse-gas feedbacks from the land biosphere under future climate change scenarios. Nat. Clim. Chang. 2013, 3, 666–672. [Google Scholar] [CrossRef]
  50. Churakova (Sidorova), O.V.; Shashkin, A.V.; Siegwolf, R.; Spahni, R.; Launois, T.; Saurer, M.; Bryukhanova, M.V.; Benkova, A.V.; Kupzova, A.V.; Vaganov, E.A.; et al. Application of eco-physiological models to the climatic interpretation of δ13C and δ18O measured in Siberian larch tree-rings. Dendrochronology 2016, 39, 51–59. [Google Scholar] [CrossRef]
  51. Wania, R.; Ross, I.; Prentice, I.C. Integrating peatlands and permafrost into a dynamic global vegetation model: 1. Evaluation and sensitivity of physical land-surface processes. Glob. Biogeochem. Cycle 2009, 23, GB3014. [Google Scholar] [CrossRef] [Green Version]
  52. Sitch, S.; Smith, B.; Prentice, I.C.; Arneth, A.; Bondeau, A.; Cramer, W.; Kaplan, J.O.; Levis, S.; Lucht, W.; Sykes, M.T.; et al. Evaluation of ecosystem dynamics, plant geography and terrestrial carbon cycling in the LPJ dynamic global vegetation model. Glob. Chang. Biol. 2003, 9, 161–185. [Google Scholar] [CrossRef]
  53. Fyodorov-Davydov, D.G.; Kholodov, V.E.; Kraev, G.N.; Sorokovikov, V.A.; Davydov, S.P.; Merekalova, A.A. Seasonal thaw of soils in the North Yakutianecosystems. In Proceedings of the V International Conference on Cryopedology Diversity of Forest Affected Soils and Their Role in Ecosystems, At Ulan-Ude, Buryatia, Russia, 14–20 September 2009.
  54. Keel, S.; Joos, F.; Spahni, R.; Saurer, M.; Weigt, R.B.; Klesse, S. Simulating oxygen isotope ratios in tree-ring cellulose using a dynamic global vegetation model. Biogeosciences 2016, 13, 3869–3886. [Google Scholar] [CrossRef] [Green Version]
  55. Churakova (Sidorova), O.V.; Siegwolf, R.T.W.; Saurer, M. Role of sunshine duration for subarctic larch trees. in preparation.
  56. Jasechko, S.; Sharp, Z.D.; Gibson, J.J.; Birks, S.J.; Yi, Y.; Fawcett, P.J. Terrestrial water fluxes dominated by transpiration. Nature 2013, 496, 347–350. [Google Scholar] [CrossRef]
  57. Kirdyanov, A.V.; Saurer, M.; Siegwolf, R.; Knorre, A.A.; Prokushkin, A.S.; Churakova (Sidorova), O.V.; Fonti, M.V.; Büntgen, U. Long-term ecological consequences of forest fires in the continuous permafrost zone of Siberia. Environ. Res. Lett. 2020, 15, 034061. [Google Scholar] [CrossRef]
  58. Knorre, A.A.; Kirdyanov, A.V.; Vaganov, E.A. Climatically-induced inter-annual variation in aboveground biomass productivity in the forest-tundra and northern taiga of central Siberia. Oecologia 2006, 147, 86–95. [Google Scholar] [CrossRef] [PubMed]
  59. Sidorova, O.V.; Siegwolf, R.; Saurer, M.; Naurzbaev, M.M.; Vaganov, E.A. Isotopic composition (δ13C, δ18O) in Siberian tree-ring chronology. Geophys. Res. Biogeosciences 2008, 113, G02019. [Google Scholar]
  60. Saurer, M.M.; Kirdyanov, A.V.; Prokushkin, A.S.; Rinne, K.T.; Siegwolf, R.T.W. The impact of an inverse climate-isotope relationship in soil water on the oxygen-isotope composition of Larix gmelinii in Siberia. New Phytol. 2016, 209, 955–964. [Google Scholar] [CrossRef]
  61. Fedorov-Davydov, D.G.; Davydov, S.P.; Davydova, A.I.; Ostroumov, V.E.; Kholodov, A.L.; Sorokovikov, V.A.; Shmelev, D.G. The temperature regime of soils in northern Yakutia. Kriosfera Zemli 2018, 22, 12–19. [Google Scholar]
  62. Bowman, D.M.; Kolden, C.A.; Abatzoglou, J.T.; Johnston, F.H.; van der Werf, G.R.; Flannigan, M. Vegetation fires in the Anthropocene. Nat. Rev. Earth Environ. 2020, 1, 500–515. [Google Scholar] [CrossRef]
Figure 1. Map with the location of study sites in the Siberian subarctic Taimyr Peninsula (TAY, red star) and Yakutia (YAK, light blue star) in the zone of continuous permafrost. Map is modified after Churakova (Sidorova) et al. [39] (a). Modelled continuous and discontinuous permafrost zone distribution is marked in violet and light violet, respectively. Distribution of monthly air temperature and precipitation (b), and sunshine duration versus vapour pressure deficit (VPD) (c) obtained from the local Khatanga (TAY), Chokurdakh and Deputatsky (YAK) in comparison. Photos of trees from the study sites: Taimyr Peninsula (TAY) Kotuy (d,e), photos Alexander I. Bondarev; northeastern Yakutia (YAK), photo Mukhtar M. Naurzbaev (f) and Deputatsky, photo Alberto Arzac (g).
Forests 13 00934 g001
Figure 2. Stable hydrogen (δ2H) (ag), oxygen (δ18O) (ci) and carbon (δ13C) (ek) isotope chronologies and normalised (z-score) data (b,d,f,h,j,l) obtained from Kotuy, Taimyr (TAY), and Deputatsky, Yakutia (YAK), during the period from 1990–2020 and 1990–2021, respectively. Newly added (red) and normalised data obtained in comparison with earlier published data (black) stable isotope chronologies in tree-ring cellulose obtained from Kotuy, Taimyr (TAY), for the period from 1900 to 2009 [24] and from Indigirka, northeastern Yakutia (YAK), from 1900 to 2004 [20,25].
Forests 13 00934 g002aForests 13 00934 g002b
Figure 3. Pearson correlation coefficients calculated between stable carbon (δ13C) (a,d), oxygen (δ18O) (b,e) and hydrogen (δ2H) (c,f) isotopes in tree-ring cellulose versus air temperature (Temp), precipitation (Prec), vapour pressure deficit (VPD), sunshine duration (S) and relative humidity (RH) calculated from September of the previous year to August the current one for the period from 1951 to 2020, based on data from the Deputatsky weather station for YAK (ac) and from the Khatanga weather station for TAY (df). Significant values at p < 0.05 are marked as a rhombus.
Forests 13 00934 g003aForests 13 00934 g003b
Figure 4. Measured δ2H from YAK (this study) versus modelled water fraction at different permafrost thaw depths, 0–20 and 20–30 cm [50].
Forests 13 00934 g004
Figure 5. Spatial distribution of correlation coefficients between modelled water fraction of permafrost thaw depth at 20–30 cm from Yakutia (69° N−148° E) for the period from 1948 to 2004 and differences between maximum and minimum values (Tmax–Tmin) of averaged April–June air temperature (a), September air temperature (b) and April–June potential evapotranspiration (c). Correlation coefficients (r) are presented from negative −0.6 (violet) to positive 0.6 (red) at the p-value < 0.01.
Forests 13 00934 g005aForests 13 00934 g005b
Table 1. Mean, standard deviation (SD), minimum (min) and maximum (max) values calculated for newly developed tree-ring δ2H, δ18O and δ13C chronologies from merged and averaged YAK and TAY datasets for the periods from 1951 to 2020 and from 1900 to 2020.
TAY YAK
PeriodParameterδ2Hδ18Oδ13Cδ2Hδ18Oδ13C
1951–2020Mean−150.923.3−23.9−176.518.9−24.2
SD8.70.70.85.70.60.7
Min−174.519.6−25.8−189.917.8−25.8
Max−130.222.8−21.7−166.720.5−22.3
1900–2020Mean−150.821.2−23.9−171.418.9−24.2
SD7.50.70.810.10.60.7
Min−174.519.6−25.9−189.917.8−25.8
Max−130.222.8−21.7−145.320.5−22.3
Publisher’s Note: MDPI stays neutral with regard to jurisdictional claims in published maps and institutional affiliations.

