Article

SNP Detection in Pinus pinaster Transcriptome and Association with Resistance to Pinewood Nematode

1
Instituto de Tecnologia Química e Biológica António Xavier, Universidade Nova de Lisboa, Av. da República, 2780-157 Oeiras, Portugal
2
Instituto de Biologia Experimental e Tecnológica, Avenida da República, Estação Agronómica, 2780-157 Oeiras, Portugal
3
Department of Plant Biotechnology and Bioinformatics, Ghent University, Technologiepark 71, 9052 Ghent, Belgium
4
Biosystems & Integrative Sciences Institute, Faculdade de Ciências, Universidade de Lisboa, Campo Grande 016, 1749-016 Lisboa, Portugal
5
Department of Chromosome Biology, Max Planck Institute for Plant Breeding Research, Carl-von-Linne-Weg 10, 50829 Cologne, Germany
6
Instituto Nacional de Investigação Agrária e Veterinária, Av. da República, Quinta do Marquês, 2780-157 Oeiras, Portugal
7
LEAF—Linking Landscape, Environment, Agriculture and Food, Instituto Superior de Agronomia, Universidade de Lisboa, Tapada da Ajuda, 1349-017 Lisboa, Portugal
8
VIB-UGent Center for Plant Systems Biology, Technologiepark 71, 9052 Ghent, Belgium
9
Department of Biochemistry, Genetics and Microbiology, University of Pretoria, Private Bag x 20, Hatfield, Pretoria 0028, South Africa
10
College of Horticulture, Academy for Advanced Interdisciplinary Studies, Nanjing Agricultural University, Nanjing 210095, China
*
Author to whom correspondence should be addressed.
Submission received: 10 May 2022 / Revised: 10 June 2022 / Accepted: 14 June 2022 / Published: 17 June 2022

Abstract

:
Pinewood nematode (PWN, Bursaphelenchus xylophilus) is the causal agent of pine wilt disease (PWD), which severely affects Pinus pinaster stands in southwestern Europe. Despite the high susceptibility of P. pinaster, individuals of selected half-sib families have shown genetic variability in survival after PWN inoculation, indicating that breeding for resistance can be a valuable strategy to control PWD. In this work, RNA-seq data from susceptible and resistant plants inoculated with PWN were used for SNP discovery and analysis. A total of 186,506 SNPs were identified, of which 31 were highly differentiated between resistant and susceptible plants, including SNPs in genes involved in cell wall lignification, a process previously linked to PWN resistance. Fifteen of these SNPs were selected for validation through Sanger sequencing and 14 were validated. To evaluate SNP-phenotype associations, 40 half-sib plants were genotyped for six validated SNPs. Associations with phenotype after PWN inoculation were found for two SNPs in two different genes (MEE12 and PCMP-E91), as well as two haplotypes of HIPP41, although significance was not maintained following Bonferroni correction. SNPs here detected may be useful for the development of molecular markers for PWD resistance and should be further investigated in future association studies.

1. Introduction

Pine wilt disease (PWD) is a worldwide threat to conifer trees that has been spreading through Eastern Asia and most recently in Europe [1]. In these regions, several pine species are highly susceptible to PWD, and large areas of forest can be severely affected. PWD is caused by the migratory plant-parasitic nematode Bursaphelenchus xylophilus, or pinewood nematode (PWN), which is disseminated by the insect vector Monochamus spp. [2,3]. This nematode spreads through the resin canals in the tree’s stem, feeding on plant cells and destroying the plant tissues, finally disrupting water transport and causing the wilting of the tree [2,3]. In the Iberian Peninsula, PWN was first detected in the late 1990s [4] and, in this region, maritime pine (Pinus pinaster) is the most affected species.
Pinus pinaster is naturally distributed in the western Mediterranean Basin [5], where natural stands are of great importance for coastal protection and wildlife habitat. Pinus pinaster has also been widely planted for industrial exploitation and is mainly used for paper, wood, and resin production. Due to its ecological and economic relevance, the loss of P. pinaster trees in Iberian forests has a major impact on the local environment and economy [1,2].
Despite PWD being an introduced disease, P. pinaster individuals show variable degrees of susceptibility once infected [6,7,8]. Two independent studies with large numbers of half-sibling families revealed that survival after PWN inoculation is a heritable trait (heritability of 0.37–0.59) [6,7], opening the possibilities for tree breeding for PWN resistance, as it has been implemented for other pine species [9,10,11].
The development of molecular markers for the phenotype of interest is an important step to expedite breeding programs, by allowing for the selection of trees at an early age or to select parent trees from natural stands [12,13]. However, association studies aiming at identifying such molecular markers for resistance to PWD are scarce [14] and, to the best of our knowledge, not yet available for P. pinaster. Being a quantitative trait, resistance to PWD is likely to have a highly polygenic basis, with many loci having small effects on the phenotype.
With the rise of next generation sequencing, the developing of molecular markers has become easier and more affordable, even for non-model species [12]. RNA-seq is one of these technologies that has been frequently used for the discovery of molecular markers, such as single nucleotide polymorphisms (SNPs) and simple-sequence repeats (SSRs) [15,16,17]. As RNA-seq produces information mainly on protein coding regions, polymorphisms associated with phenotype are more easily linked to a functional effect. Therefore, RNA-seq provides an efficient approach to identifying a large number of gene-based molecular markers and functional gene variants associated with phenotypic traits in non-model species [15,18].
In this work, we aimed at finding molecular markers for PWD resistance by identifying SNPs in genes expressed during P. pinaster defence response to PWN. We used RNA-seq data available from PWN inoculated susceptible and resistant plants from a half-sib family previously described [6,19] for SNP discovery. More than 186K SNPs were identified for the half-sib family 440. The divergence between susceptible and resistant groups of samples was analysed and outliers were identified. To evaluate the SNP dataset, 15 SNPs were selected for validation through Sanger sequencing. Six of the validated SNPs were then genotyped for a larger sample of the half-sib family 440 and their association with phenotype was tested. A set of candidate genes for P. pinaster resistance to PWD was highlighted in this work. The SNPs here detected can be a valuable resource for future association studies focusing on resistance to PWD or to other pine diseases and pests.

2. Materials and Methods

2.1. Plant Material

The P. pinaster half-sibling family 440 was selected for the inoculation assays [6,19,20]. This family had been previously evaluated regarding the genetic effects on survival after PWN inoculation of 2-year-old plants and had a predicted survival mean of 15% (in a range of 6–23%) [6]. Seeds were collected from the mother tree 440, belonging to a reference population for PWD resistance [21] located in the south of Portugal (“Herdade da Comporta”, 38°21′28.52″ N, 8°45′49.89″ W). Plants germinated from these seeds were maintained in 4L pots in a greenhouse and placed according to a completely randomized experimental design.

2.2. PWN Inoculum

Bursaphelenchus xylophilus isolate Bx013.003 from INIAV’s Nematology Laboratory collection (Oeiras, Portugal) [6,19,22] was obtained from a wild population infecting a P. pinaster adult tree in central Portugal (39°43′33.8″ N, 9°01′55.7″ W). The sequence of the ITS region of this isolate is available at NCBI GenBank (ref. MF611984.1). PWNs were reproduced in flasks containing a non-sporulating Botrytis cinerea strain grown on autoclaved barley grains, at 25 ± 1 °C. Prior to inoculations, the isolate was allowed to grow on sterilized wood to maintain virulence. Finally PWNs were extracted from the wood using the “tray” method [23] and suspended in water at a calibrated concentration of 2000 PWN/mL.

2.3. Inoculation Assays and Sample Collection

For SNP discovery, RNA-seq data were generated from plant samples collected in a previously performed inoculation assay as described by Modesto et al. [19]. In short, 4-year-old plants were inoculated with PWN and samples from the stem were collected 72 h post inoculation (hpi). Symptoms were evaluated weekly for 210 days and classified on a scale of 0 to 4, based on the percentage of needles presenting wilting or discoloration symptoms (0—absence of symptoms; 1—1 to 25%; 2—26 to 50%; 3—51 to 75%; 4—76 to 100%). Four susceptible plants (level 4 in the symptoms scale) and five resistant plants (level 0) were sequenced through Illumina HiSeq 2500.
For the genotyping of validated SNPs in a larger sample through Sanger sequencing, 90 three-year-old plants of the half-sibling family 440 were inoculated (September 2019) with a suspension of 1000 PWNs, following the method of Futai and Furuno [24], as described in Modesto et al. [19]. The inoculum was pipetted into a small longitudinal wound made in the main stem with a sterile scalpel below the apical shoot region. After inoculation, symptoms were observed weekly for 273 days post-inoculation (dpi) and registered according to the scale (0–4) used before. Plants with symptoms (levels 1 to 4) were considered susceptible, while plants without any symptoms (level 0), by the end of the observation time, were classified as resistant. Needle samples were collected prior to inoculations and stored at −80 °C.
The height and diameter at the base of the stem were measured for all plants before the inoculation assay, and significant differences between susceptible and resistant plants were evaluated with a two-sample unpaired t-test using R v4.1.0 (https://www.r-project.org, accessed on 26 June 2021).

2.4. RNA-Seq

RNA-seq data used for this work are available at the public database European Nucleotide Archive (ENA) at EMBL EBI under the accession number PRJEB26836 [19]. The quality of these data was evaluated with FastQC v0.11.2 [25]. As a reference, the P. pinaster transcriptome described in Cañas et al. [26], was used, together with 34,737 new transcripts assembled from data originating in P. pinaster samples inoculated with PWN [19]. Reads were mapped to P. pinaster and PWN transcriptomes [27] using BWA alignment software v0.7.17 (BWA-MEM) [28]. Mapping results were filtered to keep only uniquely mapped reads with SAMtools v1.6 [29]. Pinus pinaster and PWN mapping results were separated in two different files and only P. pinaster data was used for subsequent analysis.

2.5. SNP Calling and Analysis

SNP calling was performed using GATK v3.7.0 [30,31] according to the software best practices for RNA-seq short variant discovery. SNPs with missing information for more than two samples were excluded and called variants were filtered using GATK hard filters (FS > 30.0, QD < 2.0, SB < −10.0, MQ < 58.0). These filters were adjusted by comparing our SNP data with an Illumina Infinium SNP array previously designed for P. pinaster [16], aiming at obtaining good quality variants without excluding many SNPs present in both datasets. SNPs detected both in our data and in the SNP array were considered true SNPs. Filtered SNPs were functionally annotated using SnpEff v4.3t [32].
Minor allele frequencies (MAF), nucleotide diversity (π) and Tajima’s D were calculated using VCFtools v0.1.16 [33]. For π and Tajima’s D, a sliding window of 200 bp was used for the calculations. Genetic differentiation (FST) was estimated between susceptible and resistant groups of samples using the same software and a sliding window of 200 bp.

2.6. SNP Validation

Thirty-one SNPs presenting high differentiation between susceptible and resistant groups (FST ≥ 0.8) were selected for validation through Sanger sequencing. Primers were designed for the 26 genes containing these SNPs (Supplementary Table S1) using PerlPrimer v1.1.21 [34] and NCBI Primer-BLAST (accessed in January 2020). For one of the genes, it was not possible to design primers to amplify the region containing the SNP.
DNA was extracted from the needles of the same samples used for RNA-seq using the CTAB method [35] with minor modifications: 1% PVP-40 in the extraction buffer, no ammonium acetate in the washing buffer, and 0.1 vol. 3M sodium acetate in the final DNA precipitation. The DNA was amplified with GoTaq DNA Polymerase (Promega) according to the manufacturer’s recommendations and using optimized annealing temperatures (Supplementary Table S1). Amplified gene fragments were purified using SureClean (Bioline) (directly) or High Pure PCR purification kit (Roche) (from 1% agarose gel) and sequenced on an ABI 3730xl (Macrogen, Spain). The obtained sequences were checked and aligned on ChromasPro v2.1.9 (Technelysium) and the presence or absence of the SNPs was confirmed.

2.7. SNP Genotyping and Sequence Analysis

Genotyping of a larger sample was performed for six genes containing validated SNPs (Supplementary Table S1). For this, 40 samples from the inoculation assay described above were used. The first 20 samples reaching level 4 in the symptoms scale were selected as susceptible plants for genotyping, while 20 random healthy plants (level 0) were selected as resistant plants. DNA was extracted and amplified as described above (Supplementary Table S1). PCR products were purified using SureClean and sequenced on an ABI 3730xl (Macrogen, Spain). The obtained sequences were checked and aligned on ChromasPro v2.1.9 and all SNPs in each gene fragment were identified. Sequences were deposited in the European Nucleotide Archive (ENA) at EMBL EBI under accession number PRJEB51636.
Sequences were aligned with ClustalW [36] for each gene. For sequences with heterozygous SNPs, the haplotypes were reconstructed using PHASE v2.1.1 [37,38]. Nucleotide diversity (π), diversity at nonsynonymous sites (πN), diversity at synonymous sites (πS), haplotype diversity (H), and Tajima’s D neutrality test were estimated with DnaSP v6.12.03 [39] for each gene.

2.8. Association Analysis

Association analysis was performed using the R package SNPassoc v2.0-11 [40] in R. Genotyping data were filtered to exclude SNPs with a minor allele frequency below 0.05 and SNPs outside of Hardy–Weinberg equilibrium (p ≤ 0.001). Logistic regression was performed to assess the association between SNPs or haplotypes and phenotypes, considering resistance as case (1) and susceptibility as control (0). Diameter at the base of the stem and plant height were included as covariates, as they were shown before to influence the plant outcome after PWN inoculation [6]. The null hypothesis (absence of association) was rejected at a 5% significance level. The Bonferroni method was used to correct the statistical threshold.

3. Results

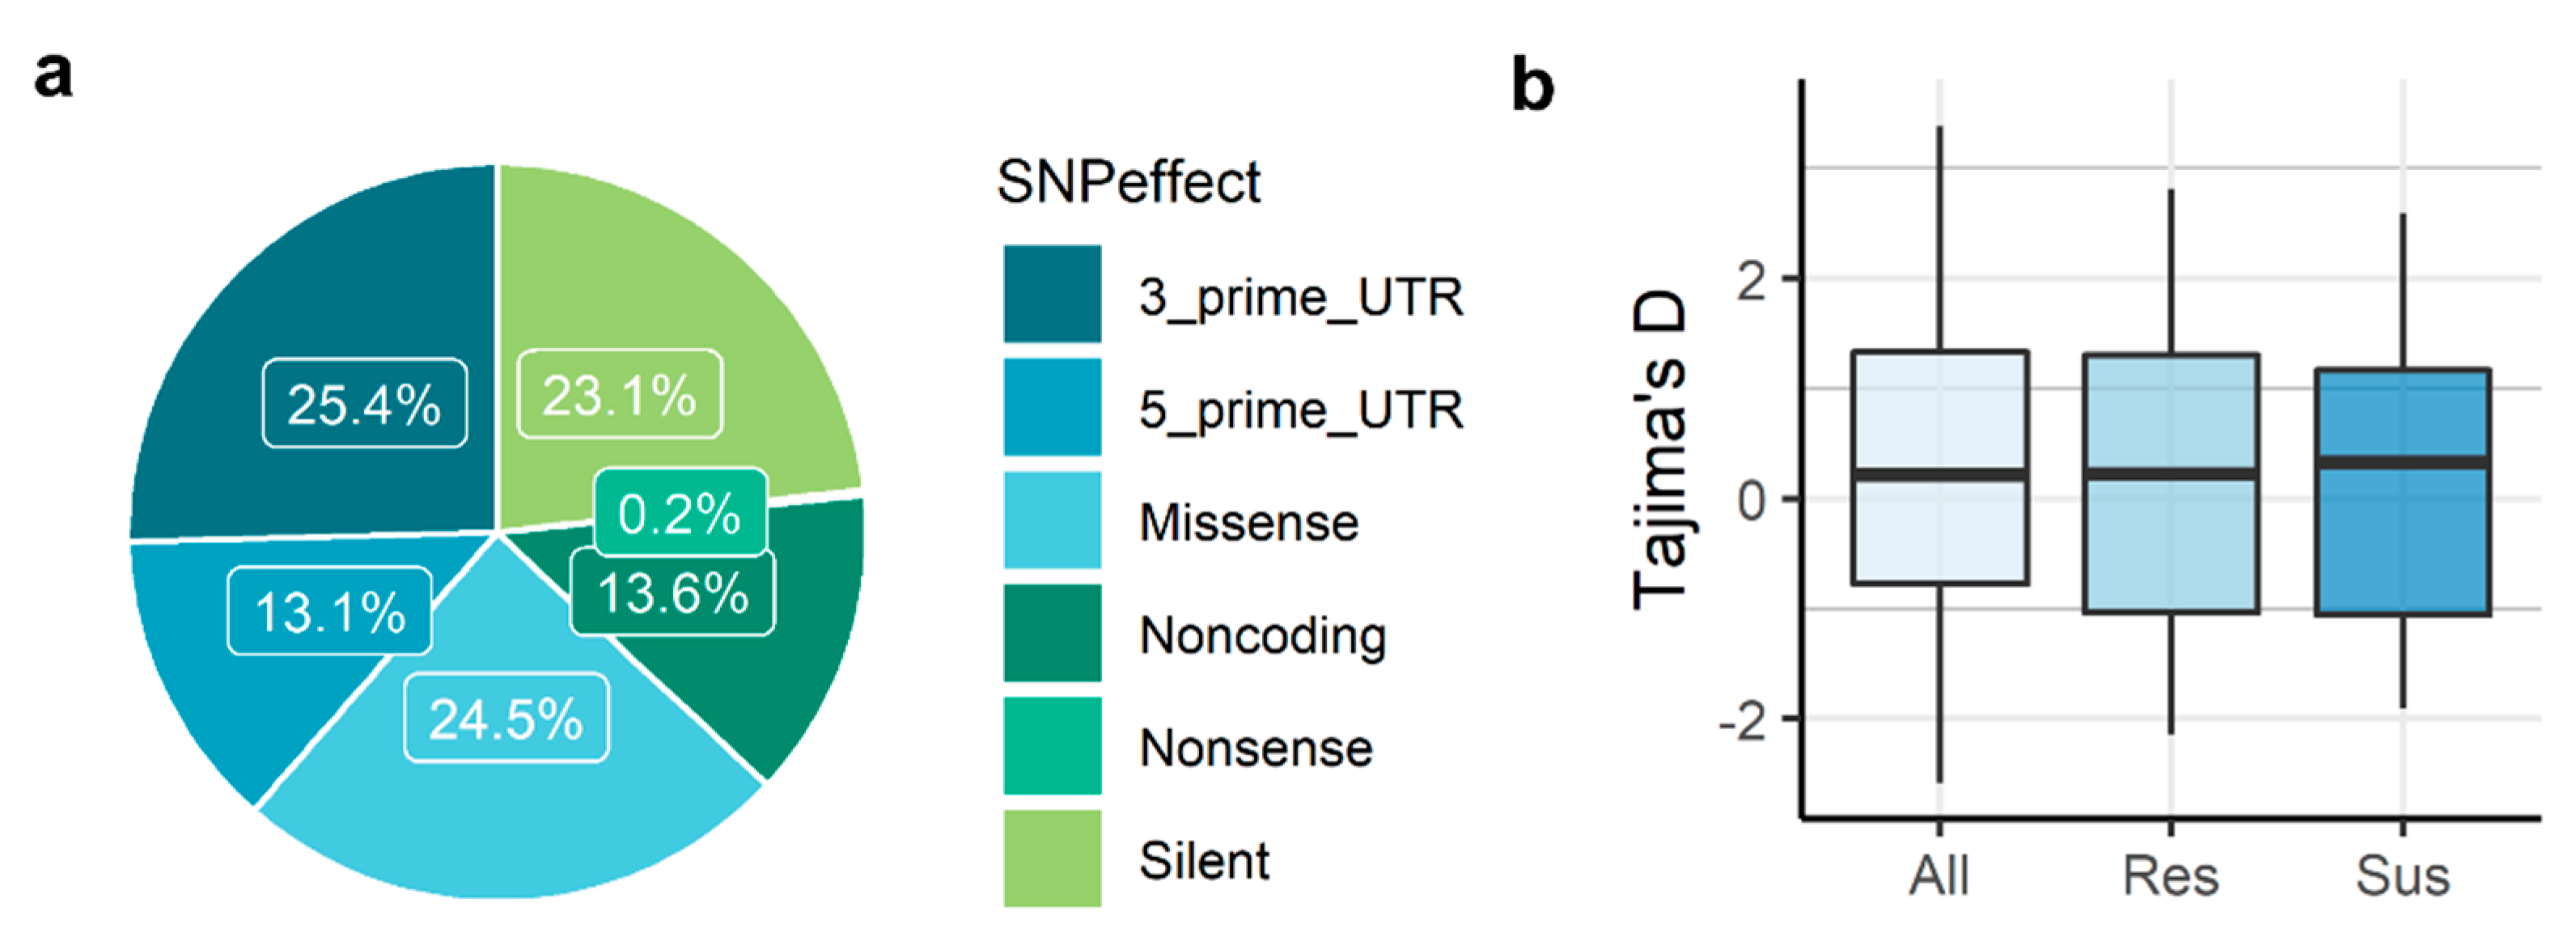
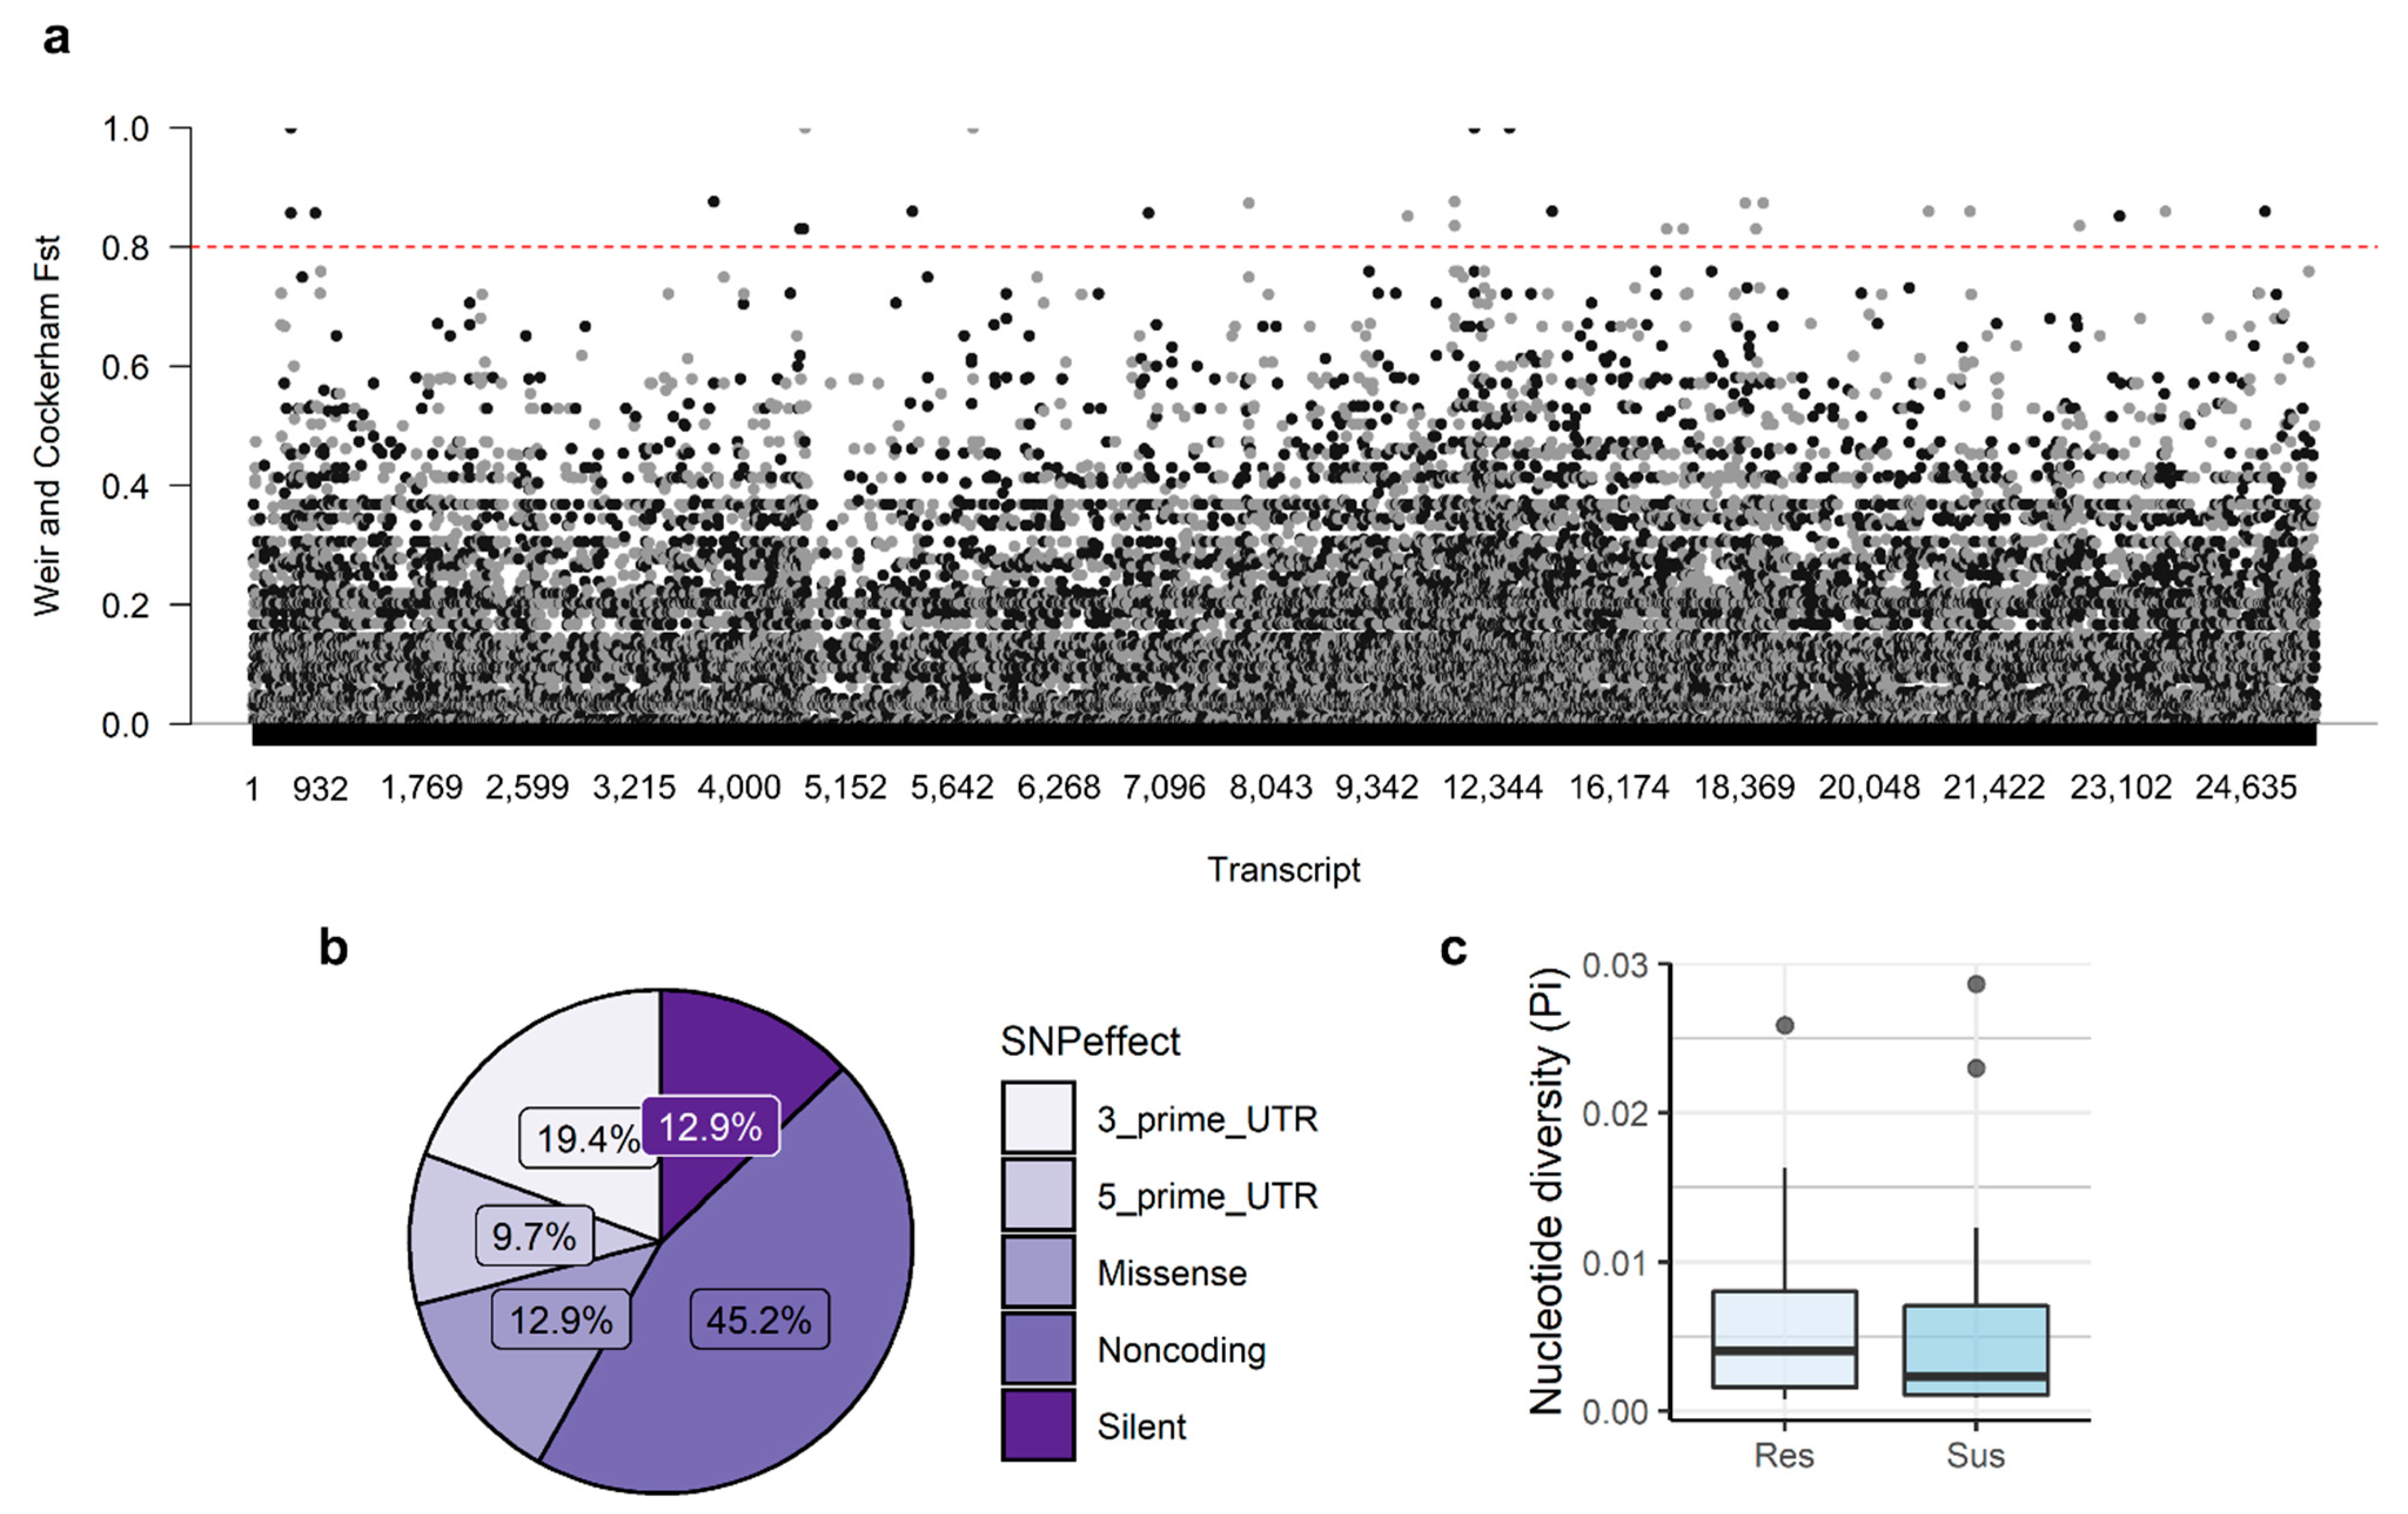
3.1. RNA-Seq, SNP Discovery and SNP Annotation

To identify SNPs primarily in P. pinaster coding genes, RNA-seq data available for a set of nine P. pinaster samples were used [19]. These data were generated during a previous gene expression study, where plants were inoculated with PWN and stem samples were collected at 72 hpi. Five resistant plants and four susceptible plants were sequenced by RNA-seq. A detailed description of the symptom’s progression can be found in Modesto et al. [19].
After quality control and read filtering, 17–20 million reads were obtained per sample, with sizes ranging between 70–125 bp. An average mapping ratio of 97.8% (±0.1) was obtained, from which 57.8% (±0.8) were uniquely mapped (Supplementary Table S2). From these, 99.3% (±0.4) of the reads were mapped to P. pinaster transcriptome, while 0.7% (±0.4) were mapped to PWN transcriptome. Only the reads uniquely mapped to P. pinaster were kept for SNP discovery.
For the nine samples analysed, it was possible to identify a total of 414,443 SNPs before applying any filter, from which 2,569 SNPs were also present in an Illumina SNP array developed for P. pinaster [16]. After filtering this dataset in order to exclude low quality SNPs (see Materials and Methods), 186,506 SNPs were retained (Supplementary Table S3), including 2,297 SNPs that were previously reported [16]. Most of these SNPs corresponded to transitions (58.4%) (Supplementary Figure S1), with a transition/transversion ratio (Ts/Tv) of 1.41, similar to what was previously observed for P. pinaster (59.3% transitions and 1.46 Ts/Tv ratio) [16]. Ts/Tv ratio was similar in susceptible and resistant groups of samples (Table 1).
Most of the SNPs (86.4%) were detected in transcripts with a predicted protein-coding sequence (CDS), while the remaining (13.6%) were located in transcripts without a predicted CDS that were considered noncoding (Figure 1a). From the SNPs comprised in coding regions, 52,121 (52%) were classified as nonsynonymous, resulting in amino acid changes (missense SNP) or premature stop codons (nonsense SNP).

3.2. Genetic Diversity and Differentiation

The 186,506 SNPs identified were located in 25,857 transcripts, in an average of one SNP every 192 bp. From these SNPs, 18,997 were singletons, existing in only one sample. Minor allele frequencies were similar between susceptible (MAF = 0.30 ± 0.14) and resistant (MAF = 0.29 ± 0.14) groups of individuals (Table 1), as well as the mean nucleotide diversity values (π = 0.0034 ± 0.0395 for susceptible samples; π = 0.0033 ± 0.0378 for resistant samples). Tajima’s D median values were close to zero, showing no indication of population decline or population expansion (Figure 1b).
Genetic differentiation between susceptible and resistant groups was very low (FST = 0.00 ± 0.12), as expected for samples of the same half-sib family. However, several SNPs presented high differentiation between groups, including 31 SNPs with an FST above 0.80 (Figure 2a, Supplementary Table S4), and may be associated with the observed phenotypes. These SNPs were located in 26 transcripts and included 14 SNPs found in transcripts with no predicted CDS, four synonymous, and four nonsynonymous SNPs (Figure 2b). The remaining were located in the 3′-untranslated regions (UTRs; six) or 5′-UTRs (three). Median nucleotide diversity (π) of the regions containing these SNPs was higher in resistant samples (π = 0.0041) than in susceptible plants (π = 0.0023) (Figure 2c).
Within the transcripts containing SNPs with FST ≥ 0.80, it was possible to identify two genes that may be involved in lignin biosynthesis (peroxidase 31 and laccase-3), a gene involved in the synthesis of phenolic compounds (UGT5), a probable resistance gene (isotig35427), and a Myb transcription factor (isotig42428) (Supplementary Table S4). However, 12 transcripts have unknown function (five) or were not annotated (seven).

3.3. SNP Validation through Sanger Sequencing

SNPs with high differentiation (FST ≥ 0.8) between resistant and susceptible groups of samples were selected for validation. For 14 out of 26 transcripts comprising these SNPs, it was not possible to design primers to amplify a fragment including the SNPs (one) or the amplifications failed (13). Therefore, 12 transcripts comprising 15 SNPs were sequenced and the presence or absence of these SNPs was observed (Table 2). Fourteen of these SNPs were validated (93%), while one was not (7%) (Table 2). However, the genotype was miscalled in the RNA-seq analysis for two of the validated SNPs, for at least one of the sequenced samples (Table 2), giving a rate of 80% of validated and correctly genotyped SNPs.
On the other hand, it was possible to detect 12 more SNPs by Sanger sequencing than previously detected by the RNA-seq analysis. Ten of these SNPs were excluded by the hard filters applied in the RNA-seq data analysis, with four being excluded by the mapping quality (MQ) filter and six SNPs located in regions without read coverage in more than two samples. The two remaining SNPs were not detected in the RNA-seq analysis, probably due to low depth coverage (one to eight reads) of the regions where the SNPs were located in all samples.

3.4. Inoculation Assay, Genotyping, and Sequence Analysis

To assess if there is an association between the validated SNPs and the plants’ phenotypes in a larger dataset, the genotyping of six gene fragments (Table 3) was performed for 40 individuals (20 resistant and 20 susceptible). To do this, a new inoculation assay was performed with 3-year-old plants from the half-sib family 440, the same used for the RNA-seq. The first symptoms appeared at 14 dpi and progressed gradually until the end of the experiment (Figure 3). At 273 dpi, 48% of the plants presented symptoms, while 52% remained healthy. No significant differences were found in height and diameter at the base of the stem between resistant and susceptible groups of plants (Supplementary Figure S2).
The sequenced fragments included coding (exons) and noncoding (introns, 3′-UTR, and 5′-UTR) regions (Table 3) in a total of 2359 bp. These fragments contained 20 SNPs, including the six previously validated. Seven of these SNPs were synonymous, seven were nonsynonymous, and six were in noncoding regions. Nucleotide diversity (π) ranged between 0.00091 (KIN12) and 0.00984 (PCMP-E91), being similar between susceptible and resistant groups, with the exception of PCMP-E91 and KIN12, for which susceptible plants presented higher values. For PCMP-E91, nucleotide diversity at nonsynonymous sites (πN) was higher than nucleotide diversity at synonymous sites (πS) (Table 3).
The neutrality test Tajima’s D rejected the null neutral model for PHR1 in the resistant group and for UGT5 (Table 3). In both cases, D values were positive, indicating an excess of intermediate frequency alleles consistent with balancing selection or population decline.

3.5. Association Analysis

Association analysis between single SNPs and the phenotype was performed after excluding SNPs with a minor allele frequency below 0.05 (six) and SNPs outside of the Hardy–Weinberg equilibrium (two) (Supplementary Table S5). The association analysis for each SNP and genetic model is represented in Supplementary Figure S3.
MEE12 SNP 197 showed a significant association with the phenotype (Table 4), both before (p = 0.0244 for the dominant model and p = 0.0222 for the additive model) and after adjusting for diameter at the basis of the stem and plant height [6] (p = 0.0168 for the dominant model and p = 0.0109 for the additive model). For this SNP, the genotypes A/C and C/C were associated with a higher chance of being resistant to PWN inoculation, while A/A genotype seems to be associated with susceptibility in both additive and dominant models (Table 4, Supplementary Figure S4). PCMP-E91 SNP 178 was also significantly associated with the phenotype for the recessive model, with both non-adjusted (p = 0.0295) and adjusted (p = 0.0074) statistical tests. For this gene, the genotype G/G was associated with an increased probability of being susceptible (Table 4, Supplementary Figure S4). These association results were not significant after Bonferroni correction.
Association analyses were also performed between haplotypes and phenotypes for each gene (Table 5, Supplementary Table S6). Two haplotypes of the gene HIPP41 were significantly associated with susceptibility (haplotype 3, p = 0.0263, and haplotype 4, p = 0.0441) (Table 5). However, these association results were not significant after Bonferroni correction.

4. Discussion

In this work, we used previously published transcriptomics data of P. pinaster plants inoculated with PWN for SNP detection. This strategy allowed for the identification of SNPs in genes expressed during PWN infection that may be associated with PWD resistance. As P. pinaster genome is quite large (24.5 Gb) [42], the detection of SNPs at the genome level can be difficult and expensive. The use of RNA-seq data provided a more targeted and efficient way of detecting SNPs in candidate genes for the trait of interest [15,17,18]. SNPs here detected may not directly affect the phenotype after inoculation, but rather be physically linked to causal variants that are not detectable with the method used, such as variants in regulating regions or structural variants.
Although genomic resources for conifer species are usually limited, an Illumina Infinium SNP array comprising 8,410 SNPs was previously developed for P. pinaster [16]. However, this array had an extremely limited number of SNPs in candidate genes for biotic stress response (53 transcripts). Furthermore, this SNP array was never tested for the reference population for PWD resistance [6,21], from which the half-sib family used in this study originated (Comporta, Portugal). This population may present distinct variants from the ones previously studied with the SNP array [16,43]. In fact, only a very low percentage (1.3%) of the 186,506 SNPs detected here was present in the SNP array, corresponding to only 2,297 SNPs (or 2,569 before filtering) in common. None of the SNPs with high Fst values between resistant and susceptible plants identified in our study were included in this set. Therefore, detecting SNPs in genes expressed after PWN inoculation in the samples showing contrasting phenotypes for the trait of interest might be a better approach to identify SNPs that can be used in future selection programs for PWD resistance. Although a larger sample size would increase the statistical power to detect significant SNP associations with phenotype, it was still possible to detect a high number of SNPs (180,506) in the RNA-seq data.
To ensure the quality of the SNP dataset obtained in this work, stringent hard filters were used. Although the final dataset included a large number of SNPs, several true SNPs have been excluded by filtering, as demonstrated by the detection of excluded SNPs in the Sanger sequencing validation results. On the other hand, two samples were wrongly identified as homozygotes for two SNPs in the RNA-seq analysis, when these samples were in fact heterozygotes. This probably resulted from a low RNA-seq read coverage in these regions leading to the detection of only one of the alleles. Including filters for minimum depth coverage may decrease the number of miscalled genotypes and further improve the SNPs dataset.
Genetic differentiation between resistant and susceptible groups was low, as the samples were all from the same half-sib family, but highly variable probably due to the small sample size. In contrast, a small set of SNPs presented very high levels of differentiation, with one allele being prevalent in the susceptible group while the resistant group presented mostly the other allele, suggesting they might be linked to phenotype. Some of these highly differentiated SNPs were located in transcripts with functions described as relevant for PWN resistance [19]. For instance, one SNP was positioned in the 3′UTR of a resistance gene, which can impact the post-transcriptional regulation of this gene. Other SNPs of interest were found in peroxidase 31 (PER31) and laccase-3 (LAC3), which code for proteins involved in the lignin biosynthesis pathway [44,45], and UGT5, involved in the synthesis of phenolic compounds in Picea glauca [46]. In PER31 and UGT5, the SNPs highly differentiated between resistant and susceptible plants were nonsynonymous, leading to amino acid changes and being consequently more likely to impact protein function, which may in turn affect lignin deposition or accumulation of phenols. This is consistent with the results from a previous work [19], in which resistant plants were shown to have increased cell wall lignification after inoculation when compared to susceptible plants. Future studies addressing the functional effect of these SNPs could be of interest to further elucidate P. pinaster resistance to PWD.
When genotyping a set of the candidate genes identified by the genetic differentiation analysis in a sample of 40 individuals, it was possible to confirm the association between two SNPs, located in the genes MEE12 and PCMP-E91, and the phenotype. These associations were nominally significant, but did not remain significant following stringent correction for multiple testing. These results should therefore be taken with caution. MEE12 is a transcription initiation factor involved in embryo development [47] and pollen tube guidance [48,49] in Arabidopsis. Although a role for MEE12 in plant defence is unknown, other MEE genes have been implicated in defence responses [50,51]. Alternatively, MEE12 SNP197 may be in linkage with a polymorphism that has functional relevance in resistance, instead of directly affecting the phenotype.
The protein encoded by PCMP-E91 is part of the pentatricopeptide repeat (PPR) protein family, a very large family found in higher plants that is involved in RNA modification processes [52,53], such as RNA editing [54], splicing [55], and processing [56]. Although the function of many of these proteins is still unknown, studied PPR proteins have various roles in regulating embryogenesis, fruit growth and ripening, circadian rhythm, among others [52,53]. Several PPR proteins have been also associated with response to abiotic [57,58] and biotic stresses [59,60]. Therefore, PCMP-E91 may have an important role in P. pinaster defence and resistance to PWN. The SNP associated with phenotype is a nonsynonymous SNP, resulting in an amino acid change and may consequently impact protein function. Furthermore, nucleotide diversity at nonsynonymous sites (πN) in PCMP-E91 was higher than nucleotide diversity at synonymous sites (πS), suggesting that this gene may be under positive selection. As PWN was detected in the Iberia Peninsula only in the late 1990s [4], PCMP-E91 may have evolved in response to other selective pressures, such as other pests or pathogens, and now be effective against PWD.
An association was also detected between two haplotypes of the gene HIPP41 and phenotype, which were not significant after correction for multiple testing. These haplotypes seem to be associated with susceptibility to PWN. HIPPs are a large family of metal-binding metallochaperones that occur only in vascular plants [61]. They are involved in a variety of functions, including heavy-metal homeostasis and detoxification, plant development, response to abiotic stresses, and response to biotic stresses [61,62,63]. In rice, HIPP41 was associated with response to cadmium and to cold [61]. In P. pinaster, HIPP41 may be directly involved in response to PWN and have a role in susceptibility to PWD, as described for other HIPP genes in response to the beet cyst nematode Heterodera schachtii [63].
Although there was no statistically significant association between the SNPs in UGT5 and phenotype, the Tajima’s D test for this gene was significantly positive, indicating that this gene may be under balancing selection. Several genes with known roles in plant defence response have been described as being under balancing selection [64,65]. The interaction of P. pinaster with multiple pests and pathogens during its long lifespan would create a selective pressure to maintain variability in genes relevant for defence response. In accordance, UGT5 seems to be involved in the biosynthesis of the phenolic compounds acetophenones, which have a role in P. glauca resistance to spruce budworm [46]. Different contents of these phenolic compounds may also impact P. pinaster outcome during PWN infection.
Even though SNP-phenotype associations were confirmed for two SNPs in two candidate genes, no significant association remained after stringent correction for multiple comparisons. The absence of strong associations may be due to the small effect that each SNP likely has on the resistance phenotype, a trait that is most likely polygenic given its quantitative nature [6,43]. Therefore, the sample size used may be too small to have enough statistical power to detect significant results for variants with small effects. Although these results cannot be directly applied, polymorphisms in candidate genes, especially in MEE12, PCMP-E91, HIPP41, and UGT5, may be useful in the development of markers for resistance to PWD, and warrant further investigation in genotyping assays of a larger sample representing several families of the reference population for PWD resistance [6,21].

5. Conclusions

Our results confirmed that using RNA-seq data for SNP discovery is a valuable approach to identify SNPs in candidate genes potentially linked to the trait of interest. These SNPs can be particularly informative as they were identified under the biotic stress in study and in a population showing contrasting phenotypes for the relevant trait. The identified SNPs have the potential to be used in future association studies searching for markers connected to PWD, not only in the half-sib family 440, but also in other families originating from the same population in the South of Portugal. The SNPs here identified can be added to other previously discovered P. pinaster SNPs to obtain a high-density SNP array that include interesting SNPs for PWD resistance, increasing the potential for discovery of significant genome wide associations.

Supplementary Materials

The following supporting information can be downloaded at: https://0-www-mdpi-com.brum.beds.ac.uk/article/10.3390/f13060946/s1, Supplementary Figure S1. Type of SNPs identified in P. pinaster RNA-seq analysis; Supplementary Figure S2. Boxplots of the height and diameter at the base of the stem of inoculated plants (half-sib family 440) and t-test results for the comparison of these parameters’ means between susceptible and resistant plants; Supplementary Figure S3. Association analysis of the SNPs in the six sequenced gene fragments under different genetic models with resistance to PWN; Supplementary Figure S4. Genotypes distribution for SNPs associated with phenotype; Supplementary Table S1. Summary of PCR conditions and sequencing results of the 26 SNPs selected for validation; Supplementary Table S2. Summary of mapping statistic per sample and per sequencing lane; Supplementary Table S3. SNPs detected in P. pinaster RNA-seq data; Supplementary Table S4. Details and functional annotation of the SNPs with an Fst ≥ 0.80; Supplementary Table S5. Allele frequencies and Hardy–Weinberg Equilibrium significance values calculated by SNPassoc; Supplementary Table S6. Non-significant results of the haplotype association analysis obtained with SNPassoc. All analyses were performed using a logistics regression model.

Author Contributions

Conceptualization and Methodology, I.M. and C.M.M.; Formal Analysis and Visualization, I.M.; Validation, I.M. and V.I.; Resources, I.C., C.M.M. and Y.V.d.P.; Writing—Original Draft Preparation, I.M.; Writing—Review and Editing, all authors; Supervision, P.N., C.M.M., I.C. and Y.V.d.P.; Funding Acquisition, C.M.M. All authors have read and agreed to the published version of the manuscript.

Funding

This work was supported by Fundação para a Ciência e a Tecnologia, I.P. (FCT/MCTES), through Grants GREEN-it (UID/Multi/04551/2013), BioISI (UIDB/04046/2020 and UIDP/04046/2020) and the doctoral fellowship SFRH/BD/111687/2015 (to I.M.). Support was also provided by FCT/MCTES through national funds (PIDDAC) and co-financed by Fundo Europeu de Desenvolvimento Regional (FEDER) of the EU, through Programa Operacional Regional de Lisboa do Portugal 2020 or other programs that may succeed—PTDC/BAA-MOL/28379/2017, LISBOA-01-0145-FEDER-028379.

Data Availability Statement

The sequencing data presented in this study are openly available in European Nucleotide Archive (ENA) at EMBL EBI under accession number PRJEB51636.

Acknowledgments

We thank Maria L. Inácio (INIAV) for providing the nematode cultures and Hugo Matias (ITQB NOVA) for all the technical support in the greenhouse.

Conflicts of Interest

The authors declare no conflict of interest.

References

  1. Webster, J.; Mota, M. PineWilt Disease: Global Issues, Trade and Economic Impact. In Pine Wilt Disease: A Worldwide Threat to Forest Ecosystems; Mota, M., Vieira, P., Eds.; Springer: Berlin/Heidelberg, Germany, 2008; pp. 1–4. [Google Scholar]
  2. Vicente, C.; Espada, M.; Vieira, P.; Mota, M. Pine Wilt Disease: A Threat to European Forestry. Eur. J. Plant Pathol. 2012, 133, 89–99. [Google Scholar] [CrossRef]
  3. Jones, J.T.; Moens, M.; Mota, M.; Li, H.; Kikuchi, T. Bursaphelenchus xylophilus: Opportunities in Comparative Genomics and Molecular Host-Parasite Interactions. Mol. Plant Pathol. 2008, 9, 357–368. [Google Scholar] [CrossRef] [PubMed]
  4. Mota, M.; Braasch, H.; Bravo, M.A.; Penas, A.C.; Burgermeister, W.; Metge, K.; Sousa, E. First Report of Bursaphelenchus xylophilus in Portugal and in Europe. Nematology 1999, 1, 727–734. [Google Scholar] [CrossRef]
  5. Eveno, E.; Collada, C.; Guevara, M.A.; Léger, V.; Soto, A.; Díaz, L.; Léger, P.; González-Martínez, S.C.; Cervera, M.T.; Plomion, C.; et al. Contrasting Patterns of Selection at Pinus pinaster Ait. Drought Stress Candidate Genes as Revealed by Genetic Differentiation Analyses. Mol. Biol. Evol. 2008, 25, 417–437. [Google Scholar] [CrossRef] [PubMed] [Green Version]
  6. Carrasquinho, I.; Lisboa, A.; Inácio, M.L.; Gonçalves, E. Genetic Variation in Susceptibility to Pine Wilt Disease of Maritime Pine Half-Sib Families. Ann. For. Sci. 2018, 75, 85. [Google Scholar] [CrossRef] [Green Version]
  7. Menéndez-Gutiérrez, M.; Alonso, M.; Toval, G.; Díaz, R. Testing of Selected Pinus pinaster Half-Sib Families for Tolerance to Pinewood Nematode (Bursaphelenchus xylophilus). Forestry 2017, 91, 38–48. [Google Scholar] [CrossRef]
  8. Menéndez-Gutiérrez, M.; Alonso, M.; Toval, G.; Díaz, R. Variation in Pinewood Nematode Susceptibility among Pinus pinaster Ait. Provenances from the Iberian Peninsula and France. Ann. For. Sci. 2017, 74, 76. [Google Scholar] [CrossRef] [Green Version]
  9. Toda, T.; Kurinobu, S. Realized Genetic Gains Observed in Progeny Tolerance of Selected Red Pine (Pinus densiflora) and Black Pine (P. thunbergii) to Pine Wilt Disease. Silvae Genet. 2002, 51, 42–44. [Google Scholar]
  10. Xu, L.-Y.; Zhang, J.; Gao, J.-B.; Chen, X.-L.; Jiang, C.-W.; Hao, Y.-P. Study on the Disease Resistance of Candidate Clones in Pinus massoniana to Bursaphelenchus xylophilus. China For. Sci. Technol. 2012, 26, 27–30. [Google Scholar]
  11. Nose, M.; Shiraishi, S. Breeding for Resistance to Pine Wilt Disease. In Pine Wilt Disease; Zhao, B.G., Futai, K., Sutherland, J.R., Takeuchi, Y., Eds.; Springer: Tokyo, Japan, 2008; pp. 334–350. [Google Scholar]
  12. Sniezko, R.A.; Koch, J. Breeding Trees Resistant to Insects and Diseases: Putting Theory into Application. Biol. Invasions 2017, 19, 3377–3400. [Google Scholar] [CrossRef]
  13. Naidoo, S.; Slippers, B.; Plett, J.M.; Coles, D.; Oates, C.N. The Road to Resistance in Forest Trees. Front. Plant Sci. 2019, 10, 273. [Google Scholar] [CrossRef] [PubMed] [Green Version]
  14. Hirao, T.; Matsunaga, K.; Hirakawa, H.; Shirasawa, K.; Isoda, K.; Mishima, K.; Tamura, M.; Watanabe, A. Construction of Genetic Linkage Map and Identification of a Novel Major Locus for Resistance to Pine Wood Nematode in Japanese Black Pine (Pinus thunbergii). BMC Plant Biol. 2019, 19, 424. [Google Scholar] [CrossRef] [PubMed] [Green Version]
  15. Liu, J.-J.; Sniezko, R.A.; Sturrock, R.N.; Chen, H. Western White Pine SNP Discovery and High-Throughput Genotyping for Breeding and Conservation Applications. BMC Plant Biol. 2014, 14, 380. [Google Scholar] [CrossRef] [PubMed] [Green Version]
  16. Plomion, C.; Bartholomé, J.; Lesur, I.; Boury, C.; Rodríguez-Quilón, I.; Lagraulet, H.; Ehrenmann, F.; Bouffier, L.; Gion, J.M.; Grivet, D.; et al. High-Density SNP Assay Development for Genetic Analysis in Maritime Pine (Pinus pinaster). Mol. Ecol. Resour. 2016, 16, 574–587. [Google Scholar] [CrossRef]
  17. Guo, Y.; Su, B.; Tang, J.; Zhou, F.; Qiu, L.J. Gene-Based SNP Identification and Validation in Soybean Using next-Generation Transcriptome Sequencing. Mol. Genet. Genom. 2018, 293, 623–633. [Google Scholar] [CrossRef]
  18. Liu, J.-J.; Sniezko, R.; Murray, M.; Wang, N.; Chen, H.; Zamany, A.; Sturrock, R.N.; Savin, D.; Kegley, A. Genetic Diversity and Population Structure of Whitebark Pine (Pinus albicaulis Engelm.) in Western North America. PLoS ONE 2016, 11, e0167986. [Google Scholar] [CrossRef] [Green Version]
  19. Modesto, I.; Sterck, L.; Arbona, V.; Gómez-Cadenas, A.; Carrasquinho, I.; Van de Peer, Y.; Miguel, C.M. Insights Into the Mechanisms Implicated in Pinus pinaster Resistance to Pinewood Nematode. Front. Plant Sci. 2021, 12, 1102. [Google Scholar] [CrossRef]
  20. Rodrigues, A.M.; Carrasquinho, I.; António, C. Primary Metabolite Adjustments Associated With Pinewood Nematode Resistance in Pinus pinaster. Front. Plant Sci. 2021, 12, 777681. [Google Scholar] [CrossRef]
  21. Ribeiro, B.; Espada, M.; Vu, T.; Nóbrega, F.; Mota, M.; Carrasquinho, I. Pine Wilt Disease: Detection of the Pinewood Nematode (Bursaphelenchus xylophilus) as a Tool for a Pine Breeding Programme. For. Pathol. 2012, 42, 521–525. [Google Scholar] [CrossRef]
  22. Rodrigues, A.M.; Langer, S.; Carrasquinho, I.; Bergström, E.; Larson, T.; Thomas-Oates, J.; António, C. Pinus pinaster Early Hormonal Defence Responses to Pinewood Nematode (Bursaphelenchus xylophilus) Infection. Metabolites 2021, 11, 227. [Google Scholar] [CrossRef]
  23. Whitehead, A.G.; Hemming, J.R. A Comparison of Some Quantitative Methods of Extracting Small Vermiform Nematodes from Soil. Ann. Appl. Biol. 1965, 55, 25–38. [Google Scholar] [CrossRef]
  24. Futai, K.; Furuno, T. The Variety of Resistances among Pine Species to Pine Wood Nematode, Bursaphelenchus lignicolus. Bull. Kyoto Univ. 1979, 51, 23–36. [Google Scholar]
  25. Andrews, S. FastQC: A Quality Control Tool for High Throughput Sequence Data. Available online: http://www.bioinformatics.babraham.ac.uk/projects/fastqc (accessed on 13 June 2022).
  26. Cañas, R.A.; Li, Z.; Pascual, M.B.; Castro-Rodríguez, V.; Ávila, C.; Sterck, L.; Van de Peer, Y.; Cánovas, F.M. The Gene Expression Landscape of Pine Seedling Tissues. Plant J. 2017, 91, 1064–1087. [Google Scholar] [CrossRef] [PubMed] [Green Version]
  27. Kikuchi, T.; Cotton, J.A.; Dalzell, J.J.; Hasegawa, K.; Kanzaki, N.; McVeigh, P.; Takanashi, T.; Tsai, I.J.; Assefa, S.A.; Cock, P.J.A.; et al. Genomic Insights into the Origin of Parasitism in the Emerging Plant Pathogen Bursaphelenchus xylophilus. PLoS Pathog. 2011, 7, e1002219. [Google Scholar] [CrossRef] [Green Version]
  28. Li, H. Aligning Sequence Reads, Clone Sequences and Assembly Contigs with BWA-MEM. arXiv 2013, arXiv:1303.3997v2. [Google Scholar]
  29. Li, H.; Handsaker, B.; Wysoker, A.; Fennell, T.; Ruan, J.; Homer, N.; Marth, G.; Abecasis, G.; Durbin, R. The Sequence Alignment/Map Format and SAMtools. Bioinformatics 2009, 25, 2078–2079. [Google Scholar] [CrossRef] [Green Version]
  30. McKenna, A.; Hanna, M.; Banks, E.; Sivachenko, A.; Cibulskis, K.; Kernytsky, A.; Garimella, K.; Altshuler, D.; Gabriel, S.; Daly, M.; et al. The Genome Analysis Toolkit: A MapReduce Framework for Analyzing next-Generation DNA Sequencing Data. Genome Res. 2010, 20, 1297–1303. [Google Scholar] [CrossRef] [Green Version]
  31. Van der Auwera, G.A.; O’Connor, B.D. Genomics in the Cloud; O’Reilly Media: Sebastopol, CA, USA, 2020; ISBN 9781491975190. [Google Scholar]
  32. Cingolani, P.; Platts, A.; Wang, L.L.; Coon, M.; Nguyen, T.; Wang, L.; Land, S.J.; Lu, X.; Ruden, D.M. A Program for Annotating and Predicting the Effects of Single Nucleotide Polymorphisms, SnpEff: SNPs in the Genome of Drosophila melanogaster Strain W1118; Iso-2; Iso-3. Fly 2012, 6, 80–92. [Google Scholar] [CrossRef] [Green Version]
  33. Danecek, P.; Auton, A.; Abecasis, G.; Albers, C.A.; Banks, E.; DePristo, M.A.; Handsaker, R.E.; Lunter, G.; Marth, G.T.; Sherry, S.T.; et al. The Variant Call Format and VCFtools. Bioinformatics 2011, 27, 2156–2158. [Google Scholar] [CrossRef]
  34. Marshall, O.J. PerlPrimer: Cross-Platform, Graphical Primer Design for Standard, Bisulphite and Real-Time PCR. Bioinformatics 2004, 20, 2471–2472. [Google Scholar] [CrossRef] [Green Version]
  35. Doyle, J. DNA Protocols for Plants. In Molecular Techniques in Taxonomy; Hewitt, G.M., Johnston, A.W.B., Young, J.P.W., Eds.; Springer: Berlin/Heidelberg, Germany, 1991; pp. 283–293. ISBN 978-3-642-83962-7. [Google Scholar]
  36. Thompson, J.D.; Higgins, D.G.; Gibson, T.J. CLUSTAL W: Improving the Sensitivity of Progressive Multiple Sequence Alignment through Sequence Weighting, Position-Specific Gap Penalties and Weight Matrix Choice. Nucleic Acids Res. 1994, 22, 4673–4680. [Google Scholar] [CrossRef] [PubMed] [Green Version]
  37. Stephens, M.; Smith, N.J.; Donnelly, P. A New Statistical Method for Haplotype Reconstruction from Population Data. Am. J. Hum. Genet. 2001, 68, 978–989. [Google Scholar] [CrossRef] [PubMed] [Green Version]
  38. Stephens, M.; Scheet, P. Accounting for Decay of Linkage Disequilibrium in Haplotype Inference and Missing-Data Imputation. Am. J. Hum. Genet. 2005, 76, 449–462. [Google Scholar] [CrossRef] [Green Version]
  39. Rozas, J.; Ferrer-Mata, A.; Sánchez-DelBarrio, J.C.; Guirao-Rico, S.; Librado, P.; Ramos-Onsins, S.E.; Sánchez-Gracia, A. DnaSP 6: DNA Sequence Polymorphism Analysis of Large Data Sets. Mol. Biol. Evol. 2017, 34, 3299–3302. [Google Scholar] [CrossRef] [PubMed]
  40. González, J.R.; Armengol, L.; Solé, X.; Guinó, E.; Mercader, J.M.; Estivill, X.; Moreno, V. SNPassoc: An R Package to Perform Whole Genome Association Studies. Bioinformatics 2007, 23, 644–645. [Google Scholar] [CrossRef] [Green Version]
  41. Tajima, F. Statistical Method for Testing the Neutral Mutation Hypothesis by DNA Polymorphism. Genetics 1989, 123, 585–595. [Google Scholar] [CrossRef]
  42. Madur, D.; Kumar, S.; Krier, C.; Bou-Dagher-Kharrat, M.; Bertocchi, E.; Brach, J.; Plomion, C. A high density genetic map of maritime pine based on AFLPs. Ann. For. Sci. 2002, 59, 627–636. [Google Scholar] [CrossRef] [Green Version]
  43. Hurel, A.; de Miguel, M.; Dutech, C.; Desprez-Loustau, M.L.; Plomion, C.; Rodríguez-Quilón, I.; Cyrille, A.; Guzman, T.; Alía, R.; González-Martínez, S.C.; et al. Genetic Basis of Growth, Spring Phenology, and Susceptibility to Biotic Stressors in Maritime Pine. Evol. Appl. 2021, 14, 2750–2772. [Google Scholar] [CrossRef]
  44. Vogt, T. Phenylpropanoid Biosynthesis. Mol. Plant 2010, 3, 2–20. [Google Scholar] [CrossRef] [Green Version]
  45. Xie, M.; Zhang, J.; Tschaplinski, T.J.; Tuskan, G.A.; Chen, J.G.; Muchero, W. Regulation of Lignin Biosynthesis and Its Role in Growth-Defense Tradeoffs. Front. Plant Sci. 2018, 9, 1427. [Google Scholar] [CrossRef] [Green Version]
  46. Mageroy, M.H.; Jancsik, S.; Yuen, M.M.S.; Fischer, M.; Withers, S.G.; Paetz, C.; Schneider, B.; MacKay, J.J.; Bohlmann, J. A Conifer UDP-Sugar Dependent Glycosyltransferase Contributes to Acetophenone Metabolism and Defense against Insects. Plant Physiol. 2017, 175, 641–651. [Google Scholar] [CrossRef] [PubMed]
  47. Pagnussat, G.C.; Yu, H.J.; Ngo, Q.A.; Rajani, S.; Mayalagu, S.; Johnson, C.S.; Capron, A.; Xie, L.F.; Ye, D.; Sundaresan, V. Genetic and Molecular Identification of Genes Required for Female Gametophyte Development and Function in Arabidopsis. Development 2005, 132, 603–614. [Google Scholar] [CrossRef] [PubMed] [Green Version]
  48. Chen, Y.H.; Li, H.J.; Shi, D.Q.; Yuan, L.; Liu, J.; Sreenivasan, R.; Baskar, R.; Grossniklaus, U.; Yang, W.C. The Central Cell Plays a Critical Role in Pollen Tube Guidance in Arabidopsis. Plant Cell 2007, 19, 3563–3577. [Google Scholar] [CrossRef] [Green Version]
  49. Li, Y.X.; Wang, Y.; Liu, Z.Y.; Wang, X.; Lu, Q.; Jia, X.Z.; Zhang, X.Y. Functional Analysis of the Venom Allergen-like Protein Gene from Pine Wood Nematode Bursaphelenchus xylophilus Using a Baculovirus Expression System. Physiol. Mol. Plant Pathol. 2016, 93, 58–66. [Google Scholar] [CrossRef]
  50. Huibers, R.P.; De Jong, M.; Dekter, R.W.; Van Den Ackerveken, G. Disease-Specific Expression of Host Genes during Downy Mildew Infection of Arabidopsis. Mol. Plant-Microbe Interact. 2009, 22, 1104–1115. [Google Scholar] [CrossRef] [PubMed] [Green Version]
  51. Wang, S.; Durrant, W.E.; Song, J.; Spivey, N.W.; Dong, X. Arabidopsis BRCA2 and RAD51 Proteins Are Specifically Involved in Defense Gene Transcription during Plant Immune Responses. Proc. Natl. Acad. Sci. USA 2010, 107, 22716–22721. [Google Scholar] [CrossRef] [Green Version]
  52. Qin, T.; Zhao, P.; Sun, J.; Zhao, Y.; Zhang, Y.; Yang, Q.; Wang, W.; Chen, Z.; Mai, T.; Zou, Y.; et al. Research Progress of PPR Proteins in RNA Editing, Stress Response, Plant Growth and Development. Front. Genet. 2021, 12, 765580. [Google Scholar] [CrossRef]
  53. Saha, D.; Prasad, A.M.; Srinivasan, R. Pentatricopeptide Repeat Proteins and Their Emerging Roles in Plants. Plant Physiol. Biochem. 2007, 45, 521–534. [Google Scholar] [CrossRef]
  54. Hayes, M.L.; Dang, K.N.; Diaz, M.F.; Mulligan, R.M. A Conserved Glutamate Residue in the C-Terminal Deaminase Domain of Pentatricopeptide Repeat Proteins Is Required for RNA Editing Activity. J. Biol. Chem. 2015, 290, 10136–10142. [Google Scholar] [CrossRef] [Green Version]
  55. Ichinose, M.; Tasaki, E.; Sugita, C.; Sugita, M. A PPR-DYW Protein Is Required for Splicing of a Group II Intron of Cox1 Pre-MRNA in Physcomitrella patens. Plant J. 2012, 70, 271–278. [Google Scholar] [CrossRef]
  56. Hao, Y.; Wang, Y.; Wu, M.; Zhu, X.; Teng, X.; Sun, Y.; Zhu, J.; Zhang, Y.; Jing, R.; Lei, J.; et al. The Nuclear-Localized PPR Protein OsNPPR1 Is Important for Mitochondrial Function and Endosperm Development in Rice. J. Exp. Bot. 2019, 70, 4705–4720. [Google Scholar] [CrossRef] [PubMed] [Green Version]
  57. Koussevitzky, S.; Nott, A.; Mockler, T.C.; Hong, F.; Sachetto-Martins, G.; Surpin, M.; Lim, J.; Mittler, R.; Chory, J. Signals from Chloroplasts Converge to Regulate Nuclear Gene Expression. Science 2007, 316, 715–719. [Google Scholar] [CrossRef] [PubMed]
  58. Zsigmond, L.; Rigó, G.; Szarka, A.; Székely, G.; Otvös, K.; Darula, Z.; Medzihradszky, K.F.; Koncz, C.; Koncz, Z.; Szabados, L. Arabidopsis PPR40 Connects Abiotic Stress Responses to Mitochondrial Electron Transport. Plant Physiol. 2008, 146, 1721–1737. [Google Scholar] [CrossRef] [PubMed] [Green Version]
  59. Laluk, K.; Abuqamar, S.; Mengiste, T. The Arabidopsis Mitochondria-Localized Pentatricopeptide Repeat Protein PGN Functions in Defense against Necrotrophic Fungi and Abiotic Stress Tolerance. Plant Physiol. 2011, 156, 2053–2068. [Google Scholar] [CrossRef] [PubMed] [Green Version]
  60. Xing, H.; Fu, X.; Yang, C.; Tang, X.; Guo, L.; Li, C.; Xu, C.; Luo, K. Genome-Wide Investigation of Pentatricopeptide Repeat Gene Family in Poplar and Their Expression Analysis in Response to Biotic and Abiotic Stresses. Sci. Rep. 2018, 8, 2817. [Google Scholar] [CrossRef] [Green Version]
  61. De Abreu-Neto, J.B.; Turchetto-Zolet, A.C.; De Oliveira, L.F.V.; Bodanese Zanettini, M.H.; Margis-Pinheiro, M. Heavy Metal-Associated Isoprenylated Plant Protein (HIPP): Characterization of a Family of Proteins Exclusive to Plants. FEBS J. 2013, 280, 1604–1616. [Google Scholar] [CrossRef]
  62. Zhang, H.; Zhang, X.; Liu, J.; Niu, Y.; Chen, Y.; Hao, Y.; Zhao, J.; Sun, L.; Wang, H.; Xiao, J.; et al. Characterization of the Heavy-Metal-Associated Isoprenylated Plant Protein (Hipp) Gene Family from Triticeae species. Int. J. Mol. Sci. 2020, 21, 6191. [Google Scholar] [CrossRef]
  63. Radakovic, Z.S.; Anjam, M.S.; Escobar, E.; Chopra, D.; Cabrera, J.; Silva, A.C.; Escobar, C.; Sobczak, M.; Grundler, F.M.W.; Siddique, S. Arabidopsis HIPP27 Is a Host Susceptibility Gene for the Beet Cyst Nematode Heterodera schachtii. Mol. Plant Pathol. 2018, 19, 1917–1928. [Google Scholar] [CrossRef] [Green Version]
  64. Tiffin, P.; Moeller, D.A. Molecular Evolution of Plant Immune System Genes. Trends Genet. 2006, 22, 662–670. [Google Scholar] [CrossRef]
  65. Keith, R.; Mitchell-Olds, T. Genetic Variation for Resistance to Herbivores and Plant Pathogens: Hypotheses, Mechanisms and Evolutionary Implications. Plant Pathol. 2013, 62, 122–132. [Google Scholar] [CrossRef]
Figure 1. Summary of SNP effects (a) and Tajima’s D estimation for all transcripts (b). Tajima’s D was calculated using a sliding window of 200 bp. All—all samples; Res—resistant; Sus—susceptible.
Forests 13 00946 g001
Figure 2. Genetic differentiation (FST) between susceptible and resistant groups (a) and characterization of the SNPs with FST0.80 (b,c). (a) Manhattan plot of FST values obtained between susceptible and resistant samples. The red intermittent line indicates FST = 0.80. (b) SNP effects of the SNPs with FST ≥ 0.80. (c) Nucleotide diversity (π) of the regions containing the SNPs with FST ≥ 0.80, calculated using a sliding window of 200 bp. Res—resistant; Sus—susceptible.
Forests 13 00946 g002
Figure 3. Pine wilt disease symptoms progression in Pinus pinaster plants according to a symptoms scale of 0 to 4. This scale is based on the percentage of wilting or brown needles in each observed plant: 0—0% of the needles presented symptoms; 1—1 to 25%; 2—26 to 50%; 3—51 to 75%; 4—76 to 100%. Dpi—days post-inoculation.
Forests 13 00946 g003
Table 1. Number of SNPs and genetic diversity estimates for all samples, for pinewood nematode susceptible samples, and for resistant samples.
NSNPsTranscriptsTs/TvSynNonSynπMAF
All samples9186,50625,8571.4148,99252,8820.003282 (±0.036491)0.274 (±0.147)
Susceptible4164,41624,2061.4143,31246,7840.003396 (±0.039505)0.304 (±0.140)
Resistant5166,97924,5141.4043,80947,6850.003250 (±0.037789)0.294 (±0.142)
N—number of samples; Ts/Tv—transitions/tranversions ratio; Syn—synonymous SNPs; NonSyn—nonsynonymous SNPs; π—nucleotide diversity; MAF—minor allele frequency.
Table 2. Summary of the SNP validation.
TranscriptSNP Pos.SNP AnnotationGene AnnotationGeno. RNA-SeqGeno. SangerVal.Gen.Additional SNPs
SusResSusRes
isotig677033863′-UTRpentatricopeptide repeat-containing protein At2g27610 [Quercus suber] (PCMP)AAGGAAGG304CT; 320CT
isotig302301975′-UTRmaternal effect embryo arrest 12 [Arabidopsis thaliana] (MEE12)AACCAACC-
isotig424282363′-UTRprotein PHOSPHATE STARVATION RESPONSE 1 [Quercus suber] (PHR1)AAGGAAGG-
isotig53013453Synpentatricopeptide repeat-containing protein At4g21065 [Elaeis guineensis] (PCMP-H28)CCGGCCGG594TA; 651AC
unigene161348Synkinesin-like protein KIN-12F [Nelumbo nucifera] (KIN12)AAGGAAGG-
unigene8832646Synheavy metal-associated isoprenylated plant protein 41-like [Elaeis guineensis] (HIPP41)TTCCTTCC-
unigene52225105Noncodingunknown [Picea sitchensis] (ung52225)CCTTCCTT145CT; 171GA
isotig37698586NonSynUDP-glycosyltransferase UGT5 [Picea glauca] (UGT5)GGCCGCCC×505CT; 577AT; 739TG; 745TC
unigene58419178NonSynpentatricopeptide repeat-containing protein At3g16610 [Prunus mume] (PCMP-E91)GGAAGGAG×-
unigene188104297Noncodingno annotation (ung188104)CCGGCCGG-
298Noncoding GGCCGGCC-
305Noncoding TTGGTTGG-
isotig096455905′-UTRGuanine nucleotide-binding protein, beta subunit [Parasponia andersonii] (GB1)AAGGAAGG780AG; 804CT
6205′-UTRTTAATTAA
isotig469691304NonSynhypothetical protein PHAVU_003G104100g [Phaseolus vulgaris] (HP)GGCCCCCC××-
SNP pos.—SNP position; Geno.—genotype; Val.—Validated; Gen.—Correctly genotyped; Sus—susceptible; Res—resistant; Noncoding—SNPs in noncoding regions; Syn—synonymous SNPs; NonSyn—nonsynonymous SNPs.
Table 3. Summary of genetic diversity estimates for the six sequenced gene fragments.
GeneFrag. Size (bp)GroupSeqRegionsSNPsSNP Effectπ (±SD)πSπNHap.H (±SD)Tajima’s D
NoncodingSynNonSyn
HIPP41673All803 exons; 2 introns62220.00227 (±0.00018)0.010950.0017390.757 (±0.028)0.61044
Res40-62220.00230 (±0.00039)0.010200.0017690.676 (±0.074)0.26373
Sus40-41210.00204 (±0.00014)0.010140.0016760.762 (±0.031)1.10499
KIN12395All80exon1-1-0.00108 (±0.00011)0.005750.0000020.425 (±0.042)1.32948
Res40-1-1-0.00091 (±0.00019)0.004830.0000020.358 (±0.073)0.74452
Sus40-1-1-0.00122 (±0.00011)0.00650020.481 (±0.042)1.49197
MEE12384All805′-UTR11--0.00130 (±0.00002)--20.506 (±0.008)1.81156
Res40-11--0.00124 (±0.00011)--20.481 (±0.042)1.49197
Sus40-11--0.00124 (±0.00011)--20.481 (±0.042)1.49197
PCMP-E91124All68exon4--40.00910 (±0.00065)0.000000.0114950.667 (±0.033)0.74798
Res30-2--20.00803 (±0.00053)0.000000.0101340.683 (±0.053)1.99045
Sus38-4--40.00984 (±0.00102)0.000000.0124250.653 (±0.047)0.68160
PHR1486All803′-UTR33--0.00216 (±0.00012)--50.578 (±0.036)1.36955
Res40-22--0.00206 (±0.00012)--30.549 (±0.041)2.12756 *
Sus40-33--0.00230 (±0.00022)--50.614 (±0.059)1.2714
UGT5297All78exon5-410.00845 (±0.00020)0.030370.0021630.558 (±0.027)3.27745 **
Res40-5-410.00856 (±0.00036)0.029590.0020530.528 (±0.051)2.72844 **
Sus38-5-410.00856 (±0.00036)0.030530.0022530.585 (±0.038)2.92830 **
Frag. Size—size of the amplified fragment; Noncoding—SNPs in noncoding regions; Syn—synonymous SNPs; NonSyn—nonsynonymous SNPs; π—nucleotide diversity; πS—nucleotide diversity in synonymous sites; πN—nucleotide diversity in nonsynonymous sites; Hap.—number of haplotypes; Tajima’s D neutrality test [41]; SD—standard deviation. * p-value < 0.05; ** p-value < 0.01.
Table 4. Significant association results between genotypes and phenotypes. All analyses were performed with SNPassoc using a logistic regression model.
SNPGenetic ModelGenotypesSus n = 20 n (%)Res n = 20 n (%)OR (95% CI)p-ValueAICOR (95% CI) adj.p-Value adj.AIC adj.
MEE12 SNP197DominantA/A8 (40%)2 (10%)1.000.0244 *54.41.000.0168 *54.7
A/C-C/C12 (60%)18 (90%)6.00 (1.08–33.27) 7.40 (1.20–45.67)
log-Additive0,1,220 (50%)20 (50%)3.00 (1.09–8.25)0.0222 *54.23.69 (1.23–11.09)0.0109 *53.9
PCMP-E91 SNP178RecessiveA/A-A/G10 (52.6%)13 (86.7%)1.000.0295 *45.91.000.0074 **44.1
G/G9 (47.4%)2 (13.3%)0.17 (0.03–0.97) 0.07 (0.01–0.69)
Sus—susceptible; Res—resistant; n—number of samples; OR—odds ratio; CI—confidence interval; AIC—akaike information criterion; adj.—results of the statistical analysis adjusted for diameter at the basis of the stem and plant height. * p-value < 0.05; ** p-value < 0.01.
Table 5. Significant results of the haplotype association analysis. All analyses were performed with SNPassoc using a logistic regression model.
GeneHaplotypeHaplotype Freq.OR (95% CI)p-Value
HIPP411CAG0.38681.00-
2TAA0.10181.06 (0.19–5.91)0.9459
3TAG0.22320.22 (0.06–0.84)0.0263 *
4TGA0.24750.34 (0.12–0.97)0.0441 *
genoH.rare0.04071.00 (0.07–14.61)0.9995
Freq.—frequency; OR—odds ratio; CI—confidence interval. * p-value < 0.05.
Publisher’s Note: MDPI stays neutral with regard to jurisdictional claims in published maps and institutional affiliations.

