Article

Understory Plant Abundance Is More Important than Species Richness in Explaining Soil Nutrient Variation Following Afforestation on the Eastern Loess Plateau, China

1
Key Laboratory of State Forestry Administration on Soil and Water Conservation, School of Soil and Water Conservation, Beijing Forestry University, Beijing 100083, China
2
National Engineering Laboratory for Tree Breeding, College of Biological Sciences and Technology, Beijing Forestry University, Beijing 100083, China
*
Author to whom correspondence should be addressed.
Submission received: 8 April 2022 / Revised: 16 June 2022 / Accepted: 2 July 2022 / Published: 10 July 2022
(This article belongs to the Special Issue Soil Organic Matter and Nutrient Cycling in Forests)

Abstract

:
Afforestation plays an important role in controlling soil erosion and nutrient loss on the Loess Plateau in China. However, previous studies on soil nutrient changes have mainly focused on the effects of tree species, whereas little is known about how changes in shrubs and herbs caused by afforestation drive soil nutrient changes. In this study, we examined the variation characteristics of understory vegetation and soil nutrients for different vegetation types. The results showed that compared to abandoned farmland, plantations significantly increased soil organic carbon and total nitrogen but had no significant effect on total phosphorus. Robinia pseudoacacia L. forests were more effective than Pinus tabuliformis Carr. forests in increasing soil nutrient content. In addition, herbaceous vegetation in the R. pseudoacacia forest better explained the soil nutrient variation, and herb abundance was the best explanatory variable; however, shrub vegetation contributed more to soil nutrient variation in the P. tabuliformis forest, and shrub abundance contributed the most. Accordingly, we determined that understory plant abundance, rather than species richness, may be the most important factor driving soil nutrient changes. Specifically, herb abundance in the R. pseudoacacia forest may drive soil nutrient changes mainly by regulating herb biomass and litter biomass. By contrast, shrub abundance in the P. tabuliformis forest indirectly affected soil organic carbon mainly by altering shrub biomass. Furthermore, although the phylogenetic relationships had less effect on soil nutrients than species composition, they also made important contributions. Therefore, the phylogenetic relationships should also be considered in addition to species composition when assessing the impact of vegetation on soil properties in the future.

1. Introduction

As the largest terrestrial carbon pool, soil plays a vital role in the global carbon cycle and climate change mitigation [1]. The nitrogen and phosphorus stored in the soil also provide the necessary nutrients for plant growth and development [2]. However, soil erosion, known as one of the most serious environmental problems, usually causes land degradation and nutrient loss. In this respect, afforestation is considered to be an important solution to control soil erosion and nutrient loss.
Afforestation has made important contributions to reducing atmospheric CO2 concentrations and capturing and storing carbon [3]. Indeed, with the development of vegetation following afforestation, the contents of soil elements, especially carbon, nitrogen and phosphorus, may undergo consequential changes [4,5]. Zhang et al. [6] reported that after afforestation on farmland, soil organic carbon (SOC), total nitrogen (TN) and total phosphorus (TP) all increased significantly with afforestation age. Similarly, Zhao et al. [7] revealed that the transformation from abandoned land to forestland not only increased species richness, but also effectively increased SOC and TN, and promoted nutrient element cycling. However, Zhang et al. [8] found that in the early stages of conversion from farmland to forestland, the soil carbon and nitrogen contents decreased gradually, returning to their original levels approximately 30 years later. Additionally, other researchers have suggested that the soil TP may be more likely to decrease or not change significantly after afforestation [9,10]. The different changing characteristics of soil nutrients reflected in these results may be attributable to a variety of factors, including previous land use, stand age and tree species identity [9,10,11].
Different tree species can alter the potential for soil carbon storage and nutrient cycling [12,13], as previous studies found that afforestation of broad-leaved trees accumulated higher SOC and TN compared to coniferous trees [5,9]. Similarly, Shi et al. [11] showed that plantations with nitrogen-fixing tree species had higher capacity to accumulate soil carbon and nitrogen than those without nitrogen-fixing. In brief, the storage potential of carbon and nitrogen in soil may be determined by the differences in litter properties and root biomass resulting from different tree species [14,15]. In addition, different tree species usually do not cause significant differences in soil TP, which may be due to the fact that soil phosphorus is mainly derived from soil parent material and may depend more on the influence of climate and historical land use [4,16,17]. However, other studies have found that, although both broad-leaved and coniferous forests significantly reduced soil TP, the reduction of soil TP was greater in coniferous forests due to the lower litter quality and quantity [17]. Therefore, it is necessary to further study the changes in soil properties caused by afforestation of different tree species to provide new insights for selecting the most suitable afforestation species.
Previous studies on soil nutrient changes mainly focused on the effects of tree species while ignoring the important role of understory vegetation. Understory shrubs and herbs, as the key components of ecosystems, play an important role in maintaining productivity, reducing soil erosion and accelerating nutrient turnover [18,19,20]. The presence of understory vegetation may, to a large extent, enhance soil microbial activity and increase the litter decomposition rate, thus promoting soil nutrient accumulation [19]. Many studies have shown that shrubs and herbs differ in terms of longevity, individual size, histochemical composition and soil resource utilization strategy, which may drive different changes in soil nutrients [21,22,23]. For example, shrubs tend to have larger and more deeply distributed roots than herbs, and thus can add abundant organic matter to deeper soil layers [23,24]. However, Gilliam et al. [18] found that although the herb layer accounted for less than 1% of the forest biomass, it could input up to 20% of litter accumulation due to its shorter life cycle. Therefore, the existence of herbaceous plants may also promote nutrient cycling by contributing high-quality and easily decomposed litter. In addition, some studies have shown that species richness can promote soil carbon and nitrogen accumulation by increasing plant biomass [25,26]. However, focusing solely on species richness may overlook the potential effects that plant abundance may have on soil nutrients [27,28]. Moreover, other studies have found that increasing phylogenetic diversity can also increase plant productivity, thereby improving soil fertility [29,30]. Therefore, it is necessary to further explore the relative contribution of understory vegetation to soil nutrients from the perspectives of species richness, abundance and phylogenetic diversity.
The Loess Plateau is one of the most serious soil erosion regions in the world and is a typical region of severe land degradation. The region is characterized by loose soil, low erosion resistance and concentrated rainfall. Moreover, the spontaneous restoration of vegetation on the Loess Plateau occurs very slowly due to the serious loss of soil water and nutrients [31]. Therefore, in the past few decades, large-scale afforestation has been carried out on the Loess Plateau using Robinia pseudoacacia and Pinus tabuliformis with strong soil and water conservation abilities. These two tree species are the most commonly planted trees for afforestation projects in the region and have made important contributions to restoring understory vegetation, controlling soil erosion and improving soil properties [6,32,33]. Although some studies have analyzed the relationship between understory vegetation and soil nutrients on the Loess Plateau [7,34,35], how changes in understory vegetation induced by afforestation drive soil nutrient changes is still poorly understood. Therefore, we explored the variation characteristics of understory plants and soil nutrients in different vegetation types. The objectives of the study were to (1) reveal the differences in soil nutrients and understory vegetation among different vegetation types; (2) evaluate the effects of vegetation changes in the shrub and herb layers caused by afforestation on soil nutrients; and (3) identify the most important understory vegetation factors driving soil nutrient changes. This study may help to deepen the understanding of understory vegetation development and its effect on soil nutrient changes after afforestation and may provide a basis for formulating feasible plantation management measures in areas with severe soil erosion.

2. Materials and Methods

2.1. Study Area

The study area (36°14′–36°18′ N, 110°39′–110°47′ E) is located in northern Jixian County, Shanxi Province, China (Figure 1). This area is a typical gully area on the Loess Plateau, with an altitude range of 903–1568 m. The average annual temperature is 10 °C, and the average annual rainfall is 579 mm. Rainfall is distributed unevenly throughout the year, mainly from June to September. The average annual potential evapotranspiration is much higher than the precipitation, at approximately three times the precipitation [36]. According to the USDA Soil Classification, the soil type is known as Alfisol. Land use types mainly include forestland, shrubland and farmland. The stand composition is single, dominated by pure forests of P. tabuliformis and R. pseudoacacia.

2.2. Field Surveys

The plantations in this area were mainly planted on abandoned farmland from 1993 to 1994. Field surveys were conducted from July to August 2019, when plant growth was at its peak. We selected representative sample plots (20 m × 20 m) of R. pseudoacacia (19 sample plots) and P. tabuliformis forest (18 sample plots) with similar stand age, stand density, soil type and topographic features (Table 1). These plots were chosen after consulting the local forestry managers and staff of Jixian Forest Ecosystem National Field Observation and Research Station. To control the variables and make a better comparison with the plantation, we selected the control plots with the soil type, restoration time and topographic characteristics similar to those of the plantation. However, the number of control plots meeting these conditions in this area is limited. Therefore, six shrublands and six abandoned farmlands were selected as controls (20 m × 20 m). The size of shrub plants in abandoned farmland is much smaller than that in shrubland. Moreover, the previous land use types of all plots were abandoned farmland.
Four shrub quadrats (2 m × 2 m) were set at the four corners (2 m from the boundary) of each plantation and control plot, and the herb quadrat (1 m × 1 m) was set at the center of each shrub quadrat (Figure 1). Four shrub quadrats and four herb quadrats were used to investigate the species and abundance of shrubs and herbs (including all plants in herb layer), respectively. The data of four quadrats were combined to characterize each sample plot. In the shrub quadrat, the aboveground and belowground parts of the shrub were collected. In the herb quadrat, all litter and the aboveground and belowground parts of the herbaceous plants were collected. They were then taken to the laboratory, dried to constant weight at 65 °C and measured for biomass. Furthermore, soil samples from four soil layers (0–10, 10–20, 20–30, and 30–50 cm) were collected at three different locations in each sample plot. The samples of the same soil layer from the same sample plot were mixed into one sample to determine the chemical properties. The SOC, TN and TP were measured by potassium dichromate, the Kjeldahl method and the Mo–Sb colorimetric method, respectively [37,38].

2.3. Phylogenetic Metrics

Phylogenetic diversity and the net relatedness index (NRI) were calculated using Phylocom 4.2 software. Phylogenetic diversity is the sum of the phylogenetic branch lengths of all species. Furthermore, phylogenetic diversity is closely related to functional diversity and can often be used as an alternative for functional diversity [39]. The NRI was used to assess the degree of phylogenetic relatedness among species [40]. The NRI is calculated as follows [41]:
NRI = 1 × ( MPD observed MPD randomized ) / sdMPD randomized
where MPDobserved is the mean phylogenetic distance among all possible pairs of species in an assemblage and MPDrandomized and sdMPDrandomized are the mean and standard deviation expected for the randomized assemblages (n = 999). A positive NRI value represents phylogenetic clustering, while a negative NRI value represents phylogenetic overdispersion [41].

2.4. Statistical Analyses

The differences in the variables of the vegetation and soil among different vegetation types were analyzed using one-way analysis of variance (ANOVA). Plantation data were used to analyze the relationship between understory vegetation and soil nutrients to study the effect of understory vegetation on soil nutrients after afforestation. Redundancy analysis (RDA) was used to examine the relationship between understory vegetation and soil nutrients to identify the important vegetation factors driving soil nutrient changes. The partial RDA was used to determine the relative contributions of shrub and herb layers to soil nutrients as well as the relative contributions of species and phylogeny to soil nutrients. The Pearson correlation coefficient method was used to further test the relationship between vegetation and soil variables. The above analyses were performed using SPSS 21.0 (IBM Corporation, Armonk, NY, USA) and R software (version 4.1.2). Furthermore, the direct and indirect effects of understory vegetation on soil nutrients were inferred by structural equation modeling (SEM). This analysis was completed using Amos 22.0, and the data were log-transformed to fit normal distributions.

3. Results

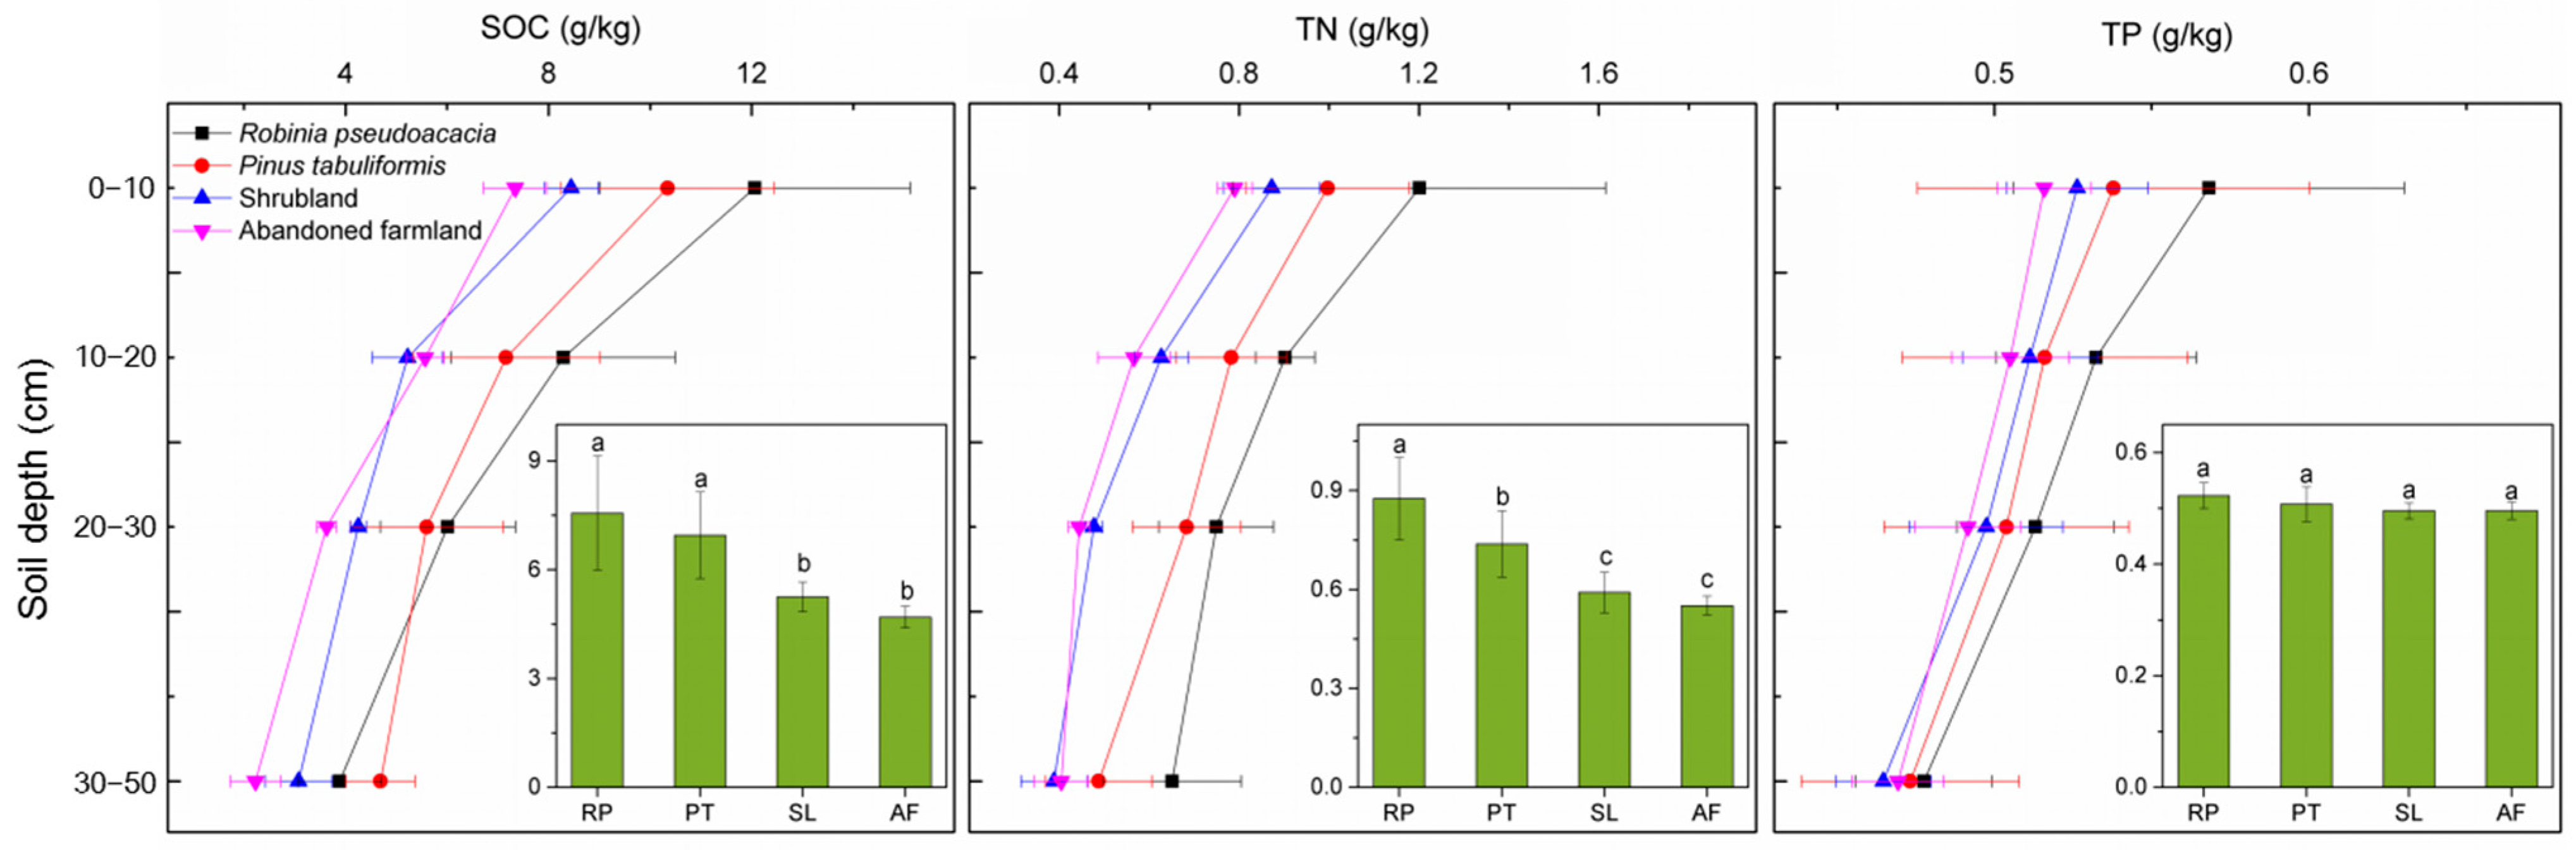
3.1. Changes in SOC, TN and TP

In order to study the effect of afforestation on SOC, TN and TP contents in soil, we compared these variables in R. pseudoacacia and P. tabuliformis forests as well as in shrubland and abandoned farmland used as control plots. As expected, afforestation drove changes in soil nutrient content. More than 20 years’ afforestation of abandoned farmland by R. pseudoacacia and P. tabuliformis caused substantial increase in SOC and TN contents (0–50 cm) (Figure 2). Compared with abandoned farmland, the SOC in the R. pseudoacacia forest and P. tabuliformis forest increased by 61.19% and 48.19%, respectively. Moreover, the TN in the R. pseudoacacia forest was significantly higher than that in the P. tabuliformis forest, and both were 60.0% and 34.55% higher than that in abandoned farmland, respectively. Although the SOC, TN and TP in shrubland were higher than those in abandoned farmland, there was no significant difference between shrubland and abandoned farmland. In addition, the average total phosphorus content in soil profiles (0–50 cm) of different vegetation types ranged from 0.50 to 0.52 g·kg−1, with no significant difference.
The highest values of SOC, TN and TP all appeared in the 0–10 cm soil layer, and gradually decreased with increasing soil depth. The variation ranges of SOC, TN and TP in the topsoil was higher than that in the subsoil. In each soil layer, the SOC, TN and TP in the R. pseudoacacia forest and P. tabuliformis forest were higher than those in shrubland and abandoned farmland. Interestingly, however, the SOC of the R. pseudoacacia forest was lower than that of the P. tabuliformis forest in the 30–50 cm soil layer.

3.2. Characteristics of Understory Vegetation

There were significant differences in species richness, plant abundance or phylogenetic diversity in the herb layer among different vegetation restoration types (Figure 3). Specifically, the species richness of herbaceous plants in the R. pseudoacacia forest was significantly higher than that in the P. tabuliformis forest and shrubland. Similarly, the phylogenetic diversity of herb layers in the R. pseudoacacia forest was significantly higher than that in the P. tabuliformis forest, shrubland and abandoned farmland. Moreover, the herb abundance in the P. tabuliformis forest was significantly lower than that in the R. pseudoacacia forest, shrubland and abandoned farmland. For the shrub layer, there were no significant differences in species richness, abundance and phylogenetic diversity between control plots and two plantations. However, the shrub biomass in shrubland was significantly higher than that in plantations; notably, the shrub biomass in the R. pseudoacacia forest was significantly lower than that in the P. tabuliformis forest, but the herb biomass was significantly higher than that in the P. tabuliformis forest (Table S1).
The number of sample plots with positive and negative NRI values for the shrub and herb layers in the R. pseudoacacia forest was evenly distributed, and the mean NRI value tended to be 0, showing a random phylogenetic structure as a whole. In the P. tabuliformis forest, the number of sample plots with a negative NRI of the shrub and herb layers was greater than that with a positive NRI, and the mean NRI value was less than 0, indicating that these plots tended to be composed of distantly related species. For shrubland and abandoned farmland, the mean NRI of the shrub layer and the herb layer was positive, and the NRI values of most plots were greater than 0, indicating that these plots tended to be composed of closely related species.

3.3. Relationship between Understory Vegetation and Soil Nutrients in Forest Ecosystems

In order to study the effect of understory vegetation on soil nutrients in two forest types, RDA analysis was performed. The RDA showed that in the R. pseudoacacia forest (Figure 4a), the first and second ordination axes explained 29.0% and 11.1% of soil nutrient changes, respectively. The plant abundance, species richness and phylogenetic diversity in the herbaceous layer and the plant abundance in the shrub layer had a strong ability to explain soil nutrient changes. The herb plant abundance was the best explanatory variable (Monte Carlo permutation test, p = 0.002). In the P. tabuliformis forest (Figure 4b), the first and second ordination axes explained 30.1% and 10.9% of soil nutrient changes, respectively. The shrub plant abundance had the greatest impact on soil nutrients (Monte Carlo permutation test, p = 0.002), followed by shrub species richness, phylogenetic diversity and herb NRI.
Partial RDA showed that in the R. pseudoacacia forest (Figure 5a,b), the vegetation factors in the herb layer had higher independent explanations for soil nutrient variation than those in the shrub layer; the independent explanations of the understory species composition (including abundance and richness) on soil nutrient variation were higher than those of the phylogenetic relationship. However, in the P. tabuliformis forest (Figure 5c,d), the shrub layer had a higher independent explanation for soil variation, while the herb layer explained less; understory species composition and phylogenetic relationship had similar explanatory levels for soil nutrient variation.
Pearson correlation analysis verified the RDA results that the correlation between the herb layer and soil nutrients was stronger than that between the shrub layer and soil nutrients in the R. pseudoacacia forest (Figure 6a). The plant abundance, species richness, aboveground biomass and belowground biomass in the herb layer were significantly positively correlated with soil nutrients in most soil layers. In addition, the vegetation factors of the shrub layer had a significant positive correlation with the soil nutrients of a few soil layers, mainly concentrated in the subsoil, while the litter biomass had a significant positive correlation with the soil nutrients in the topsoil. In contrast to the R. pseudoacacia forest, the vegetation factors of the shrub layer had stronger correlation with soil nutrients in the P. tabuliformis forest (Figure 6b). Specifically, the plant abundance, aboveground biomass and belowground biomass in the shrub layer were significantly positively correlated with soil nutrients in most soil layers. Although these factors were significantly positively correlated with SOC in different soil layers, their correlations with soil TN and TP were mainly concentrated in the subsoil. For the herb layer, vegetation factors had a significant positive correlation with TN in the topsoil. Surprisingly, litter biomass was negatively correlated with soil nutrients as a whole.
In addition, the phylogenetic diversity in the two plantations had a weak positive correlation with soil nutrients overall. In the R. pseudoacacia forest, the NRI of shrubs and herbs was negatively correlated with soil nutrients, although not all were significant, which indicates that the vegetation community with phylogenetic overdispersion might be more conducive to soil nutrient accumulation. However, in the P. tabuliformis forest, the correlation between NRI of shrubs and herbs and soil nutrients showed the opposite trend.

3.4. Direct and Indirect Effects of Plant Abundance on Soil Nutrients

The RDA analysis indicated that abundance and richness of vegetation were important factors affecting soil nutrients, so their direct and indirect effects on soil nutrients were further analyzed by SEM. In R. pseudoacacia (Figure 7a), shrub abundance and richness significantly affected TN and TP, respectively. Herb richness had a significant effect on TN. Herb abundance significantly affected SOC and TN. Moreover, herb abundance significantly affected SOC and TP by altering herb belowground biomass. For the P. tabuliformis forest (Figure 7b), shrub abundance and richness significantly affected TP and SOC, respectively. Additionally, shrub abundance significantly affected shrub aboveground and belowground biomass and also had significant effects on SOC and TN. Similarly, herb richness significantly affected SOC and TN by altering herb belowground biomass.

4. Discussion

4.1. Soil Nutrients Changed with Vegetation Types

The establishment and development of plant communities may greatly affect soil properties [5,32]. As expected, compared with abandoned farmland, significantly higher SOC and TN contents were measured in the afforested plots, which may be due to more litter and greater root distribution of the plantation community, as we found earlier [42]. In addition, we have found forestland is less vulnerable to soil erosion than farmland on the Loess Plateau [43], which may also be an important reason why SOC and TN increased significantly following afforestation on abandoned farmland.
In this study, both tree species significantly increased SOC and TN, but higher SOC and TN were found in the R. pseudoacacia forest, although more existing aboveground litter was found in the P. tabuliformis forest. This may be attributed to the fact that the difference in soil carbon among different tree species is more closely related to the decomposition rate of litter than the amount of litter input [13]. Correspondingly, conifer litter is of poor quality and difficult to decompose, and its allelopathy may inhibit herb development, thus reducing the organic matter input into the soil [44,45]. Simultaneously, the R. pseudoacacia forest, as a nitrogen-fixing species, can significantly increase soil nitrogen concentration through biological nitrogen fixation, and the rapid decomposition of high-nitrogen litter can also promote nutrient cycling [6,11,46]. Furthermore, Cao et al. [47] reported that the soil TP content in broad-leaved forest was significantly higher than that in coniferous forest. Similarly, Shao et al. [48] found that the soil TP in pure plantation of nitrogen-fixing species was significantly higher than that in pure plantation of non-nitrogen-fixing species. However, in this study, afforestation species had no significant effect on soil TP, which may indicate that the important factor affecting soil TP changes after afforestation in this area did not depend on tree species identity [4]. This also confirms previous studies showing that tree species was not a key factor driving soil TP in northern China [17].

4.2. Effects of Understory Vegetation on Soil Nutrients

Generally, ecosystems with a multilayered vegetation structure may well improve soil conditions [49], so part of the variation in soil nutrients may result from differences in different understory vegetation types [7]. For example, Wu et al. [49] found differences in the contribution of shrub layer and herb layer plants to soil nutrient variation. Similarly, in this study, shrubs and herbs also had different effects on soil nutrients in the R. pseudoacacia and P. tabuliformis forest. However, whether in the R. pseudoacacia forest or P. tabuliformis forest, herbs had a greater impact on topsoil nutrients, while shrubs had a greater impact on subsoil nutrients (Figure 6). An important reason may be that herbs mainly absorb nutrients from the topsoil and in turn supplement the ground with high-quality and easily decomposable litter, while shrubs have deeper root systems and thus may affect nutrient circulation in the subsoil [18,23,24].
Surprisingly, in the R. pseudoacacia forest, we found that the vegetation factors in the herb layer explained the variation of soil nutrients more than those in shrub layer, which is similar to the findings of Poirier et al. [50]. In particular, the variation of SOC in the R. pseudoacacia forest was significantly affected by the herb layer, but it was mainly driven by the shrub plants in P. tabuliformis forest. This may be because the R. pseudoacacia forest had a larger herbaceous biomass, while the P. tabuliformis forest had a larger shrub biomass (Table S1). Correspondingly, the SOC content in the 30–50 cm soil layer of the P. tabuliformis forest was higher than that of the R. pseudoacacia forest, which may also be caused by the higher root biomass distribution of shrubs. In addition, abundant herbaceous plants in R. pseudoacacia forests can not only reduce nitrogen leaching and increase nitrogen retention but can also significantly affect the soil microbial community through their biomass [51,52]. Therefore, these results may indicate that understory plant biomass plays an important role in soil nutrient changes. Furthermore, these findings may also reflect the different influences of coniferous forest and broad-leaved forest on the reconstruction of understory plants with different forms in areas with severe soil erosion, which in turn drives changes in soil nutrients.
Many studies have shown that ecosystems with high species richness can accelerate soil nutrient accumulation by increasing vegetation biomass [25,26]. Li et al. [53] found that species richness had a greater impact on ecosystem functions (including biomass and soil carbon, nitrogen and phosphorus) than plant abundance. Similarly, species richness also significantly affected the soil nutrients in this study but to a lesser degree than plant abundance. This may be because plant abundance had a greater effect on biomass than species richness (Figure S1). Additionally, other studies have also reported that individual plant abundance can explain understory vegetation biomass better than diversity [27]. The increase of dominant plant abundance can offset the loss of biomass caused by species loss [54]. Moreover, the SEM model in this study showed that biomass mediated the promoting effect of plant abundance on soil nutrients. This further confirmed that biomass played a key role in the improvement of soil nutrients by understory vegetation. In addition, Wu et al. [49] argued that although higher plant composition can improve soil nutrients, competition among plants may also reduce soil nutrients as plant composition continues to increase. In this regard, the critical value of plant composition that causes soil nutrient loss to exceed the input should be determined in subsequent studies, which may contribute to maintaining the stable development of forest ecosystems.
In addition, Munzbergova et al. [55] found that phylogenetic relationships may be an important factor in predicting plant–soil relationships. In this regard, phylogenetic diversity can increase soil fertility by increasing plant productivity and can predict soil microorganisms well [30,56]. In this study, although the phylogenetic relationship was only significantly related to the soil nutrients in several soil layers, it had an important contribution to the nutrient variation in the overall soil profile (Figure 5b,d). This implies that phylogenetic relationships may provide additional explanatory power for soil nutrient variation. Therefore, the impact of community phylogeny should also be taken into account when evaluating the soil quality of forest ecosystems in this area. However, although phylogeny is an alternative for functional diversity, Yan et al. [57] found that phylogenetic diversity is not suitable for explaining soil functions in Inner Mongolian grasslands compared to functional diversity. These differences may indicate that the ability of phylogeny to predict soil properties varies among different ecosystems or regions. Furthermore, the NRI of understory vegetation tended to be negatively correlated with soil nutrients as a whole, indicating to a certain extent that plant communities with phylogenetic overdispersion may be more beneficial for increasing soil nutrients. In particular, the NRI of understory plants in R. pseudoacacia forests was significantly negatively correlated with soil nitrogen, suggesting that plant communities containing more distantly related species may be more inclined to promote the accumulation of soil nitrogen. Therefore, these results suggest that phylogenetic relationships may provide a new perspective for assessing the impact of vegetation on soil and the resulting feedback.
In fact, the composition of understory plants can affect litter decomposition by regulating litter composition, temperature and microbial activity, thereby promoting nutrient turnover [58,59]. In the R. pseudoacacia forest, herbaceous plants significantly affected soil nutrient changes by regulating litter biomass (Figure S2), possibly because abundant herbs contributed a large amount of high-quality litter, which was easily decomposed and returned to the soil; however, in the P. tabuliformis forest, understory vegetation seemed to have no effect on litter biomass, likely because almost all of the litter on the ground was composed of P. tabuliformis leaves. This litter hindered nutrient return to the soil due to its difficult-to-decompose characteristics, and thus had a certain negative impact on soil nutrients, particularly soil TN. Remarkably, although there was a large amount of litter under the P. tabuliformis forest, the increased litter had no significant effect on SOC. This may be because the increased carbon input from litter is neutralized by potential carbon loss, as Pisani et al. [60] showed that increasing litter can promote soil organic matter degradation. These results indicate that the litter in the P. tabuliformis forest may need to be reduced appropriately.

4.3. Implications for Restoration

Previous studies have shown that afforestation on the Loess Plateau can effectively promote vegetation restoration and reduce soil erosion, thus promoting soil nutrient accumulation [20,21,33]. In this study, plantations also significantly increased the soil nutrient concentration, but the differences caused by different afforestation tree species should not be ignored. Dawud et al. [61] found that compared to the diversity of tree species, tree species identity was a greater driving factor in determining soil properties. Indeed, the R. pseudoacacia forest was more effective than the P. tabuliformis forest in accelerating soil nutrient accumulation. Obviously, although the R. pseudoacacia forest is an introduced species, it has become an important afforestation tree species on the Loess Plateau because of its strong drought tolerance and nitrogen fixation ability and has made important contributions to vegetation restoration and soil properties improvement [6,32,33]. Additionally, Wang et al. [14] suggested that introducing broad-leaved trees into pure coniferous forests could effectively promote understory restoration and improve the nutrient turnover and return amount. Consequently, it may be feasible to introduce R. pseudoacacia into pure P. tabuliformis forests, which can effectively stimulate the decomposition of litter mixtures [14,62]. More importantly, the mixed litter of the two species also had synergistic effects on soil properties and microorganisms [62].
Notably, although R. pseudoacacia can effectively increase soil carbon, it is also prone to contribute to soil dryness [63]. This may limit the development of understory vegetation and affect nutrient accumulation. However, some studies have shown that the early community succession of R. pseudoacacia forests may lead to soil water deficit, but after decades of restoration, the emergence of forest gaps can promote the gradual rise of soil water [64,65]. Similarly, Qiu et al. [32] also concluded that the long-term improvement effect of R. pseudoacacia on the soil of the Loess Plateau was better than the medium-term improvement effect. Thus, for high-density R. pseudoacacia forests, thinning measures are recommended to reduce the possible adverse effects of soil water deficit. Furthermore, interestingly, we found that understory plant abundance significantly promoted soil nutrient accumulation in plantations, but the soil nutrient content was lowest in the abandoned farmland with the greatest plant abundance. This may be due to the lack of overstory community coverage, which to some extent indicates that the combination of overstory and understory vegetation could better promote soil nutrient accumulation. Therefore, the canopy of plantations should be pruned properly to promote the colonization and propagation of understory plants, thus driving the formation of a more complex multilayered vegetation structure.

5. Conclusions

This study showed that afforestation significantly increased SOC and TN but had no significant effect on soil TP. Correspondingly, R. pseudoacacia forests were more effective than P. tabuliformis forests in accelerating soil nutrient accumulation. In addition, herbaceous vegetation in the R. pseudoacacia forest had a greater influence on soil nutrients, while in the P. tabuliformis forest shrub vegetation had a greater influence on soil nutrients. In short, understory plant abundance, rather than richness, was the most important factor in explaining soil nutrient variation. In this regard, herb abundance in R. pseudoacacia forests may affect soil nutrient accumulation mainly by regulating herb biomass and litter biomass; shrub abundance in P. tabuliformis forests indirectly affected SOC mainly by affecting shrub biomass, but an excessive increase in litter biomass may limit nutrient turnover. In conclusion, R. pseudoacacia forests with more abundant herb plants may be more effective in increasing soil nutrient. Although phylogenetic relationships had less impact on soil nutrients than species composition, they still made important contributions. Consequently, we suggest that phylogenetic relationships should also be considered in addition to species composition when assessing the impact of vegetation on soil properties in the future.

Supplementary Materials

The following supporting information can be downloaded at: https://0-www-mdpi-com.brum.beds.ac.uk/article/10.3390/f13071083/s1. Table S1: The biomass of shrubs, herbs and litter in different vegetation types. Figure S1: Relationship between richness, abundance and biomass of shrubs and herbs in R. pseudoacacia forests and P. tabulaeformis forests; Figure S2: Direct and indirect effects of understory plant abundance on SOC, TN and TP.

Author Contributions

Conceptualization, Y.Z. and B.W.; methodology, Y.Z. and B.W.; investigation, Y.Z. and M.L.; data curation, Y.Z.; visualization, Y.Z. and M.L.; writing—original draft preparation, Y.Z.; writing—review and editing, B.W. All authors have read and agreed to the published version of the manuscript.

Funding

This study was supported by the National Science and Technology Support Program of China (2015BAD07B02).

Institutional Review Board Statement

Not applicable.

Informed Consent Statement

Not applicable.

Data Availability Statement

The data that support this study will be shared upon reasonable request to the corresponding author.

Conflicts of Interest

The authors declare no conflict of interest.

References

  1. Scharlemann, J.P.W.; Tanner, E.V.J.; Hiederer, R.; Kapos, V. Global soil carbon: Understanding and managing the largest terrestrial carbon pool. Carbon Manag. 2014, 5, 81–91. [Google Scholar] [CrossRef]
  2. Cleveland, C.C.; Houlton, B.Z.; Smith, W.K.; Marklein, A.R.; Reed, S.C.; Parton, W.; Del Grosso, S.J.; Running, S.W. Patterns of new versus recycled primary production in the terrestrial biosphere. Proc. Natl. Acad. Sci. USA 2013, 110, 12733–12737. [Google Scholar] [CrossRef] [PubMed] [Green Version]
  3. Jandl, R.; Lindner, M.; Vesterdal, L.; Bauwens, B.; Baritz, R.; Hagedorn, F.; Johnson, D.W.; Minkkinen, K.; Byrne, K.A. How strongly can forest management influence soil carbon sequestration? Geoderma 2007, 137, 253–268. [Google Scholar] [CrossRef]
  4. Deng, Q.; McMahon, D.E.; Xiang, Y.; Yu, C.L.; Jackson, R.B.; Hui, D. A global meta-analysis of soil phosphorus dynamics after afforestation. New Phytol. 2017, 213, 181–192. [Google Scholar] [CrossRef]
  5. Liu, X.; Yang, T.; Wang, Q.; Huang, F.; Li, L. Dynamics of soil carbon and nitrogen stocks after afforestation in arid and semi-arid regions: A meta-analysis. Sci. Total Environ. 2018, 618, 1658–1664. [Google Scholar] [CrossRef]
  6. Zhang, W.; Liu, W.; Xu, M.; Deng, J.; Han, X.; Yang, G.; Feng, Y.; Ren, G. Response of forest growth to C:N:P stoichiometry in plants and soils during Robinia pseudoacacia afforestation on the Loess Plateau, China. Geoderma 2019, 337, 280–289. [Google Scholar] [CrossRef]
  7. Zhao, F.; Kang, D.; Han, X.; Yang, G.; Yang, G.; Feng, Y.; Ren, G. Soil stoichiometry and carbon storage in long-term afforestation soil affected by understory vegetation diversity. Ecol. Eng. 2015, 74, 415–422. [Google Scholar] [CrossRef]
  8. Zhang, G.; Zhang, P.; Cao, Y. Ecosystem carbon and nitrogen storage following farmland afforestation with black locust (Robinia pseudoacacia) on the Loess Plateau, China. J. For. Res. 2018, 29, 761–771. [Google Scholar] [CrossRef]
  9. Guo, Y.; Abdalla, M.; Espenberg, M.; Hastings, A.; Hallett, P.; Smith, P. A systematic analysis and review of the impacts of afforestation on soil quality indicators as modified by climate zone, forest type and age. Sci. Total Environ. 2021, 757, 143824. [Google Scholar] [CrossRef]
  10. Zhang, Q.; Jia, X.; Li, T.; Shao, M.; Yu, Q.; Wei, X. Decreased soil total phosphorus following artificial plantation in the Loess Plateau of China. Geoderma 2021, 385, 114882. [Google Scholar] [CrossRef]
  11. Shi, S.; Peng, C.; Wang, M.; Zhu, Q.; Yang, G.; Yang, Y.; Xi, T.; Zhang, T. A global meta-analysis of changes in soil carbon, nitrogen, phosphorus and sulfur, and stoichiometric shifts after forestation. Plant Soil 2016, 407, 323–340. [Google Scholar] [CrossRef]
  12. Inagaki, Y.; Miura, S.; Kohzu, A. Effects of forest type and stand age on litterfall quality and soil N dynamics in Shikoku district, southern Japan. For. Ecol. Manag. 2004, 202, 107–117. [Google Scholar] [CrossRef]
  13. Vesterdal, L.; Clarke, N.; Sigurdsson, B.D.; Gundersen, P. Do tree species influence soil carbon stocks in temperate and boreal forests? For. Ecol. Manag. 2013, 309, 4–18. [Google Scholar] [CrossRef]
  14. Wang, Q.; Wang, S.; Huang, Y. Comparisons of litterfall, litter decomposition and nutrient return in a monoculture Cunninghamia lanceolata and a mixed stand in southern China. For. Ecol. Manag. 2008, 255, 1210–1218. [Google Scholar] [CrossRef]
  15. Parhizkar, M.; Shabanpour, M.; Miralles, I.; Zema, D.A.; Lucas-Borja, M.E. Effects of plant species on soil quality in natural and planted areas of a forest park in northern Iran. Sci. Total Environ. 2021, 778, 146310. [Google Scholar] [CrossRef] [PubMed]
  16. Walker, T.W.; Adams, A.F.R. Studies on Soil Organic Matter. Soil Sci. 1958, 85, 307–318. [Google Scholar] [CrossRef]
  17. Li, X.; Li, Y.; Peng, S.; Chen, Y.; Cao, Y. Changes in soil phosphorus and its influencing factors following afforestation in Northern China. Land Degrad. Dev. 2019, 30, 1655–1666. [Google Scholar] [CrossRef]
  18. Gilliam, F.S. The Ecological Significance of the Herbaceous Layer in Temperate Forest Ecosystems. BioScience 2007, 57, 845–858. [Google Scholar] [CrossRef]
  19. Fu, X.; Yang, F.; Wang, J.; Di, Y.; Dai, X.; Zhang, X.; Wang, H. Understory vegetation leads to changes in soil acidity and in microbial communities 27 years after reforestation. Sci. Total Environ. 2015, 502, 280–286. [Google Scholar] [CrossRef]
  20. Zhao, J.; Feng, X.; Deng, L.; Yang, Y.; Zhao, Z.; Zhao, P.; Peng, C.; Fu, B. Quantifying the Effects of Vegetation Restorations on the Soil Erosion Export and Nutrient Loss on the Loess Plateau. Front. Plant Sci. 2020, 11, 573126. [Google Scholar] [CrossRef]
  21. Xu, M.; Zhang, J.; Liu, G.B.; Yamanaka, N. Soil properties in natural grassland, Caragana korshinskii planted shrubland, and Robinia pseudoacacia planted forest in gullies on the hilly Loess Plateau, China. Catena 2014, 119, 116–124. [Google Scholar] [CrossRef]
  22. Gao, X.-L.; Li, X.G.; Zhao, L.; Kuzyakov, Y. Regulation of soil phosphorus cycling in grasslands by shrubs. Soil Biol. Biochem. 2019, 133, 1–11. [Google Scholar] [CrossRef]
  23. Li, H.; Shen, H.; Zhou, L.; Zhu, Y.; Chen, L.; Hu, H.; Zhang, P.; Fang, J. Shrub encroachment increases soil carbon and nitrogen stocks in temperate grasslands in China. Land Degrad. Dev. 2019, 30, 756–767. [Google Scholar] [CrossRef]
  24. Blaser, W.J.; Shanungu, G.K.; Edwards, P.J.; Olde Venterink, H. Woody encroachment reduces nutrient limitation and promotes soil carbon sequestration. Ecol. Evol. 2014, 4, 1423–1438. [Google Scholar] [CrossRef] [PubMed]
  25. Cong, W.-F.; van Ruijven, J.; Mommer, L.; De Deyn, G.B.; Berendse, F.; Hoffland, E.; Lavorel, S. Plant species richness promotes soil carbon and nitrogen stocks in grasslands without legumes. J. Ecol. 2014, 102, 1163–1170. [Google Scholar] [CrossRef]
  26. Chen, S.; Wang, W.; Xu, W.; Wang, Y.; Wan, H.; Chen, D.; Tang, Z.; Tang, X.; Zhou, G.; Xie, Z.; et al. Plant diversity enhances productivity and soil carbon storage. Proc. Natl. Acad. Sci. USA 2018, 115, 4027–4032. [Google Scholar] [CrossRef] [Green Version]
  27. Wasof, S.; Lenoir, J.; Hattab, T.; Jamoneau, A.; Gallet-Moron, E.; Ampoorter, E.; Saguez, R.; Bennsadek, L.; Bertrand, R.; Valdès, A.; et al. Dominance of individual plant species is more important than diversity in explaining plant biomass in the forest understorey. J. Veg. Sci. 2018, 29, 521–531. [Google Scholar] [CrossRef] [Green Version]
  28. Le Bagousse-Pinguet, Y.; Soliveres, S.; Gross, N.; Torices, R.; Berdugo, M.; Maestre, F.T. Phylogenetic, functional, and taxonomic richness have both positive and negative effects on ecosystem multifunctionality. Proc. Natl. Acad. Sci. USA 2019, 116, 8419–8424. [Google Scholar] [CrossRef] [Green Version]
  29. Cadotte, M.W.; Cardinale, B.J.; Oakley, T.H. Evolutionary history and the effect of biodiversity on plant productivity. Proc. Natl. Acad. Sci. USA 2008, 105, 17012–17017. [Google Scholar] [CrossRef] [Green Version]
  30. Goberna, M.; Navarro-Cano, J.A.; Verdu, M. Opposing phylogenetic diversity gradients of plant and soil bacterial communities. Proc. Biol. Sci. 2016, 283, 20153003. [Google Scholar] [CrossRef] [Green Version]
  31. Zheng, F.; He, X.; Gao, X.; Zhang, C.; Tang, K. Effects of erosion patterns on nutrient loss following deforestation on the Loess Plateau of China. Agr. Ecosyst. Environ. 2005, 108, 85–97. [Google Scholar] [CrossRef]
  32. Qiu, L.; Zhang, X.; Cheng, J.; Yin, X. Effects of black locust (Robinia pseudoacacia) on soil properties in the loessial gully region of the Loess Plateau, China. Plant Soil 2010, 332, 207–217. [Google Scholar] [CrossRef]
  33. Zhao, Y.; Li, M.; Deng, J.; Wang, B. Afforestation affects soil seed banks by altering soil properties and understory plants on the eastern Loess Plateau, China. Ecol. Indic. 2021, 126, 107670. [Google Scholar] [CrossRef]
  34. Zhang, Q.; Shao, M.A.; Jia, X.; Zhang, C. Understory Vegetation and Drought Effects on Soil Aggregate Stability and Aggregate-Associated Carbon on the Loess Plateau in China. Soil Sci. Soc. Am. J. 2018, 82, 106–114. [Google Scholar] [CrossRef]
  35. Wu, H.; Gao, T.; Zhang, W.; Li, G.; Hao, W. Understory Vegetation Composition and Stand Are Mainly Limited by Soil Moisture in Black Locust Plantations of Loess Plateau. Forests 2021, 12, 195. [Google Scholar] [CrossRef]
  36. Hou, G.; Bi, H.; Wei, X.; Wang, N.; Cui, Y.; Zhao, D.; Ma, X.; Wang, S. Optimal configuration of stand structures in a low-efficiency Robinia pseudoacacia forest based on a comprehensive index of soil and water conservation ecological benefits. Ecol. Indic. 2020, 114, 106308. [Google Scholar] [CrossRef]
  37. Bao, S. Soil and Agricultural Chemistry Analysis; China Agriculture Press: Beijing, China, 2000. [Google Scholar]
  38. Lu, R.K. Chemical Analysis Method of Soil in Agriculture; China Agricultural Science and Technology Press: Beijing, China, 2000. [Google Scholar]
  39. Jia, P.; Du, J. Measuring functional and phylogenetic diversity in community ecology. Chin. Bull. Life Sci. 2014, 26, 153–157. [Google Scholar] [CrossRef]
  40. Webb, C.O. Exploring the Phylogenetic Structure of Ecological Communities: An Example for Rain Forest Trees. Am. Nat. 2000, 156, 145–155. [Google Scholar] [CrossRef] [PubMed]
  41. Webb, C.O.; Ackerly, D.D.; McPeek, M.A.; Donoghue, M.J. Phylogenies and Community Ecology. Annu. Rev. Ecol. Syst. 2002, 33, 475–505. [Google Scholar] [CrossRef] [Green Version]
  42. Huang, Z.; Davis, M.R.; Condron, L.M.; Clinton, P.W. Soil carbon pools, plant biomarkers and mean carbon residence time after afforestation of grassland with three tree species. Soil Biol. Biochem. 2011, 43, 1341–1349. [Google Scholar] [CrossRef]
  43. Fu, B.; Wang, Y.; Lu, Y.; He, C.; Chen, L.; Song, C. The effects of land-use combinations on soil erosion: A case study in the Loess Plateau of China. Prog. Phys. Geog. 2009, 33, 793–804. [Google Scholar] [CrossRef]
  44. Gurmesa, G.A.; Schmidt, I.K.; Gundersen, P.; Vesterdal, L. Soil carbon accumulation and nitrogen retention traits of four tree species grown in common gardens. For. Ecol. Manag. 2013, 309, 47–57. [Google Scholar] [CrossRef]
  45. Kato-Noguchi, H.; Kimura, F.; Ohno, O.; Suenaga, K. Involvement of allelopathy in inhibition of understory growth in red pine forests. J. Plant Physiol. 2017, 218, 66–73. [Google Scholar] [CrossRef] [PubMed]
  46. Buzhdygan, O.Y.; Rudenko, S.S.; Kazanci, C.; Patten, B.C. Effect of invasive black locust (Robinia pseudoacacia L.) on nitrogen cycle in floodplain ecosystem. Ecol. Model. 2016, 319, 170–177. [Google Scholar] [CrossRef]
  47. Cao, Y.; Zhang, P.; Chen, Y. Soil C:N:P stoichiometry in plantations of N-fixing black locust and indigenous pine, and secondary oak forests in Northwest China. J. Soil Sediment 2018, 18, 1478–1489. [Google Scholar] [CrossRef]
  48. Shao, G.; Ai, J.; Sun, Q.; Hou, L.; Dong, Y. Soil quality assessment under different forest types in the Mount Tai, central Eastern China. Ecol. Indic. 2020, 115, 106439. [Google Scholar] [CrossRef]
  49. Wu, J.; Zeng, H.; Zhao, F.; Chen, C.; Liu, W.; Yang, B.; Zhang, W. Recognizing the role of plant species composition in the modification of soil nutrients and water in rubber agroforestry systems. Sci. Total. Environ. 2020, 723, 138042. [Google Scholar] [CrossRef]
  50. Poirier, V.; Coyea, M.R.; Angers, D.A.; Munson, A.D. Silvicultural treatments and subsequent vegetation impact long-term mineral soil biogeochemistry in mixedwood plantations. For. Ecol. Manag. 2016, 368, 140–150. [Google Scholar] [CrossRef]
  51. de Vries, F.T.; Bardgett, R.D. Plant community controls on short-term ecosystem nitrogen retention. New Phytol. 2016, 210, 861–874. [Google Scholar] [CrossRef] [Green Version]
  52. Yin, K.; Zhang, L.; Chen, D.; Tian, Y.; Zhang, F.; Wen, M.; Yuan, C. Understory herb layer exerts strong controls on soil microbial communities in subtropical plantations. Sci. Rep. 2016, 6, 27066. [Google Scholar] [CrossRef] [Green Version]
  53. Li, S.; Liu, W.; Lang, X.; Huang, X.; Su, J. Species richness, not abundance, drives ecosystem multifunctionality in a subtropical coniferous forest. Ecol. Indic. 2021, 120, 106911. [Google Scholar] [CrossRef]
  54. Smith, M.D.; Knapp, A.K. Dominant species maintain ecosystem function with non-random species loss. Ecol. Lett. 2003, 6, 509–517. [Google Scholar] [CrossRef] [Green Version]
  55. Münzbergová, Z.; Šurinová, M. The importance of species phylogenetic relationships and species traits for the intensity of plant-soil feedback. Ecosphere 2015, 6, 234. [Google Scholar] [CrossRef] [Green Version]
  56. Milcu, A.; Allan, E.; Roscher, C.; Jenkins, T.; Meyer, S.T.; Flynn, D.; Bessler, H.; Buscot, F.; Engels, C.; Gubsch, M.; et al. Functionally and phylogenetically diverse plant communities key to soil biota. Ecology 2013, 94, 1878–1885. [Google Scholar] [CrossRef] [Green Version]
  57. Yan, Y.; Zhang, Q.; Buyantuev, A.; Liu, Q.; Niu, J. Plant functional beta diversity is an important mediator of effects of aridity on soil multifunctionality. Sci. Total Environ. 2020, 726, 138529. [Google Scholar] [CrossRef]
  58. Xiong, Y.; Xia, H.; Li, Z.A.; Cai, X.A.; Fu, S. Impacts of litter and understory removal on soil properties in a subtropical Acacia mangium plantation in China. Plant Soil 2008, 304, 179–188. [Google Scholar] [CrossRef]
  59. Lange, M.; Eisenhauer, N.; Sierra, C.A.; Bessler, H.; Engels, C.; Griffiths, R.I.; Mellado-Vazquez, P.G.; Malik, A.A.; Roy, J.; Scheu, S.; et al. Plant diversity increases soil microbial activity and soil carbon storage. Nat. Commun. 2015, 6, 6707. [Google Scholar] [CrossRef]
  60. Pisani, O.; Lin, L.H.; Lun, O.O.Y.; Lajtha, K.; Nadelhoffer, K.J.; Simpson, A.J.; Simpson, M.J. Long-term doubling of litter inputs accelerates soil organic matter degradation and reduces soil carbon stocks. Biogeochemistry 2016, 127, 1–14. [Google Scholar] [CrossRef]
  61. Dawud, S.M.; Raulund-Rasmussen, K.; Domisch, T.; Finér, L.; Jaroszewicz, B.; Vesterdal, L. Is Tree Species Diversity or Species Identity the More Important Driver of Soil Carbon Stocks, C/N Ratio, and pH? Ecosystems 2016, 19, 645–660. [Google Scholar] [CrossRef] [Green Version]
  62. Li, Q.; Zhao, G.; Cao, G.; Zhang, X.; Liu, Z. Non-additive Effects of Leaf Litter Mixtures from Robinia pseudoacacia and Ten Tree Species on Soil Properties. J. Sustain. For. 2020, 39, 771–784. [Google Scholar] [CrossRef]
  63. Gao, X.; Li, H.; Zhao, X.; Ma, W.; Wu, P. Identifying a suitable revegetation technique for soil restoration on water-limited and degraded land: Considering both deep soil moisture deficit and soil organic carbon sequestration. Geoderma 2018, 319, 61–69. [Google Scholar] [CrossRef]
  64. Jia, X.; Shao, M.; Zhu, Y.; Luo, Y. Soil moisture decline due to afforestation across the Loess Plateau, China. J. Hydrol. 2017, 546, 113–122. [Google Scholar] [CrossRef]
  65. Wang, J.; Zhao, W.; Zhang, X.; Liu, Y.; Wang, S.; Liu, Y. Effects of reforestation on plant species diversity on the Loess Plateau of China: A case study in Danangou catchment. Sci. Total Environ. 2019, 651, 979–989. [Google Scholar] [CrossRef] [PubMed]
Figure 1. Location of the study area and sampling plots (★, R. pseudoacacia forest; ▲, P. tabuliformis forest; ⯀, shrubland; and ⊕, abandoned farmland). The figure in the lower right corner shows the settings of the shrub and herb quadrat in the sample plot.
Forests 13 01083 g001
Figure 2. The SOC, TN and TP varied with soil depth in different vegetation types. The error bars indicate the standard error. The bar chart shows mean ± SE (0–50 cm). Different letters represent significant differences between different vegetation types (p < 0.05). RP, R. pseudoacacia forest; PT, P. tabuliformis forest; SL, shrubland; AF, abandoned farmland.
Forests 13 01083 g002
Figure 3. Species richness, plant abundance, phylogenetic diversity and NRI of different vegetation types. Different letters represent significant differences between different vegetation types (p < 0.05). The black dot in the box is the mean. The white dots in the boxplot are the values of each sample plot. RP, R. pseudoacacia forest; PT, P. tabuliformis forest; SL, shrubland; AF, abandoned farmland.
Forests 13 01083 g003
Figure 4. RDA ordination diagram for soil nutrients and vegetation factors in the R. pseudoacacia forest (a) and P. tabuliformis forest (b). SSR, shrub species richness; SPA, shrub plant abundance; SPD, shrub phylogenetic diversity; SNRI, shrub NRI; HSR, herb species richness; HPA, herb abundance; HPD, herb phylogenetic diversity; HNRI, herb NRI. C0.10 to C30.50 represent the SOC of each soil layer; N0.10 to N30.50 represent the TN of each soil layer; and P0.10 to P30.50 represent the TP of each soil layer.
Forests 13 01083 g004
Figure 5. The variance component of soil nutrients explained by understory vegetation in the R. pseudoacacia forest (a,b) and P. tabuliformis forest (c,d). The overlap indicates a joint interpretation by the different groups.
Forests 13 01083 g005
Figure 6. Pearson correlation coefficients between soil nutrients and environmental factors in the R. pseudoacacia forest (a) and P. tabuliformis forest (b). A positive value of the gradient color bar code indicates a positive correlation, and a negative value indicates a negative correlation. * p < 0.05, ** p < 0.01. SSR, shrub species richness; SPA, shrub plant abundance; SPD, shrub phylogenetic diversity; SNRI, shrub NRI; SAB, shrub aboveground biomass; SBB, shrub belowground biomass; HSR, herb species richness; HPA, herb plant abundance; HPD, herb phylogenetic diversity; HNRI, herb NRI; HAB, herb aboveground biomass; HBB, herb belowground biomass; LB, litter biomass. C0.10 to C30.50 represent the SOC of each soil layer; N0.10 to N30.50 represent the TN of each soil layer; P0.10 to P30.50 represent the TP of each soil layer.
Forests 13 01083 g006
Figure 7. Direct and indirect effects of understory vegetation on SOC, TN and TP in R. pseudoacacia ((a) CMIN/DF = 1.106, GFI = 0.841, CFI = 0.981, RMSEA = 0.077) and P. tabuliformis forest ((b) CMIN/DF = 1.201, GFI = 0.819, CFI = 0.959, RMSEA = 0.109). Bold black arrows indicate significant correlations (p < 0.05). The number above the box represents the multiple R2. Sabundance, shrub abundance; Srichness, shrub richness; SAbiomass, shrub aboveground biomass; SBbiomass, shrub belowground biomass; Habundance, herb abundance; Hrichness, herb richness; HAbiomass, herb aboveground biomass; HBbiomass, herb belowground biomass.
Forests 13 01083 g007
Table 1. Description of different vegetation types.
Vegetation TypesAltitude/mSlopeDominant Shrubs SpeciesDominant Herbs Species
R. pseudoacacia forest1085–113019–25Rosa xanthina Lindl., Periploca sepium BungeCarex lancifolia C. B. Clarke, Artemisia stechmanniana Bess.,
Chrysanthemum lavandulifolium (Fischer ex Trautvetter) Makino
P. tabuliformis forest1094–114518–24Rosa xanthina, Spiraea salicifolia L.Patrinia scabiosifolia Link, Artemisia stechmanniana, Carex lancifolia
Shrubland1090–112519–23Vitex negundo var. Heterophylla (Franch.) Rehd., Lespedeza bicolor Turcz.Potentilla chinensis Ser., Artemisia stechmanniana, Artemisia argyi Lévl. et Van.
Abandoned farmland1085–112021–24Lespedeza bicolor, Forsythia suspensa (Thunb.) VahlPotentilla chinensis, Artemisia stechmanniana, Patrinia scabiosifolia
Note: The projection coverage of shrub and herb in shrubland was 0.62 ± 0.06 (mean ± SE) and 0.67 ± 0.05 respectively; the projection coverage of shrub and herb in abandoned farmland was 0.20 ± 0.04 and 0.72 ± 0.06, respectively.
Publisher’s Note: MDPI stays neutral with regard to jurisdictional claims in published maps and institutional affiliations.

