Article

Research on Thermal Comfort of Underside of Street Tree Based on LiDAR Point Cloud Model

1
College of Landscape Architecture and Art, Henan Agricultural University, Zhengzhou 450002, China
2
College of Environmental Science and Forestry, State University of New York, Syracuse, NY 14250, USA
*
Authors to whom correspondence should be addressed.
These authors contributed equally to this work.
Submission received: 9 May 2022 / Revised: 4 July 2022 / Accepted: 7 July 2022 / Published: 11 July 2022
(This article belongs to the Special Issue Urban Forest and Urban Microclimate)

Abstract

:
As a major part of the urban green space system, street trees play a corresponding role in adjusting the thermal comfort of the environment and alleviating heat island effects. The correlation between the morphological structure and microclimate factors in the lower canopy of street trees was studied, using data that were captured with vehicle-borne LiDAR to model the morphological structure and geometric canopy features of six key street tree species in the built-up area of Zhumadian City, Henan Province. The regulating ability and differences of canopy geometry on cooling, humidification, shading, and Physiologically Equivalent Temperature (PET) were studied. Research shows that: (1) Canopy Volume (CV), Canopy Area (CA), Canopy Diameter (CD), and Tree Height (TH) have a linear negative correlation with air temperature, relative humidity, and luminosity. TH had significant effects on the air temperature and relative humidity (R2 = 0.90, 0.96), and CV and CD had significant effects on luminosity (R2 = 0.70, 0.63). (2) The oval-shaped plant (Platanus acerifolia (Aiton) Willdenow) had a strong cooling and shading ability, with an average daily cooling of 2.3 °C and shading of 318 cd/m2. The spire-shaped plant (Cedrus deodara (Roxb.) G. Don) had a strong ability to humidify, with an average daily humidification of 4.5%. (3) The oval-shaped and spire-shaped plants had a strong regulation ability on PET, and the daily average regulation values were 40.5 °C and 40.9 °C, respectively. (4) The CD of the oval-shaped plant had a significant effect on PET (R2 = 0.49), and the TH of the spire-shaped plant had a significant effect on PET (R2 = 0.80), as well as a significantly higher CV and Leaf Area Index (LAI) than other street tree species. Therefore, selecting oval and spire canopy-shaped plants with a thick canopy, dense leaves, and high CD and TH values as street trees can provide significant advantages in cooling, humidifying, and shading, and can effectively adjust human comfort in the lower canopy understory. This study is the first to apply LiDAR technology to the regulation of urban microclimate. The research results provide a theoretical basis and quantitative reference for street tree design from the perspective of outdoor thermal comfort evaluation and play a guiding role in the application of LiDAR to urban forestry research.

1. Introduction

Street trees are a significant part of urban green space and can improve the microclimate of road spaces, providing benefits such as reducing air temperature, increasing relative humidity, attenuating solar and ground radiation, and improving ventilation. During the summer months, the average air temperature in the space under the street trees can be reduced by about 1.7–3.3 °C, compared with the ambient temperature in the open pavement space [1]. In the summer months in subtropical and tropical areas, an increase in tree planting area of 25% may effectively reduce the temperature by about 3.3–5.6 °C [2]. Additionally, the variation of spatial microclimate under street trees is also impacted by the tree species that are present [3]. The morphological structural characteristics of street trees may affect their cooling, humidification, and shading functions. CV, CA, and leaf density can promote canopy transpiration and reduce air temperature [4,5,6]. Canopy structure, leaf shape, and leaf color may affect visible and solar infrared light penetration levels [7]. Lastly, the cooling effect of small-leaved species is generally stronger than that of large-leaved species [8]. In contrast, canopy geometry is a significant factor in regulating microclimate and human comfort. Canopy shadows may not only reduce glare and prevent environmental diffuse reflection, but also may increase the heat exchange buffer layer between the vertical space of the building and the transverse space of the street, thereby reducing the temperature of the underlying surface, as well as reducing the wind speed [9,10]. At present, most research focuses on exploring the microclimate regulation ability of urban street trees in tropical and arid regions; research on the microclimate regulation of urban street trees in temperate regions is still insufficient [11,12].
Vehicle-borne LiDAR as an active remote sensing technology has been widely used in urban construction management. Compared with airborne LiDAR, it can perform a complete acquisition of surface feature information, which is conducive to the collection of morphological and structural information below the vegetation canopy. Vehicle-borne LiDAR point clouds can be used to obtain more accurate morphological and structural information of vegetation than airborne LiDAR, allowing the extraction of phenotypic parameter information such as LAI, in contrast with traditional field surveys of plant resources [13]. Popescu used local filtering techniques to separate trees from deciduous, coniferous, and mixed forests to extract individual tree structural parameters [14]. Hyyppa calculated the CV value of individual trees based on an extracted point cloud [15,16]. Li developed a top-down regional growth Point Cloud Segmentation (PCS) to segment complex mixed forests [17]. Tao used Comparative Shortest-Path (CSP) to verify its accuracy, and the segmentation accuracy was as high as 94% [18].
This study innovatively combines LiDAR technology to explore the impact and intensity differences of the morphological structure and canopy geometry of urban street trees in typical temperate regions on microclimate regulation. Based on LiDAR point cloud models of main roads in the high-density urban area of Zhumadian, the CV, CA, CD, TH, and Diameter at Breast Height (DBH) eigenvalues of six key street trees were extracted and their canopy geometric characteristics summarized. The microclimate characteristic values of air temperature, relative humidity, and luminosity in the lower space of street trees were obtained through field measurement, and the regulation effect of different morphological structure characteristics on microclimate factors was explored. Following this, the PET index measuring human comfort was used as the standard to quantify the intensity of microclimate regulation, and the regulation benefit of canopy geometric characteristics on PET index was discussed, providing a quantitative reference for selecting street tree forms with better human comfort in temperate regions.

2. Materials and Methods
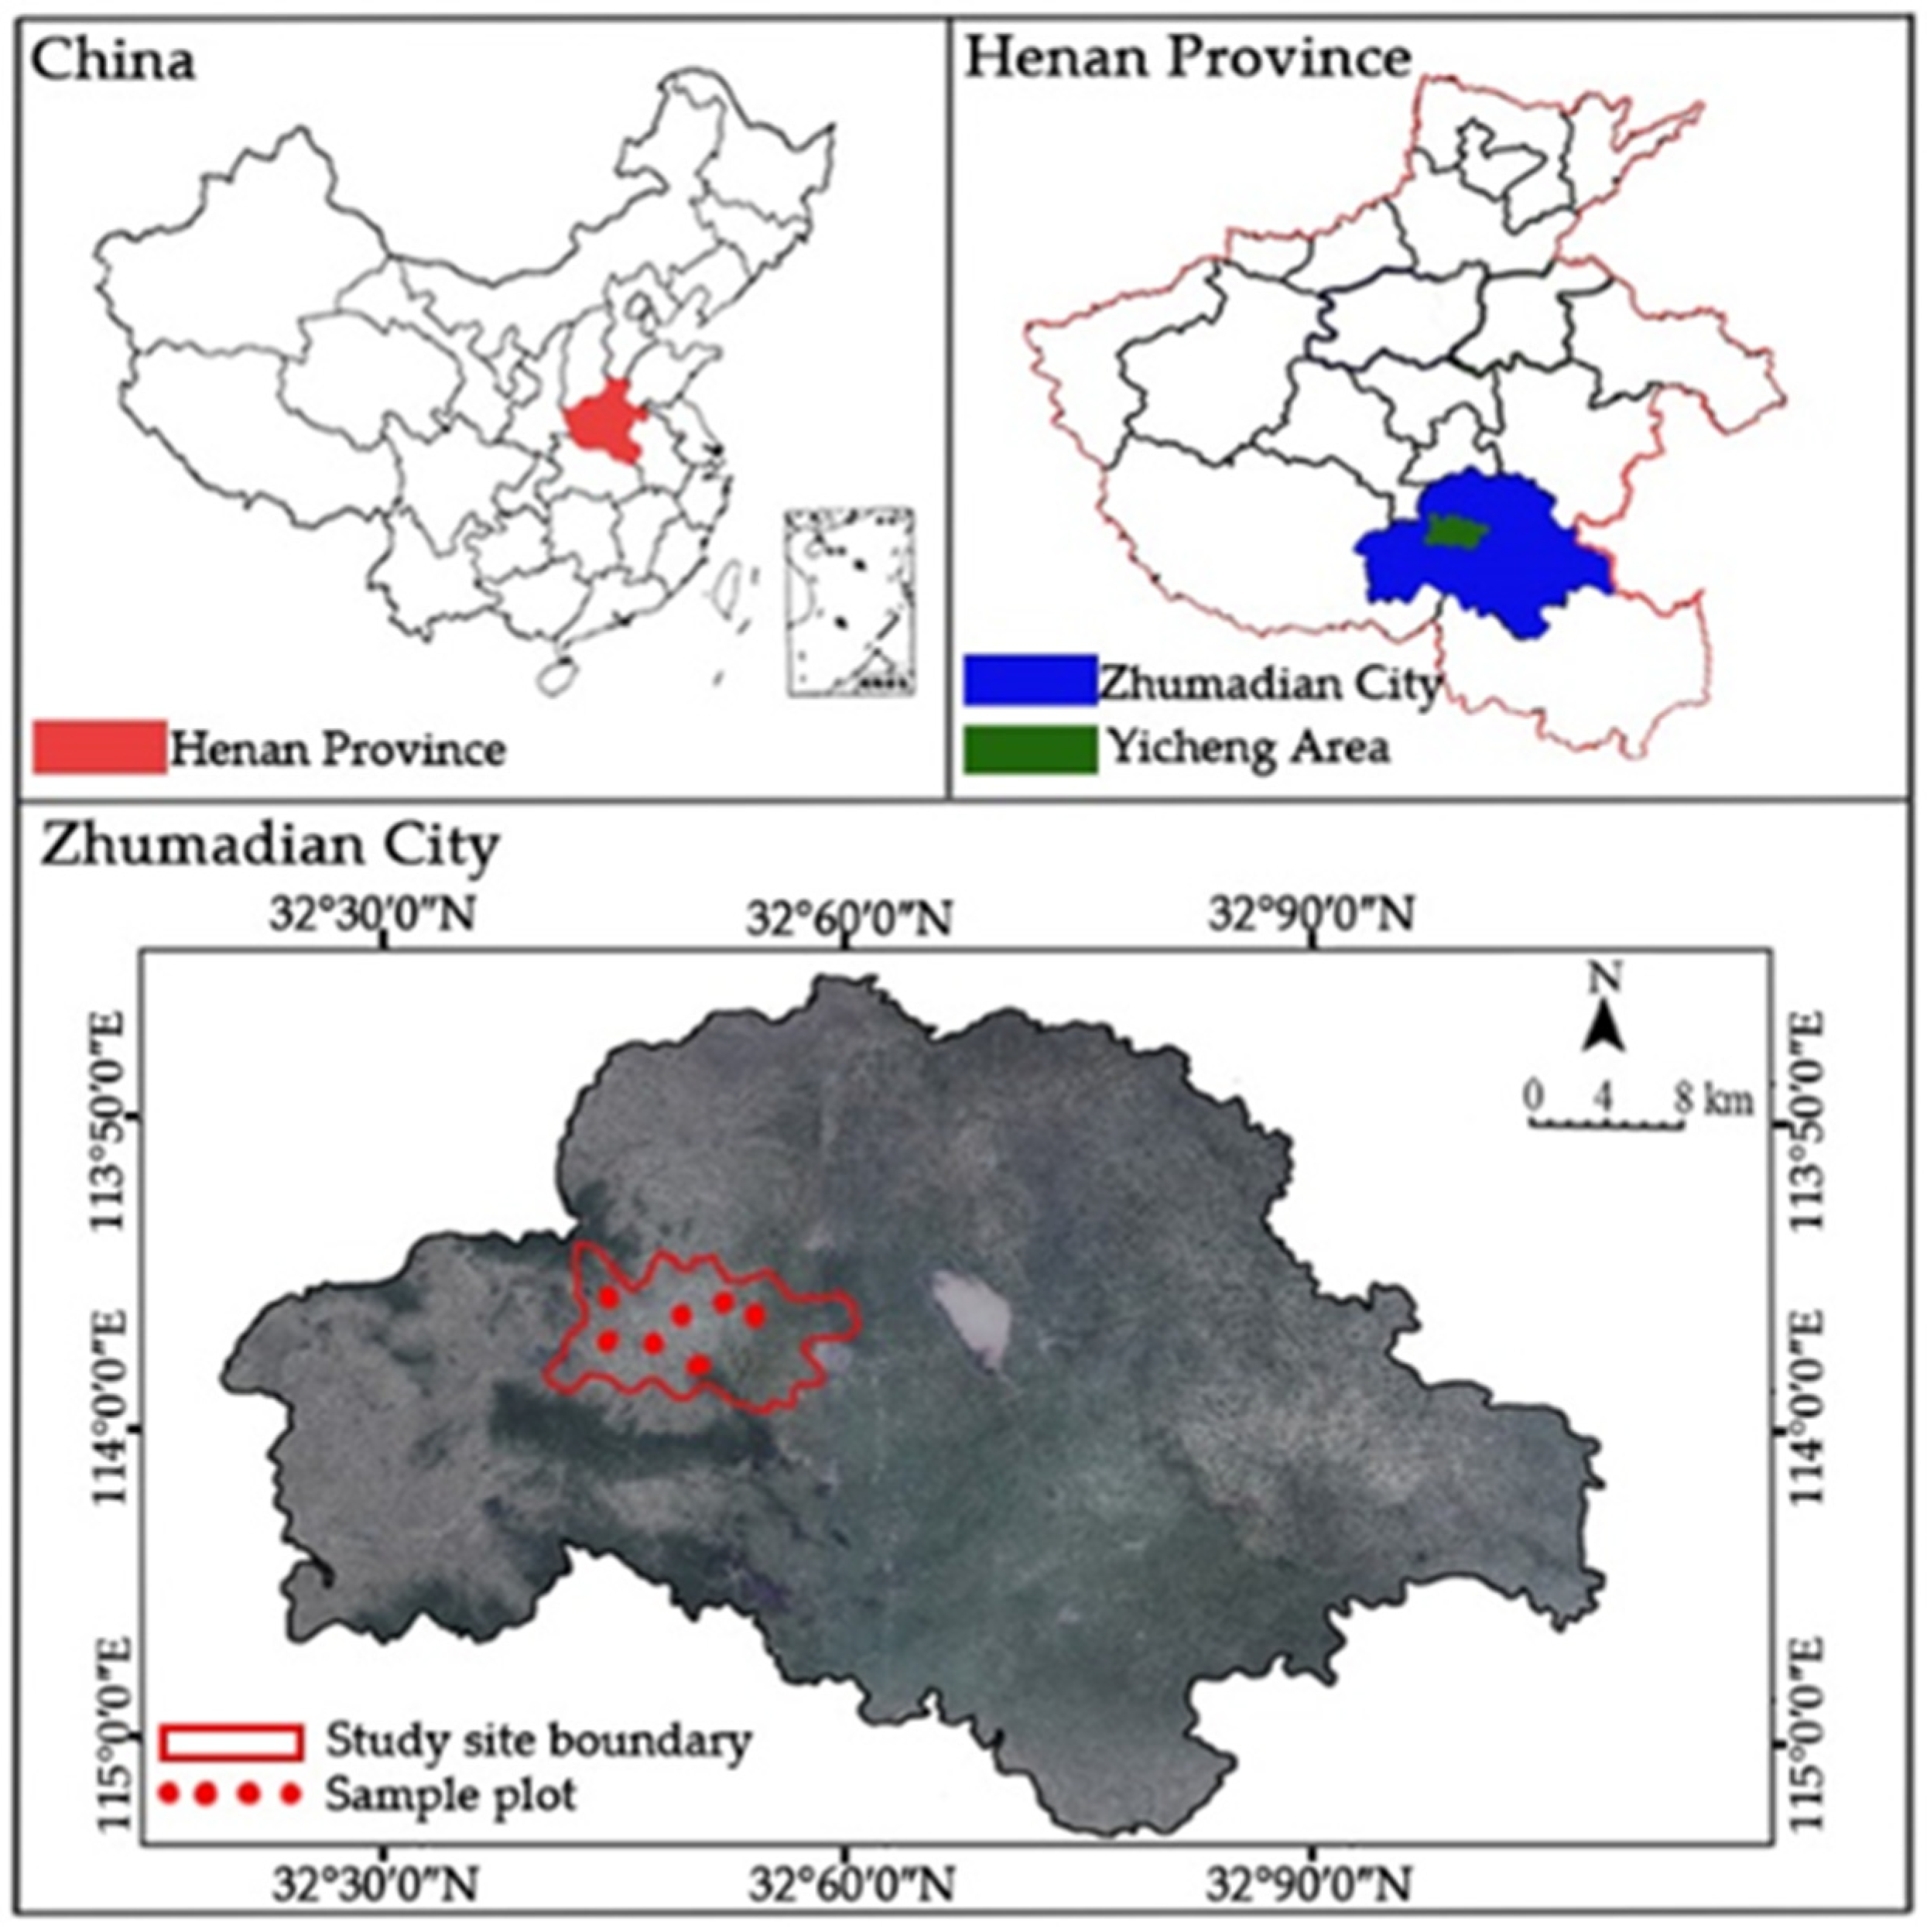
2.1. Study Area

The study area is located in Zhumadian City, Henan Province (32°18′~33°35′ N, 113°10′~115°12′ E). Zhumadian City is a typical continental monsoon type semi-humid climate with four distinct seasons. Its annual average temperature is 14.8 °C~15.4 °C; precipitation is 850 mm~980 mm; wind speed is 1.8 m/s~2.4 m/s; and cumulative total solar radiation is 112~120 KWh/cm2 (Figure 1) [19]. Six typical main roads in the main urban area were selected, including: Tongda Road, Zhengyang Road, Leshan Avenue, Cedar Avenue, Yulan Road, and Landmark Avenue. Additionally, a control check (CK) was selected in an open space of Tianzhong Academy located on Landmark Avenue. Zhengyang Road and Leshan Avenue run north-south (N-S), while Tongda Road, Cedar Avenue, Yulan Road, and Landmark Avenue run east-west (E-W) (Figure 2). The street trees within the study area can all be classified as mature (≥10 years) and are planted in a linear arrangement. The selected road boundary conditions (aspect ratio, length, building density) are generally consistent throughout the study area.

2.2. Data Acquisition

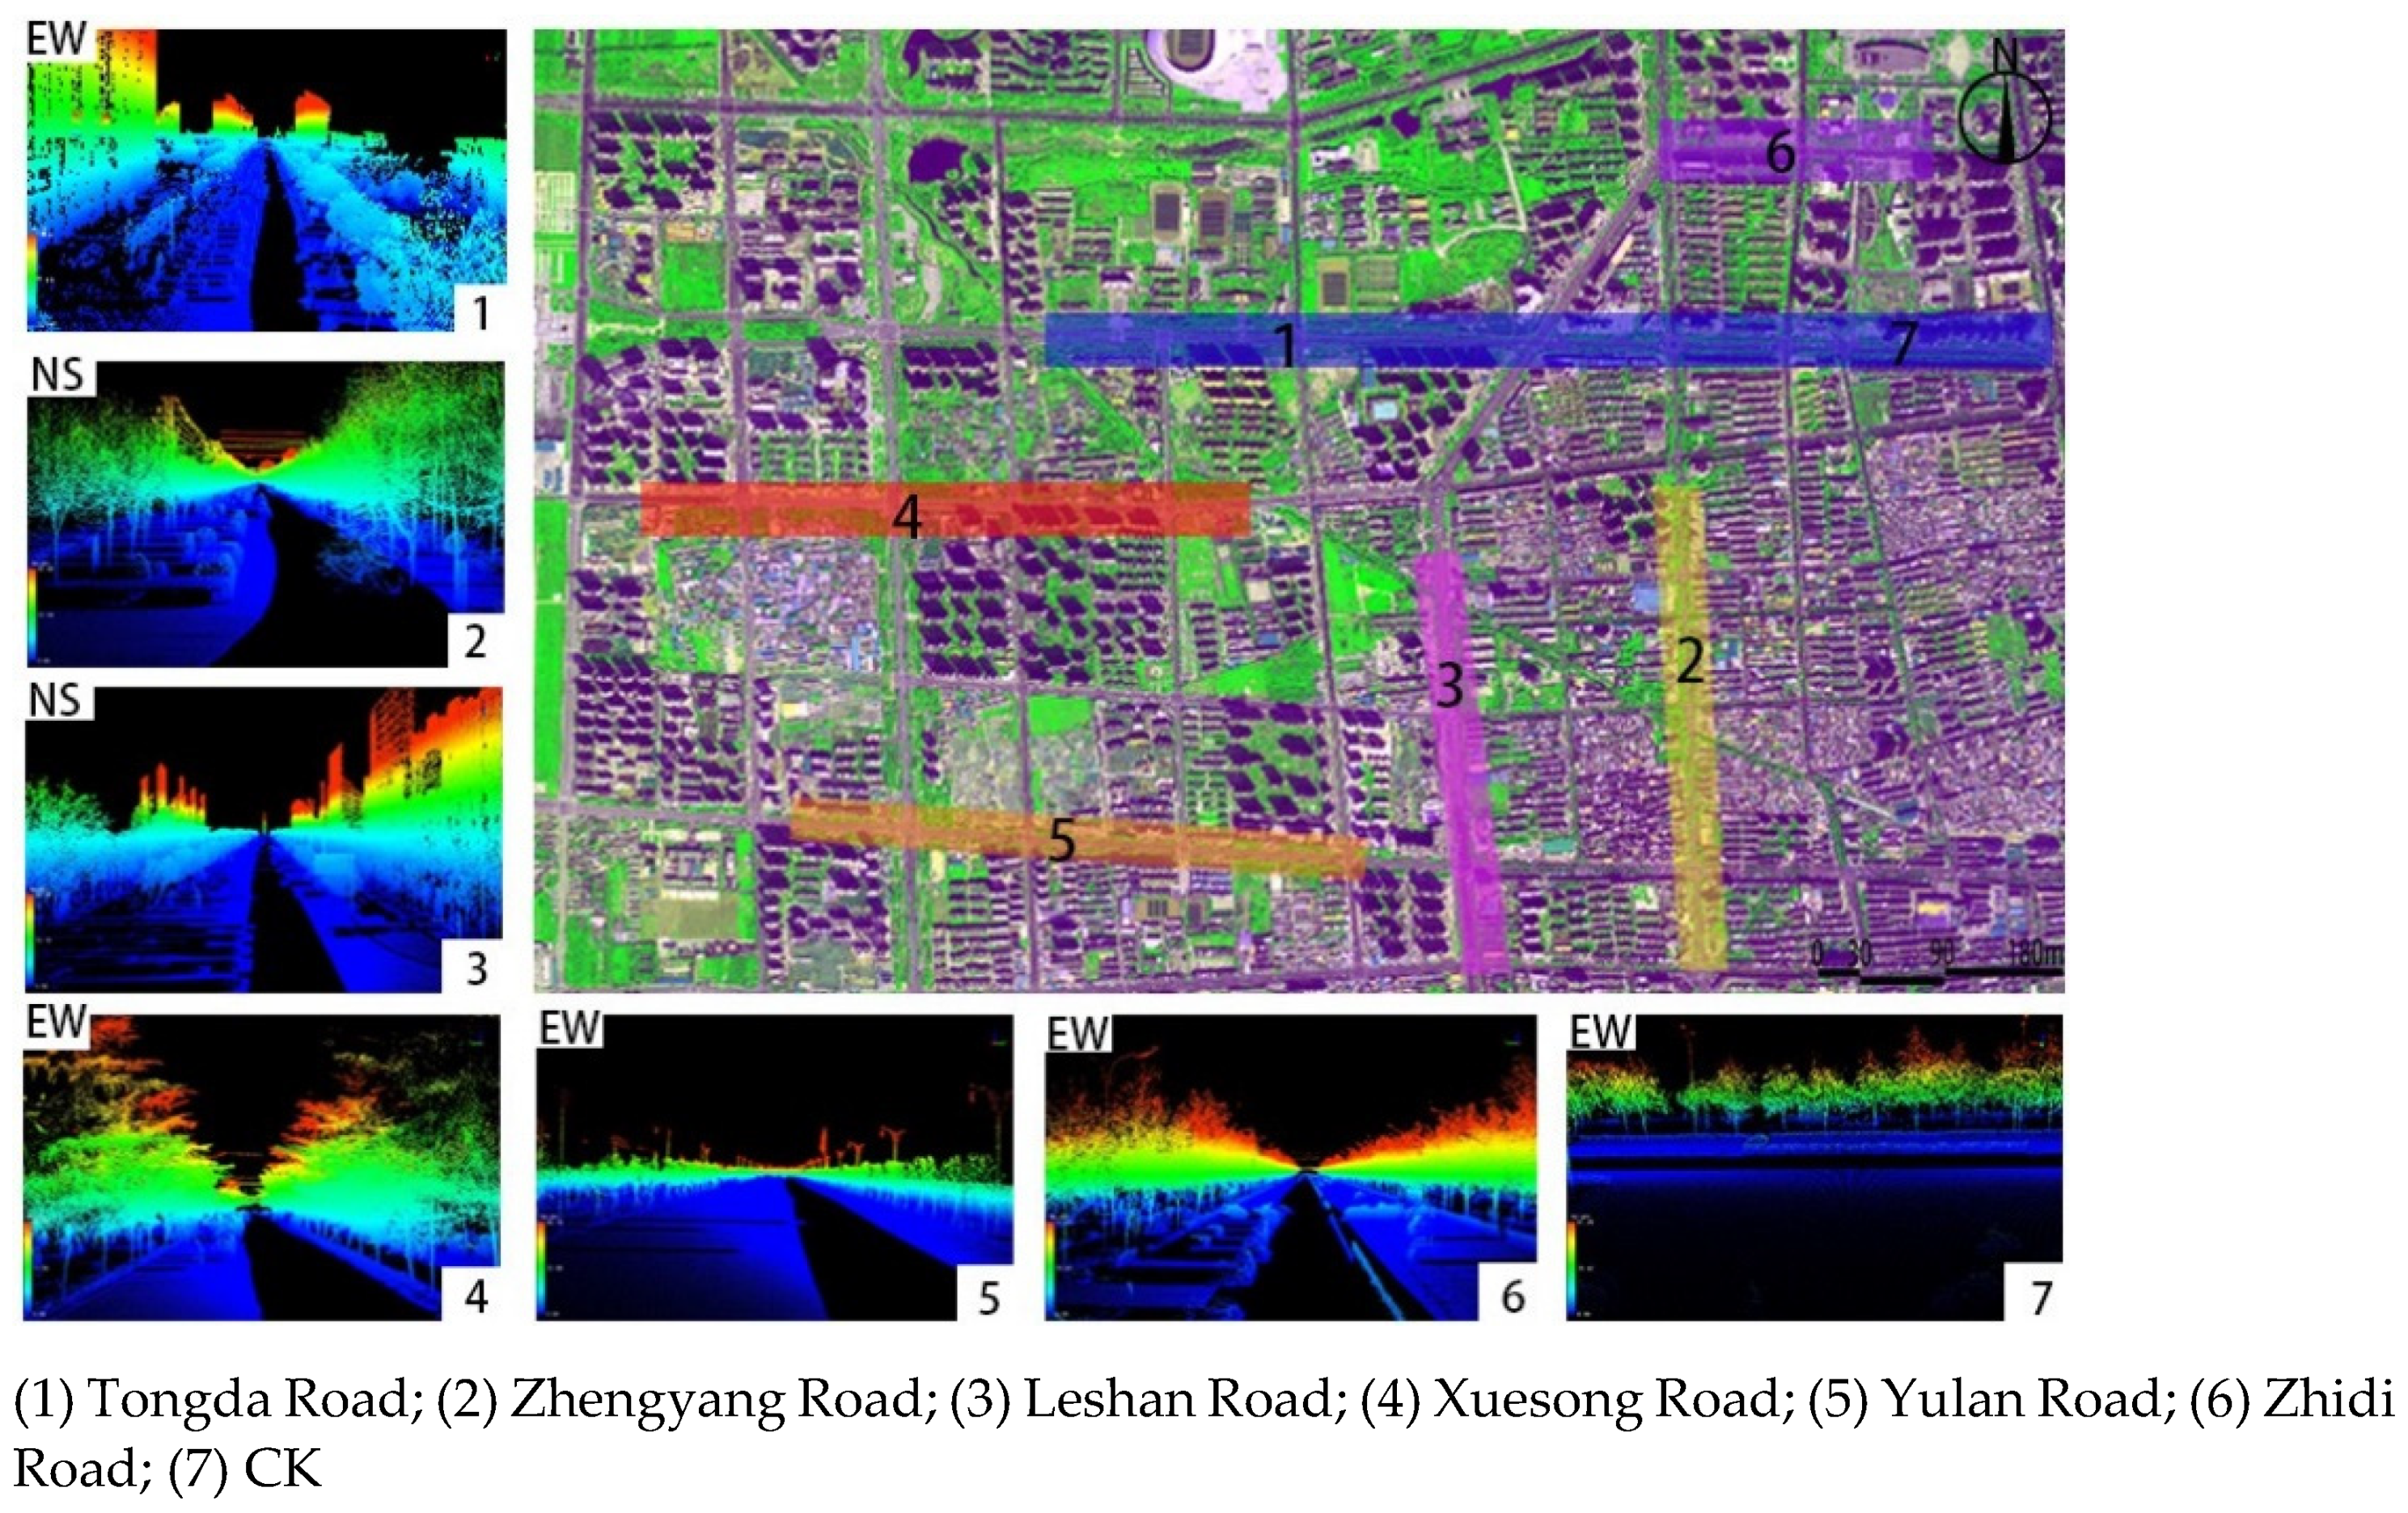
2.2.1. LiDAR Point Cloud Data Acquisition

A vehicle-borne LiDAR mobile scanning measurement was carried out on a test road using the AS-900HL mobile scanning system with the RIEGL VUX-1 UAV laser scanner, and equipped with an Inertial Measurement Unit (IMU) and Global Navigation Satellite System (GNSS). The measurement enabled capture of the high-precision color point clouds of streets and surrounding buildings, the extraction of key plant features, and 3D modeling of the surrounding environment. The horizontal field of view of the laser scanner is 0°~360°, the 112 scanning frequency is 10–200 Hz, the accuracy is better than 10 mm, and the weight is 3.75 g. The scanner rotates around the direction of traffic to scan the street environment. The captured HDR panorama has a resolution of 6000 × 4000, reaching 24.3 megapixels. The operation of the vehicle-borne LiDAR is carried out automatically according to the fixed point, and the operator controls the scanning to ensure the accuracy of the data. 1. The LiDAR Delta2A completes the map construction and determines the running track. 2. The operator selects the starting point and the end point. Cross driving was carried out on the test area, and the route was set as a closed loop to prevent deviation from the scanning route. This is critically important, as deviation from the scanning route has been shown to cause high rates of missing point cloud information that can lead to data deformation [20]. 3. The multi-scan method is used to complete the scan within 4 h.

2.2.2. Measurement of Microclimatic Factors

According to the weather records of the local meteorological bureau in August 2021, the climatic factors of air temperature, relative humidity, and luminosity have rich diurnal changes, and local microclimate characteristics are obvious. The 1st, 5th, and 8th are the most typical, which can represent the climatic characteristics of the entire month of August. On 1, 5 and 8 August 2021, a period of clear weather and peak crowd activity (10:00–16:00) was selected for data collection. According to the existing forestry and garden plant survey and site review in Zhumadian city, 6 key street tree species were selected as the test objects (Figure 3), and the microclimate factors were measured according to the road corresponding to the planting of 6 tree species. An LM-8000 environmental measuring instrument was used to collect the air temperature, relative humidity, and luminosity data at the vertical height of 1.5 m from the ground at 7 measuring points, and black ball temperature data were collected with the JTR04 thermometer. The test height is set at 1.5 m where the human body is most sensitive to temperature and humidity, and air temperature and relative humidity are important factors that affect human comfort in environmental factors. The measurement location is in the space under the tree canopy in the middle of the road. In addition, the control point (CK) was set in the open space of Tian Zhong Academy of Landmark Avenue to facilitate the comparison of the differences in climatic factors of different tree species. During the sampling period, the actual measurement was performed once an hour. For each measurement, four groups of data were captured in four directions at the same measurement point. The measurement time of each group of data lasted 2–3 min, and the average value of each group of data was recorded [21]. Methodology for conducting microclimate research: The microclimate test is carried out according to the previous research standards. In this paper, the method of combining on-the-spot measurement, LiDAR scanning, and model simulation is used to study the road climate environment in Zhumadian city. It is mainly divided into four parts: 1. Field measurement of climate factors. 2. LiDAR scanning to extract tree species canopy information. 3. RayMan model to simulate human comfort value. 4. Data analysis. The basic parameters of each sampling equipment are shown in Table 1.

2.3. Data Processing

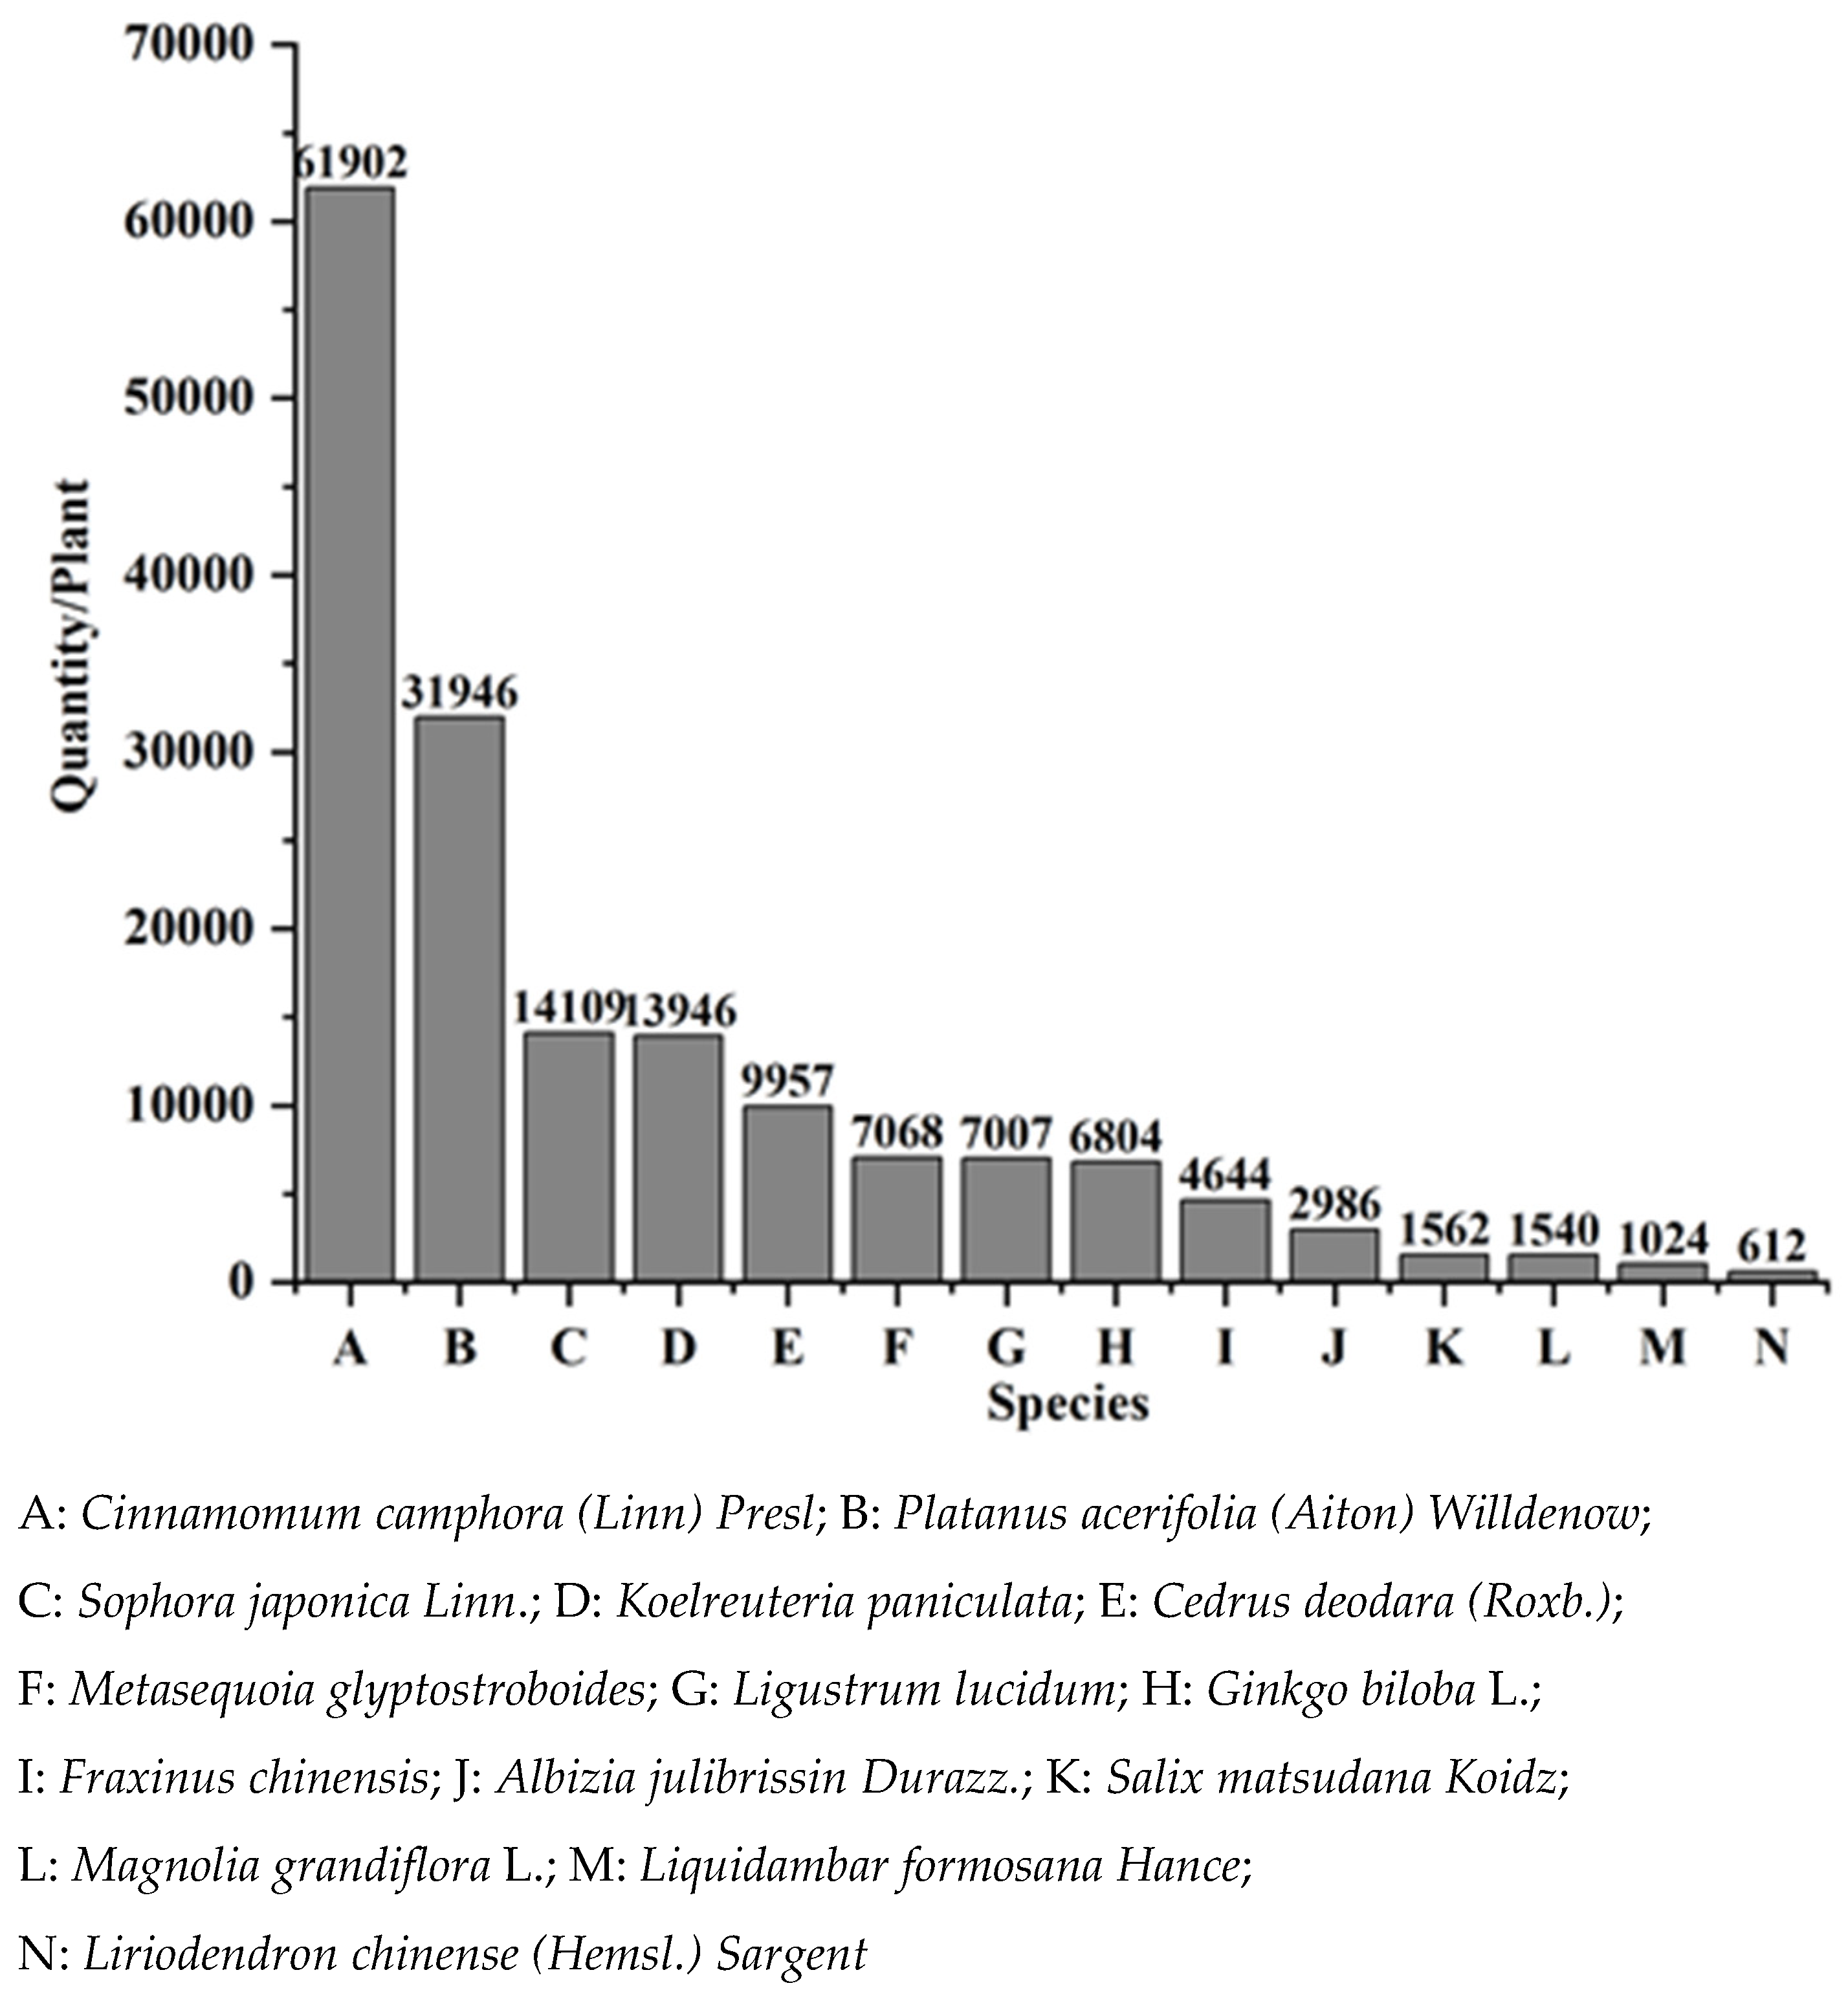
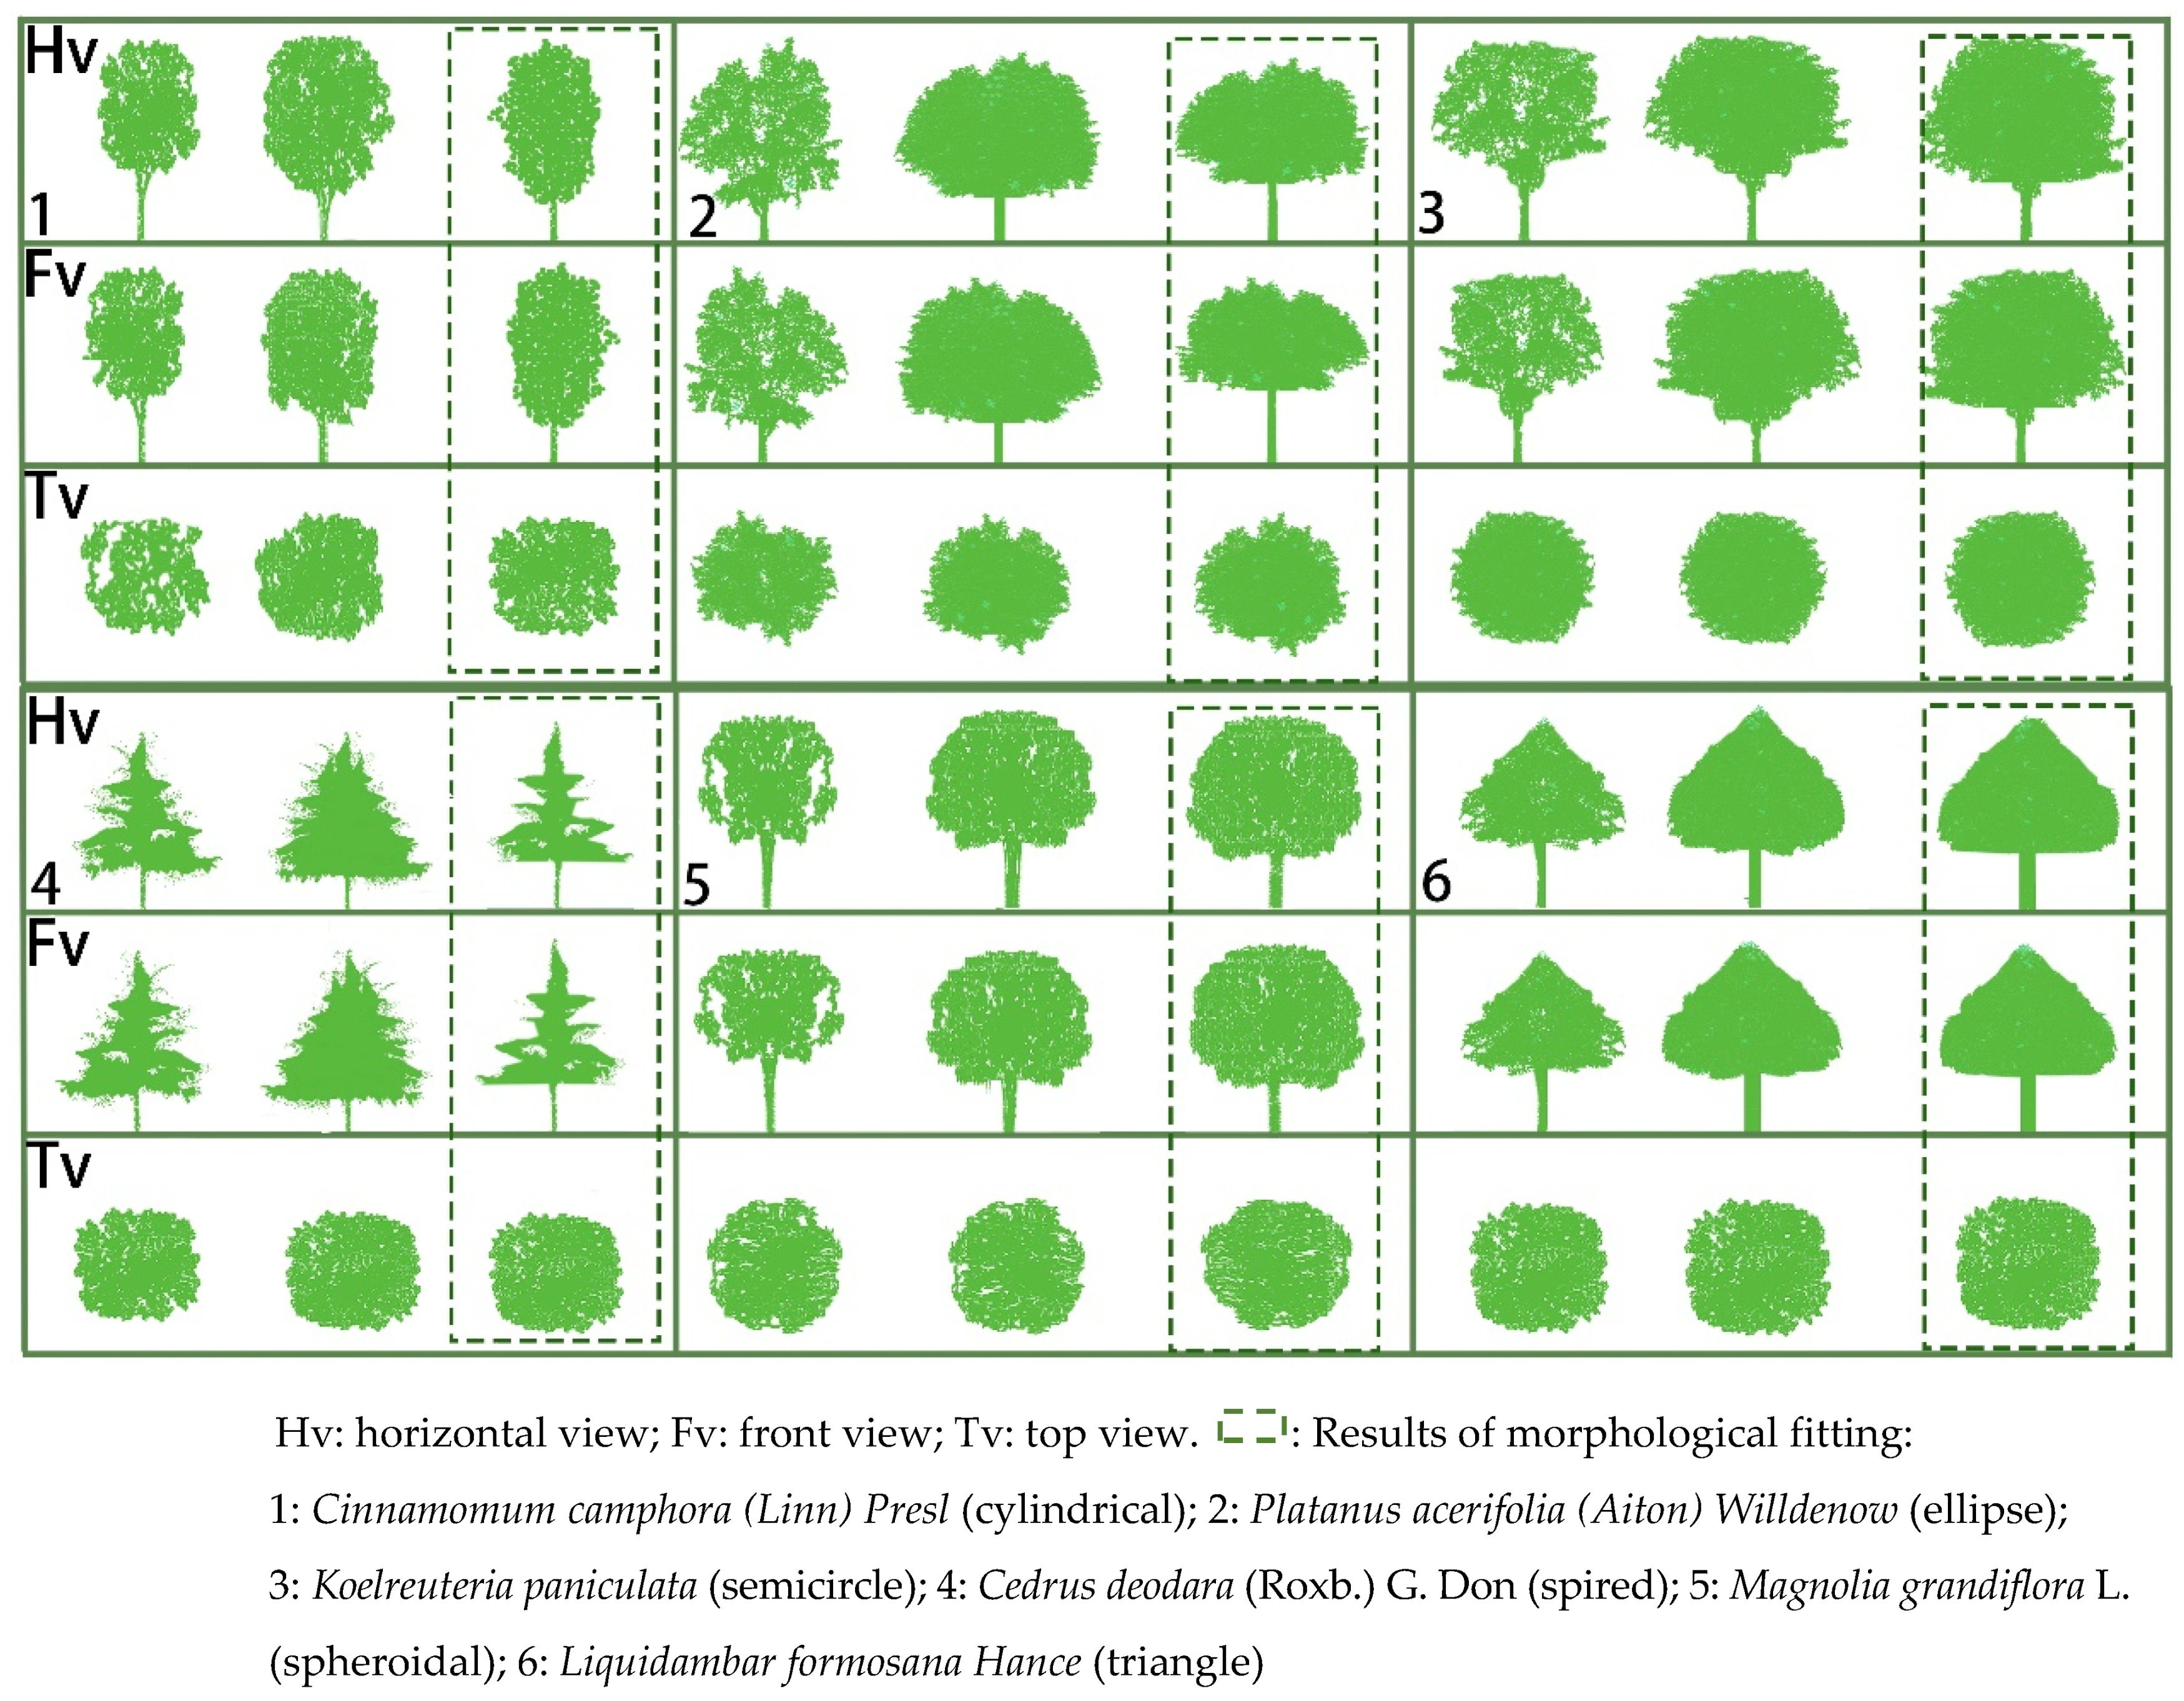
2.3.1. Morphological and Structural Characteristics of Street Trees

After the vehicle-borne LiDAR scan was completed, the original point cloud was processed by LiDAR360 software. The processing included several steps: 1. Denoising to remove redundant noise from the point cloud; the number of neighborhood points was set to 10, and the standard deviation multiple was set to 5, in order to improve the quality of the point cloud. 2. Ground point filtering to separate ground points from the point cloud; the grid size was set to 0.5, and the thickness of the ground point was set to 0.3. This provided a basis for the accuracy of the next step (the CSP algorithm). 3. Regional ground point classification to reclassify buildings within, ground, and plants point clouds. 4. Ground point normalization to remove the influence of topographic relief on point cloud elevation. 5. Use of the CSP algorithm to separate single trees from the overall street tree point cloud; the clustering threshold was set to 0.2, which controlled single tree detection and single tree canopy point cloud growth. The larger the value, the higher the segmentation efficiency, but too high affects the segmentation effect. The minimum number of clustering points was set to 500. This value mainly affects the growth of the point cloud of a single tree canopy. The smaller the value, the better the segmentation effect. By adjusting the two values, the optimal segmentation effect can be achieved. 6. After the single wood is divided, the information of the single wood is generated in a CSV table; followed by the extraction of CSV tables to include the morphological and structural parameters of single trees, including CV, CA, CD, TH, and DBH values [18]; and the manual correction of the separation results using seed point editing. 7. Obtaining the LAI value of tree canopy at each measuring point using the CI-110 canopy analyzer to supplement the CSV table.

2.3.2. Classification of Street Canopy Geometric Features

The street tree canopy in the study area exhibited varying geometric characteristics in the front, side, and top perspectives, creating a specific impact on the shade of the canopy [22,23]. According to the existing forestry and garden plant survey and site review in Zhumadian city, six tree species (Figure 3) of key street trees were selected as test objects [24]. Due to the morphological similarity among the major tree species, six different morphological tree species were selected based on both the trees’ garden ornamental characteristics, as well as the overall the number of each tree species within the study area. Following the selection of six key tree species, point cloud contour fitting was carried out for each species. The 100 points cloud files of the six street trees were extracted from the original point cloud model. LiDAR360 software was then used to raster and intercept three views of point cloud of each street tree, with each view then imported into Adobe Photoshop 2017 software using the planar pixel grid. The grid size was set to 30 × 30 pixels, with a geometric feature fitting carried out for each view of the street tree. Following this, the geometric feature contour each tree was drawn (Figure 4). The fitting results fit into a range of geometric categories: cylindrical (Cinnamomum camphora (Linn) Presl); oval (Platanus acerifolia (Aiton) Willdenow); semi-circular (Koelreuteria paniculata); spire (Cedrus deodara (Roxb.) G. Don); spherical (Magnolia grandiflora L.); and triangular (Liquidambar formosana Hance).

2.3.3. Quantization of Physiological Equivalent Temperature (PET)

PET refers to an indoor or outdoor temperature corresponding to the skin temperature and internal temperature of the human body reaching the same thermal state as that of a typical indoor environment. In simple terms, the higher the PET value, the hotter the weather. In this paper, PET was used as the evaluation index of spatial thermal comfort in the lower part of the plant. After the measured microclimate factors were input into RayMan1.2, time data, geographic data, personal data, clothing activity data, and Tmrt value were added to simulate the measured microclimate data (Table 2), and the PET index was obtained.

A RayMan Model

In this study, the RayMan model was used to simulate and calculate the PET value of each measuring point. This model is a micro-scale model developed by Professor Matzarakis Andreas and his team at the University of Freiburg, Germany, for calculating thermal comfort parameters [25]. It is used to calculate thermal radiation flux and to evaluate and simulate the thermal environment. By inputting meteorological parameters such as cloud cover, wind speed, air temperature, relative humidity, and human body information (such as the age, gender, height, and weight of the tested person), the PET value of the human body under different space–time conditions is calculated. (https://www.urbanclimate.net/rayman/introraymanpro.htm, accessed on 3 April 2021)

B Mean Radiant Temperature

Mean Radiant Temperature (Tmrt) is an important parameter for evaluating the thermal comfort of the human body, and it is also a necessary parameter for calculating the input of different thermal indices, including PMV, SET, and PET. Tmrt converts the physiological effects of short-wave and long-wave radiation fluxes in the environment on human beings into units of degrees Celsius, representing the uniform temperature of the environment around a hypothetical black body radiation. The calculation formula of Tmrt according to Lintp and Hienn [26] is:
T m r t = T g + 273 4 + 1.10 × 10 8 V a 0.6 ε D 0.4   T g T a 1 4 273
Among them, T g is the black ball temperature (°C); T a is the air temperature; V a is the wind speed (m/s); and D is the black ball diameter (m) (D = 0.05 m in this study). According to previous studies, the emissivity of this paper is chosen to be 0.95 [27].

3. Results

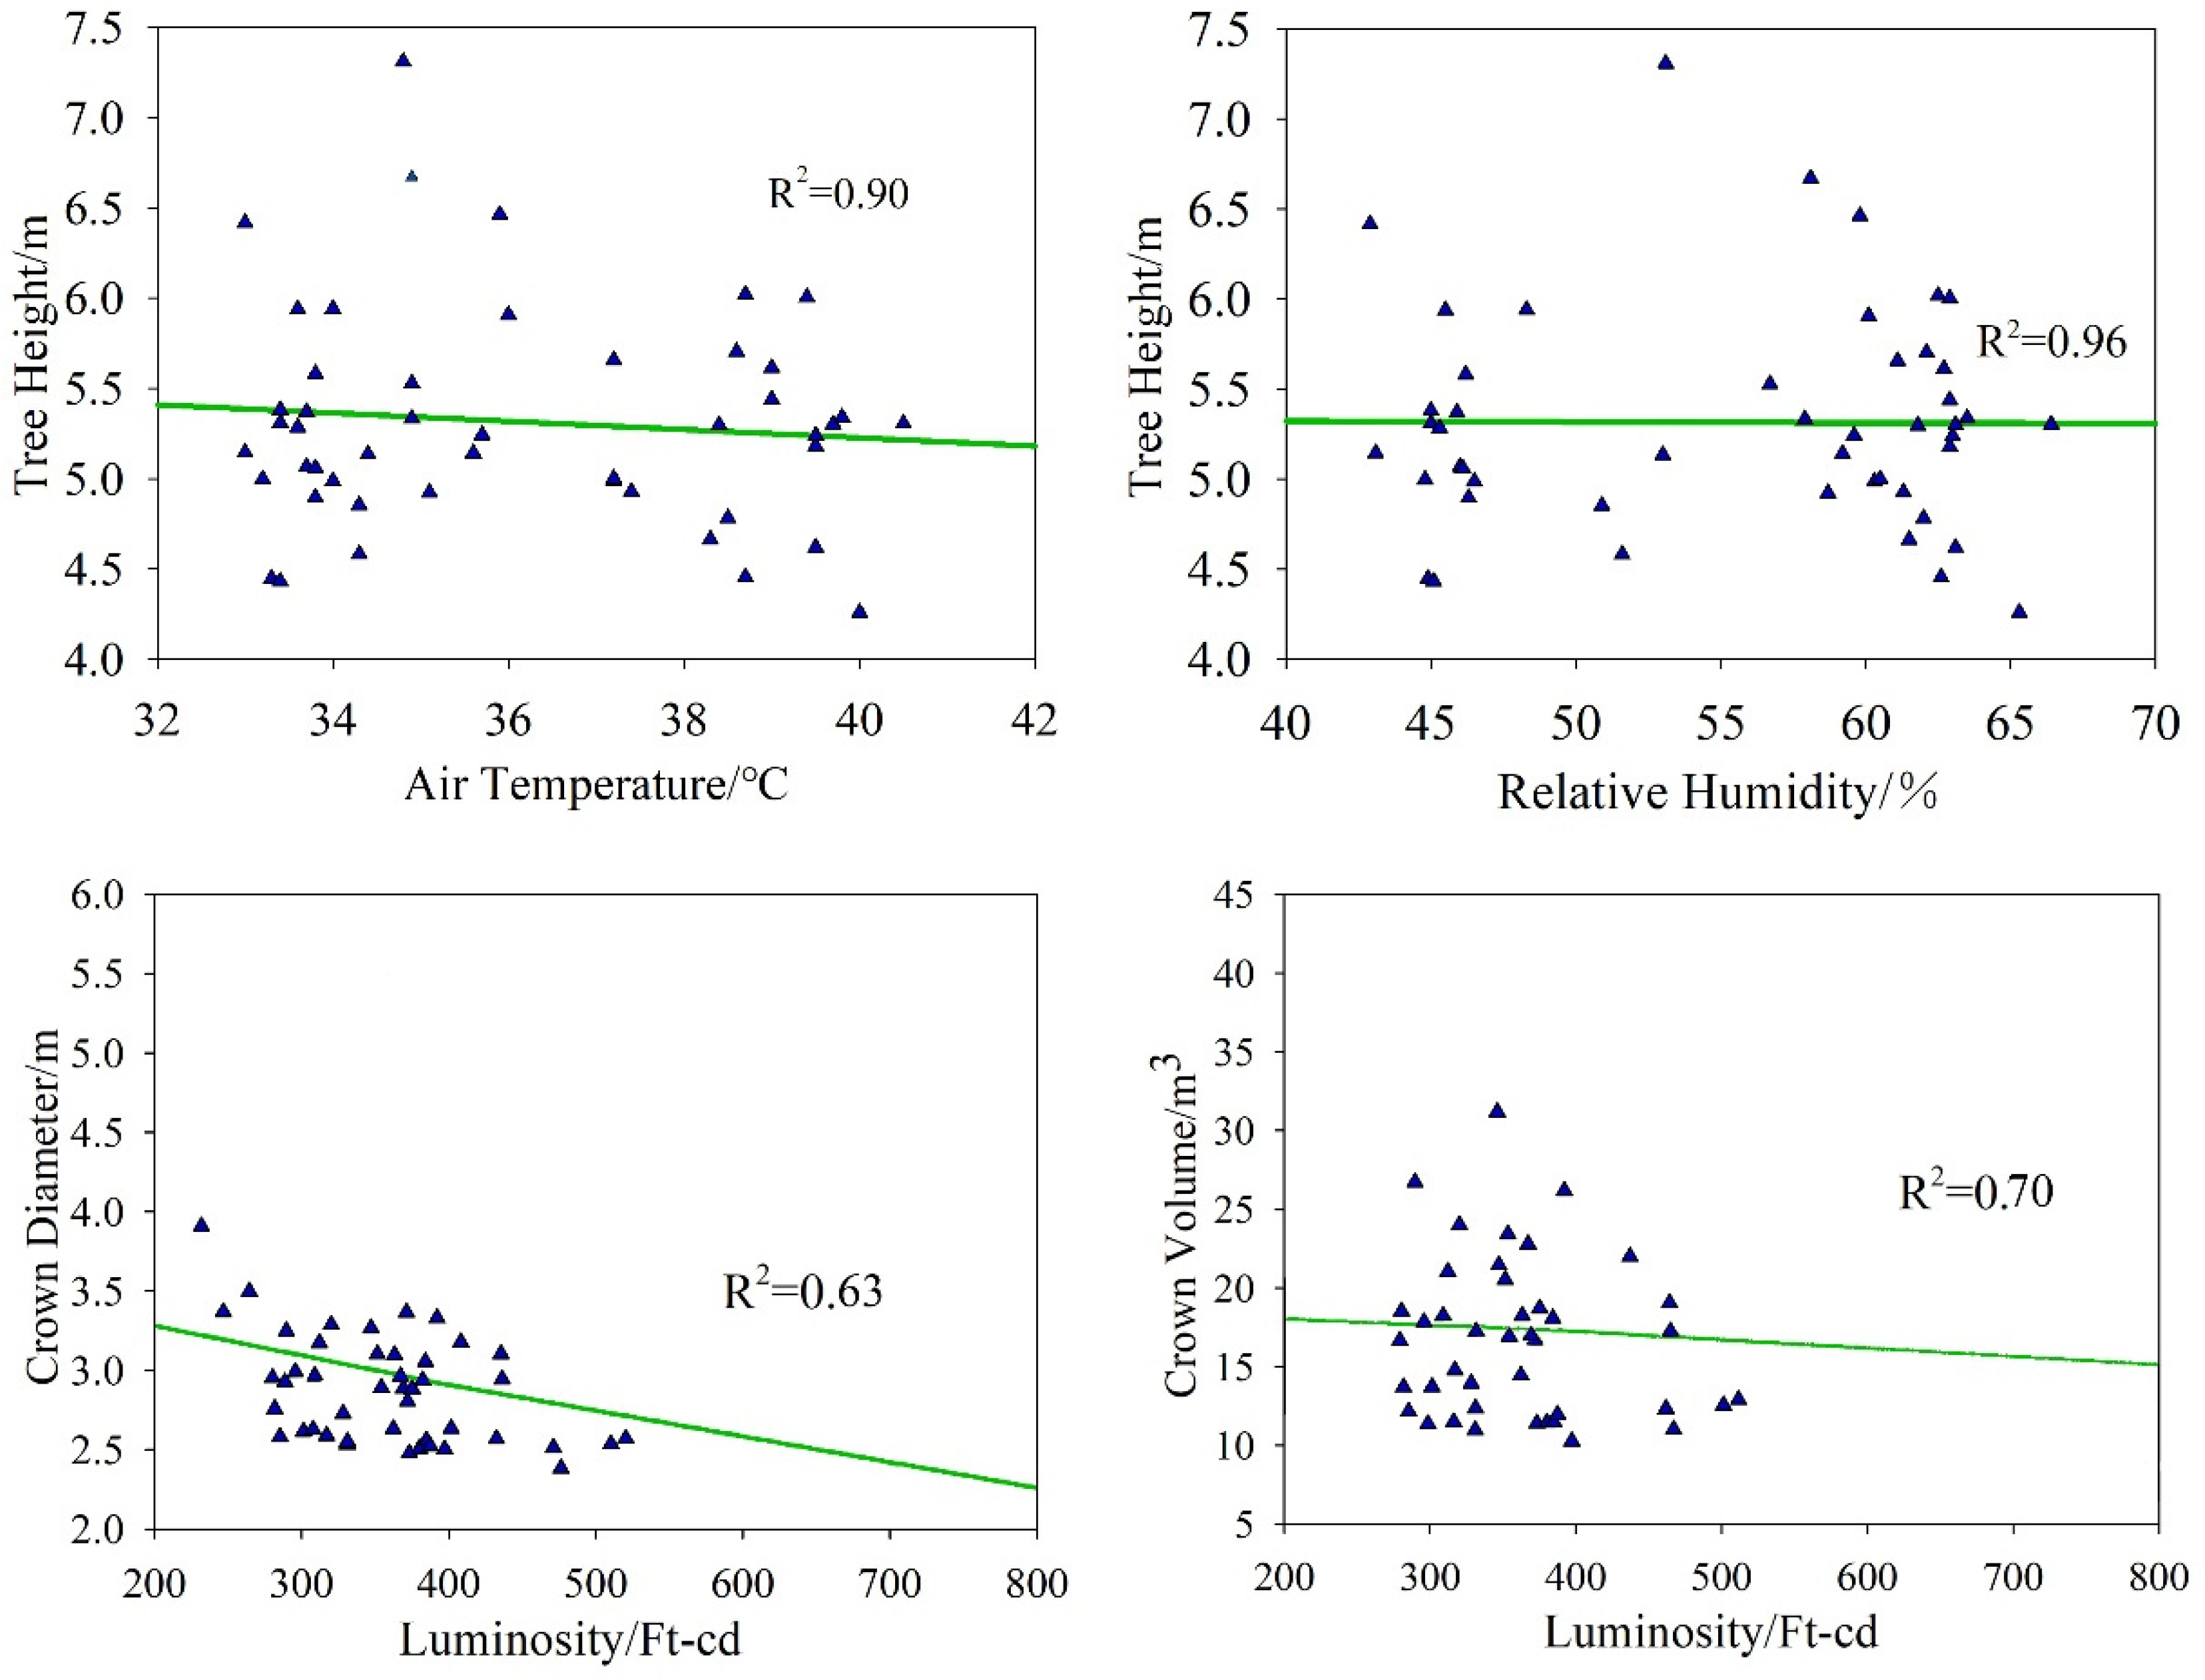
3.1. Correlation Analysis between Morphological Structure Characteristics of Street Trees and Microclimate Factors

SPSS 22.0 was used to analyze the main microclimate factors of six street trees. The results showed that the influence of street trees on air temperature, relative humidity, and luminosity showed extremely significant differences (p < 0.01). The correlation analysis between morphological structure characteristics and microclimate factors (Table 3) showed that: CV, CA, CD, and TH were negatively correlated with air temperature, relative humidity, and luminosity (p < 0.05). There was no obvious correlation between DBH and air temperature, relative humidity, and luminosity. The linear regression analysis of morphological structure characteristics and microclimate factors showed that TH had a significant effect on air temperature and relative humidity, with an R2 of 0.90 and 0.96, respectively. CV and CD had significant effects on luminosity, with an R2 of 0.70 and 0.63, respectively (Figure 5).

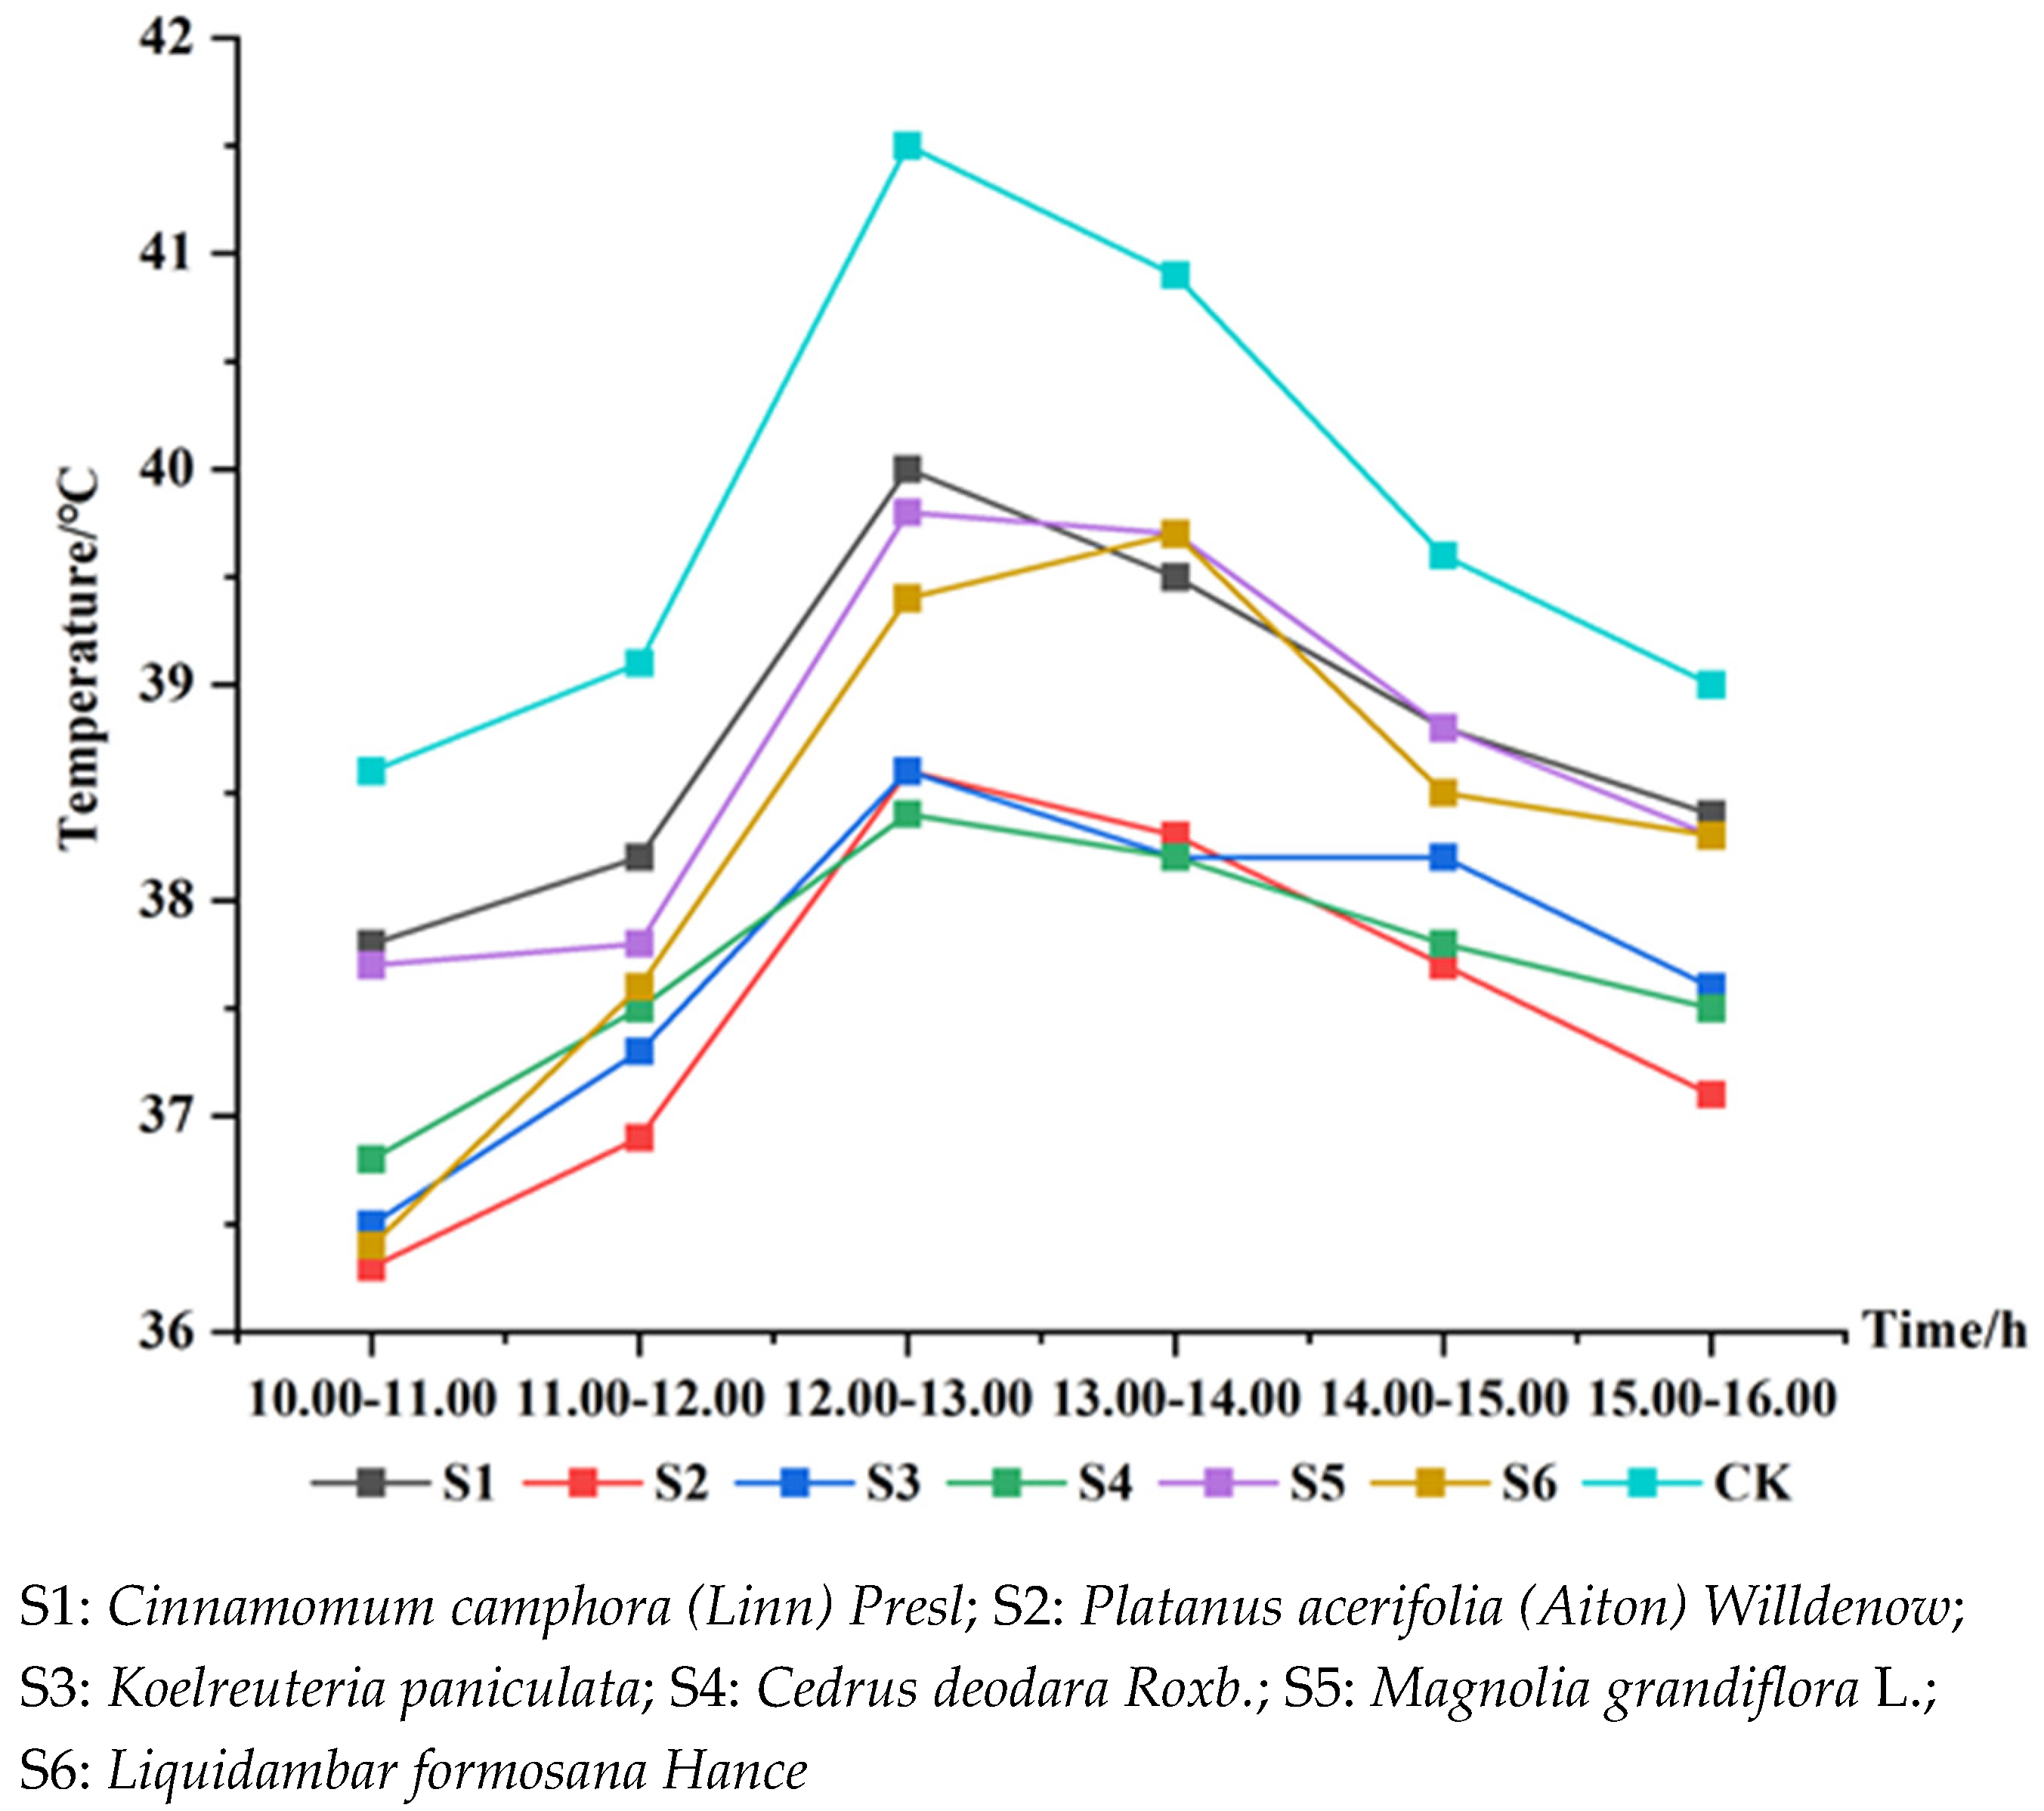
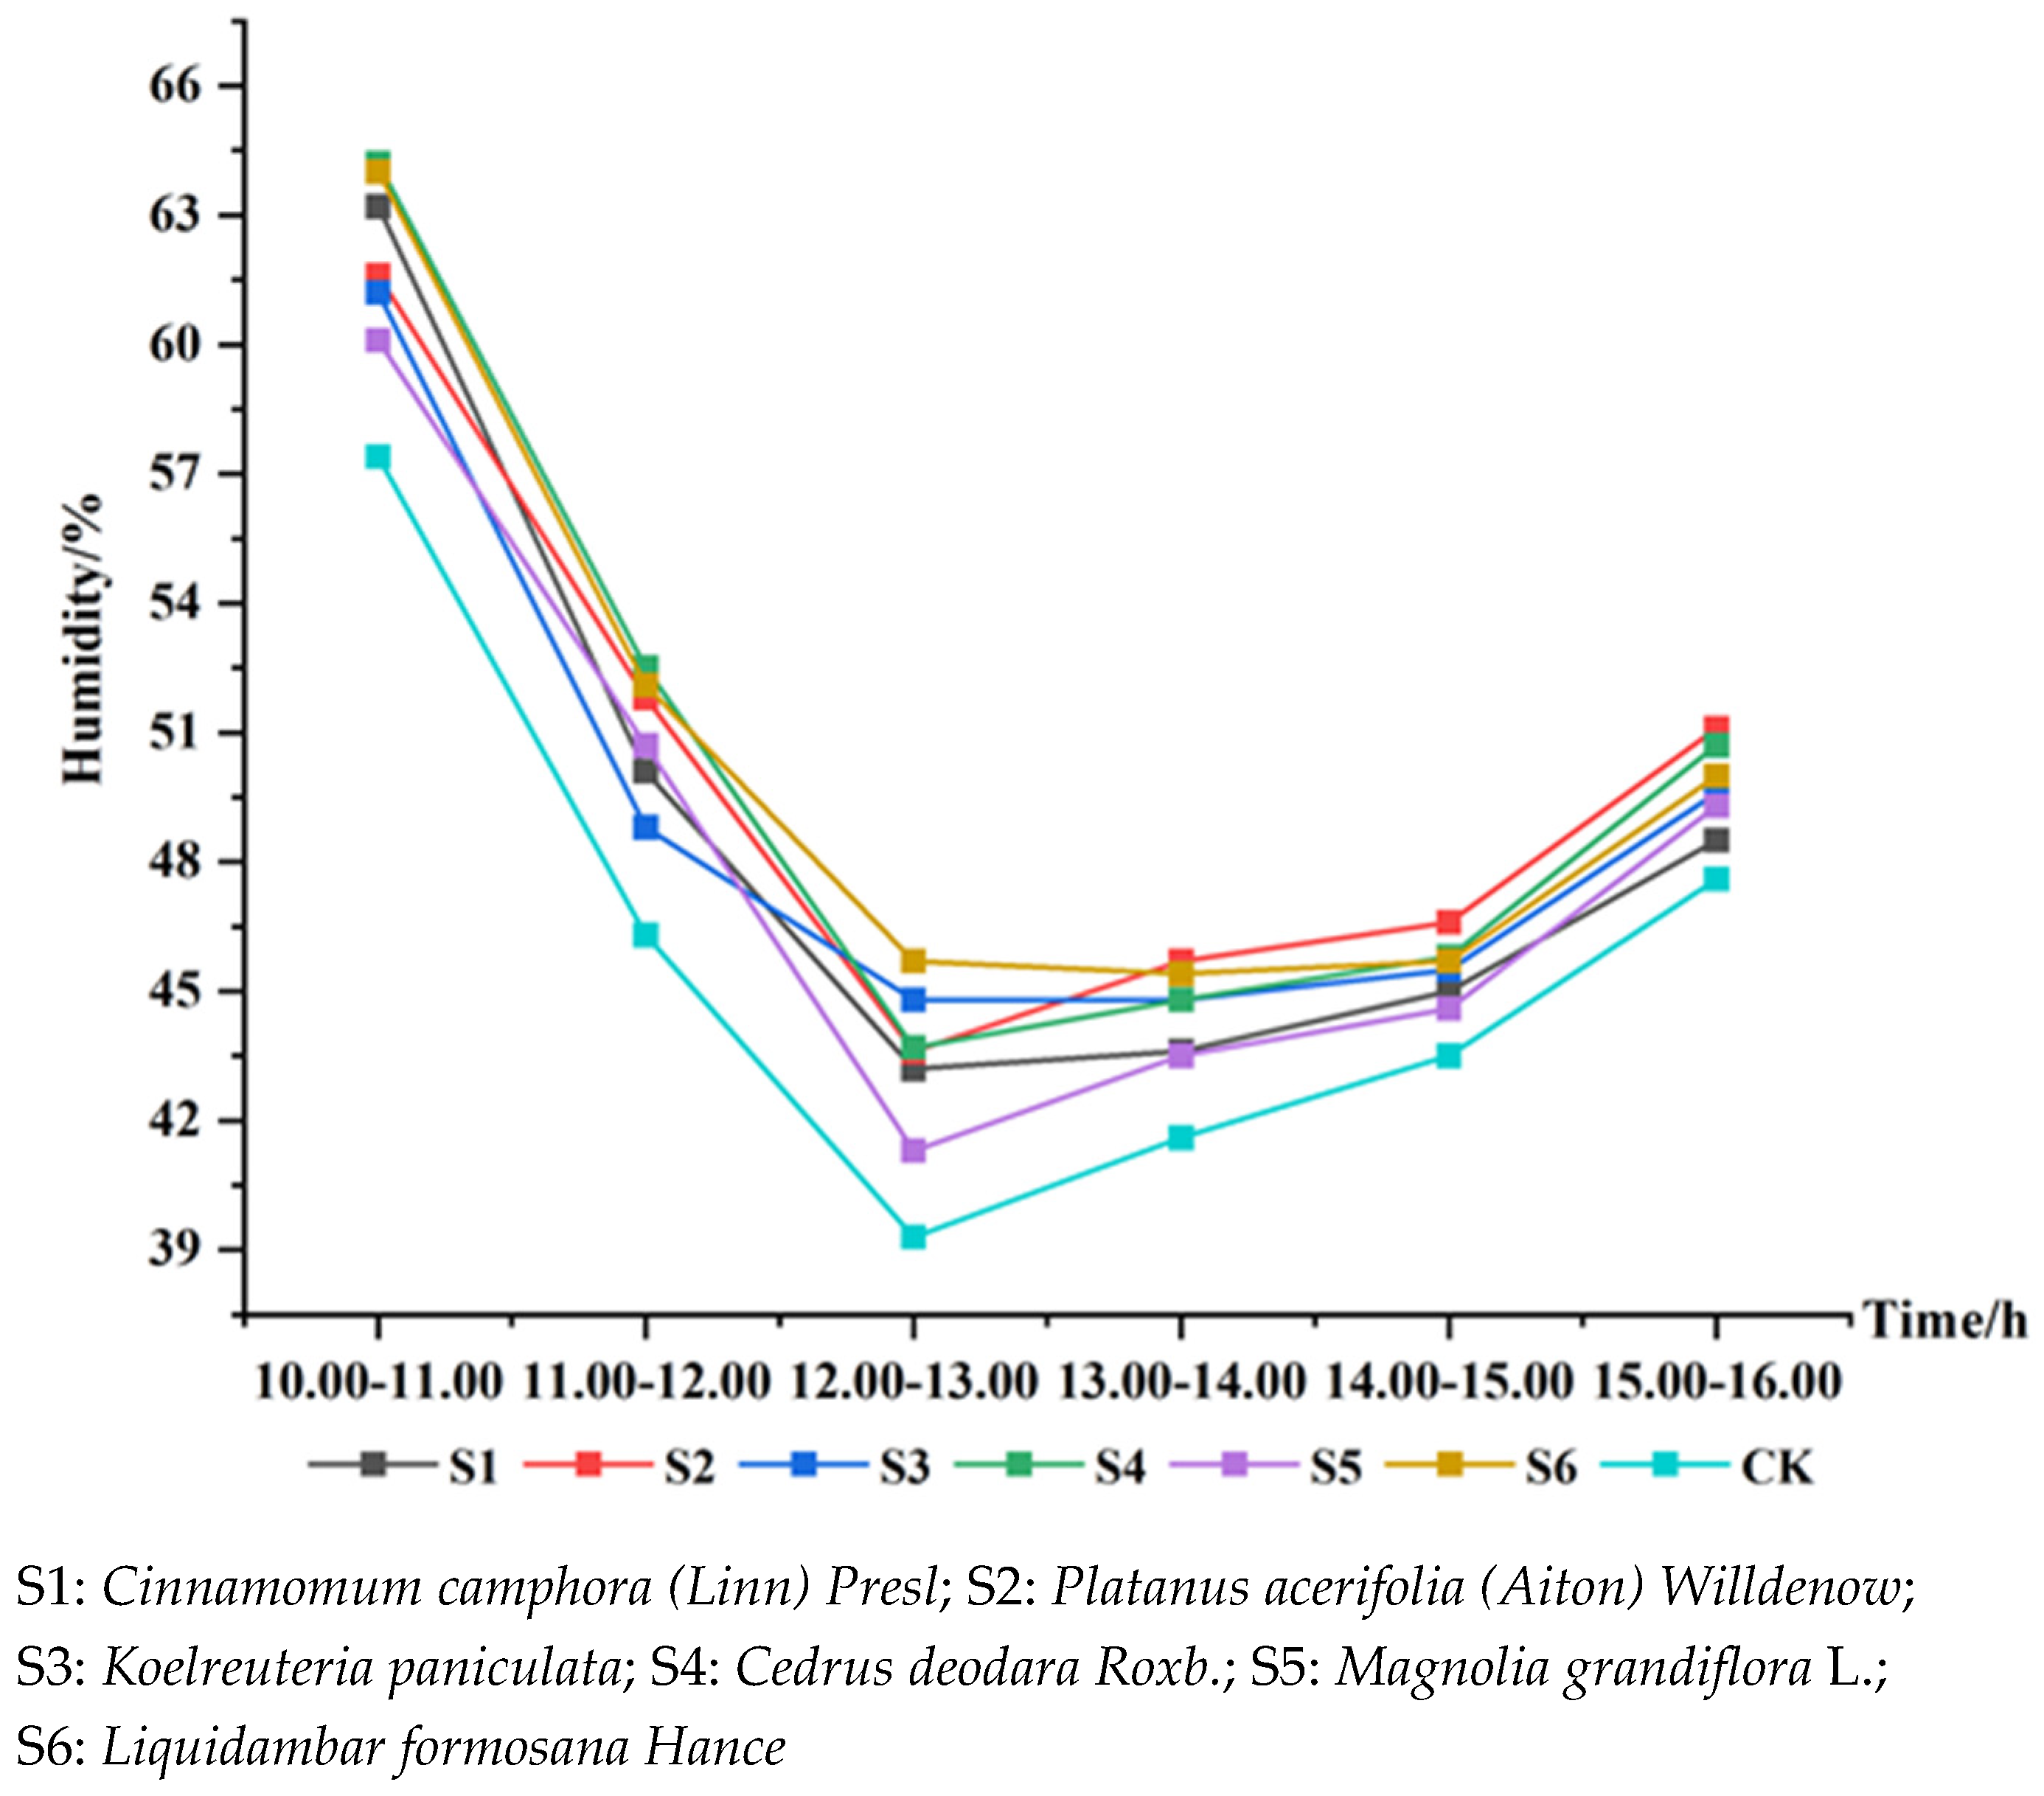
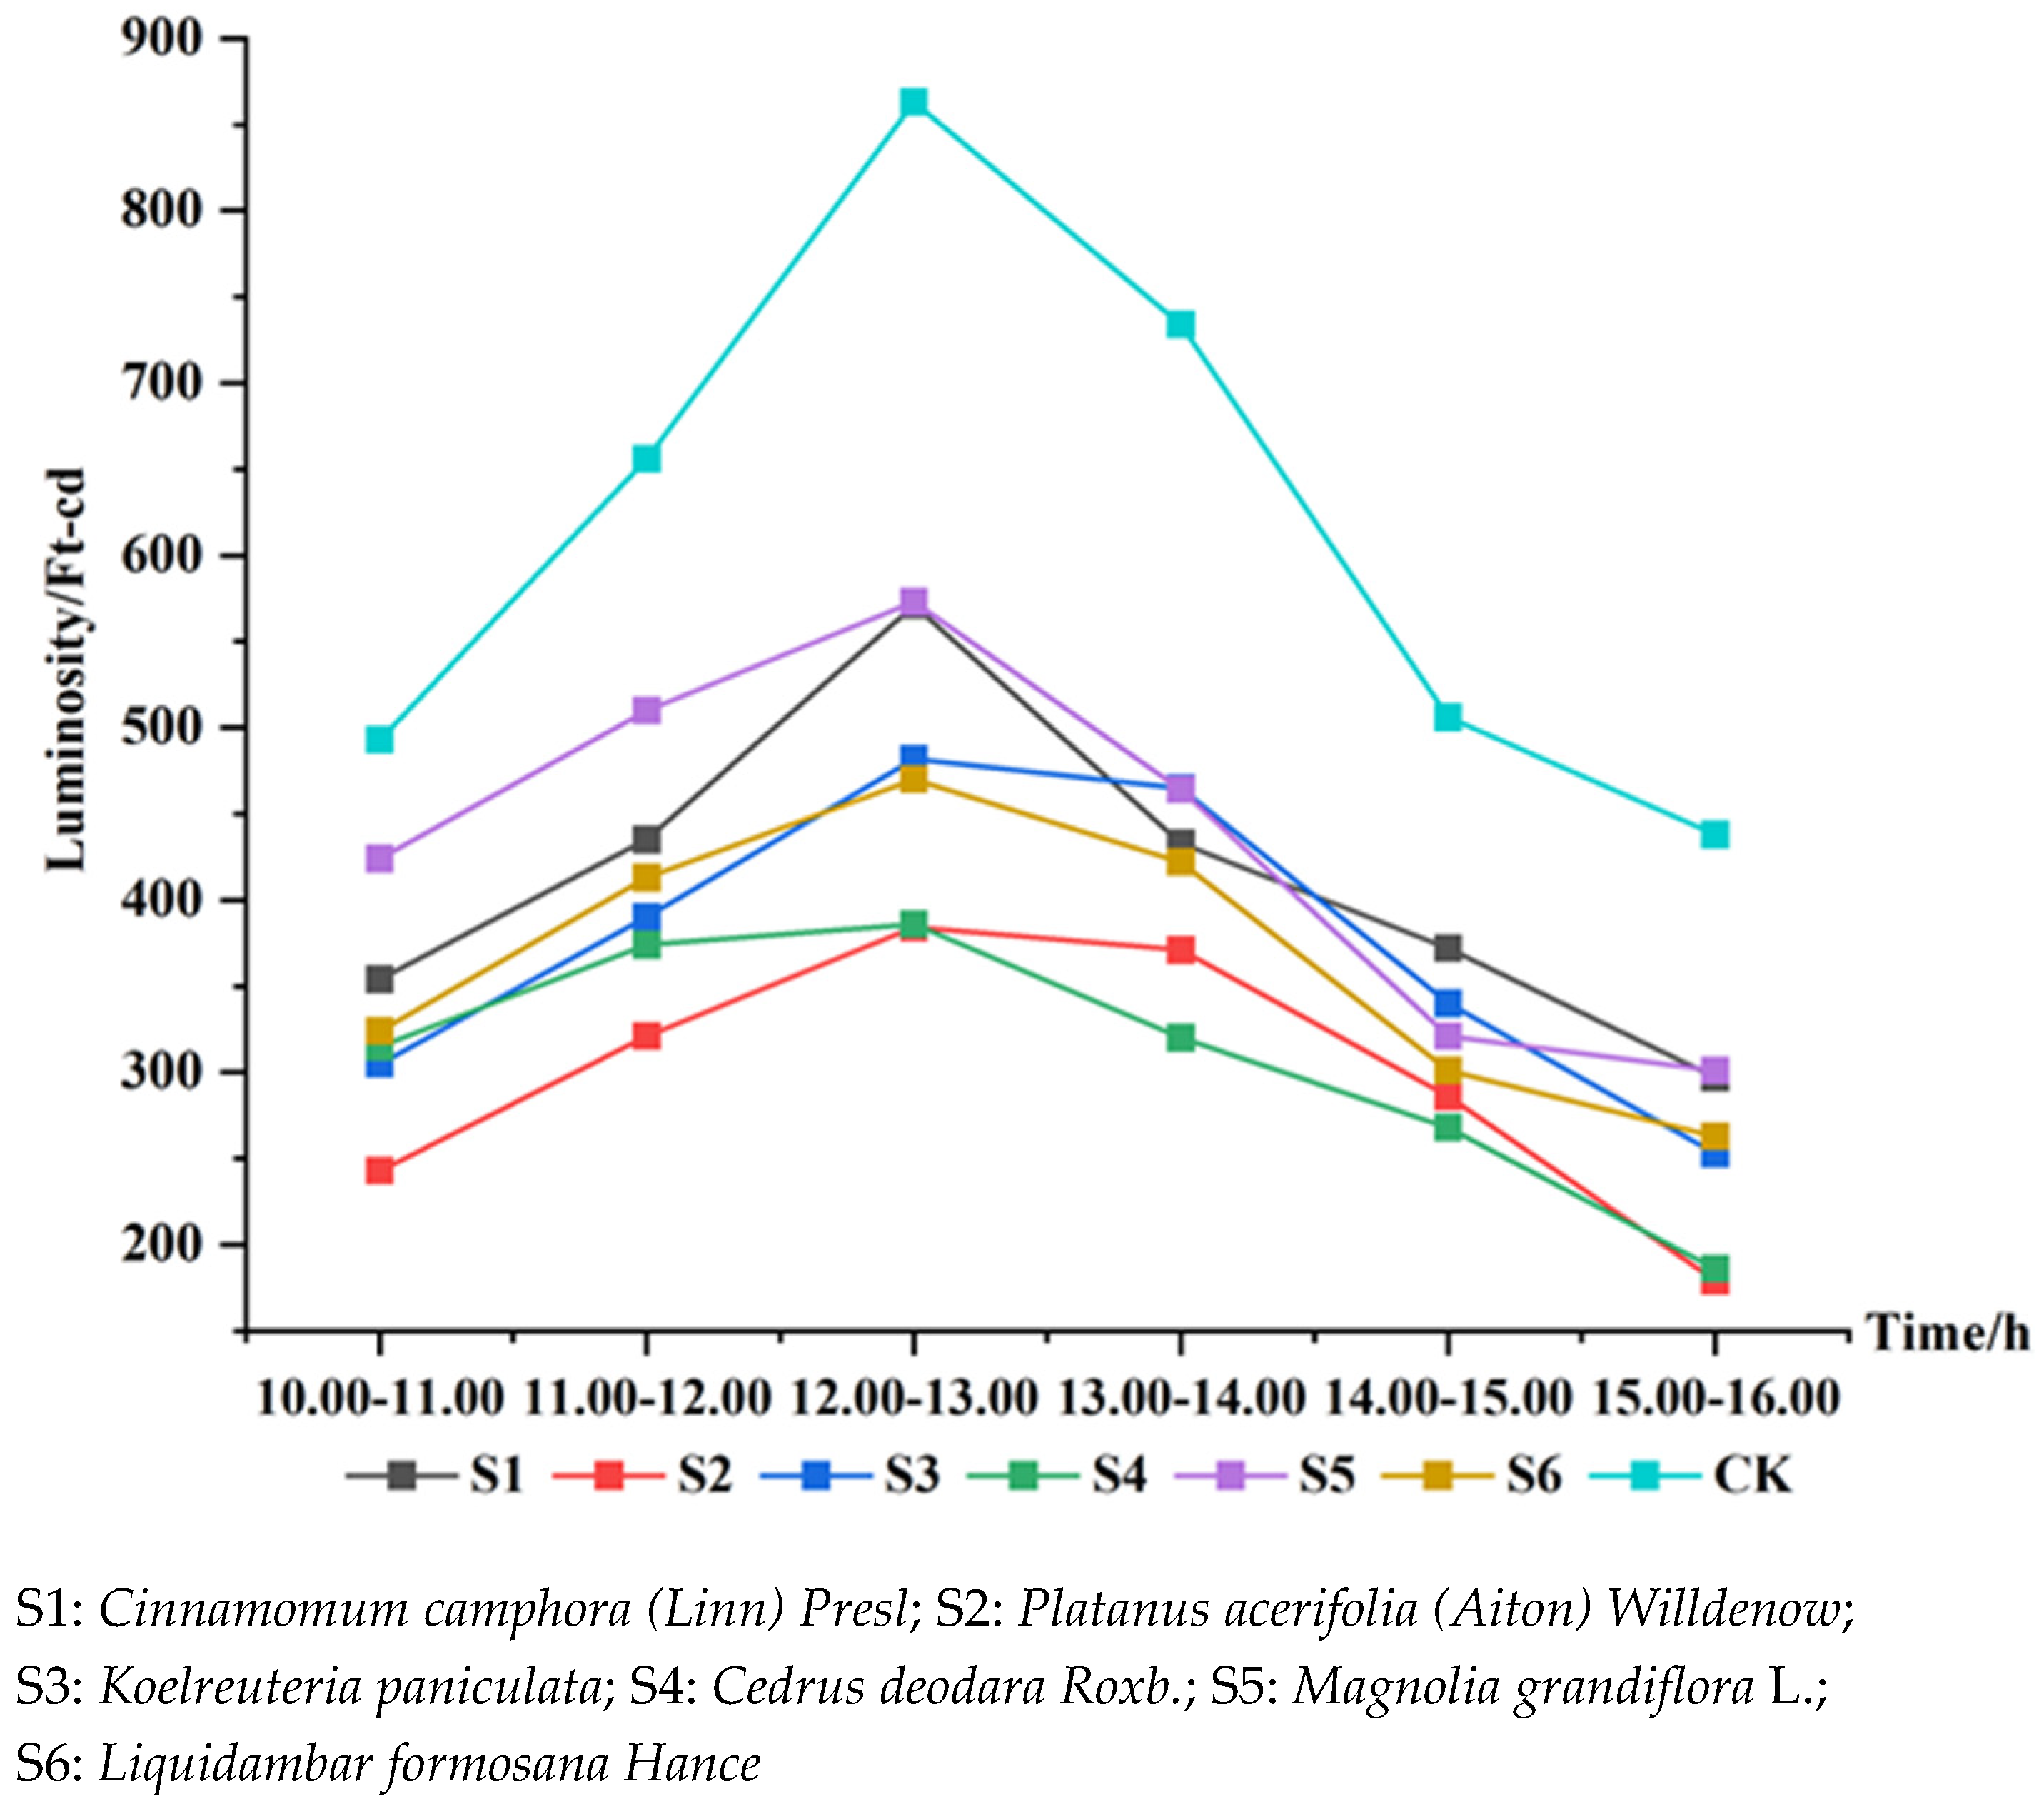
3.2. Thermal Environment Analysis of Street Canopy Geometry

According to the analysis of the climatic factors of different morphological trees, different morphological tree species have obvious differences in air temperature, relative humidity, and luminosity. The air temperature generally showed a trend of first rising and then falling. Relative humidity showed a trend of decline after an initial rise, with the distribution of values as a whole tending to be “U” shaped. Luminosity showed a single peak distribution trend and then a decreasing trend. These three factors all reached the peak value or valley during 12:00–13:00 (Figure 6, Figure 7 and Figure 8). The oval plants showed the best performance in cooling and shading, with an average daily cooling of 2.3 °C, a humidification of 4.1%, and shading of 318 cd/m2; the plants with the best performance in increasing humidity were spire-shaped, with an average daily humidification of 4.5%, cooling by 2 °C, and shading of 307 cd/m2. The results show that the different morphological structure parameters of the plants themselves may lead to obvious differences in the cooling, humidification, and shading of the plants [28], which is consistent with the results of the correlation analysis in Section 3.1 above.

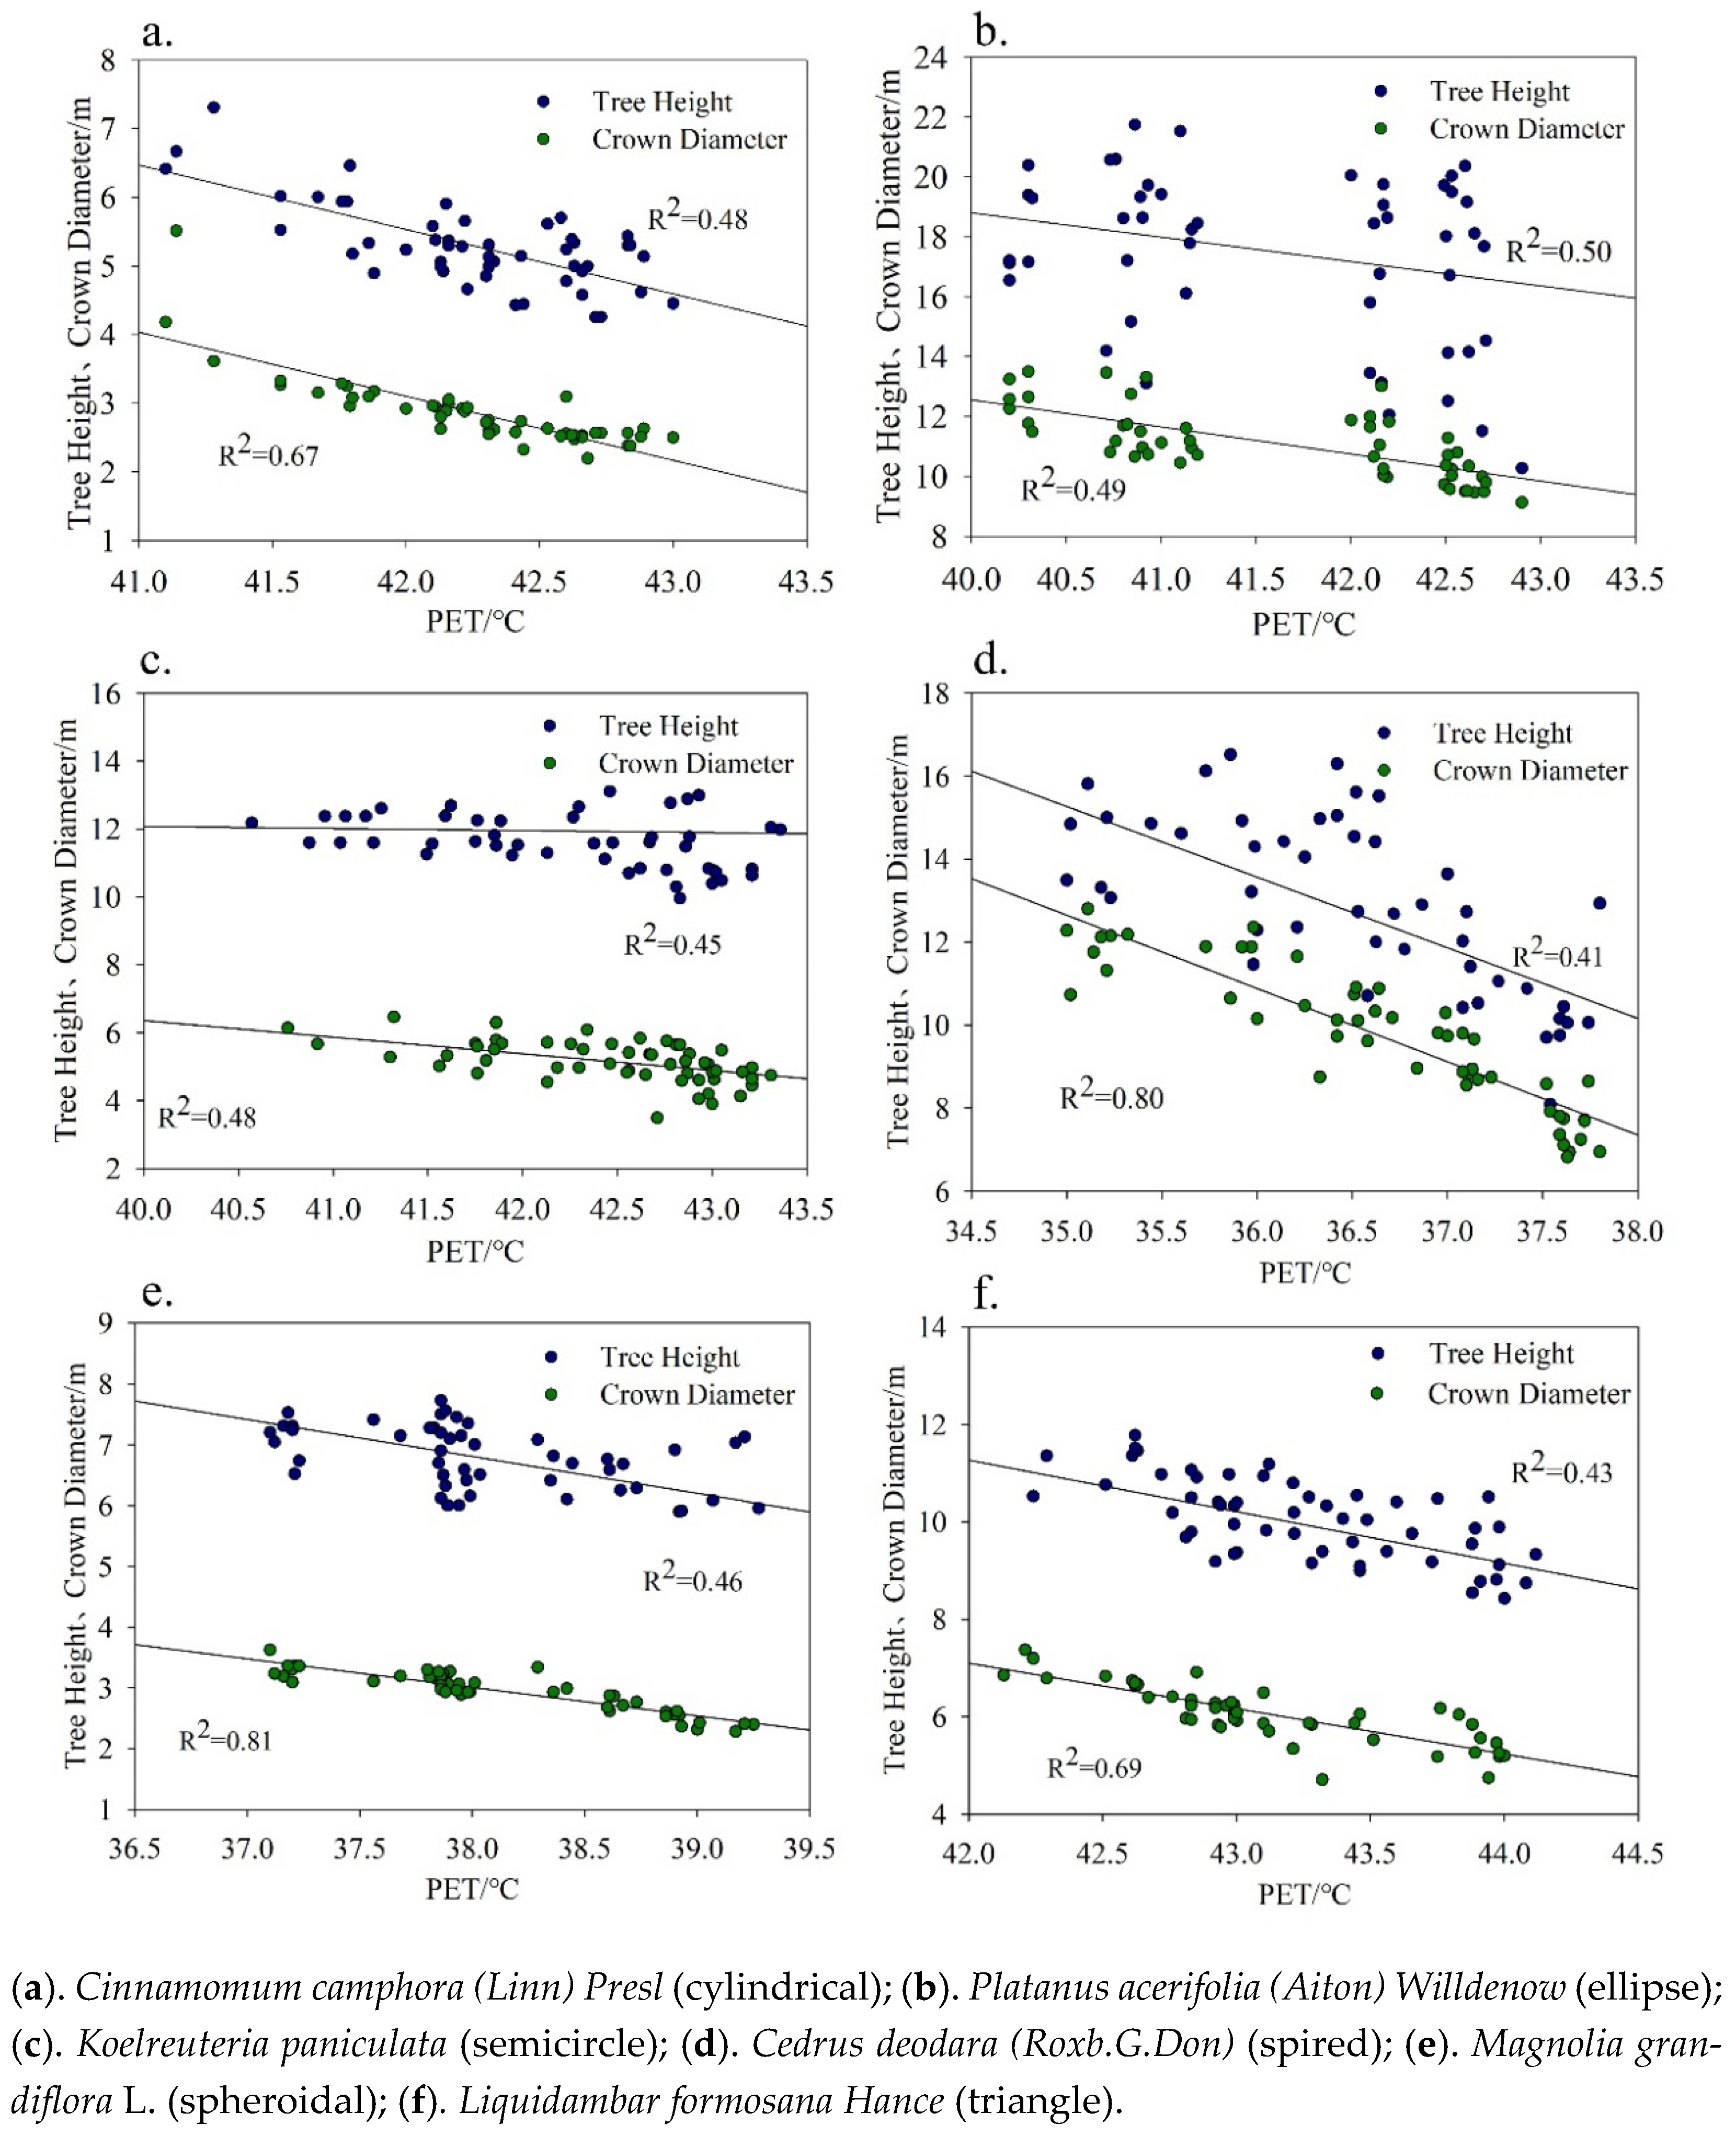
3.3. Analysis of Street Canopy Geometry Features and PET Index

The fitting relationship between plants with different canopy geometric characteristics and the PET index in the lower canopy space showed that (Table 4): the oval and spire-shaped plants had a strong ability to regulate PET, with daily average PET values of 40.5 °C and 40.9 °C, which were 1.2 °C and 0.8 °C lower than the average regulated PET values, respectively. The triangular plants showed a weak regulation ability to PET. The daily mean value of PET was 42.7 °C, 1 °C higher than the average adjusted PET value. From calculations of the average value of the morphological and structural characteristics of street trees (Table 5), it can be seen that the oval and spire shapes with a strong PET adjustment ability had high CV and LAI values. The CV and LAI values were 110 m3 and 1.90, respectively. Among them, the CV values of the oval and spire shapes were 2.80 and 1.33 times the average CV value, respectively, and the LAI value was 1.07 and 1.11 times the average LAI value, respectively. In addition, the morphological structure characteristics of the oval and spire-shaped plants that had a significant effect on PET were CD (R2 = 0.49) and TH (R2 = 0.80), respectively (Figure 9).

4. Discussions

4.1. Influence of Street Tree Morphological Structure Characteristics and Canopy Geometry on Thermal Environment

4.1.1. Influence of Street Tree Morphological Structure Characteristics on Thermal Environment

The TH of the air temperature, relative humidity, CV, and CD to the photometric were characterized by a significant negative correlation, and further explained the influence of the shape and structure of street trees on the microclimate factors that are displayed in ventilation cooling, shading, and humidification [29]. The TH of street trees had a significant impact on the wind environment in the lower space of the plant. Under the same CD, the increase in TH was conducive to improving the ventilation conditions in the lower space of the canopy, improving the air heat circulation and diffusion, and thus reducing the air temperature in the lower space [30]. CV and CD can be quantified as the three-dimensional volume of the canopy, which comprehensively reflects the ability of the canopy to absorb and refract solar radiation [31]. The canopy can effectively block and refract visible light, and a high CV value can reduce the light transmittance of the lower space of the canopy and reduce the luminosity value. At the same time, high CV and CD values can effectively expand the spatial projection area under the canopy when the solar radiation angle is constant [32]. The TH of the street trees affects the ventilation conditions of the lower space of the canopy, and the CV and CD affect the shadowing area of the canopy. This indicates that selecting tall street trees with thick canopies and dense branches and leaves can improve the ventilation conditions of the lower space of the canopy and improve the microclimate environment.

4.1.2. Influence of Street Canopy Geometry on Thermal Environment

This research demonstrated that oval and spire-shaped plants perform best in regulating a thermal environment. Oval-shaped plants affect cooling and shading effects, and spire-shaped plants affect shading effects. The main reason was that the cooling, humidifying, and shading effect of the plant was significantly positively correlated with the LAI value [33], where the higher LAI value of plants corresponded to significantly increased cooling effects. During the day, the plant leaves absorb solar radiation and convert the solar radiation into latent heat by transpiration, allowing plant leaves to effectively reduce the temperature within the lower space of the plant. The oval plants had a high LAI value, which also more effectively reduced the temperature of the lower space of the plant. In addition, the shading effect of plants is mainly achieved through the geometric characteristics of the canopy. Compared with other plants, the oval-shaped “big on the top and small on the bottom” type plants have higher CV and CD values, which can intercept 80–90% of solar radiation and more effectively improve the shading effect of the lower space of the plant [34]. Compared with other plants, the LAI value of the spire-shaped plant was relatively high, leading to increased transpiration as the ambient temperature increased. The unique geometric characteristics and the TH and LAI value of the spire shapes can limit the water loss through transpiration and keep the humidity in the lower part of the plant at a high level [35]. Therefore, the LAI, CV, and CD values of the plant itself and the geometric characteristics of the canopy play a unique role in cooling, humidifying, and shading, which is consistent with the results obtained in this paper. In selecting street tree species, it is helpful to note that oval and spire trees provide good cooling, humidification, and shading in summer.

4.2. Influence of Street Canopy Geometry on PET

Variation in plant morphology can affect the PET index by changing the air temperature, relative humidity, luminosity, and wind speed of the microclimate factors in the lower space of the tree canopy. The oval and spire-shaped trees had a strong ability to adjust to PET. The CD of the oval-shaped plants (R2 = 0.49) and the TH of the spire-shaped plants (R2 = 0.80) all had significant effects on PET (Figure 9). Compared with other street tree species, the oval shaped trees had higher LAI values. The oval and spire-shaped trees had obvious effects on the diurnal variation of temperature, humidity, and luminosity (Figure 6, Figure 7 and Figure 8). The difference in the geometry of the canopy layer on the street had obvious differences in the adjustment ability of PET: oval plants have strong lateral extension. When the TH is the same, a higher CD value leads to a larger shadowing area of the lower space of the plant, and in turn, a lower air temperature [34,36]. This is consistent with the significant effect of oval plants’ CD on PET that was observed in this paper. Most of the spire-shaped plants were coniferous trees, and the space below the canopy was generally more limited than other trees (which was not conducive to airflow diffusion) and had a weak ventilation capacity [30]. The spire-shaped plant can adjust the ventilation environment of the lower space of the plant by changing the TH value and increasing the humidity. This is consistent with the results that were obtained in this paper [37]. Peters E B found that the LAI of plants had a significant effect on the temperature in the lower space of the canopy, and trees with the same morphological structure and canopy geometric characteristics could produce a temperature difference of up to 6 °C due to differences in LAI [38]. For the oval canopy, the expansion of LAI could enhance the transpiration capacity of plants, increase the relative humidity of the air in the lower space of the canopy, and further improve thermal comfort [39,40]. Due to the characteristics of needle leaves, LAI amplification did not significantly improve leaf evapotranspiration, although it could significantly increase leaf density, enhance shading ability, weaken visible light penetration, and improve thermal comfort [22].

5. Conclusions

In summer, the morphological and structural characteristics and geometric canopy characteristics of plants had an impact on the thermal comfort of the lower space, and the six plants had significant differences in cooling, humidification, shading, and thermal comfort adjustment. The correlation analysis between plant morphological structure characteristics and microclimate factors showed that TH was significantly negatively correlated with air temperature and relative humidity (R2 = 0.90, 0.96), and CV and CD were significantly negatively correlated with luminosity (R2 = 0.70, 0.63). The oval-shaped plants had the ability to regulate microclimates, with an average daily cooling of 2.3 °C and shading of 318 cd/m2; the spire-shaped plants had a strong humidification ability, with an average daily humidification of 4.5%. The linear regression analysis on the geometric characteristics of plant canopy and PET showed that the geometric characteristics of oval-shaped and spire-shaped plant canopies had a strong regulation ability on PET, and the daily average regulation values of PET were 40.5 °C and 40.9 °C, respectively. The oval plants’ CD had a significant effect on PET with an R2 of 0.49, the spire-shaped TH had a significant effect on PET with an R2 of 0.80, and both showed high CV and LAI values.
In this paper, we focused on the correlation between plant morphological structure and microclimate factors in the main urban area of Zhumadian city in summer, with an analysis of the linear relationship between plant canopy geometry and PET. Based on the microclimate benefits of different plants, this research suggests that oval and spire-shaped plants with a thick canopy, dense leaves in summer, and high CD and TH values should be chosen in the selection of street tree species. On the one hand, it can serve as a reference for future research on different regions and different types of street trees to improve the thermal comfort of road space, and guide the selection of road tree species scientifically. On the other hand, the research proved that the application of LiDAR technology can quickly obtain high-density point clouds, extract plant information, provide data support for urban forestry to cope with extreme weather, and play a guiding role in the application of LiDAR technology to different scientific fields.

Author Contributions

Conceptualization, X.Z., Y.L. (Yang Liu) and Q.Y.; data curation, X.Z. and R.L.; funding acquisition, Y.L. (Yang Liu); investigation, X.Z.; project administration, Y.L. (Yang Liu) and Y.L. (Yonghua Li); resources, Y.L. (Yang Liu) and Y.L. (Yakai Lei); supervision, Y.L. (Yang Liu), Y.L. (Yakai Lei), N.G. and A.A.; validation, Y.L. (Yonghua Li) and Q.Y.; writing—review and editing, X.Z., Y.L. (Yang Liu) and A.A. All authors have read and agreed to the published version of the manuscript.

Funding

This research was funded by: The Key Projects of the Henan Provincial Department of Education, grant number (21A220002); The Henan Province Science and Technology Research Project, grant number (212102310581). The Henan Province Science and Technology Research Project, grant number (222102520031).

Institutional Review Board Statement

Not applicable.

Informed Consent Statement

Not applicable.

Data Availability Statement

Not applicable.

Acknowledgments

This research is supported by Henan Provincial Joint International Research Laboratory of Landscape Architecture.

Conflicts of Interest

The authors declare no conflict of interest.

References

  1. Taha, H.; Akbari, H.; Rosenfeld, A. Vegetation Canopy Micro-Climate: A Field-Project in Davis, California. J. Appl. Meteorol. Climatol. 1989, 1, 13–15. [Google Scholar]
  2. Akbari, H.; Taha, H. The impact of trees and white surfaces on residential heating and cooling energy use in four Canadian cities. Energy 1992, 2, 141–149. [Google Scholar] [CrossRef]
  3. Souch, C.A. The effect of trees on summertime below canopy urban climates: A case study Bloomington, Indiana. J. Arboric. 1993, 19, 303–312. [Google Scholar] [CrossRef]
  4. Hsieh, C.M.; Jan, F.C.; Zhang, L. A simplified assessment of how tree allocation, wind environment, and shading affect human comfort. Urban For. Urban Green. 2016, 18, 126–137. [Google Scholar] [CrossRef]
  5. Kong, F.; Yan, W.; Zheng, G. Retrieval of three-dimensional tree canopy and shade using terrestrial laser scanning (TLS) data to analyze the cooling effect of vegetation. Agric. For. Meteorol. 2016, 217, 22–34. [Google Scholar] [CrossRef]
  6. Zhang, Z.; Lv, Y.; Pan, H. Cooling and humidifying effect of plant communities in subtropical urban parks. Urban For. Urban Green 2013, 12, 323–329. [Google Scholar] [CrossRef]
  7. de Abreu-Harbicha, L.V.; Labaki, L.C.; Matzarakis, A. Effect of tree planting design and tree species on human thermal comfort in the tropics. Landsc. Urban Plan. 2015, 138, 99–109. [Google Scholar] [CrossRef]
  8. Doick, K.; Hutchings, T. Air Temperature Regulation by Urban Trees and Green Infrastructure; Forestry Commission: Bristol, UK, 2013; pp. 1–11. [Google Scholar]
  9. Shahidan, M.F.; Jones, P.J.; Gwilliam, J.; Salleh, E. An evaluation of outdoor and building environment cooling achieved through combination modification of trees with ground materials. Build. Environ. 2012, 58, 245–257. [Google Scholar] [CrossRef]
  10. Bo, H.; Lin, B. Numerical studies of the outdoor wind environment and thermal comfort at pedestrian level in housing blocks with different building layout patterns and trees arrangement. Renew. Energy 2015, 1, 18–27. [Google Scholar]
  11. Kotzenn, B. An investigation of shade under six different tree species of the Negev desert towards their potential use for enhancing micro-climatic conditions in landscape architectural development. J. Arid. Environ. 2003, 55, 231–274. [Google Scholar] [CrossRef]
  12. Rosdi, K.; Ainuddin, A.N. Microclimatic modification of three timber species stands on ex-tin mining land. Malays. For. 2004, 67, 44–49. [Google Scholar]
  13. Chen, Q.; Gong, P.; Baldocchi, D. Estimating Basal Area and Stem Volume for Individual Trees from Lidar Data. Photogramm. Eng. Remote Sens. 2007, 73, 1355–1365. [Google Scholar] [CrossRef] [Green Version]
  14. Popescu, S.C.; Wynne, R.H.; Nelson, R.F. Estimating plot-level tree heights with lidar: Local filtering with a canopy-height based variable window size. Comput. Electron. Agric. 2003, 37, 71–95. [Google Scholar] [CrossRef]
  15. Hyyppa, J.; Kelle, O.; Lehikoinen, M. A segmentation-based method to retrieve stem volume estimates from 3-D tree height models produced by laser scanners. IEEE Trans. Geosci. Remote Sens. 2001, 39, 969–975. [Google Scholar] [CrossRef]
  16. Kato, A.; Moskal, L.M.; Schiess, P. Capturing tree crown formation through implicit surface reconstruction using airborne lidar data. Remote Sens. Environ. 2016, 113, 1148–1162. [Google Scholar] [CrossRef]
  17. Li, W.; Guo, Q.; Jakubowski, M.K. A New Method for Segmenting Individual Trees from the Lidar Point Cloud. Photogramm. Eng. Remote Sens. 2012, 78, 75–84. [Google Scholar] [CrossRef] [Green Version]
  18. Tao, S.; Wu, F.; Guo, Q.; Wang, Y.; Li, W.; Xue, B.; Hu, X.; Li, P.; Tian, D.; Li, C.; et al. Segmenting tree crowns from terrestrial and mobile LiDAR data by exploring ecological theories. ISPRS J. Photogramm. Remote Sens. 2015, 110, 66–76. [Google Scholar] [CrossRef] [Green Version]
  19. Zhao, X. Zhumadian Yearbook; Zhongyuan Publishing Media Group Zhongyuan Media Co., Ltd. Zhongzhou Ancient Books Publishing House: Zhengzhou, China, 2020; pp. 15–20. [Google Scholar]
  20. Zhao, J. Street-level road change detection using vehicle lidar scanning. Surv. Mapp. Spat. Geogr. Inf. 2021, 44, 1–3. [Google Scholar]
  21. Chen, K.; Liang, T.; Gan, Y. Influence of the building and green space layout for microclimate in Zhengzhou residential. J. Henan Agric. Univ. 2016, 50, 674–682. [Google Scholar]
  22. Wei, X.; Hao, R.; Zhang, M.; Shen, H.; Qiu, Y.; Geng, H. Simulation of the impact of tree canopy spatial structure on microclimate. J. Zhejiang A&F Univ. 2019, 36, 783–792. [Google Scholar]
  23. Chen, Y. Garden Arborology; China Forestry Press: Beijing, China, 2014; pp. 109–115. [Google Scholar]
  24. Wu, Z. Investigation and application of tree species on the street in Zhumadian City. Mod. Hortic. 2016, 2, 158. [Google Scholar]
  25. Badescu, V. Verification of some very simple clear and cloudy sky models to evaluate global solar irradiance. Sol. Energy 1997, 61, 251–264. [Google Scholar] [CrossRef]
  26. Liao, C.; Tsai, K.T.; Huang, Y.; Lin, T. Effects of thermal comfort and adaptation on park attendance regarding different shading levels and activity types. Build. Environ. 2013, 59, 599–611. [Google Scholar]
  27. Yang, L.; Liu, J.; Ren, J.; Zhu, X.; An, F. Research on Outdoor Thermal Comfort of Campus under Special Weather in Transition Season. J. Shandong Jianzhu Univ. 2021, 36, 75–96. [Google Scholar]
  28. Xiao, X.; Chen, G.; Dong, L.; Yan, H. Study on the influence of four plant community types on the cooling effect in hot and humid regions of East China. Landsc. Archit. 2019, 26, 94–99. [Google Scholar]
  29. Lin, Y.; Tsai, K. Screening of Tree Species for Improving Outdoor Human Thermal Comfort in a Taiwanese City. Sustainability 2017, 9, 340. [Google Scholar] [CrossRef] [Green Version]
  30. Xu, M.; Hong, B.; Jiang, R. Research on the influence of campus street trees on the thermal comfort of outdoor pedestrians in summer. Chin. Landsc. Archit. 2020, 36, 139–144. [Google Scholar]
  31. Bao, N.; Zhang, S.; Mo, X. Review of the research on tree canopy structure of arbor species. Eucalyptus Sci. Technol. 2021, 38, 68–74. [Google Scholar]
  32. Wu, R.; Yan, H.; Shu, Y.; Shi, Y.; Bao, Z. Microclimate characteristics of bamboo plants in summer and their effects on human comfort. Chin. Gard. 2019, 35, 112–117. [Google Scholar]
  33. Wu, X.; Lin, Y.; Yan, H.; Hao, X. Research on the correlation between cooling and humidification effect of urban green space and its structural characteristics. Chin. J. Ecol. Agric. 2008, 6, 1469–1473. [Google Scholar]
  34. Wu, Y. Tree-shading and avenue-tree planting. J. Hortic. 1963, 2, 295–308, 335–336. [Google Scholar]
  35. Qin, Z.; Li, Z.; Cheng, F.; Sha, H. The regulating effect of canopy structure of Luan tree community on its environmental temperature and humidity in summer. Chin. J. Appl. Ecol. 2015, 26, 1634–1640. [Google Scholar]
  36. Wu, L.; Wang, Z. Research on the dynamic of canopy shade. J. Nanjing For. Univ. (Natural Science Edition) 1991, 2, 61–66. [Google Scholar]
  37. Zhao, X.; Li, G.; Gao, T. Summer thermal comfort effect and morphological characteristics adjustment mechanism of typical street trees in Harbin. Landsc. Archit. 2016, 12, 74–80. [Google Scholar]
  38. Peters, E.B.; McFadden, J.P.; Montgomery, R.A. Biological and environmental controls on tree transpiration in a suburban landscape. J. Geophys. Res. 2010, 115, G04006. [Google Scholar] [CrossRef]
  39. Zheng, Y.; Zhu, S.; Fang, M.; Wu, H.; Yan, H.; Shao, F. Relationship between different plant types and temperature and humidity effects in urban parks. J. Northwest For. Univ. 2020, 35, 243–249. [Google Scholar]
  40. Shahidan, M.F.; Shariff, M.; Jones, P.; Salleh, E.; Abdullah, A.M. A comparison of Mesua ferrea L. and Hura crepitans L. for shade creation and radiation modification in improving thermal comfort. Landsc. Urban Plan. 2010, 97, 168–181. [Google Scholar] [CrossRef]
Figure 1. Location analysis.
Forests 13 01086 g001
Figure 2. Test road point cloud quadrat.
Forests 13 01086 g002
Figure 3. Statistics of key tree species in Zhumadian City.
Forests 13 01086 g003
Figure 4. Three-view geometrical fitting of street tree.
Forests 13 01086 g004
Figure 5. Linear relationship between morphological structure characteristics.
Forests 13 01086 g005
Figure 6. Air temperature diurnal variation of the tree species (S1–S6).
Forests 13 01086 g006
Figure 7. Relative humidity diurnal variation of the tree species (S1–S6).
Forests 13 01086 g007
Figure 8. Luminosity diurnal variation of the tree species (S1–S6).
Forests 13 01086 g008
Figure 9. Linear relationship between canopy geometric features and PET.
Forests 13 01086 g009
Table 1. Test equipment.
Equipment NameMeasurement ParametersMeasuring RangeMeasurement Accuracy
Luchang LM-8000 temperature, relative humidity, wind speed, and illumination four-in-one environmental measuring instrumentAir temperature−100~1300 °C±1%
Relative humidity10~95%RH±4%RH
Wind speed0.4~30.0 m/s0.1 m/s
Luminosity 0~2000 FC
JTR04 Black ball thermometerBlack bulb temperature−20~125 °C±0.5 °C
AS-900HL Mobile Scanning SystemCanopy structure120 m±1 cm
CI-110 Canopy AnalyzerLAIAdjustable viewing angle 150°, 180°3,000,000 pixels
Table 2. RayMan model input data.
Data NameData ContentData Parameter
Time dataSimulation date, simulation time1 August 2021–3 August 2021
Geographic dataLocation, latitude, and longitudeLocation: Zhumadian City, Henan Province, China; latitude and longitude 32°18′~33°35′ N,113°10′~115°12′ E
Climate dataAir temperature, relative humidity, wind speed, cloud cover, luminosity, average radiant temperatureThe air temperature, relative humidity, and luminosity are measured data, the wind speed is 0.1/s, the cloud cover is 1, and the average radiation temperature can be calculated by it
Personal dataHeight, weight, age, genderHeight: 175 cm; weight 75 kg; age 35 years old; gender: male
Clothing activity dataClothing thermal resistance, activityClothing thermal resistance 0.6, activity 120 W
Table 3. Correlation analysis between morphological structure characteristics of street trees and microclimate factors.
CVCACDTHDBH
Air temperaturePearson correlation−0.182 *−0.238 **−0.278 **−0.228 *0.071
Relative humidityPearson correlation−0.156 *−0.194 *−0.236 **−0.250 **−0.005
LuminosityPearson correlation−0.281 **−0.213 *−0.142 *−0.177 *−0.158
**: Correlation is significant at 0.01 level. *: Correlation is significant at 0.05 level.
Table 4. Diurnal variation characteristics of PET in plants with different canopy geometries.
Shape10:00–11:0011:00–12:0012:00–13:0013:00–14:0014:00–15:0015:00–16:00Average PET
Cylindrical41.542.143.542.341.940.541.9
Oval38.139.842.942.841.138.740.5
Semi-circular39.341.244.444.242.640.742
Spire39.841.342.741.940.939.340.9
Spherical41.542.643.343.14340.442.3
Triangle39.44245.345.442.341.842.7
Table 5. Morphological structure characteristics of different tree shape.
ShapeAverage DBH/mAverage TH/mAverage CD/mAverage CA/m2Average CV/m3Average LAI
Cylindrical0.12.86.717111.75
Oval0.301115.6502311.82
Semicircle0.155.110.315171.65
Spire0.189.713.4301101.90
Spherical0.152.96.918181.87
Triangle0.206.110.1331081.25
Publisher’s Note: MDPI stays neutral with regard to jurisdictional claims in published maps and institutional affiliations.

