Article

Cross-Boundary Sustainability: Assessment across Forest Ownership Categories in the Conterminous USA Using the Montréal Process Criteria and Indicators Framework

1
US Department of Agriculture, Forest Service, Northern Research Station, Amherst, MA 01003, USA
2
US Department of Agriculture, Forest Service, Southern Research Station, Research Triangle Park, Raleigh, NC 27709, USA
3
US Department of Agriculture, Forest Service, Northern Research Station, Houghton, MI 49931, USA
4
Department of Environmental Conservation, University of Massachusetts Amherst, Amherst, MA 01003, USA
*
Author to whom correspondence should be addressed.
Submission received: 2 March 2022 / Revised: 9 June 2022 / Accepted: 20 June 2022 / Published: 24 June 2022
(This article belongs to the Special Issue Sustainable Forest Management Criteria and Indicators)

Abstract

:
The conservation and sustainable management of forests across ownership groups of the conterminous USA was assessed using the Montréal Process Criteria and Indicators (C&I) framework using national forest inventory and other data. Sixty-one percent of the forest area in the USA is Privately owned (20% Corporate, 39% Family, and 2% Other Private), 37% is Public (28% Federal, 2% Local, and 7% State), and 2% is within Native American Tribal Reservation boundaries. There are many commonalities across ownership categories, but there are also important differences. A 1.1 million ha yr−1 decrease in Family forestland and a 1.0 million ha yr−1 increase in Corporate forestland (C&I 1.1.a) between 2012 and 2019 are among the main trends with implications for sustainability and influence all other aspects considered through the C&I. The majority of annual timber harvests (C&I 2.d) comes from Corporate (46%) and Family (42%) forestlands. Of the most common species, net growth to removal ratios (C&I 2.d) are less than 1.0 for three species on Tribal forestland, two species on Federal forestlands, and two species on Corporate forestlands. Disturbances (C&I 3.a and 3.b) are relatively common (ranging from 4 to 15% of forestland within an ownership category) across ownership categories with the highest proportion of disturbances being caused by diseases and pests on Federal forestland. Differences in the legal and institutional frameworks across ownership categories (Criterion 7) influence how the forest resources can be managed and how policies, programs, and services can be designed and implemented to help maintain and enhance the flow of forest-based goods and services. This analysis helps illustrate that sustainability is complex, C&I are imperfect, and there are additional elements, such as recreational access and ownership/management objectives, that would be helpful for comparing across ownership categories. But the Montréal Process C&I framework helps elucidate the relative threats among ownership categories, in particular the loss of Family forestland to non-forest uses and the increase in disturbances across most ownership categories, and the relative opportunities across ownership categories, including the sustainable supply of timber from Corporate and Family forestlands and the relatively high tree, and presumably broader, biodiversity especially on Local and Other Private forestlands.

1. Introduction

Across the conterminous USA, there are an estimated 276 million ha of forestland [1] that provide society with countless benefits ranging from clean water to recreational opportunities to timber. The specific benefits that are generated and who can directly access them is dictated by, among other factors, the individuals, businesses, agencies, and other groups that own and steward these lands. These ownerships and organizations have diverse structures and objectives and varying levels of resources. In addition, forests exist within a matrix of different ownership types and many of the most pressing concerns (e.g., wildfire and invasive species) transcend boundary lines. By understanding the patterns and trends in conservation and forest management, policies and programs can be designed to amplify the relative strengths and mitigate the relative weaknesses across ownership types.
The Montréal Process Criteria and Indicators (C&I) is a framework that has been developed to assess the conservation and forest management of temperate and boreal forests [2]. The framework consists of seven criteria and 54 indicators that address biological diversity, forest productivity, forest health, soil and water resources, carbon sequestration, financial and livelihood benefits of forests, and the institutional mechanisms intended to foster forest conservation. The framework has been adopted by multiple countries in either its entirety or as partial or modified versions [3]. A national assessment of sustainable forest management in the USA using the Montréal Process C&I found that, overall, the sustainability indicators were positive, but concerns were raised about fragmentation (an indicator of biological diversity) and disturbances (an indicator of forest health) [4]. An assessment of the sustainability of Family forests in the USA also found that most indicators were positive, but loss of forestland was flagged as a major concern [5]. Additional analyses have been conducted in the USA focusing on forest governance [6], forest fragmentation [7], and other specific C&I. Studies have also been published on the application of the Montréal Process C&I in Australia [8], Canada [9], and the tropical islands of the politically associated territories and protectorates of the USA [10], among other countries and regions.
The objective of this paper is to compare the conservation and forest management patterns and trends across ownership categories in the USA. This will be conducted by applying the Montréal Process C&I framework. These comparisons will highlight commonalities and differences across ownership groups with an aim of facilitating forest policy design and implementation that responds to the varying threats and relative strengths and weaknesses that exist for each group. While the analysis is focused on the USA, general results should have applicability to other countries that have similar ownership groups.

2. Materials and Methods

The specific Montréal Process C&I included in this paper (Table 1) were selected based on data availability and applicability towards cross-ownership comparisons. All data sources needed to be citable, be able to be subset by ownership category, and cover most, if not all, of the conterminous USA. Preference was given to quantitative data and sources that allowed for temporal comparisons. The analysis was constrained to the conterminous USA due to data limitations for Alaska and Hawaii in the national forest inventory and other data sources.
The forest ownership categories used (Table 2) were based on a collapsing of the ownership classes used by the US Department of Agriculture (USDA), Forest Service, Forest Inventory and Analysis program [11], which was the primary data source used to quantify C&I in this analysis (Table 1). Under the broader grouping of Private forest ownership, the forestland was classified as Corporate, Family, and Other Private. The Public ownership category was subdivided into Federal, Local, and State. And the final grouping was Tribal, which was not further subdivided; in previous reports (e.g., Renewable Resource Planning Act assessments [12]), Tribal lands were typically grouped with other ownership categories, but these lands are part of sovereign nations, are neither Private nor Public, and hence we opted to classify this ownership group separately.
For half of the C&I analyzed (including some of Criterion 1 and all of Criteria 2, 3, and 5), the primary data source was the USDA Forest Service, Forest Inventory and Analysis plot data (FIA) [13], which constitutes the national forest inventory for the USA. This is the same data source that was used as a primary data source in previous national assessments of forest sustainability in the USA [14,15]. The FIA program includes over 300,000 permanent inventory plots across the USA that span all ownership categories and on which a consistent set of forest mensuration and related data are collected. Forestland as defined by FIA, and, as used in this analysis, includes land at least 0.4 ha (1 ac) in size and 37 m (120 ft) wide with at least 10 percent tree canopy cover or has had at least 10 percent tree canopy cover in the past and is likely to have it again in the future (e.g., areas where clearcutting has occurred, but the forest is likely to regenerate through natural or artificial means) [
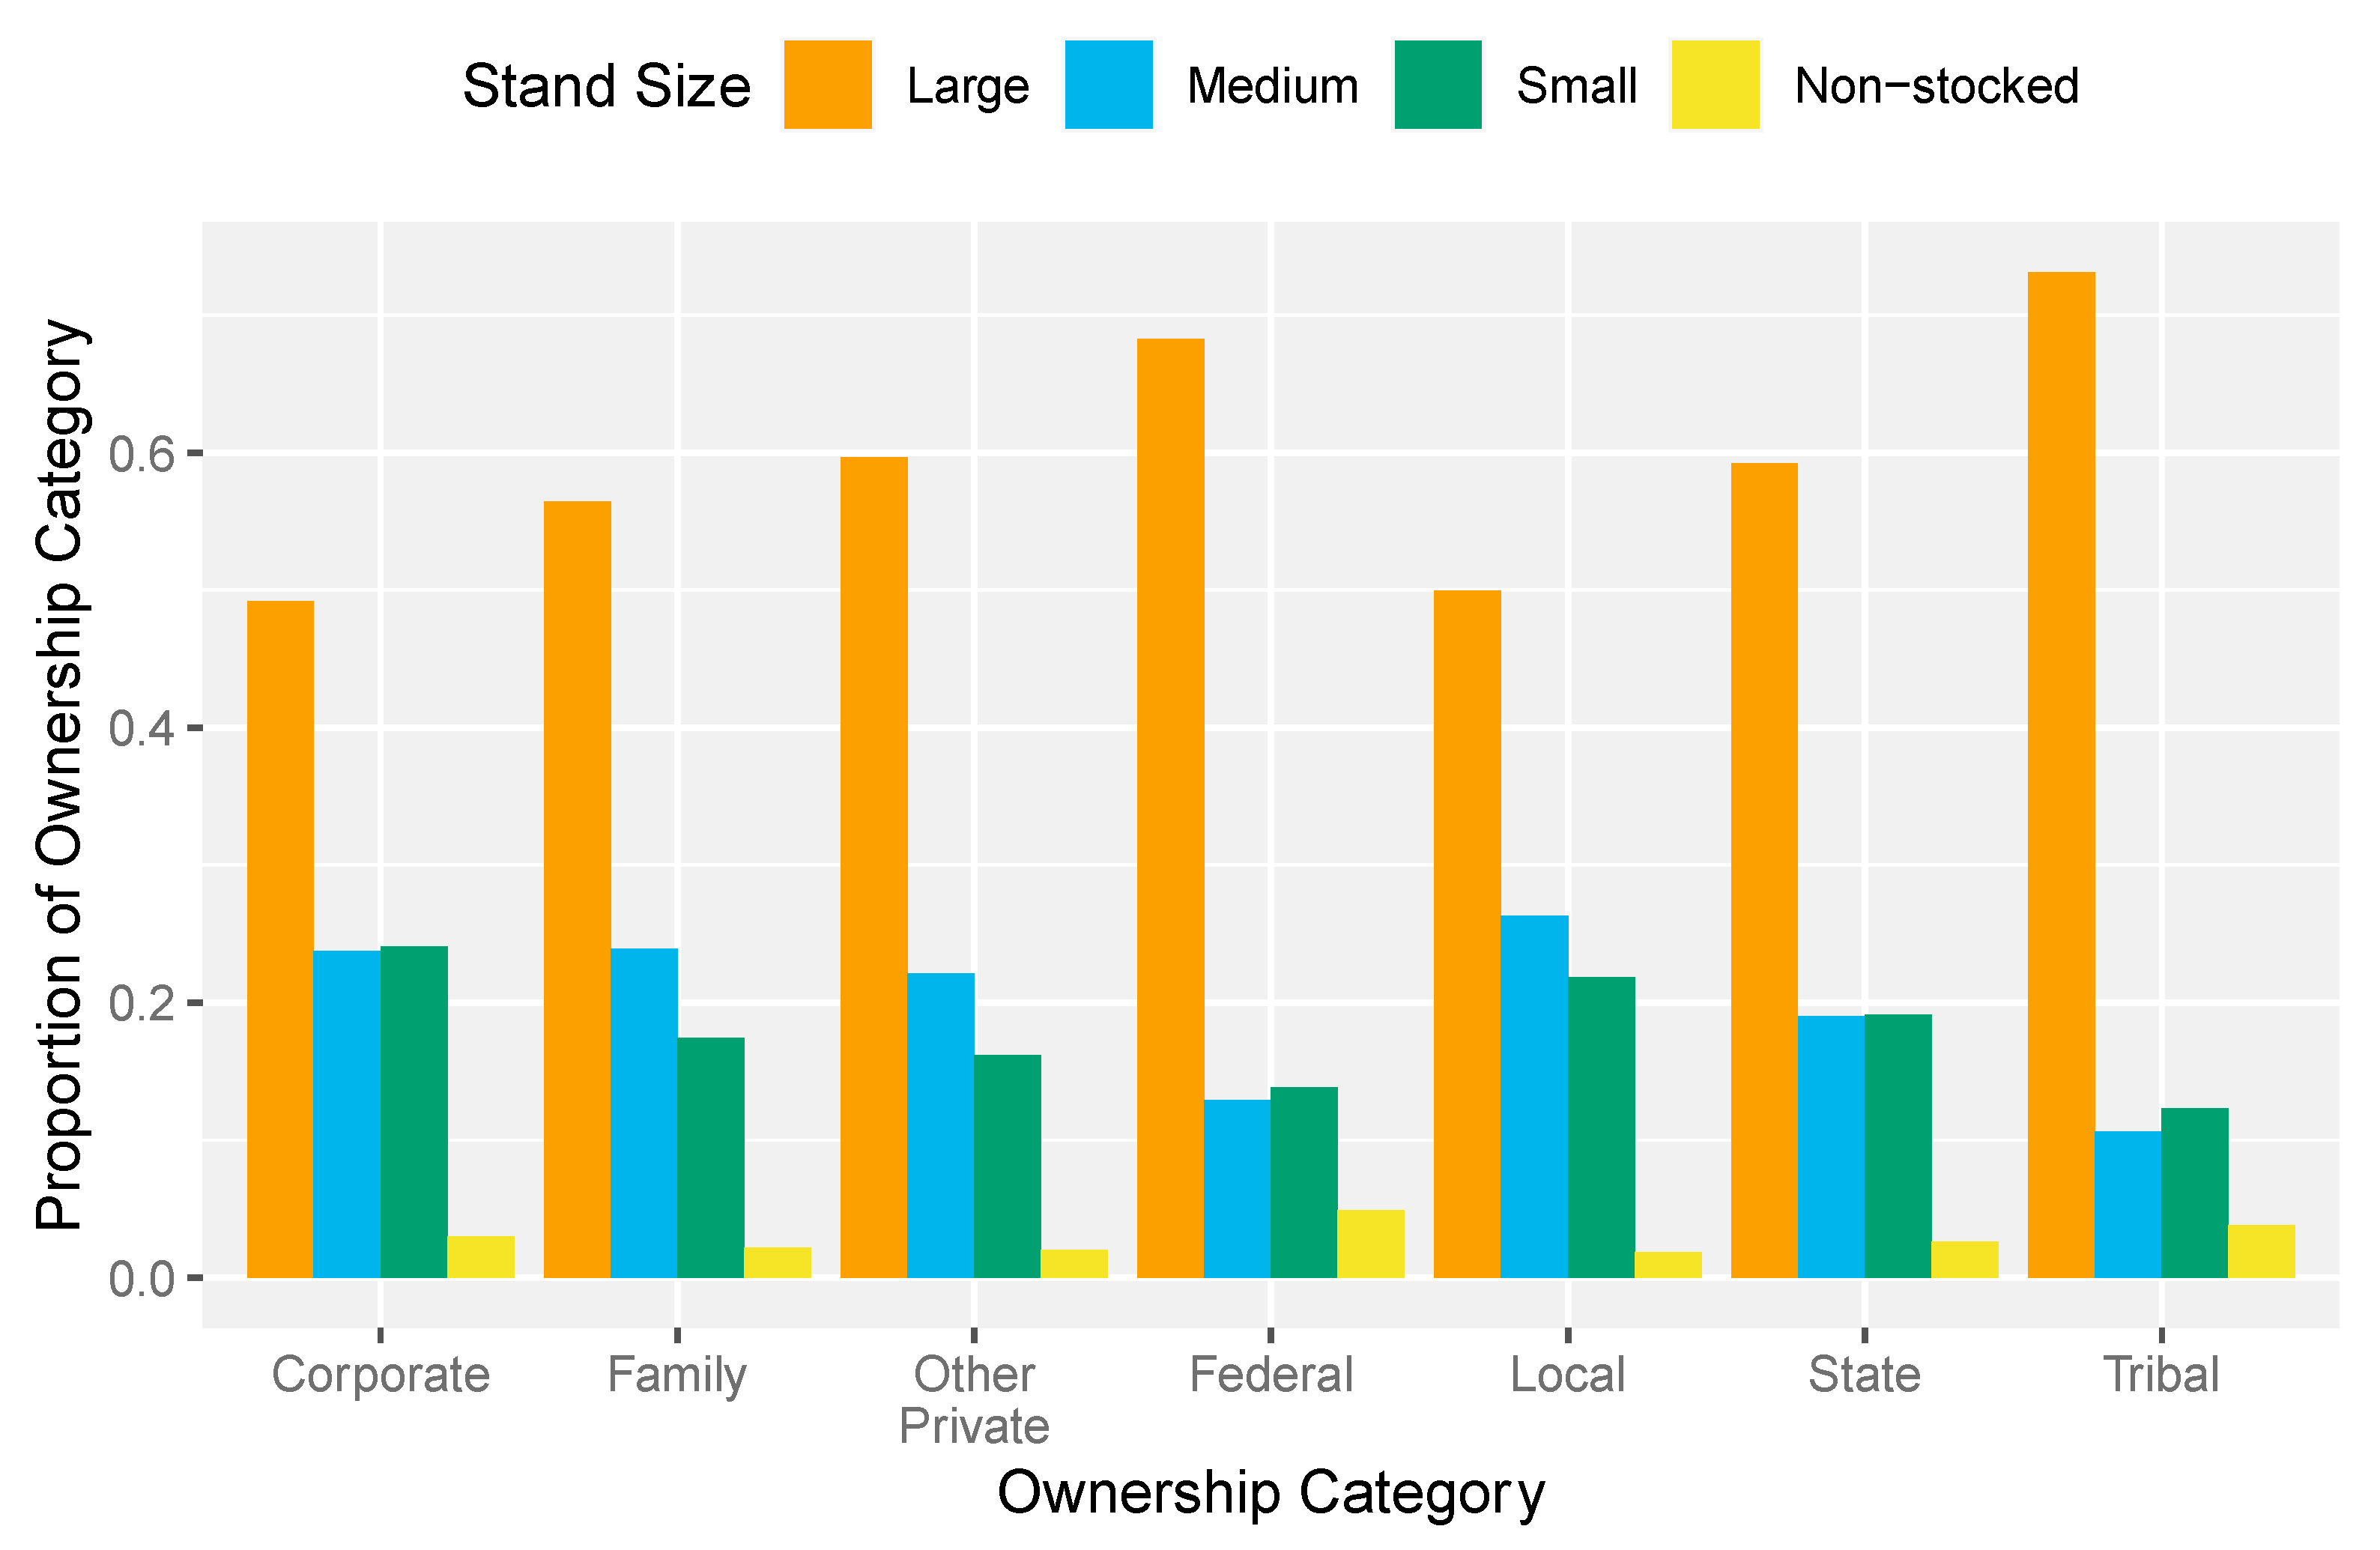
11]. Stand size was defined, following the FIA protocol, based on stocking level and the size of the plurality of trees on a plot. FIA defines stand sizes as: large for stands with ≥50% stocking in medium and large diameter trees and stocking of large diameter trees greater than or equal to stocking of medium diameter trees; medium for stands with ≥50% stocking in medium and large diameter trees and stocking of large diameter trees less than stocking of medium diameter trees; small for stands with ≥50% stocking in small diameter trees; and non-stocked for stands with an all live stocking values of <10 (base 100) [11]. Large diameter trees are defined as trees ≥28 cm diameter at breast height (DBH) for hardwoods and ≥23 cm DBH for softwoods; medium as trees ≥13 cm DBH and <28 cm for hardwoods and ≥13 cm DBH and <23 cm for softwoods; and small as trees <13 cm DBH. Productivity was assessed by estimating the forest area that was capable of producing at least 1.4 m3 ha−1 yr−1 (20 ft3 ac−1 yr−1), an FIA threshold for productivity [11]. Volume related estimates were for trees at least 13 cm (5 in) in diameter at breast height, also an FIA defined threshold. The area-weighted, mean remeasurement intervals were 7.1 years (nominal years of 2012 and 2019) for forest area and volume-based variables and 5.5 years variables (nominal years of 2013 and 2019) for growth, removals and land use change, the difference largely being due to a lack of data availability for the Rocky Mountain region (see Supplemental Materials for specific inventory cycles used).
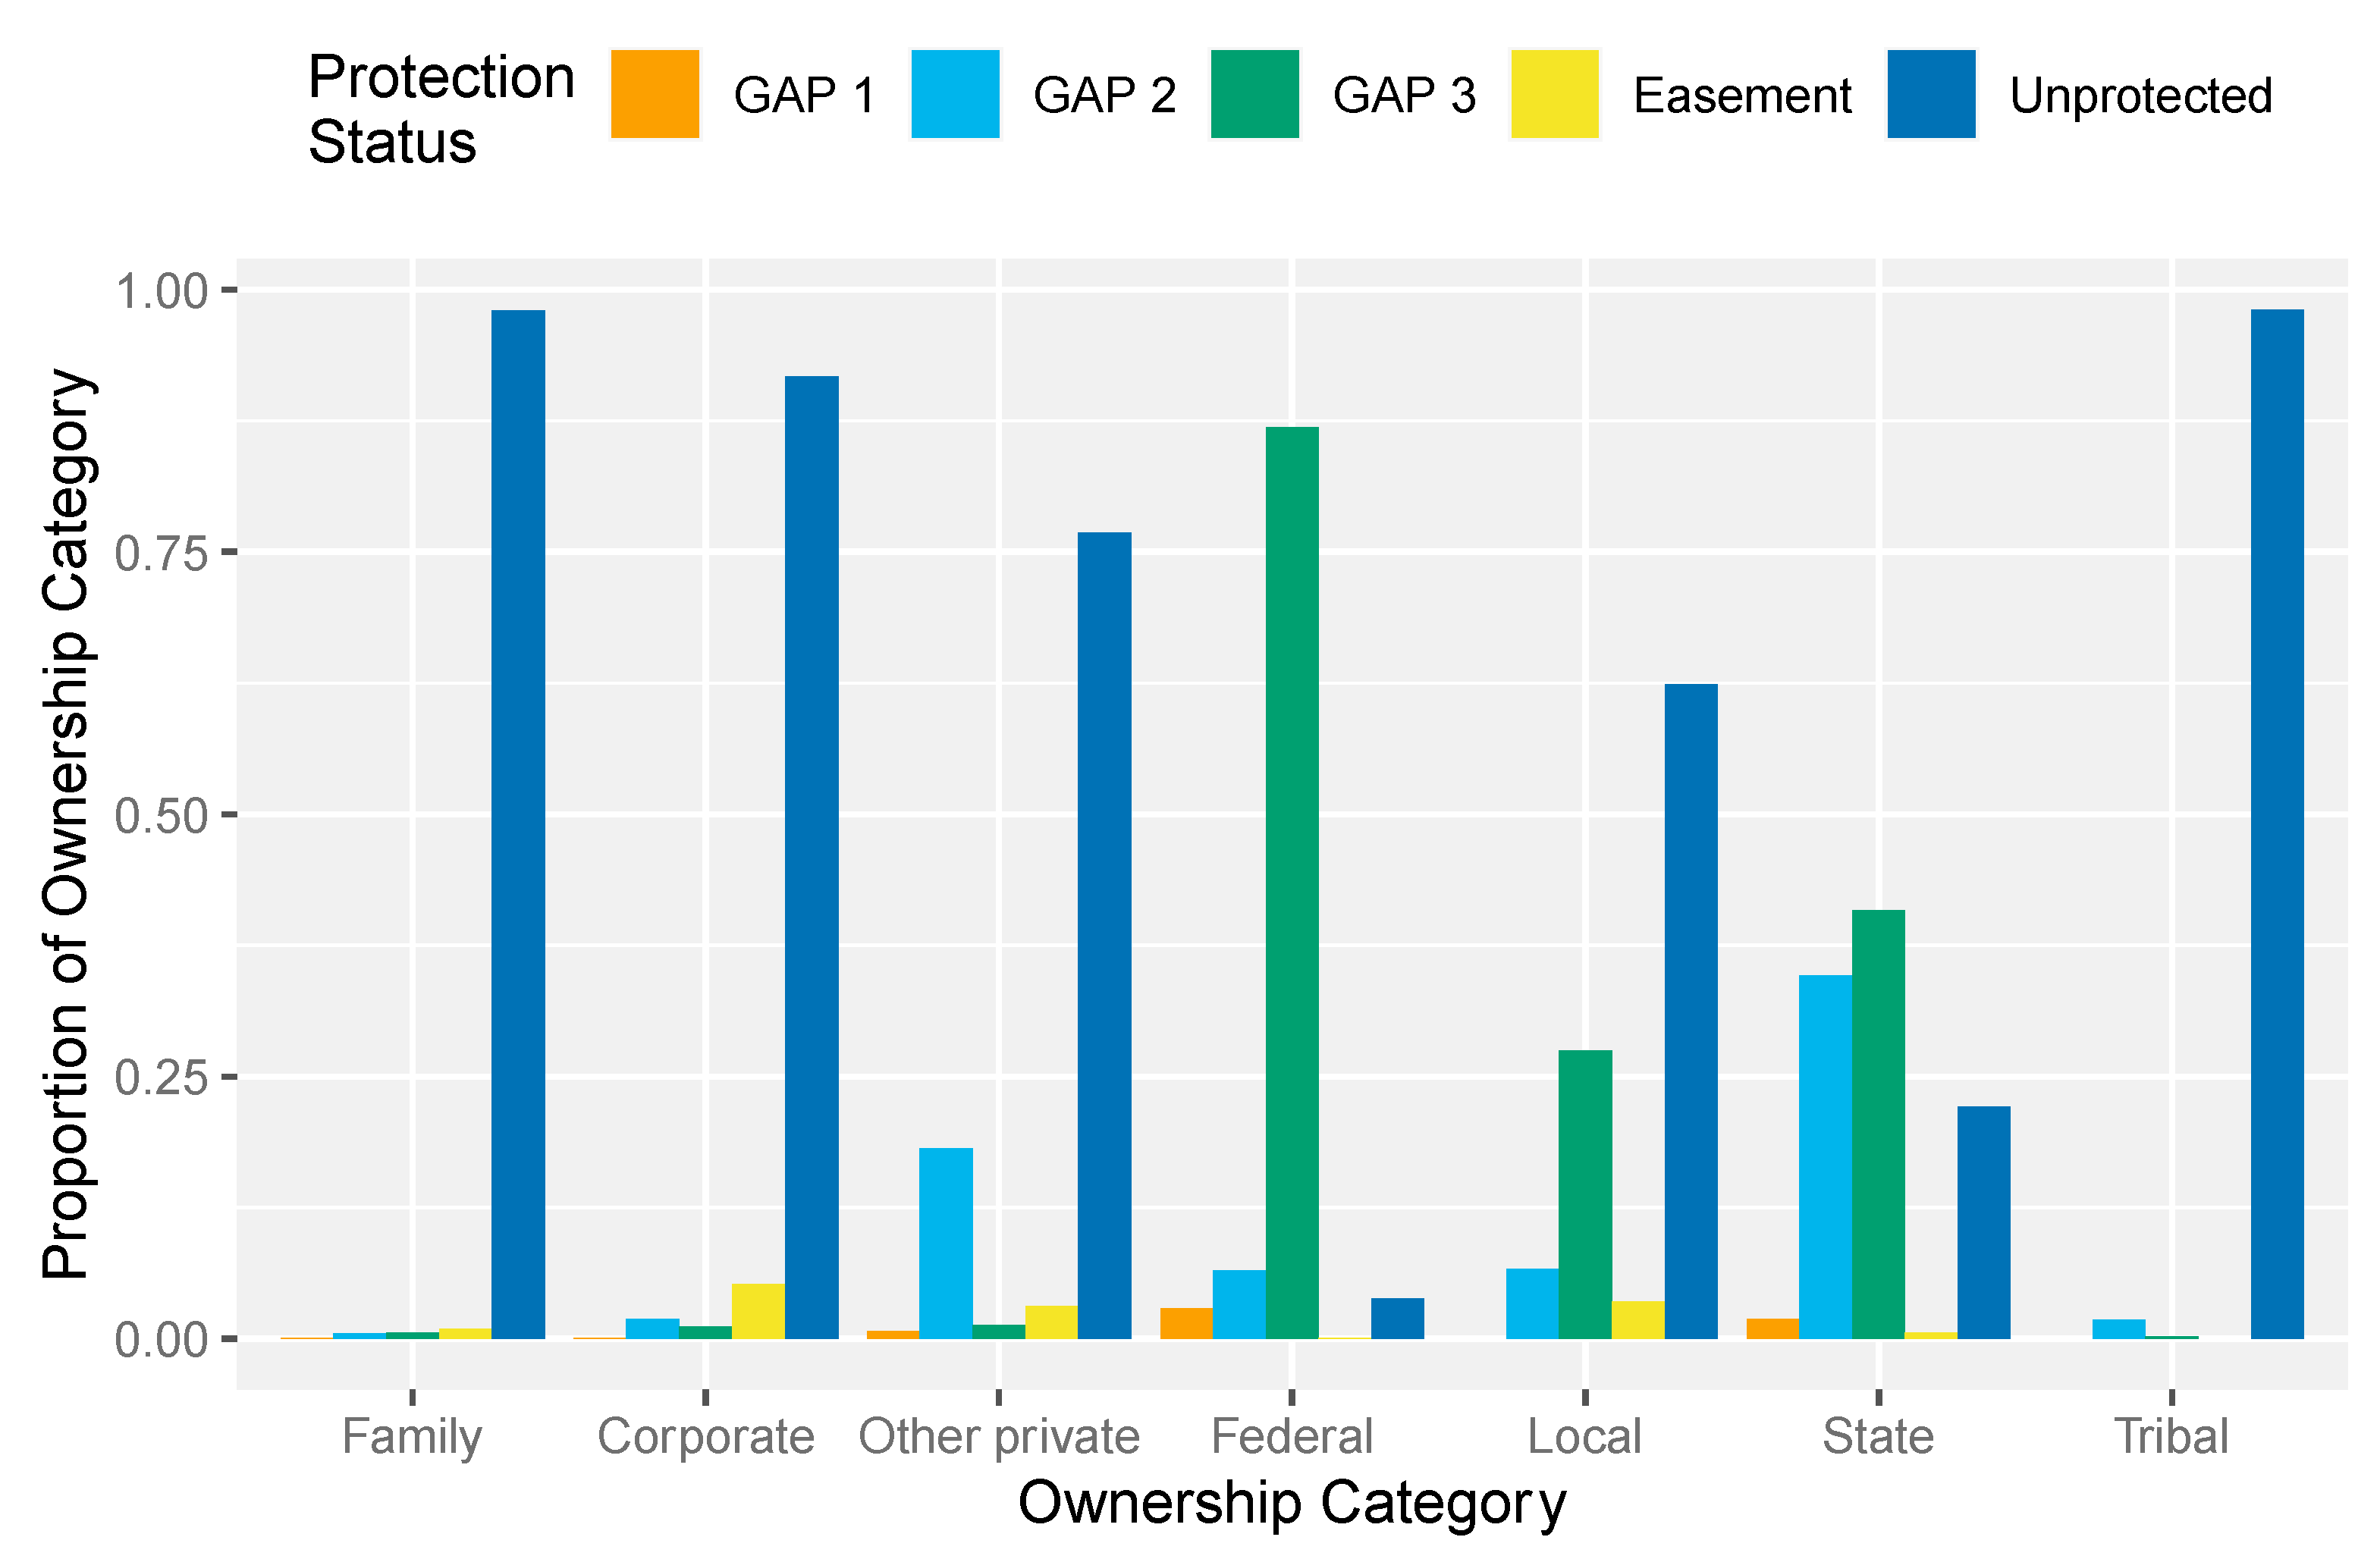
The Protected Areas Database (PAD) [16] was used to estimate area of forestland by protection status (C&I 1.1.b) by ownership group. Data were summarized based on Gap Analysis Project (GAP) codes, which categorized lands as: 1 = permanently protected and mandated to retain a natural state; 2 = permanently protected and mandated to maintain a primarily natural state; 3 = permanently protected, but extractive uses permitted; 4 = not permanently protected. In addition to these GAP statuses, a separate variable indicated if the land was permanently protected via a conservation easement. FIA inventory plots were overlaid on the PAD layer and based on ownership at plot center were summarized as, in order of precedence, GAP 1, GAP 2, GAP 3, Easement, or Unprotected.
Forest area density was used as a proxy for forest fragmentation (C&I 1.1.c) [7]. The proportion of the 15.2 ha area around each FIA inventory plot that was forested was calculated based on data from the US National Land Cover Database (NLCD) [17]. Potential values ranged from 0 to 1 with higher values representing more forestland in the vicinity and implying lower fragmentation. The most recent estimates were based on 2016 NLCD data and the change data compared 2006 to 2016.
At-risk species (C&I 1.2b) were assessed using NatureServe’s Map of Biodiversity, which summarizes the number of threatened and endangered species listed under the U.S. Endangered Species Act and other imperiled or critically imperiled species identified by NatureServe within 990 m x 990 m grid cells [18]. The FIA inventory plots were overlaid on this layer and summarized based on forest ownership at plot center. As the map of biodiversity values were simple counts, there was no way to filter for just at-risk forest species.
Economic benefits, i.e., jobs and wages, generated by the forests (C&I 6.3.a and 6.3.b) were estimated using data from the Bureau of Labor Statistics including the logging, sawmill, and pulp mill sectors and the support activities for forestry sector [19]. The contributions by ownership category for forest sector employment and inflation-adjusted wages were estimated based on the relative contributions to harvest removals for the North, South, and Pacific Coast regions; in the Rocky Mountain region, where harvesting data were not available, the harvesting distribution was estimated from the share of public and private removals [12] and further refined by shares of productive forestland [20].
For Criteria 4 and 7, national-level, quantifiable data that could be disaggregated by ownership category were not available. Instead, literature syntheses were conducted where available literature on the respective indicators were summarized. For Criterion 4, the search terms “forestry”, “best management practices”, or the common abbreviation of this term (“BMP”), and “implementation” were combined with the name of each state as well as with “United States” using the search engine DuckDuckGo to find relevant reports and articles at the state and national level; specifically, we looked for resources that compared BMP implementation rate by ownership type. Other resources were snowball-sampled from the original reports and articles. For Criterion 7, resources were snowball sampled beginning with resources identified using the search terms “sustainable forest management”, “United States”, and “policy” or “legislation” for 7.1.a. and “clarity” or “security”, “land tenure”, and “United States” for Indicator 7.3.a. Previous summaries of Criteria 7 for forestland in the USA [21,22,23] and information on Tribal land from the Indian Forest Management Assessment Team [24] and heirs’ property were also specifically included.
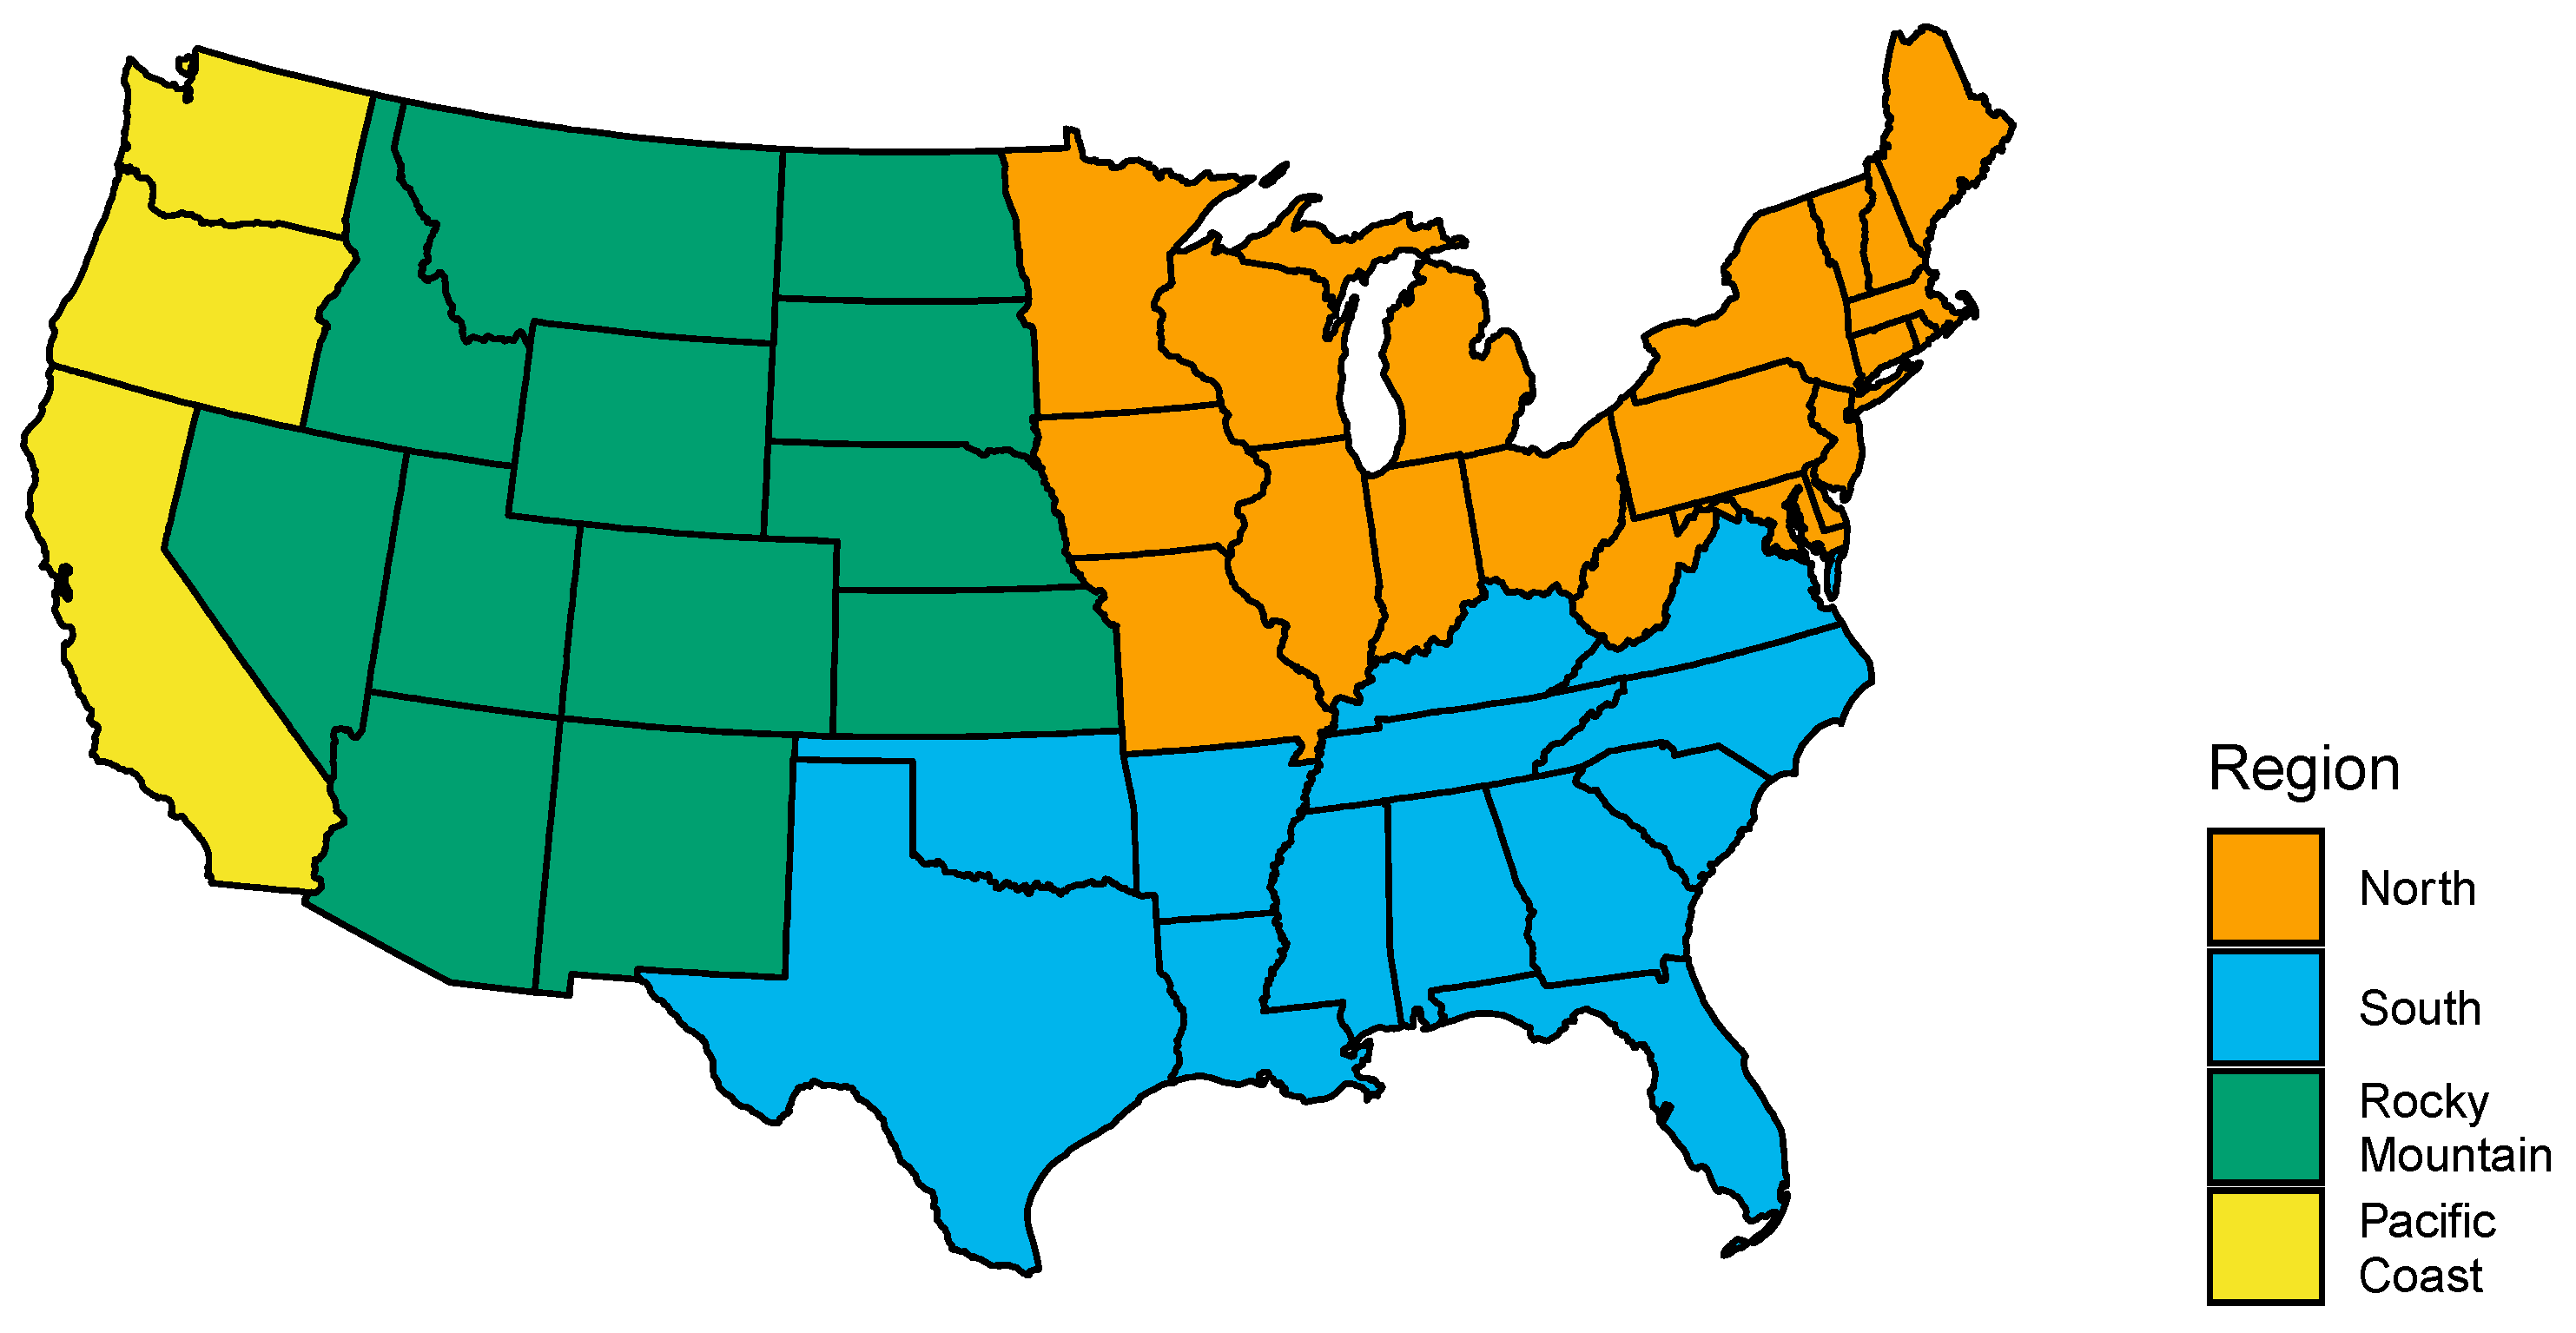
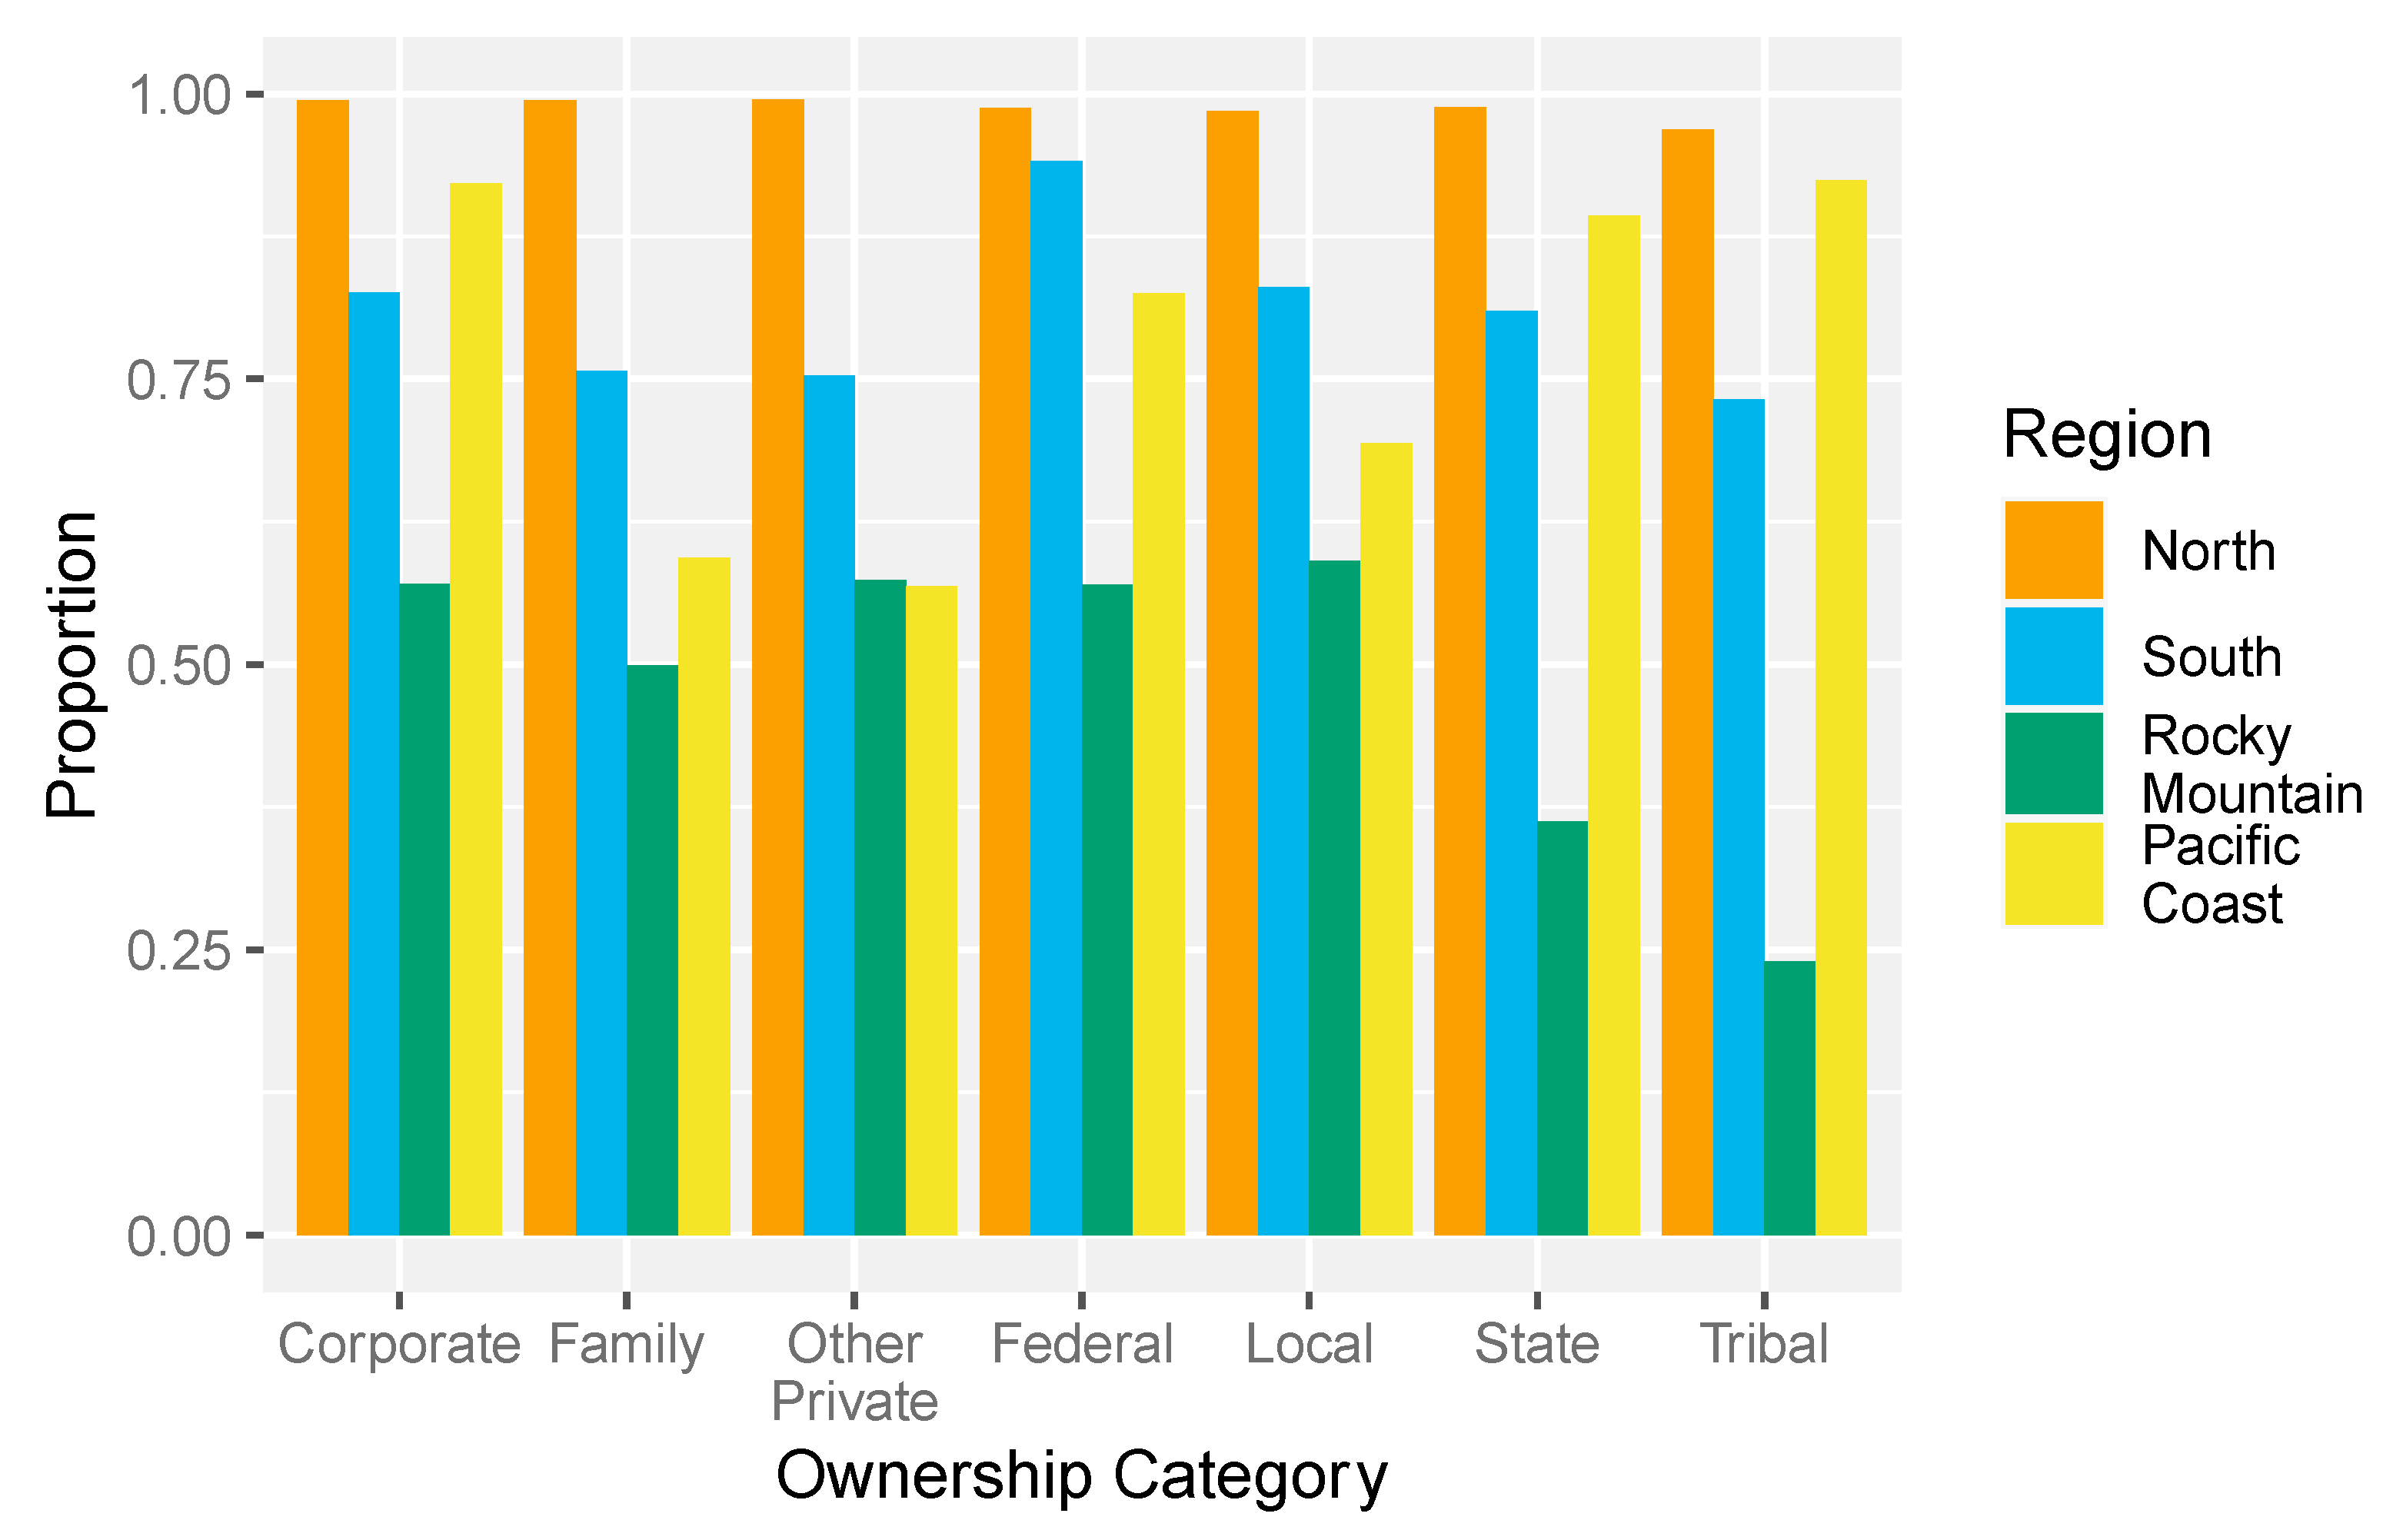
Where necessary, data were subset by region (Figure 1). These regions were based on those used by the USDA Forest Service’s Renewable Resource Planning Act Assessment [12].
Changes were calculated for indicators where estimates were available for two points in time. For C&I 1.1.a, 2.b, and 2.d, absolute changes in terms of percentages were calculated as:
( x i , 2 x i , 1 x i , 1 ) × 100
where xi,t was the value for variable x for ownership category i at time t. To avoid confounding trends with overall forest area trends, relative changes reported in terms of changes in percentage points were calculated for C&I 2.a, 2.c, 3.a, and 3.b:
( ( x i , 2 A i , 2 ) × 100 ) ( ( x i , 1 A i , 1 ) × 100 )
where Ai,t was the forest area for ownership category i at time t and other variables were defined as above. For C&I 1.1.c and 1.2.a, changes reported were simple differences (i.e., x i , 2 x i , 1 ).
All data analyses were performed in the R statistical environment [25].

3. Results

3.1. Criterion 1: Conservation of Biological Diversity

The most basic C&I, a sub-element of C&I 1.1.a, is forest area. As of 2019, there are an estimated 276 million ha (SE = 0.6) of forestland across the conterminous USA (Table 3A). Of this acreage, 61% is privately owned, 37% is publicly owned, and 2% is within the boundaries of Native American tribal reservations (Table 3B). These patterns vary substantially across the USA with private ownerships dominating in the North and South regions and public ownerships dominating in the Rocky Mountain and Pacific Coast regions (Figure 2). The greatest changes over the 2012 to 2019 remeasurement period were a 7% decrease in the area of Family forestland and a 14% increase in the area of Corporate forestland (Table 3C).
The relative distribution of forest-type groups (C&I 1.1.a) varies by ownership group and region (Figure 3). In the North, Family forestland has a relatively higher proportion of forest area covered by the Quercus/Carya (oak-hickory) forest-type group as compared to other ownership categories. In the South, Corporate forestland has a relatively higher proportion of Pinus taeda/P. echinata (loblolly-shortleaf pine). In the Rocky Mountain region, Tribal forestland has a relatively higher proportion of Pinus (pinyon)/Juniperus (piñon/juniper) and Local public forestland has a relatively higher proportion of woodland hardwoods. In the Pacific Coast region, Family and Other private forestlands have relatively higher proportions of western Quercus (western oaks).
Stands dominated by large trees occupy a plurality of the forestland across all ownership categories, ranging from 49% for Corporate forestland to 73% for Tribal forestland (C&I 1.1.a; Figure 4. Most other stands are dominated by either medium or small sized trees with a relatively even distribution between the two for most ownership categories. Non-stocked stands range from 2% of the forest area for Family and Other private forestlands to 5% for Federal forestland.
Including lands in GAP statuses 1, 2, and 3 and conservation easements, forest area in protected areas (C&I 1.1.b) in the conterminous USA is estimated to be 90 million ha (Table 3A; Figure 5). This ranges from less than 2% of Family and Tribal forestlands to 90% of Federal forestland (Table 3C). Of the total protected forest area, 94% is in Public ownership with 77% of the total in Federal ownership, 15% in State, and 2% in Local.
Forest area density, a proxy for forest fragmentation (C&I 1.1.c), averages 0.69 across the conterminous USA, meaning that, on average, 69% of the area surrounding forest plots is covered by forest. The mean forest area density is lower for Tribal forestland (0.59) than for other ownership categories which range from 0.67 for Family forestland to 0.76 for Other Private forestland (Table 3A). Forest area density increased for Tribal and Other Private forestland, but decreased for all other ownership groups (Table 3C); a decrease in this metric implies an increase in forest fragmentation.
Across all FIA inventory plots, 376 species of trees were tallied during the most recent inventories (C&I 1.2.a). The species counts range from 176 on Tribal forestland to 323 on Family forestland (Table 3A). In relative terms, this metric ranges from 3 species per million hectares for Family forestland to 43 trees species per million hectares for Local forestland (Table 3B).
The number of at-risk species (C&I 1.2.b) averages 2.3 species per inventory plot. This varies from no overlap with the ranges of at-risk species at a given sample point up to 18 with averages of less than 1.3 species per inventory plot on Federal and Tribal forestlands, to 3.3 species per inventory plot on Family forestland (Table 3B).

3.2. Criterion 2: Maintenance of Productive Capacity of Forest Ecosystems

The percentage of forestland that is productive (C&I 2.a), defined here using the FIA threshold of land that is capable of producing at least 1.4 m3 ha−1 yr−1 (20 ft3 ac−1 yr−1; [11]), varies across ownership categories and regions (Figure 6). Overall, unproductive forestland is most prevalent on Federal forestland in the Rocky Mountain region (29% of all unproductive forestland in the conterminous USA) followed by Family and Corporate forestlands in the South (19% and 14%, respectively), much of which is in western Texas and western Oklahoma. In relative terms, all of the Private forest ownership categories have at least 80% of their total forest areas in productive status, for Public ownerships this ranges from 91% for State to 71% for Federal, and Tribal is the lowest at 43% (Table 4B). The greatest relative changes over time are a 15% increase for Other Private and a 6% decrease for Corporate (Table 4C).
The total growing stock volume (C&I 2.b) across all ownerships is an estimated 36 × 109 m3 (Table 4A). Growing stock ranges from 87 m3 ha−1 for Tribal forestland to 157 m3 ha−1 for Federal forestland (Table 4B). The average annual growth (C&I 2.b) ranges from 2.0 m3 ha−1 for Federal and Other Private forestlands to 4.3 m3 ha−1 for Corporate forestland (Table 4B) with the greatest changes being a doubling of the growth rate on Other Private forestland (Table 4C). A total of 27 million ha of forestland have been artificially regenerated through planting or other means (C&I 2.c) with Corporate forestland having a plurality of this forest area (Table 4A) and the highest relative percentage, 26% (Table 4B), but also the greatest relative decrease (Table 4C).
Annual volume of removals (C&I 2.d) across the North, South, and Pacific Coast regions of the conterminous USA (the Rocky Mountain region is excluded from estimates of removals due to data unavailability) is estimated to be 357 million m3 (Table 4A). Most of the removals are from either Corporate (46%) or Family (42%) forestlands that have average removal intensities of 3.0 and 1.4 m3 ha−1 yr−1, respectively (Table 4B). The overall net growth to removal ratios is greater than one for the totals across all ownerships, but there are some species that are showing net growth to removal ratios of less than 1.0, signifying a net volume loss. Looking at the top ten most voluminous species within each ownership category: Abies magnifica and Pinus contorta on Federal forestland have net growth to removals of less 1.0 (and both have negative net growth rates); on Tribal forestlands, Larix occidentalis, Abies grandis, and Pinus ponderosa have ratios of less than 1.0; and on Corporate forestlands, Tsuga heterophylla and Acer saccharum have ratios of less than 1.0. All of the top ten species for the Family, Other Private, State, and Local ownership categories have net growth to removal ratios greater than 1.0.

3.3. Criterion 3: Maintenance of Forest Ecosystem Health and Vitality

The estimated area of forestland damaged by disease or pests (sub-element of C&I 3.a) is 26 million ha across all ownerships (Table 5A), but the percentages vary across ownership categories. The percentage of forest area damaged by disease or pests is 15% for Federal, 12% for State, 11% for Tribal, and less than 10% for all other ownership categories (Table 5B). Apart from a small decrease for Tribal forestland, all other ownership categories are showing increases in the area damaged between 4 and 7 percentage points (Table 5C).
The estimated forest area damaged by fire and storms (sub-element of C&I 3.b) is 28 million ha across all ownerships (Table 5A), this is in addition to the acreage damaged by disease and pests. The percentage of forest area damaged by fire or storms ranges from 4% for Local forestland to 10% for Federal forestland (Table 5B). Apart from State forestland, which is showing a decrease of 0.5 percentage points, all other ownership categories are showing increases in areas damaged from 0.1 to 1.9 percentage points (Table 5C).
The estimated forest area that is annually deforested (sub-element of C&I 3.b) is 1 million ha across the North, South, and Pacific Coast regions (Table 5A). The majority (64%) of this deforestation is occurring on Family forestlands, 17% on Corporate forestlands, and the remainder is spread across the other ownership categories. Deforestation rates are stable or increasing across all ownership categories (Table 5C).

3.4. Criterion 4: Soil and Water Conservation

Voluntary and regulatory state-level best management practices (BMPs) and Federal laws have been established to help protect soil and water resources. Compliance with forestry BMPs is generally high, with an estimated compliance rate of 89% across the U.S. [26] with reported implementation rates higher in the southeast and west than the northeast [27]. Not all states monitor BMP implementation, and not all reports divide results by ownership categories. Across published reports, many states have found Public and Corporate forestlands to have the highest implementation rates (e.g., Georgia [28], Oklahoma [29], Colorado [30], and East Texas [31]), although this pattern is not consistent across all state reports (e.g., Florida [32], North Carolina [33], and Indiana [34]). Tribal forestland is rarely included among the ownership categories studied, but Shy [35] is an exception and they found high implementation rates for Tribal forestland in Wisconsin that were similar to implementation rates on Federal and State lands in the state.
Looking beyond BMPs, which exist to limit risk to soil and water resources while pursuing other objectives, some forestland is managed for the express purpose of protecting soil and water resources, so-called “buffer” forests. This objective is likely more common on public and certain kinds of institutional ownerships (e.g., water company lands), but may exist to some extent on other types of ownerships as well. The authors are unaware of any data or analyses that have sought to quantify the prevalence of buffer forests at the national level.

3.5. Criterion 5: Carbon Sequestration

Above ground forest carbon (C&I 5.a) is estimated to be 14.0 billion metric tonnes across all forest ownerships of the conterminous USA. Most of this carbon is on Family (40%), Federal (29%), and Corporate (19%) forestlands (Table 6A). The per hectare amounts of above ground carbon average 30 t ha−1 for Tribal forestland, 47 t ha−1 for Corporate forestland, and above 50 t ha−1 for all other ownership categories (Table 6B). There have been small decreases in the amount of above ground carbon on Federal forestland and increases, often substantial, across all other ownership categories (Table 6C).

3.6. Criterion 6: Socioeconomic Benefits

Nationally, as of 2019, forests of the conterminous USA provide an estimated 153,247 jobs and USD 7.6 billion in wages via the forestry, logging, sawmill, and pulp mill sectors (C&I 6.3.a and 6.3.b; Table 7A). Total employment across these sectors has trended downward, while real wages have remained relatively constant or increased. The contribution of different ownerships to forest sector employment and wages, estimated by their contribution to harvests, varies by region. In the North, Family forestland contributes the largest proportion (49%) to employment across these sectors, followed by Corporate forestland (31%). Family forestland contributes a similar share of employment in the South (48%), with Corporate forestland contributing 47%. The Pacific region is led by jobs stemming from Corporate removals (64%), while the Rocky Mountain region is dominated by jobs supported by Federal removals (43%).

3.7. Criterion 7: Legal, Institutional, and Economic Frameworks

Legislation and policies in the USA can affect all or a subset of land uses, including forests, and all or a subset of ownership categories. Many of the laws are at the state level and can vary substantially from state to state. While some environmental laws, including the Federal Endangered Species Act and the Clean Water Act, apply across forest ownerships [22], most BMPs are implemented at the state level (see Criterion 4).
Federal lands are primarily held by two departments (US Department of Agriculture and US Department of Interior) and four agencies (Forest Service, National Park Service, Fish and Wildlife Service, and Bureau of Land Management [36]), and each have their own regulations based on their specific authorizing legislation and subsequent legislative and executive directives. Since the late 1990s, environmental policies have moved the managers of all Federal forestland to incorporate principles of ecosystem management, although there are differences in what this means and how it is implemented among agencies [37]. State forestlands are governed by their own policies, which vary by state. States have engaged in forest planning that spans State, Local, and Private forestlands for over a hundred years, which more recently has ranged from developing comprehensive statewide forest resource plans to plans required by forest practice regulatory programs, with foci on diverse topics ranging from economic development to water quality [38]. Private forestland is subject to relevant federal, state, and local policies, but activities are often not directly regulated [22]. States also provide other mechanisms to encourage sustainable forest management of Private forestland, such as voluntary programs, tax or financial incentives, technical assistance, and landowner education [22]. Certification of forestland, a market-based mechanism, has increased, although barriers remain for Family forest ownerships and Federal managers [39]. Tribal forestland is also subject to federal laws and policies, although inadequate financial support to implement these policies is thought to inhibit Tribes’ legal entitlement to full sovereignty and self-determination [24]. Tribal forestland is primarily held in trust by the Bureau of Indian Affairs (BIA), but the policies and legislation governing these lands and the trust responsibility have changed repeatedly, leaving a complicated and extensive set of rules for managing Tribal forests [24].
The clarity and security of property rights also vary across ownership categories. Private forestland is protected by law, which prevents the government from taking land without due process and due compensation. Tenure rights are also secure for Public forestland with the land use and management practices controlled by applicable laws and regulations that vary depending on the ownership type and objectives of the specific agencies. Native American tribal reservations are considered sovereign nations with land rights and allocations established through treaties and subsequent laws, such as the Dawes Act of 1887. Some Tribal land has been allocated to individuals with rights similar to Private forest owners, but most Tribal forestland is held in trust by the BIA with management goals that include sustained timber yield [24,40].

4. Discussion

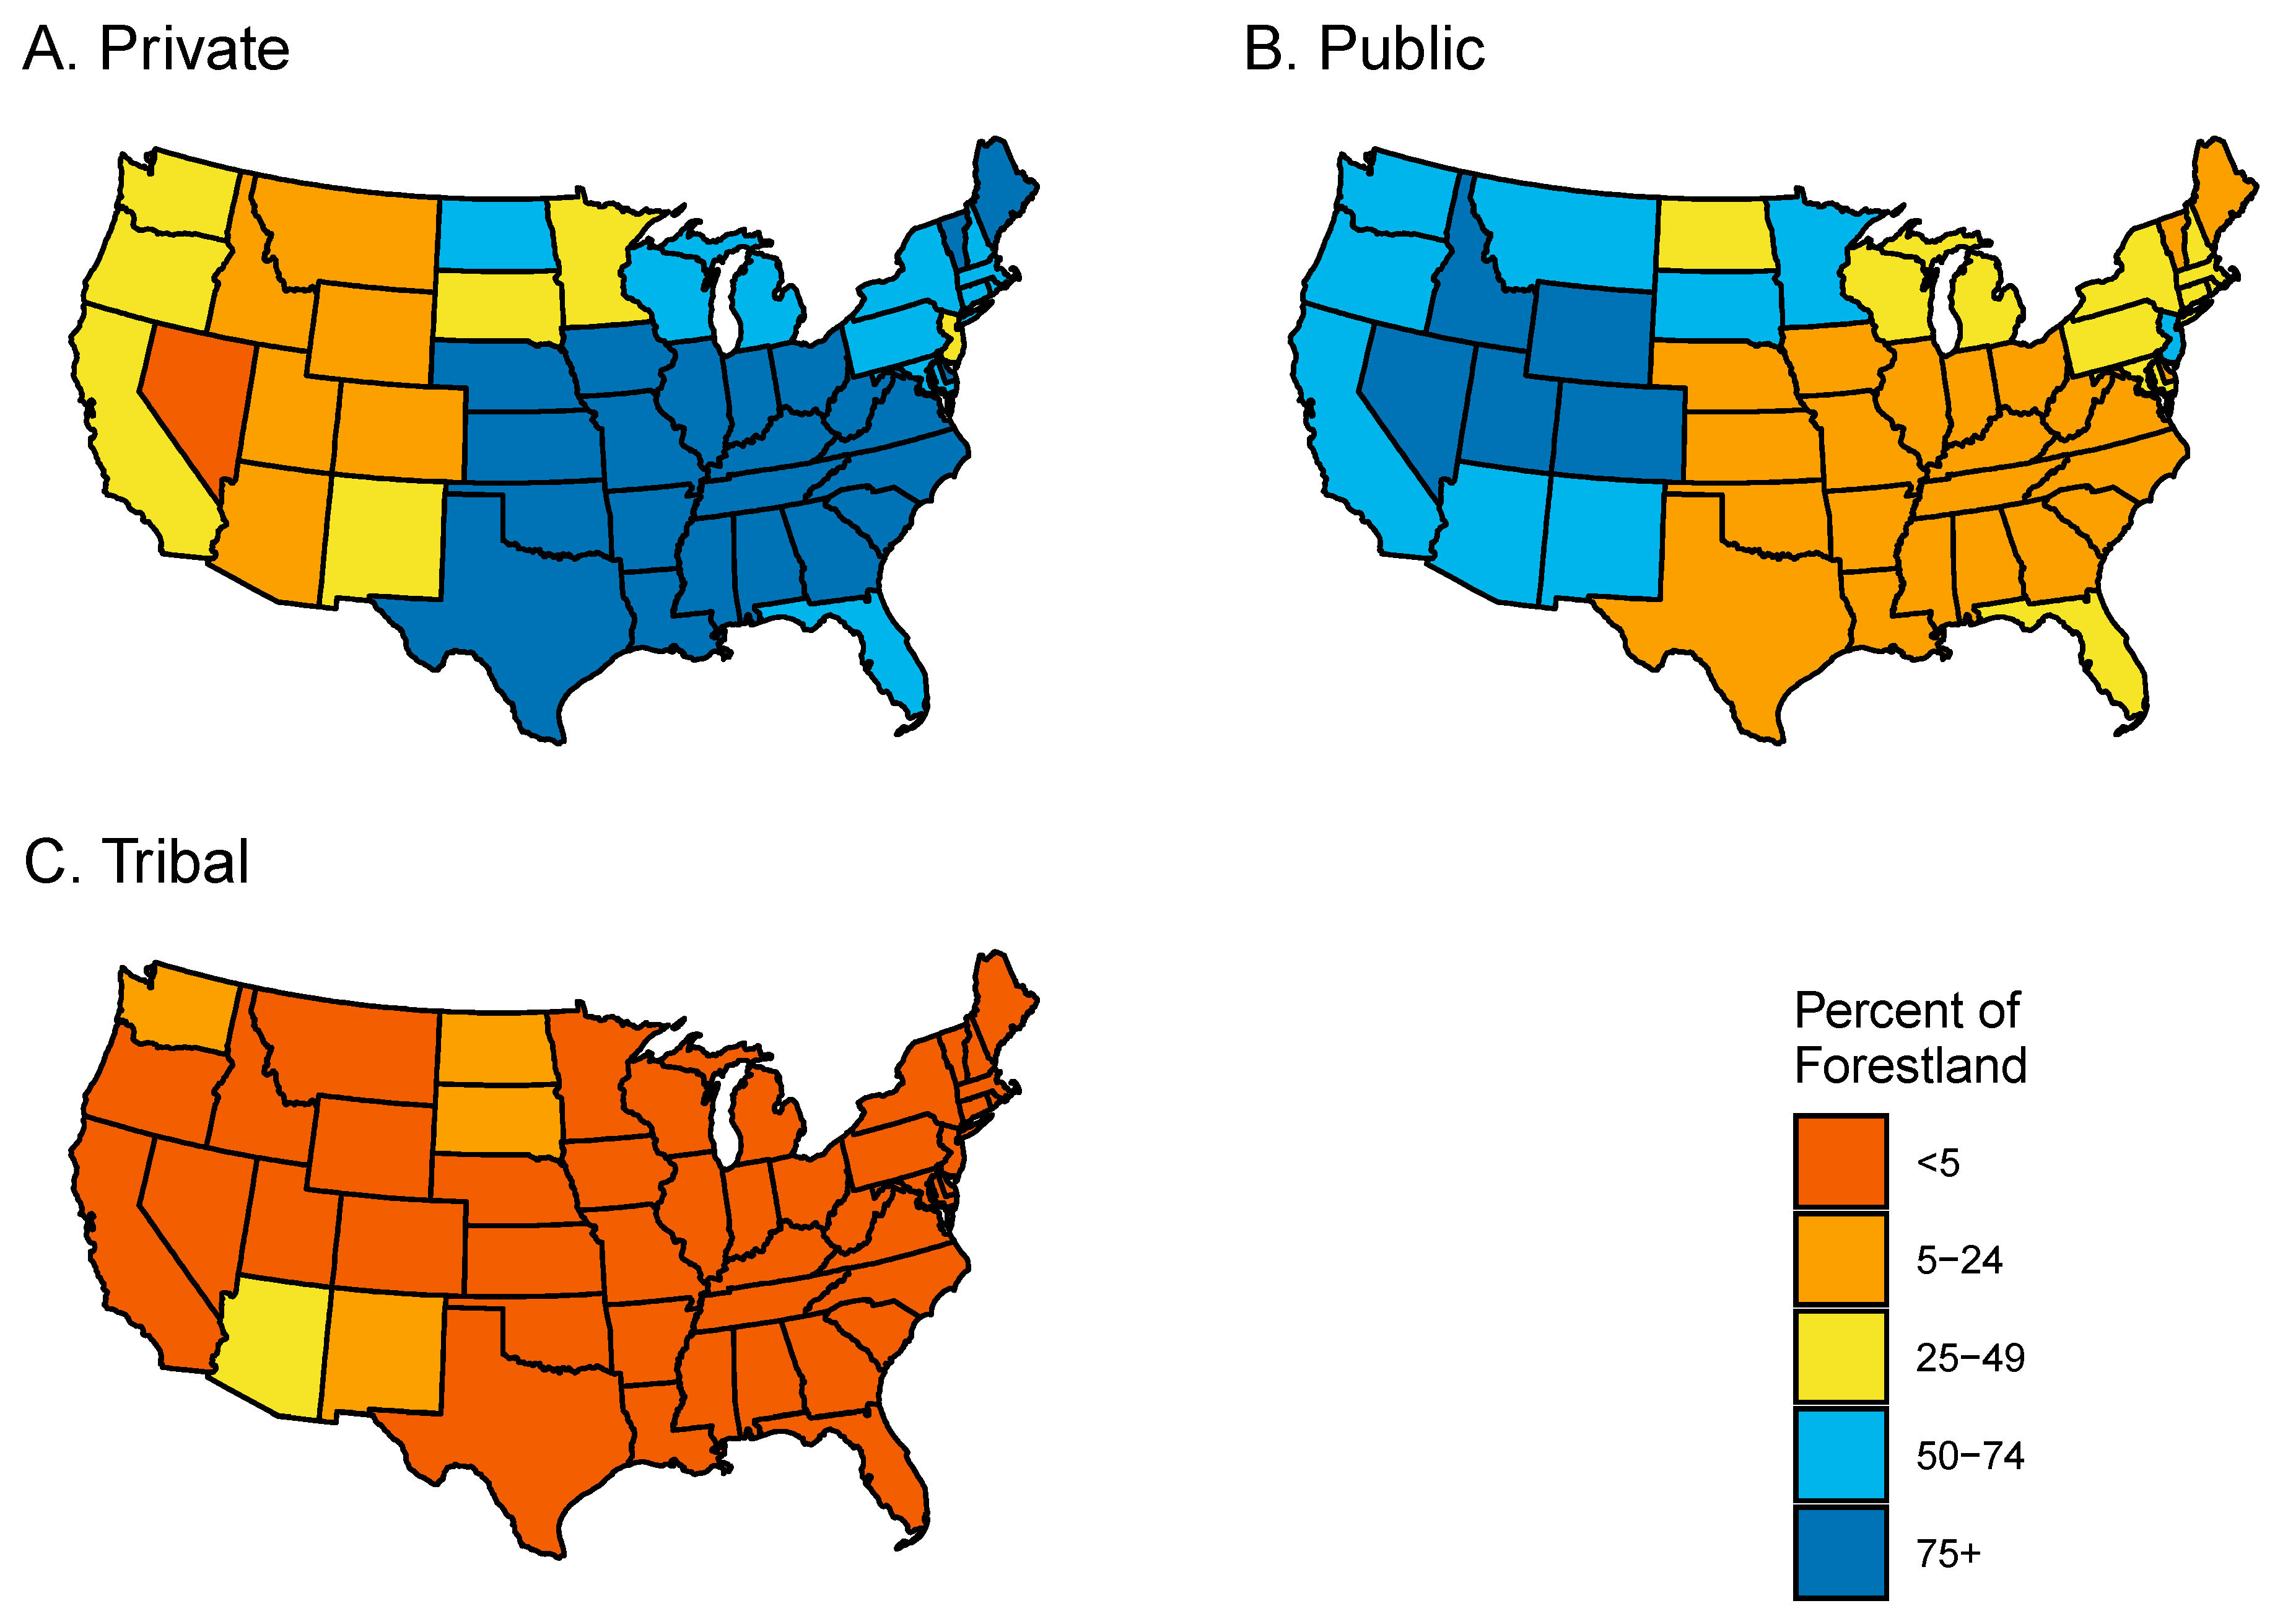
There are many C&I that have similar patterns across ownership categories, but there are also important differences. A large difference that has implications for many other attributes is the area covered by each ownership group and where these holdings are distributed across the USA (Figure 2). For example, due to historical factors, such as colonization/homesteading and public acquisition patterns, most of the Federal forestlands are concentrated in the western USA and much (but certainly not all) of this land is of lower productivity. In addition to the total forestland areas, the juxtaposition of the ownerships can be equally important as most forestland exists within a matrix of different ownership types that collectively influence the broader landscape characteristics and must be considered when developing landscape-level, cross-boundary initiatives [41].
Another important difference across ownership categories is the trends in forest areas (Table 3C). While the area of all Public and Tribal ownerships did not vary by more than 1% (and all had gains), Family and Other Private forestlands decreased by 7.7% and 1.4%, respectively, and Corporate forestland increased by 6.9%. Of particular concern is the loss of forestland to non-forest uses, including 627,000 ha yr−1 and 33,000 ha yr−1 from Family and Other Private forestlands, respectively (Table 3C). But of the land that is deforested, it is important to note that roughly half of the conversion is to agriculture and pasture [42], which is more likely to revert to forest cover as compared to other land uses, such as development.
The net loss of forestland from an ownership category does not mean that all of that acreage was converted to non-forest uses. Much of the loss of Family and Other Private forestlands is transfers to other ownership categories with Corporate being the largest sink [43]. Part of this transition is due to changes in ownership structure that are conducted primarily for tax purposes (e.g., a family or individual converting their holdings into a limited liability corporation) with few, if any, changes in management intent, and FIA’s inability to track these changes, but part is also due to investment and forestry companies acquiring Family forestland. Without a thorough analysis of the management practices and outcomes among these different ownership groups, it is impossible to determine whether this “loss” within ownership categories represents a problem or an opportunity from a sustainability perspective.
The net changes of forest area at the ownership category level fail to capture some important trends within each category. For example for Corporate forestland, there has been a dramatic shift in the last few decades from vertically-integrated forest products companies to institutional investors, including Timber Investment Management Organizations (TIMOs) that buy and sell forestland on behalf of institutional investors and individuals of high net worth, and Real Estate Investment Trusts (REITs), which are publicly traded companies that focus on real estate investments [44]. Among Family forest ownerships, the average land tenure is fairly long (21 years [1]), but these lands will eventually be sold or otherwise transferred to the next owners and this will result in opportunities for parcellation or consolidation of holdings [45]. All of these trends have potential implications in terms of forest retention, forest management practices, and, more broadly, forest sustainability.
Forest area status and trends set the base for all other C&I because trends in forest area can confound interpretation of other C&I. All of the totals, such as growing stock volume, are directly impacted by forest area trends. Examining relative statistics (e.g., Table 3C) can be useful, but this is only a partial solution. For example, the relative area of planted forests within an ownership category can be calculated, but a trend such as the reduction in percentage of area of Corporate forestland that has been planted (Table 4C) is not due to a net decrease in total area of planted forests; the absolute area actually increased, but the decrease was due to an influx of forestland from other ownership categories that was not planted.
The contributions of forests to biodiversity, at least in terms of number of tree species, varies considerably depending on whether absolute or relative statistics are examined. While Family forestland has the greatest number of tallied tree species, in part due to this ownership category representing a plurality of the nation’s forestland, Other Private and State forestlands have substantially higher relative numbers of trees species, 55 and 43 species per million ha, respectively, compared to other ownership categories. This is a reflection of these ownership categories being concentrated in areas of higher (tree) diversity and, to a certain extent, the ownerships focusing on acquiring rarer and more diverse properties.
For at-risk species, the greatest total area is again for Family forestland, but in relative terms all Private ownership categories are at similar levels, ranging from 62 to 65% of the forest area having one or more at-risk species, and the Public and Tribal categories vary substantially from 47% for Federal to 84% for State. Again, this is likely related to the location of these lands—with marked differences in the distribution of ownerships across ecoregions varying substantially in their baseline biodiversity. Although there was no way to separate at-risk forest species from other at-risk species, it is important to note that FIA plots with as little as 10% forest cover can be designated “forest,” and the parcels containing plots can have significant areas of non-forest cover types. For these reasons, although forest-associated at-risk species are probabilistically more likely to be found on FIA forest plots, no species can be categorically excluded. As such, the total number of at-risk species remains an appropriate index of the maximum potential number of endangered and at-risk species associated with a given FIA plot.
In terms of forest management, specifically timber harvesting (C&I 2.d), the patterns differ substantially across ownership categories. The plurality of the annual wood harvested comes from Corporate forestland followed closely by Family forestland, and the relative harvesting intensities, 3.0 and 1.4 m3 ha−1 yr−1, respectively (Table 4B), reflect this trend. This is logical given the importance of financial returns to many Corporate [44] and some Family [1] ownerships and the constraints and relatively lower emphasis placed on this activity for other ownerships. The lower harvesting rates are one of the factors influencing the higher per hectare volumes for Federal ownerships. The ratios of net growth to removals are above 1.0 for the totals and 90% of the most voluminous species. The ownership/species combinations with ratios of less than 1.0 are largely a result of pests, fires, and other disturbances negatively impacting growth. There are other species that may not be nationally prevalent but are important at the regional or local level that also have net growth to removal ratios of less than 1.0, but these too often face other threats, such as Fraxinus americana (American white ash) being decimated by Agrilus planipennis (emerald ash borer). Although the ratio of net growth-to-removals provides a convenient metric of the sustainability of species or groups of species across a managed landscape, there is significant potential for this metric to overestimate the margins available for sustained yield, especially where operational constraints or ownership objectives can lead to significant acreage remaining effectively reserved [46]. Under these conditions, localized pockets of unsustainable loss within a given ownership category may persist within a region characterized by overall ratios greater than 1.0 for one or more species.
Damage is occurring across all ownership categories, but the relative proportions are highest for Federal forestland (Table 3B), which due to historical reasons are more likely to be in arid and fire dependent ecosystems as compared to other ownership categories. The specific vectors, i.e., specific diseases, pests, or types of weather events, vary by geography. This partially explains the differences observed, but there are also mitigating factors due to management, or lack of management, occurring on some lands.
Trends in standing carbon and carbon sequestration are directly related to volume trends. Both carbon and volume trends are influenced by the cumulative impacts of harvesting, disturbance, productivity, and other factors. For example, the large net increases on Other Private and Family forestlands are a result of the relatively high growth rates compared to harvesting and other disturbances. The net decrease on Federal forestlands is largely driven by losses to disturbances, such as pests and wildfire.
Forest area density, a proxy of forest fragmentation (C&I 1.1.c), is declining across all ownership classes from 2006 to 2016 implying increased fragmentation. Tribal ownerships show a substantially lower value for this metric across the study period as compared to other ownership groups. This is likely due to a concentration of Tribal forestland in the arid west, rather than differences in management or land use transitions. Across all other ownerships, density declined by an absolute change of 0.05 (from an average 0.74 to 0.69) across the remeasurement period.
One especially important difference across ownership categories is related to if and how ownerships can influence the causes of the observed trends, which is partially captured by Criterion 7. The Legal and Institutional Frameworks assessed by this criterion describe the broad constraints within which the owners and managers operate and have enormous consequences on forest sustainability. For example, most Public forestland will stay undeveloped for perpetuity. Private forestland, apart from that with conservation easements, have a higher, although still relatively low, probability of conversion, but Private lands also have a higher probability of being a source of new forests through, for example, afforestation of marginal agricultural land. The high percentage of Public, and in particular Federal, forestland that is protected is due to the legislative mandates that established and dictate the uses of these lands. Conservation easements are the only mechanism for permanently conserving Private forestlands with 6% of these lands under an easement according to the Protected Areas Database [16], although there are likely more easements on private lands that are missing from this database due to no complete national repositories for this information. For example, earlier analyses using the USDA Forest Service, National Woodland Owner Survey [5] suggest that easements on family forest lands specifically may almost be twice as prevalent as those found using the Protected Areas Database.
There are also finer level ownership attributes, such as ownership and management objectives, financial resources, and size of holdings, which are not captured by the C&I, but this is understandable given that the C&I were developed for country level assessments. Relevant differences in ownership/management objectives include, for example, more of a focus on economic returns for Corporate forestland [44] and more of a focus on amenity values for Family forestland [1], but there is a mix or continuum of objectives within each category, and this diversity can be advantageous in that a broader mix of goods and services are more likely to be provided.
Another area influenced by the legal and institutional frameworks is the awareness levels of owners and the tools and resources available to them. There are several hypotheses for why Family forest ownerships may trail other ownership categories in BMP implementation, including lower awareness of BMPs and their importance [47], many years or decades between harvests, which decreases owners’ exposure to these requirements and recommendations [48], and a lack of technical resources [48].
The Montréal Process frames legislation and policies that conserve and support forest function as a prerequisite to sustainable forest management. For example, secure land tenure is important for the welfare of people and forests. While most Private and Public ownerships have secure title, the history of land tenure for Indigenous people is wrought with land seizures and problematic treaties. Despite these challenges, Tribes have been noted for their exemplary forestry practices, and an increase in self-governance and self-determination has strengthened their ability to foster healthy forests [49]. Although outside the scope of this paper, there are unique histories and policies related to the rights of Indigenous peoples in Alaska, Hawaii, and the protectorates and territories of the USA that are important to consider in the context of forest sustainability in those areas.
While tenure is secure for most Family forest ownerships, this is not the case for the forestland that is held as heirs’ property, where land has been passed on to future generations without clear title to the land and this creates challenges for owners’ abilities to manage and maintain ownership of their forestland [50]. Heirs’ property is most common among Black landowners in the South, poor rural landowners in Appalachia, and Indigenous landowners [51,52].
Just over half of the Montréal Process C&I, i.e., Criteria 6 and 7, are socioeconomic in nature, but the C&I summarized in this article are largely biophysical in nature. This is due to data limitations. For example, logging and wood products represent only a portion of the economic benefits provided by the forests, which also provide many other ecosystem services, such as clean water, recreational opportunities, and nontimber forest products, but these are more difficult to directly measure, let alone separate by ownership category.
Assessing sustainability is fraught with challenges from how to define it, to how to measure it, to how to interpret the results. The Montréal Process C&I while imperfect, as are all systems designed to assess abstract concepts, have been developed by a broad coalition, have been widely applied, and have been periodically revised [7,53]. For objectives like those of this paper, a comparison across ownership groups, the C&I provide an objective means of assessing commonalities and differences through syntheses of data that are often complex and disparate. However, the Montréal Process C&I were not designed with this objective in mind, and some metrics can therefore be harder to interpret, such as when forest acreage is “lost” from one ownership group to another. The application of C&I necessitates examination of broad patterns, which are important in showing broad trends, and hopefully highlight areas where the finer details can be expounded on in future efforts and causal factors investigated.
The data and methods available for assessing forest sustainability are continually changing [54]. The USDA Forest Service, Forest Inventory and Analysis program is the primary data source used here and in most assessments at the national, regional, and state level in the USA. As with national forest inventories for other countries, the consistency of data collection over time is critical. Harmonization of data collection will facilitate comparisons and is what made the cross-ownership comparison of this paper possible. At the same time, there are many ecosystem services, such as recreational access, and socio-psychological factors, such as ownership and management objectives, that are not regularly assessed nor reported across all ownership categories.
The underlying trends in forest sustainability are influenced by many factors, some of which are in the immediate control of the owners and others that are not. Historical factors, including colonization, homesteading, land forfeiture, and land acquisition acts, such as the Weeks Act which was responsible for the creation of most of the National Forests in the eastern USA, have influenced the broad ownership patterns across the USA. This in turn is connected to forest productivity, forest types, and other factors.
Although the focus of this paper is on the USA, the findings are potentially applicable to other countries with similar ownership types. What is limiting international comparisons is a lack of analogous analyses in other countries where the Montréal Process is being implemented, but the analytical framework developed here could be applied. These analyses would allow for those countries to compare trends across ownership categories and, as with the results here, be used to inform policies and other approaches tailored to the opportunities and challenges confronted by different ownership groups.

5. Conclusions

Based on the Montréal Process C&I framework and the available data, there are many commonalities across ownership categories in the USA, but there are also important differences. Arguably the most important indicator is forest area, and there are divergent patterns in the trends across ownership categories (including an estimated annual loss of 1.1 ha of Family forestland) that could be addressed by policies. For example, the deforestation rates observed on Family forestland could be at least partially mitigated through increased incentives related to targeted conservation easements. Conserved lands have been found to have more than just ecological benefits, Sims et al. [55] found that conserved lands in New England contributed to local economic growth.
Other important cross-ownership C&I patterns and trends include recognition of most timber removals coming from Corporate and Family ownerships, most species having positive growth to removal ratios, but negative for species on some ownerships, widespread disturbances, and widely varying legal and institutional structures. It is important that trends in these C&I continue to be monitored, additional data are collected to assess more C&I, and the C&I themselves continue to be periodically assessed and expanded as appropriate.
Some of the largest challenges facing forests in the decades to come include threats from climate change, wildfires, pests, and deforestation. By understanding the role of forest ownership, policies and programs can be designed that harness the collective strengths of the different structures. There are large threats to forests, but there are also substantial opportunities to help not just the forests and their owners, but also the broader environment and society. By using C&I to identify areas of concern regarding the sustainability across ownerships, future research can be tailored to investigate the underlying causal factors and, in turn, contribute to further refining policies and programs.

Supplementary Materials

The following are available online at https://0-www-mdpi-com.brum.beds.ac.uk/article/10.3390/f13070992/s1. S1. US Department of Agriculture, Forest Service, Forest Inventory and Analysis plot inventory evaluation groups for 2009–2019 used in “Cross-boundary Sustainability: Assessment across Forest Ownership Categories in the Conterminous USA using the Montréal Process Criteria and Indicators Framework”.

Author Contributions

Conceptualization, B.J.B.; methodology, B.J.B., J.C., J.D.H., S.P., K.R. and E.M.S.; formal analysis, B.J.B., J.C., J.D.H. and E.M.S.; writing—original draft preparation, B.J.B., J.C., J.D.H. and E.M.S.; writing—review and editing, B.J.B., J.C., J.D.H., S.P., K.R. and E.M.S.; supervision, B.J.B.; funding acquisition, B.J.B. All authors have read and agreed to the published version of the manuscript.

Funding

This research was partially funded by a grant from the US Department of Agriculture, Forest Service, Northern Research Station to the University of Massachusetts Amherst (Grant no. 20-JV-11242305-074).

Data Availability Statement

All data analyzed are available from the corresponding author. Due to data confidentiality restrictions, specific locations of the FIA inventory plots cannot be shared. Publicly available versions of the basic datasets can be obtained from https://www.fia.fs.fed.us/tools-data/ (accessed on 23 June 2022).

Acknowledgments

We are grateful to Kathleen McGinley, Guy Robertson, and John Stanovick for comments on earlier drafts of this paper.

Conflicts of Interest

The authors declare no conflict of interest.

References

  1. Butler, B.J.; Butler, S.M.; Caputo, J.; Dias, J.; Robillard, A.; Sass, E.M. Family Forest Ownerships of the United States, 2018: Results from the USDA Forest Service, National Woodland Owner Survey; USDA Forest Service, Northern Research Station: Madison, WI, USA, 2021; p. 52. [CrossRef]
  2. The Montréal Process. Montréal Process: Criteria and Indicators for the Conservation and Sustainable Management of Temperate and Boreal Forests. 2015. Available online: https://www.montrealprocess.org/documents/publications/techreports/MontrealProcessSeptember2015.pdf (accessed on 21 January 2021).
  3. Chandran, A.; Innes, J.L. The State of the Forest: Reporting and Communicating the State of Forests by Montreal Process Countries. Int. For. Rev. 2014, 16, 103–111. [Google Scholar] [CrossRef]
  4. Robertson, G.; Gaulke, P.; McWilliams, R.; LaPlante, S.; Guldin, R. National Report on Sustainable Forests--2010; USDA Forest Service: Washington, DC, USA, 2011; p. 212. Available online: https://www.fs.usda.gov/treesearch/pubs/54685 (accessed on 21 January 2021).
  5. Butler, B.J.; Caputo, J.; Henderson, J.D.; Pugh, S.A.; Riitters, K.H.; Sass, E.M. An Assessment of the Sustainability of Family Forests in the U.S.A. For. Policy Econ. 2022, 142, 102783. [Google Scholar] [CrossRef]
  6. McGinley, K.A.; Cubbage, F.W. Examining Forest Governance in the United States through the Montréal Process Criteria and Indicators Framework. Int. For. Rev. 2017, 19, 192–208. [Google Scholar] [CrossRef]
  7. Riitters, K.; Robertson, G. The United States’ Implementation of the Montréal Process Indicator of Forest Fragmentation. Forests 2021, 12, 727. [Google Scholar] [CrossRef]
  8. Howell, C.I.; Wilson, A.D.; Davey, S.M.; Eddington, M.M. Sustainable Forest Management Reporting in Australia. Ecol. Indic. 2008, 8, 123–130. [Google Scholar] [CrossRef]
  9. Gilani, H.R.; Innes, J.L. The State of Canada’s Forests: A Global Comparison of the Performance on Montréal Process Criteria and Indicators. For. Policy Econ. 2020, 118, 102234. [Google Scholar] [CrossRef]
  10. McGinley, K.A.; Robertson, G.C.; Friday, K.S. Examining the Sustainability of Tropical Island Forests: Advances and Challenges in Measurement, Monitoring, and Reporting in the U.S. Caribbean and Pacific. Forests 2019, 10, 946. [Google Scholar] [CrossRef] [Green Version]
  11. Burrill, E.A.; Wilson, A.M.; Turner, J.A.; Pugh, S.A.; Menlove, J.; Christensen, G.; Conkling, B.L.; Winnie, D. The Forest Inventory and Analysis Database: Database Description and User Guide for Phase 2 (Version 8.0); U.S. Department of Agriculture, Forest Service: Washington, DC, USA, 2018; p. 946. Available online: www.fia.fs.fed.us/library/database-documentation (accessed on 23 June 2022).
  12. Oswalt, S.N.; Smith, W.B.; Miles, P.D.; Pugh, S.A. Forest Resources of the United States, 2017: A Technical Document Supporting the Forest Service Update of the 2020 RPA Assessment; U.S. Department of Agriculture, Forest Service: Washington, DC, USA, 2019; p. 223. [CrossRef] [Green Version]
  13. Bechtold, W.A.; Patterson, P.L. The Enhanced Forest Inventory and Analysis Program--National Sampling Design and Estimation Procedures; U.S. Department of Agriculture, Forest Service, Southern Research Station: Asheville, NC, USA, 2005; p. 85. [CrossRef]
  14. McRoberts, R.E.; McWilliams, W.H.; Reams, G.A.; Schmidt, T.L.; Jenkins, J.C.; O’Neill, K.P.; Miles, P.D.; Brand, G.J. Assessing Sustainability Using Data from the Forest Inventory and Analysis Program of the United States Forest Service. J. Sustain. For. 2004, 18, 23–46. [Google Scholar] [CrossRef]
  15. Miles, P.D. Using Biological Criteria and Indicators to Address Forest Inventory Data at the State Level. For. Ecol. Manag. 2002, 155, 171–185. [Google Scholar] [CrossRef]
  16. U.S. Geological Survey (USGS) Gap Analysis Project (GAP). Protected Areas Database of the United States (PAD-US) 2.1; Data Release; U.S. Geological Survey: Reston, VA, USA, 2020. Available online: https://www.sciencebase.gov/catalog/item/5f186a2082cef313ed843257 (accessed on 23 June 2022).
  17. Homer, C.; Dewitz, J.; Jin, S.; Xian, G.; Costello, C.; Danielson, P.; Gass, L.; Funk, M.; Wickham, J.; Stehman, S.; et al. Conterminous United States Land Cover Change Patterns 2001–2016 from the 2016 National Land Cover Database. ISPRS J. Photogramm. Remote Sens. 2020, 162, 184–199. [Google Scholar] [CrossRef]
  18. NatureServe. Map of Biodiversity Importance; 2021; Available online: https://www.natureserve.org/access-data (accessed on 23 June 2022).
  19. U.S. Bureau of Labor Statistics (US-BLS). Quarterly Census of Employment and Wages Data Files; U.S. Bureau of Labor Statistics: Washington, DC, USA, 2020. Available online: https://www.bls.gov/cew/downloadable-data-files.htm (accessed on 23 June 2022).
  20. USDA Forest Service, Forest Inventory and Analysis (USFS FIA). Custom Data Retrieval from the USDA Forest Service, Forest Inventory and Analysis Database (Queries and Results Available from B.J. Butler upon Request); USDA Forest Service, Forest Inventory and Analysis: Washington, DC, USA, 2021.
  21. Ellefson, P.V.; Hibbard, C.M.; Kilgore, M.A.; Granskog, J.E. Legal, Institutional, and Economic Indicators of Forest Conservation and Sustainable Management: Review of Information Available for the United States; U.S. Department of Agriculture, Forest Service, Southern Research Station: Asheville, NC, USA, 2005; p. 221. [CrossRef]
  22. Cubbage, F.W.; McGinley, K.A.; O’Laughlin, J. Legislation and Policies Supporting the Sustainable Management of Forests (Indicator 45). In Legal, Institutional, and Economic Indicators of Forest Conservation and Sustainable Management in the United States: Analyzing Criterion 7 of the Montréal Process Criteria and Indicators Framework; McGinley, K.A., Cubbage, F.W., Eds.; U.S. Department of Agriculture, Forest Service, International Institute of Tropical Forestry: Rio Piedras, PR, USA, 2020; pp. 9–39. [Google Scholar]
  23. Cubbage, F.W.; McGinley, K.A. Clarity and Security of Land and Resource Tenure and Property Rights (Indicator. In Legal, Institutional, and Economic Indicators of Forest Conservation and Sustainable Management in the United States: Analyzing Criterion 7 of the Montréal Process Criteria and Indicators Framework; McGinley, K.A., Cubbage, F.W., Eds.; USDA Forest Service, International Institute of Tropical Forestry: Rio Piedras, PR, USA, 2020; pp. 89–104. [Google Scholar]
  24. Indian Forest Management Assessment Team. An Assessment of Indian Forests and Forest Management in the United States: Vol I. 2013, p. 74. Available online: https://www.itcnet.org/issues_projects/issues_2/forest_management/assessment.html (accessed on 23 June 2022).
  25. R Core Team. R: A Language and Environment for Statistical Computing; R Foundation for Statistical Computing: Vienna, Austria, 2021; Available online: http://www.R-project.org (accessed on 23 June 2022).
  26. Ice, G.G.; Schilling, E.G.; Vowell, J.G. Trends for Forestry Best Management Practices Implementation. J. For. 2010, 108, 267–273. [Google Scholar] [CrossRef]
  27. Cristan, R.; Michael Aust, W.; Chad Bolding, M.; Barrett, S.M.; Munsell, J.F. National Status of State Developed and Implemented Forestry Best Management Practices for Protecting Water Quality in the United States. For. Ecol. Manag. 2018, 418, 73–84. [Google Scholar] [CrossRef]
  28. Dwivedi, P.; Tumpach, C.; Cook, C.; Izlar, B. Effects of the Sustainable Forestry Initiative Fiber Sourcing Standard on the Average Implementation Rate of Forestry Best Management Practices in Georgia, United States. For. Policy Econ. 2018, 97, 51–58. [Google Scholar] [CrossRef]
  29. Hunkapillar, D.; Atkinson, K. Results of 2007–2010 BMP Implementation Monitoring; Oklahoma Department of Agriculture, Forestry Services Division: Oklahoma City, OK, USA, 2010; p. 40. Available online: https://ag.ok.gov/wp-content/uploads/2020/12/OFS-Report-Implementation-of-Forestry-Best-Management-Practices-in-Eastern-Oklahoma-2010.pdf (accessed on 23 June 2022).
  30. Edwards, R.M.; Castello, E. Colorado Forestry Best Management Practices Forest Stewardship Guidelines for Water Quality Protection 2018 Field Monitoring Report; Colorado State Forest Service: Fort Collins, CO, USA, 2020; p. 28. Available online: https://csfs.colostate.edu/wp-content/uploads/2020/08/2018_BMP_Audit.pdf (accessed on 23 June 2022).
  31. Simpson, H.; Thomas, T.; Work, D. Voluntary Implementation of Forestry Best Management Practices in East Texas; Texas A&M Forest Service: College Station, TX, USA, 2015; p. 60. Available online: https://tfsweb.tamu.edu/uploadedFiles/TFSMain/Manage_Forest_and_Land/Water_Resources_and_BMPs/Stewardship(1)/Round%209%20BMP%20Implementation%20Report(2).pdf (accessed on 23 June 2022).
  32. Nowak, J.; McCarthy, W.; Holland, R. Results of Florida’s 2019 Silviculture BMP Implementation Survey; Florida Forest Service: Tallahassee, FL, USA, 2020; p. 52. Available online: https://www.fdacs.gov/content/download/78966/file/silviculture-bmp-2019-implementation-survey-report.pdf (accessed on 23 June 2022).
  33. Coats, W.A. An Assessment of Forestry Best Management Practices in North Carolina 2012-2016; North Carolina Department of Agriculture and Consumer Services, Water Resources Branch North Carolina Forest Service: Raleigh, NC, USA, 2018; p. 56. Available online: https://www.ncforestservice.gov/water_quality/pdf/BMP_Assessment_Report_2012-2016.pdf (accessed on 23 June 2022).
  34. McCoy, D.; Sobecki, J. Comprehensive Indiana Forestry Best Management Practices Monitoring Results 1996-2016; Indiana Department of Natural Resources: Indianapolis, IN, USA, 2016; p. 62. Available online: https://www.in.gov/dnr/forestry/files/fo-1996_2016_State_Forest_BMP_Report.pdf (accessed on 23 June 2022).
  35. Shy, K. Wisconsin’s Forestry Best Management Practices for Water Quality 1995–2005; Wisconsin Department of Natural Resources Division of Forestry: Madison, WI, USA, 2006; p. 24.
  36. Gorte, R.W.; Vincent, C.H.; Hanson, L.A.; Rosenblum, M.R. Federal Land Ownership: Overview and Data; Library of Congress. Congressional Research Service: Washington, DC, USA, 2012; p. 27.
  37. Nie, M. Whatever Happened to Ecosystem Management and Federal Land Planning? In The Laws of Nature: Reflections on the Evolution of Ecosystem Management Law and Policy; University of Akron Press: Akron, OH, USA, 2013; pp. 68–95. [Google Scholar]
  38. Ellefson, P.V.; Hibbard, C.M. Forest Planning, Assessment, and Policy Review (Indicator 49). In Legal, Institutional, and Economic Indicators of Forest Conservation and Sustainable Forest Management: Review of Information Available for the United States; Ellefson, P.V., Hibbard, C.M., Kilgore, M.A., Granskog, J.E., Eds.; U.S. Department of Agriculture Forest Service, Southern Research Station: Asheville, NC, USA, 2005; pp. 24–43. [Google Scholar]
  39. Fernholz, K.; Howe, J.; Bratkovich, S.; Bowyer, J. Forest Certification: A Status Report; Dovetail Partners, Inc.: Minneapolis, MN, USA, 2010; p. 15. Available online: https://www.dovetailinc.org/portfoliodetail.php?id=5e48083013338 (accessed on 23 June 2022).
  40. Office of Indian Economic Development Benefits of Trust Land Acquisition (Fee to Trust). Available online: https://www.bia.gov/service/trust-land-acquisition/benefits-trust-land-acquisition (accessed on 3 November 2021).
  41. Floress, K.; Connolly, S.; Halvorsen, K.E.; Egan, A.; Schuler, T.; Hill, A.; DeSenze, P.; Fenimore, S.; Karriker, K. Implementing Landscape Scale Conservation across Organizational Boundaries: Lessons from the Central Appalachian Region, United States. Environ. Manag. 2018, 62, 845–857. [Google Scholar] [CrossRef] [PubMed]
  42. Alig, R.J.; Plantinga, A.J.; Haim, D.; Todd, M. Area Changes in U.S. Forests and Other Major Land Uses, 1982 to 2002, with Projections to 2062; U.S Forest Service, Pacific Northwest Research Station: Portland, OR, USA, 2010; p. 98. Available online: http://www.fs.fed.us/pnw/pubs/pnw_gtr815.pdf (accessed on 23 June 2022).
  43. Sass, E.M.; Markowski-Lindsay, M.; Butler, B.J.; Caputo, J.; Hartsell, A.; Huff, E.; Robillard, A. Dynamics of Large Corporate Forestland Ownerships in the United States. J. For. 2021, 119, 363–375. [Google Scholar] [CrossRef]
  44. Clutter, M.; Mendell, B.; Newman, D.; Wear, D.; Greis, J. Strategic Factors Driving Timberland Ownership Changes in the U.S. South; 2005; Available online: https://www.iatp.org/sites/default/files/181_2_78129.pdf (accessed on 23 June 2022).
  45. Caputo, J.; Butler, B.J.; Brandeis, T.; Riitters, K. Changes in Land Use, Forest Ownership, Parcel Size, and Fragmentation in Forests of the U.S. South; U.S. Department of Agriculture Forest Service, Southern Research Station: Asheville, NC, USA, 2020; p. 16. Available online: https://www.fs.usda.gov/treesearch/pubs/60404 (accessed on 23 June 2022).
  46. Canham, C.D.; Rogers, N.; Buchholz, T. Regional Variation in Forest Harvest Regimes in the Northeastern United States. Ecol. Appl. 2013, 23, 515–522. [Google Scholar] [CrossRef]
  47. Hameister, A.; Fox, J. Results of the 2017–2018 BMP Implementation Survey; Arkansas Forestry Commission: Little Rock, AR, USA, 2018; p. 26. Available online: https://www.agriculture.arkansas.gov/wp-content/uploads/2020/05/BMP_Imp._Report_8th_edition_for_website-1.pdf (accessed on 23 June 2022).
  48. Sugden, B.D.; Ethridge, R.; Mathieus, G.; Heffernan, P.E.W.; Frank, G.; Sanders, G. Montana’s Forestry Best Management Practices Program: 20 Years of Continuous Improvement. J. For. 2012, 110, 328–336. [Google Scholar] [CrossRef] [Green Version]
  49. Gordon, J.; Sessions, J.; Bailey, J.; Cleaves, D.; Corrao, V.; Leighton, A.; Mason, L.; Rasmussen, M.; Salwasser, H.; Sterner, M. Assessment of Indian Forests and Forest Management in the United States: Executive Summary; The Third Indian Forest Management Assessment Team for the Inter-Tribal Timber Council, USDA Forest Service & US Department of the Interior: Washington, DC, USA, 2013. Available online: https://www.itcnet.org/file_download/4f8e541e-f355-4da6-92d3-131e0013828d (accessed on 23 June 2022).
  50. Hitchner, S.; Schelhas, J.; Gaither, C.J. “A Privilege and a Challenge”: Valuation of Heirs’ Property by African American Landowners and Implications for Forest Management in the Southeastern U.S. Small-Scale For. 2017, 16, 395–417. [Google Scholar] [CrossRef]
  51. Deaton, B.J. A Review and Assessment of the Heirs’ Property Issue in the United States. J. Econ. Issues 2012, 46, 615–632. [Google Scholar] [CrossRef]
  52. Johnson Gaither, C. Have Not Our Weary Feet Come to the Place for Which Our Fathers Sighed? Heirs’ Property in the Southern United States; U.S. Department of Agriculture Forest Service, Southern Research Station: Asheville, NC, USA, 2016; p. 31. Available online: https://www.fs.usda.gov/treesearch/pubs/53186 (accessed on 23 June 2022).
  53. Brand, D.G. Criteria and Indicators for the Conservation and Sustainable Management of Forests: Progress to Date and Future Directions. Biomass Bioenergy 1997, 13, 247–253. [Google Scholar] [CrossRef]
  54. Potter, K.M.; Riitters, K. A National Multi-Scale Assessment of Regeneration Deficit as an Indicator of Potential Risk of Forest Genetic Variation Loss. Forests 2022, 13, 19. [Google Scholar] [CrossRef]
  55. Sims, K.R.E.; Thompson, J.R.; Meyer, S.R.; Nolte, C.; Plisinski, J.S. Assessing the Local Economic Impacts of Land Protection. Conserv. Biol. 2019, 33, 1035–1044. [Google Scholar] [CrossRef] [PubMed]
Figure 1. Regions used to analyze Montréal Process Criteria and Indicators across forest ownership categories of the conterminous USA.
Forests 13 00992 g001
Figure 2. Percentage of forestland by ownership category, conterminous USA, 2019. Data source: [1].
Forests 13 00992 g002
Figure 3. Relative proportion of forestland by forest-type group, and ownership category for the (A) North, (B) South, (C) Rocky Mountain, and (D) Pacific Coast regions, conterminous USA, 2019. The top five forest-type groups, based on area, in each region are presented. Data source: [20].
Forests 13 00992 g003
Figure 4. Relative proportion of forestland by stand size and ownership category, conterminous USA, 2019. Data source: [20].
Forests 13 00992 g004
Figure 5. Relative proportion of forestland by protection status and ownership category, conterminous USA, 2019. Descriptions of the protection status categories are included in the methods section. Data source: [16].
Forests 13 00992 g005
Figure 6. Proportion of forestland that is productive (i.e., ≥1.4 m3 ha−1 year−1) by ownership category and region, conterminous USA, 2019. Data source: US Department of Agriculture, Forest Service, Forest Inventory and Analysis [20].
Forests 13 00992 g006
Table 1. Selected Montréal Process Criteria and Indicators (C&I) and associated data sources used to assess the sustainability across forest ownership categories in the conterminous USA. C&I numbering corresponds to the numbering used in the Montréal Process [2] and descriptions refer to the specific elements included in this paper.
Criterion/IndicatorDescriptionData Source(s) *
Criterion 1: Conservation of biological diversity
 1.1.aTotal forest area and forest area by forest-type group and stand sizeFIA
 1.1.bForest area in protected areasPAD
 1.1.cForest fragmentationNLCD
 1.2.aNumber of tree speciesFIA
 1.2.bNumber of at-risk speciesNature Serve
Criterion 2: Maintenance of productive capacity of forest ecosystems
 2.aForest area that is commercially productiveFIA
 2.bTotal growing stock and annual growth ratesFIA
 2.cForest area that has been plantedFIA
 2.dAnnual harvest volumes and growth to removal ratios by speciesFIA
Criterion 3: Maintenance of forest ecosystem health and vitality
 3.a Forest area damaged by disease or pests (i.e., insects or invasive species)FIA
 3.bForest area damaged by fire or storm and deforestationFIA
Criterion 4: Conservation and maintenance of soil and water resources
 4.1.aForest area managed for the protection of soil or water resourcesLiterature synthesis
Criterion 5: Maintenance of forest contribution to global carbon cycles
 5.aForest carbon pools and fluxesFIA
Criterion 6: Maintenance and enhancement of socioeconomic benefits
 6.3.aEmployment in the forest sectorBLS
 6.3.bTotal wages from employment in the forest sectorBLS
Criterion 7: Legal, institutional and economic framework
 7.1.aLegislation and policies supporting the sustainable management of forestsLiterature synthesis
 7.3.aClarity and security of land and resource tenure and property rightsLiterature synthesis
* BLS: Bureau of Labor Statistics; FIA: USDA Forest Service, Forest Inventory and Analysis plot-based inventory data; PAD: Protected Areas Database; NatureServe: NatureServe Map of Biodiversity Importance; NLCD: National Land Cover Database.
Table 2. Forest ownership categories used to assess forest sustainability across the conterminous USA. Categories, descriptions, and ownership codes (OWNCDs) are based on US Department of Agriculture, Forest Service, Forest Inventory and Analysis definitions [11].
CategoryDescriptionOWNCDsExamples
Private
 CorporateCorporatations, including private universities41Weyerhaeuser
 FamilyIndividuals and families, including trusts, estates, and family partnerships45Sue and Bob Jones
 Other privateNon-governmental conservation/natural resources organizations; Unincorporated local partnerships, associations, and clubs42, 43The Nature Conservancy
Public
 FederalNational Forests; National Grasslands and/or Prairies; Other Forest Service lands; National Park Service; Bureau of Land Management; Fish and Wildlife Service; Departments of Defense and Energy; Other Federal11, 12, 13, 21, 22, 23, 24, 25Umpqua National Forest
 LocalLocal (County, Municipality, etc.) including water authorities; Other non-Federal public32, 33Burnett County Forestry & Parks Department
 StateState, including State public universities31Massachusetts Department of Conservation and Recreation
TribalNative American44Navajo Nation Division of Natural Resources
Table 3. Summary of selected Montréal Process Criterion 1 Indicators by ownership category, conterminous USA in terms of: (A) absolute values (2019), (B) relative values (2019), and (C) change (2012–2019). Indicators, including data sources, are described in Table 1. Where available, standard errors are listed parenthetically following the estimates.
Private Public Tribal
IndicatorCorporateFamilyOther PrivateFederalLocalState
A. Absolute values
1.1.a. Forest area, 106 ha55.4 (0.3)108.5 (0.4)4.3 (0.1)76.8 (0.3)5.8 (0.1)18.9 (0.2)6.6 (0.1)
1.1.b. Protected forest area, 106 ha3.41.50.769.31.913.30.1
1.1.c. Fragmentation, mean forest area density0.71 (0.01)0.67 (0.00)0.76 (0.02)0.70 (0.01)0.75 (0.01)0.74 (0.01)0.59 (0.02)
1.2.a. Tree diversity, number of species311323237315248297176
1.2.b. Forest area with one or more at-risk species, 106 ha35.770.62.636.24.813.83.5
B. Relative values
1.1.b. Protected forest area, percent6.11.415.390.233.170.41.9
1.2.a. Number of tree species, 106 ha−163554431627
1.2.b. Forest area with one or more at-risk species, percent64.665.161.847.183.872.952.5
C. Change
1.1.a. Forest area, percent change+14.3−6.6−24.3+0.6+9.9+5.0+0.9
1.1.c. Fragmentation, forest area density change−0.08−0.06+0.01−0.04−0.06−0.04+0.03
1.2.a. Tree diversity, change in number of species per 106 ha−0.8+0.1+10.1+0.0−5.8−0.8−1.6
Table 4. Summary of selected Montréal Process Criterion 2 Indicators by ownership category, conterminous USA in terms of: (A) absolute values (2019), (B) relative values (2019), and (C) change (2012–2019). Indicators, including data sources, are described in Table 1. Where available, standard errors are listed parenthetically following the estimates.
Private Public Tribal
IndicatorCorporateFamilyOther PrivateFederalLocalState
A. Absolute values
2.a. Productive forest area, 106 ha47.4 (0.3)88.0 (0.4)3.6 (0.1)54.3 (0.3)5.3 (0.1)15.5 (0.2)2.8 (0.1)
2.b. Growing stock a, 109 m36.3 (0.0)12.7 (0.0)0.6 (0.0)12.1 (0.1)0.8 (0.0)2.7 (0.0)0.6 (0.0)
2.b. Annual growth a, 106 m3217.6 (2.1)330.5 (2.3)8.0 (0.4)67.3 (1.7)12.9 (0.5)38.6 (0.9)3.8 (0.3)
2.c. Planted forest area, 106 ha14.2 (0.2)8.7 (0.1)0.3 (0.0)2.5 (0.1)0.4 (0.0)1.4 (0.1)0.1 (0.0)
2.d. Annual harvest a, 106 m3164.4 (3.1)148.3 (2.3)3.0 (0.3)14.3 (0.7)5.8 (0.4)18.1 (1.1)2.7 (0.4)
B. Relative values
2.a. Productive forest area, percent85.681.183.370.691.282.342.6
2.b. Growing stock, m3 ha−1113.3117.0129.8157.4130.3141.086.6
2.b. Annual growth a, m3 ha−14.33.32.02.02.32.52.1
2.c. Planted forest area, percent25.68.07.73.26.47.21.4
2.d. Harvest a, m3 ha−1 year−13.01.40.70.21.01.00.4
C. Change
2.a. Productive forest area, percentage point change−5.6+0.8+14.9−0.1+1.0+0.2+2.1
2.b. Growing stock (m3 ha−1), percent change+1.7+13.5+30.3−0.8+6.6+4.4+4.4
2.b. Annual growth a (m3 ha−1), percent change+6.8+12.8+101.7−8.3+20.8+13.1−1.4
2.c. Planted forest area, percentage point change−2.4+0.5+1.0−0.1+0.6+0.3+0.2
2.d. Annual harvest a (m3 ha−1), percent change−12.4−0.8+49.2−2.7+24.0+4.8+7.3
a Rocky Mountain region excluded due to data unavailability.
Table 5. Summary of selected Montréal Process Criterion 3 Indicators by ownership category, conterminous USA in terms of: (A) absolute values (2019), (B) relative values (2019), and (C) change (2012–2019). Indicators, including data sources, are described in Table 1. Where available, standard errors are listed parenthetically following the estimates.
Private Public Tribal
IndicatorCorporateFamilyOther PrivateFederalLocalState
A. Absolute values
3.a. Forest area damaged by disease or pests, 106 ha3.5 (0.1)7.8 (0.1)0.4 (0.0)11.3 (0.1)0.4 (0.0)2.2 (0.1)0.7 (0.0)
3.b. Forest area damaged by fire or storms, 106 ha3.3 (0.1)5.4 (0.1)0.2 (0.0)7.3 (0.1)0.2 (0.0)1.2 (0.1)0.4 (0.0)
3.b. Forest area deforested, 106 ha year−10.2 (0.0)0.6 (0.0)0.0 (0.0)0.1 (0.0)0.0 (0.0)0.0 (0.0)0.0 (0.0)
B. Relative values
3.a. Forest area damaged by disease or pests, percent6.27.29.014.87.711.610.5
3.b. Forest area damaged by fire or storms, percent6.05.05.69.64.26.45.7
3.b. Forest area deforested, percent0.30.60.80.10.30.20.1
C. Change
3.a. Forest area damaged by disease or pests, percentage point change+3.5+5.0+6.4+3.9+5.7+7.3−0.2
3.b. Forest area damaged by fire or storms, percentage point change+0.6+0.1+0.2+1.9−0.5+1.1+0.3
3.b. Forest area deforested, percentage point change+0.0+0.1+0.6+0.0+0.1+0.1+0.0
Table 6. Summary of selected Montréal Process Criterion 5 Indicators by ownership category, conterminous USA in terms of: (A) absolute values (2019), (B) relative values (2019), and (C) change (2012–2019). Indicators, including data sources, are described in Table 1. Where available, standard errors are listed parenthetically following the estimates.
Private Public Tribal
IndicatorCorporateFamilyOther PrivateFederalLocalState
A. Absolute values
5.a. Above ground forest carbon, 109 t2.6 (0.0)5.5 (0.0)0.2 (0.0)4.0 (0.0)0.3 (0.0)1.1 (0.0)0.2 (0.0)
B. Relative values
5.a. Above ground forest carbon, t ha−146.850.95552.554.356.430.1
C. Change
5.a. Above ground forest carbon (t ha−1), percent change+1.2+11.4+26.0−0.2+6.9+4.3+4.0
Table 7. Summary of selected Montréal Process Criterion 6 Indicators by ownership category, conterminous USA in terms of: (A) absolute values (2019) and (B) relative values (2019). Indicators, including data sources, are described in Table 1.
Private Public Tribal
IndicatorCorporateFamilyOther PrivateFederalLocalState
A. Absolute values
6.3.a Forestry sector employment, 103 jobs71.158.11.210.22.28.42.0
6.3.b Wages from forestry sector employment, 106 USD yr−13616.02766.753.9532.199.4427.8108.0
B. Relative values
AttributeCorporateFamilyOther PrivateFederalLocalState
6.3.a Forestry sector employment, jobs 106 ha−11283.8535.4273.7132.9380.7444.6308.7
6.3.b Wages from forestry sector employment, 106 USD 106 ha−165.325.512.56.917.122.616.4
Publisher’s Note: MDPI stays neutral with regard to jurisdictional claims in published maps and institutional affiliations.

