Article

Influence of the Declaration of Protected Natural Areas on the Evolution of Forest Fires in Collective Lands in Galicia (Spain)

by
Gervasio López Rodríguez
,
Verónica Rodríguez Vicente
and
Manuel Francisco Marey Pérez
*
Research Group PROePLA GI-1716, Department of Plant Production and Engineering Projects, Higher Polytechnic School of Engineering, University of Santiago de Compostela, Campus Terra, 27002 Lugo, Spain
*
Author to whom correspondence should be addressed.
Submission received: 19 May 2022 / Revised: 15 July 2022 / Accepted: 19 July 2022 / Published: 22 July 2022
(This article belongs to the Special Issue The Dynamic Interaction between People and Forest Ecosystems)

Abstract

:
Since the adoption of European Union Council Directive 92/43 on the conservation of natural habitats and wild fauna and flora, some opposition has arisen among owners and managers of land affected by the directive. Some studies have indicated that some of this opposition has found expression in subsequent arson fires in these areas. This article analyses the occurrence of arson fires in the SACs (Special Areas of Conservation) included in the European ecological network, Natura 2000, in Galicia (Spain), more specifically in the montes vecinales en mano común (MVMCs), which are privately owned collective lands. We tested whether the declaration of SACs had a statistical impact on the forest fire regime in the period 1999–2014. The analyses focused on the sub-periods of 1999–2004 and 2005–2014, i.e., before and after the approval of the list of sites of community importance in the study area in December 2004. The results obtained show that, after the declaration of protection, there was a statistically significant increase in the area burnt by fire in these areas, mainly on private estates. We also found that the percentage of arson fires after 2004 was higher in SACs than in other territorial units. We found that the percentage of arson fires was reduced less in SACs than in other territorial units. Furthermore, we found that the area burnt per fire after 2004 in SACs was almost double that in the MVMC-SACs (12.04 ha versus 6.64 ha), so it can be concluded that the conservationist policies of the Natura 2000 network in Galicia have not had a positive effect on the forest fire regime.

1. Introduction

In 1992 the European Union (EU) adopted Council Directive 92/43 of 21 May 1992 [1] on the conservation of natural habitats and wild fauna and flora. This created the Natura 2000 network, a European ecological network made up of Special Areas of Conservation (SACs), in which the aim is to ensure the maintenance and/or restoration of natural habitats. Today, the Natura 2000 network occupies around 18% of the European Union’s surface area [2,3].
The scientific literature on the subject indicates multiple benefits of the Natura 2000 network in social, economic and environmental aspects, for example [4,5,6,7]. Nevertheless, several studies have claimed that its declaration and subsequent management have not been able to prevent the loss of natural habitats [8,9,10]. It has also been mentioned that the selection of areas to be protected was not based on scientific criteria [11], which makes it difficult to achieve the desired objectives [12,13,14,15].
The designation of areas to be protected has also been met, in many cases, with opposition from landowners [16,17,18,19,20,21], who have protested in defence of traditional management methods and their property rights [22]. As examples, some authors have mentioned the hunger strike of forest owners in Karvia (Finland) in response to the introduction of the Natura 2000 network [23], while other authors argued that the designation of these areas could also alter the economic conditions of land users and land prices, and that acceptance by interests (i.e., landowners and farmers) is a key aspect for conservation effectiveness [24].
With regard to this social opposition, it is necessary to remember that forest fires in Europe are the main cause of destruction of forest area [25,26]. They are also one of the greatest threats to this type of protected area. In 2007, in Greece, forest fires affected 12.4% of the Peloponnese Natura 2000 network [27,28]. It is therefore necessary to consider the existence of a certain relationship between forest fires and social conflicts [29,30,31], as the Natura network affects the population of these areas in many ways and can lead to various conflicts. Several authors, for example, have linked ineffective forestry policies to the occurrence of forest fires [32,33,34]. In addition, protectionist measures may lead to land abandonment due to depreciation, which causes landowner rejection and can lead to an increase in the number of fires [35,36,37,38]. Regos et al., in a study published in 2013 [39], linked the occurrence of forest fires to the increase in forest area in Catalonia (Spain), and Farina, in 1998, [40] reported that the loss of land value favoured its abandonment and increased the risk of fires. The presence of shrub and grassland is also associated with an increase in number of fires [41,42,43]. In any case, a better understanding of the causes of the conflict will provide sufficient and realistic knowledge to support the choice of future policies in relation to natural protection [44].
Considering that 95% of forest fires in Europe are arson [45,46,47] or are related to human activity [48], it is essential to scientifically analyse the causality and incidence of forest fires in areas considered legally protected entities, as forest fires affect ecosystem resources and services (tourism, protection, biomass production, biodiversity conservation) [49], hinder the development of policies on the improvement of forest spaces [50] and cause natural disasters such as erosive phenomena, desertification and loss of biodiversity [51].
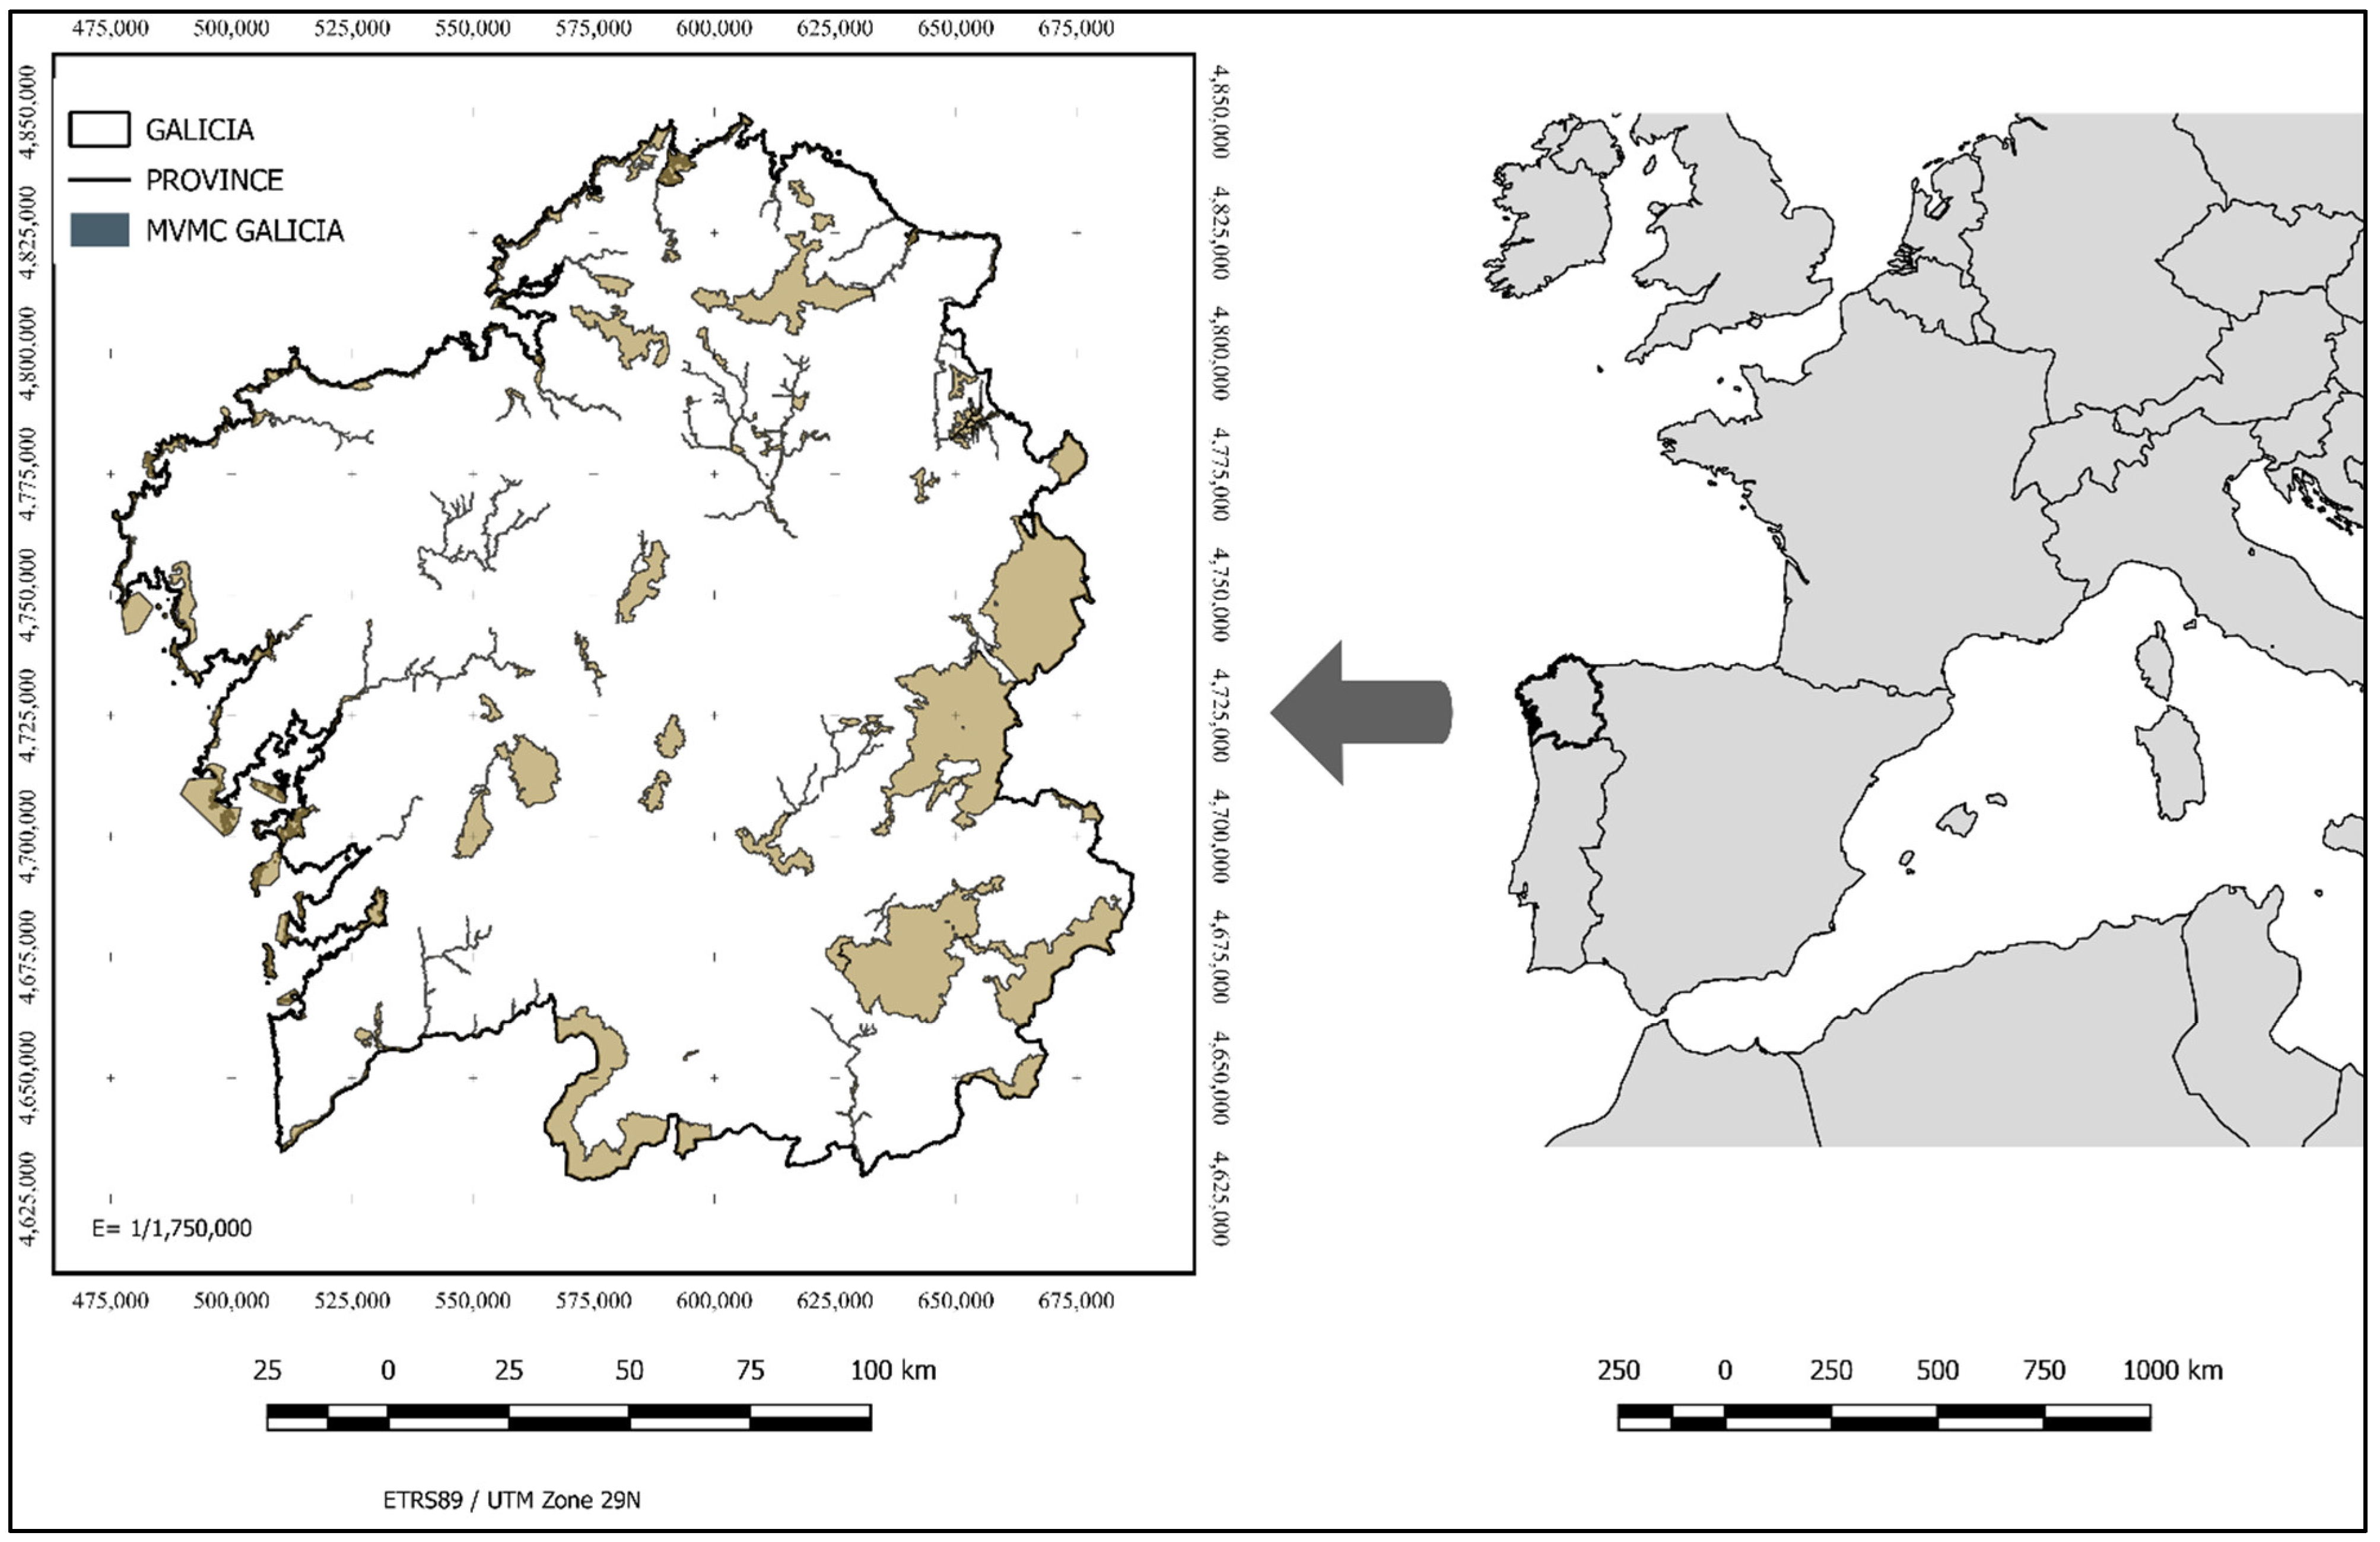
Considering a specific region of northwestern Spain, the autonomous community of Galicia, this study proposes a statistical analysis to verify the effect that the legal declaration of protected zones to preserve their natural value may have had on the occurrence and evolution of arson activity and, more specifically, to determine whether the inclusion of a specific form of collective private property, the monte vecinal en mano común (MVMC), in the Natura 2000 network has meant a change in this arson activity.
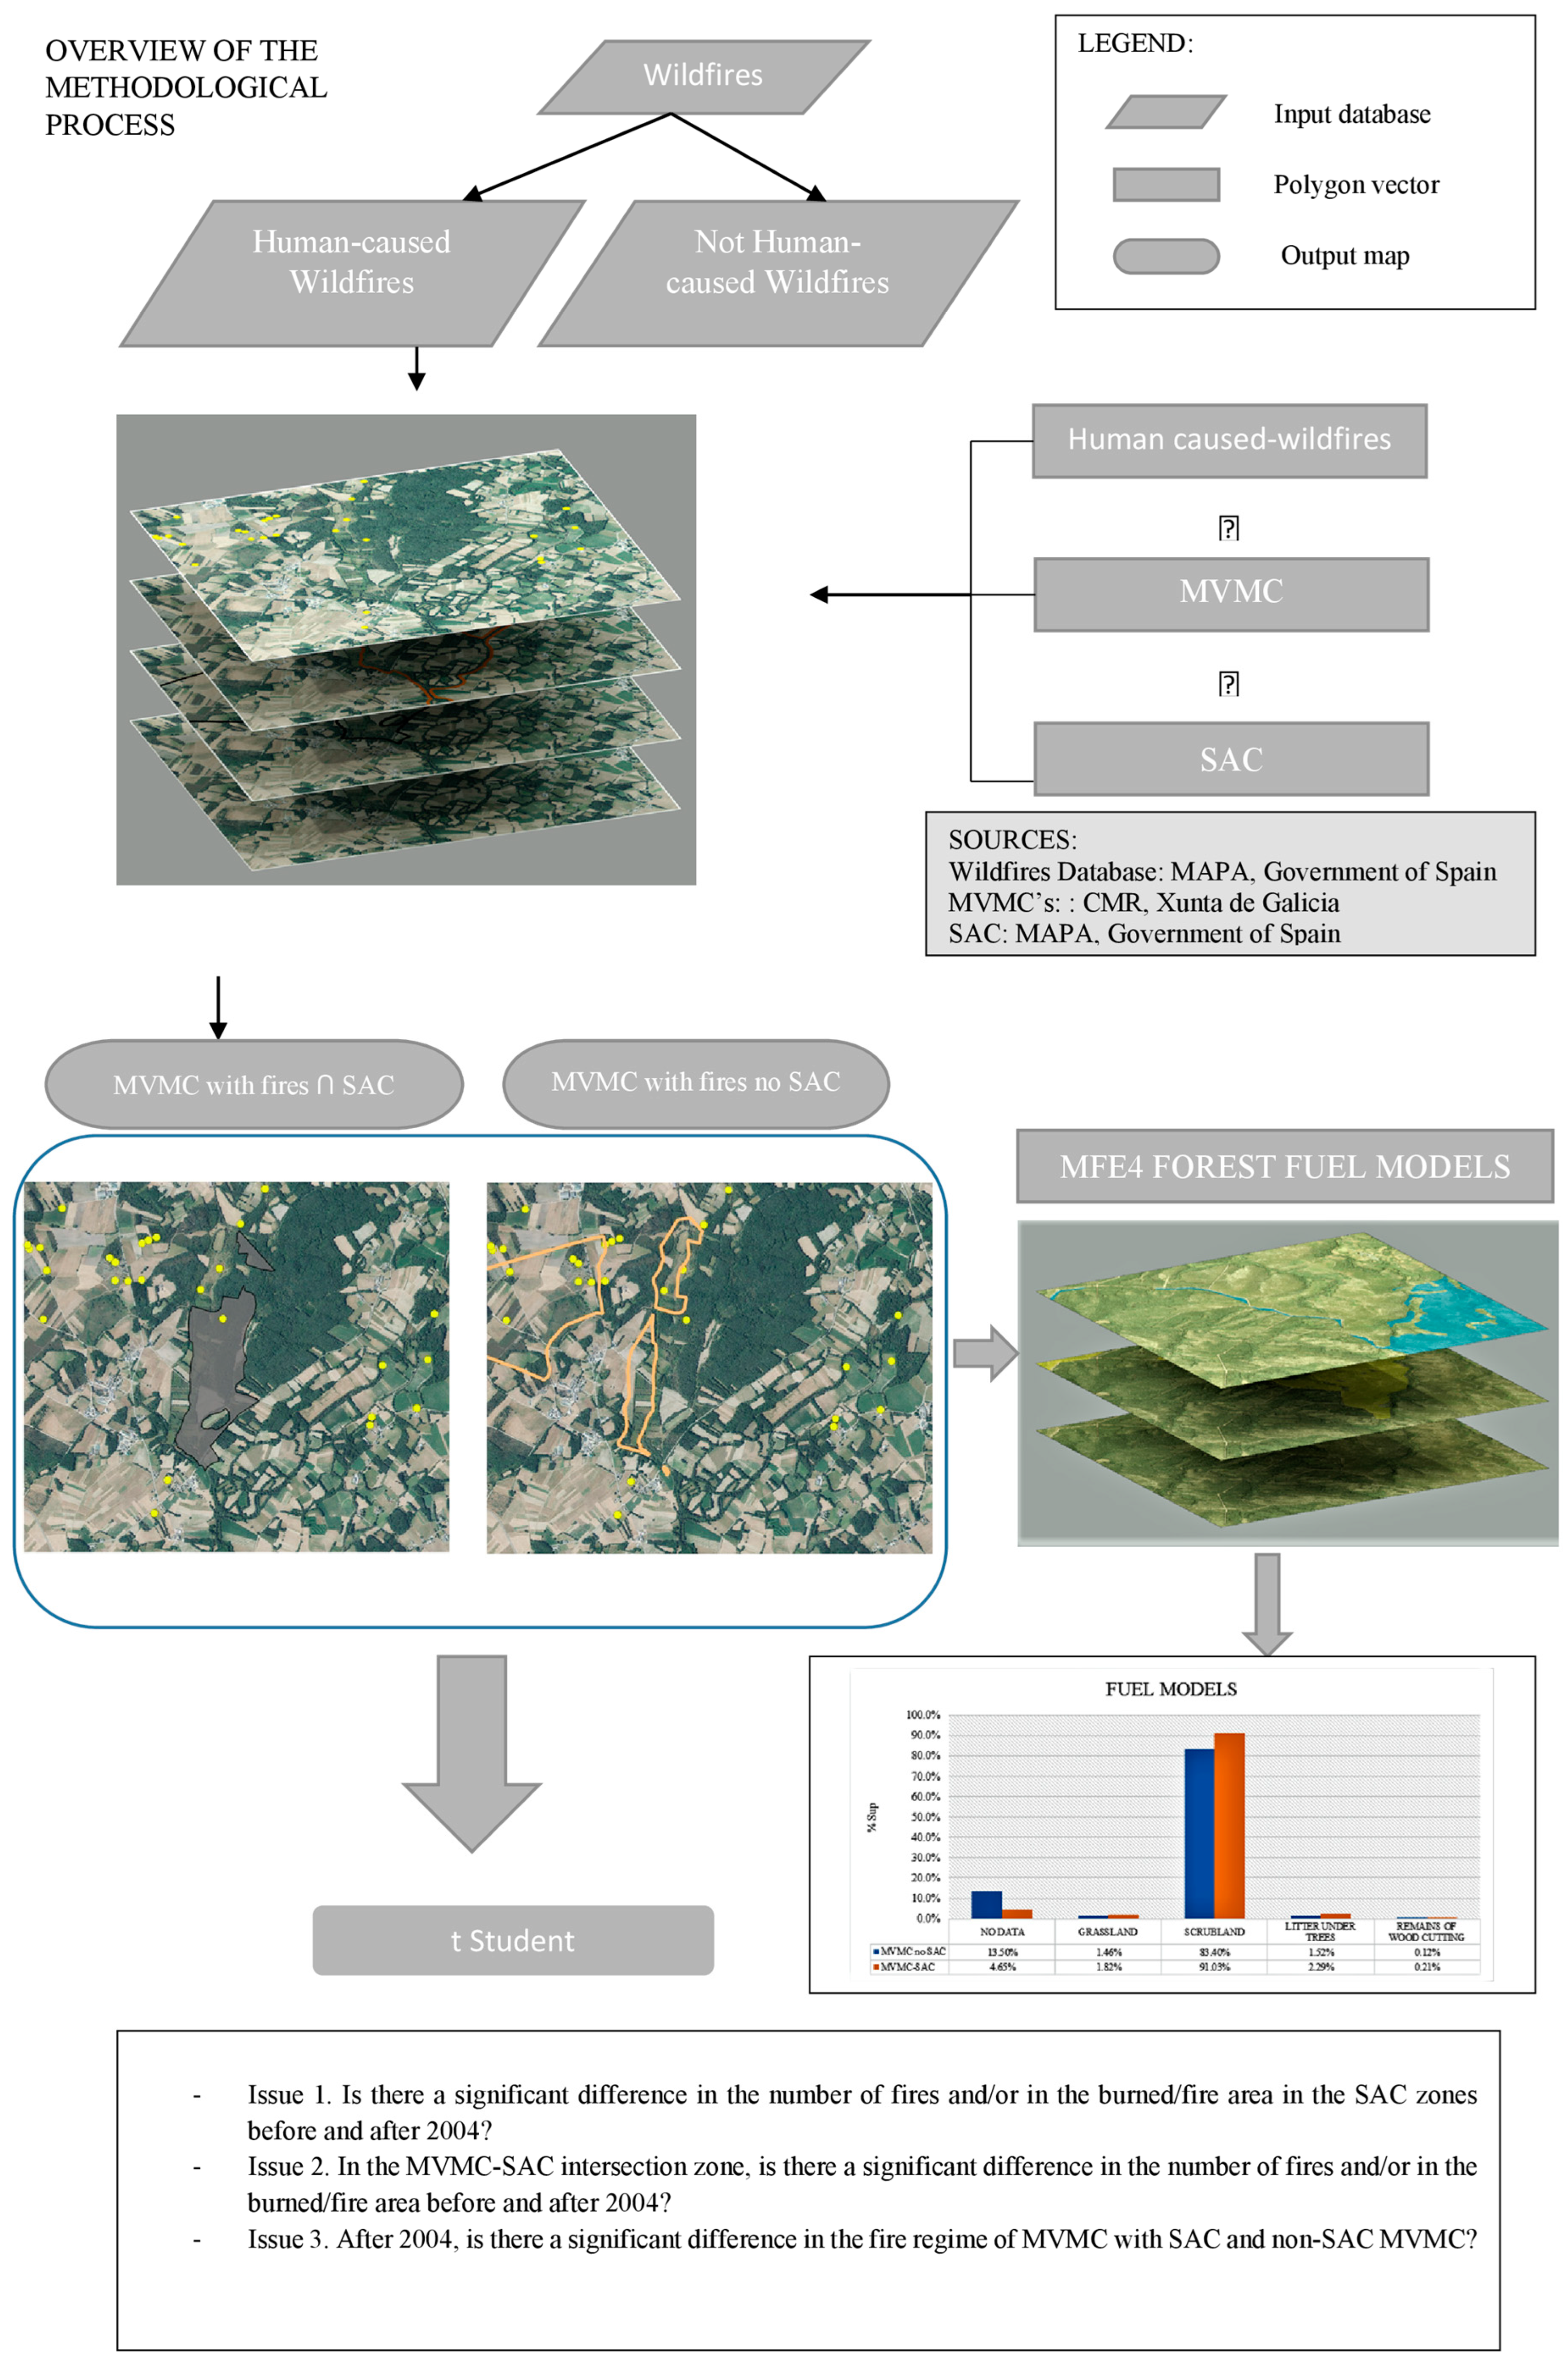
We analysed whether the implementation of the Natura network regulations led to any change in the fire regime in the areas of collective private property in Galicia. Therefore, the analysis, which covers the period 1999–2014, focuses on analysing the differences between the sub-periods 1999–2004 and 2005–2014, as it was in December 2004 when the list of sites of community importance in the Atlantic biogeographical region, the region in which the study area is located, was approved. The aim of the article, finally, is to answer the following questions:
  • Is there a significant difference in the number of fires and/or the area burnt/fire before and after 2004 in the SACs?
  • In the MVMC-SAC intersection zone, is there a significant difference in the number of fires and/or in the area burnt/fire before and after 2004?
  • After 2004, was there a significant difference in the fire regimes of MVMCs with SAC and MVMCs without SAC?

2. Methodology

2.1. Study Area

The autonomous community of Galicia (Figure 1), located in the northwest region of Spain, is an eminent agroforestry region, with a high actual and potential productivity [52,53,54]. In particular, this region stands out for its emerging forestry sector; around 61% of its territory is forested land (1.8 M ha), of which more than 1.4 M ha is wooded forest producing 9.7 million m3 of wood per year, a volume that represents 50% of the annual felling in Spain [55]. The most relevant species in the region are Pinus pinaster Ait., Quercus robur L. and Eucalyptus globulus Labill [55]. Climatologically, Galicia presents great differences between its coastal and inland areas, with mean annual rainfall varying between 800 and 1000 mm in inland areas and 1600 and 1900 in coastal areas. The average annual temperature is 13 °C, with maximum temperatures exceeding 30 °C in the SE of the region, and winters with average minimum temperatures of 5 °C in the interior [56].
Galicia is the Spanish autonomous community with the smallest area of forest under some form of legal protection. Only 12% of Galician territory is under these conditions (Figure 2), while the national average is 24% [57]. However, it is the area most affected by forest fires and has the highest rate of arson fires [58,59]. It is also characterized by a high density of ignitions and long seasonality, where the area burnt per fire is usually small [60]. Thus, according to official statistics on forest fires [61], more than 110,000 fires occurred in this region in the period 2000–2019, affecting a total area of more than 0.5 M ha, of which 37.35% were wooded. For the study period (1999–2014), the total area burned was 424,955 ha, of which 146,996 ha (34.6%) were wooded.
With regard to the structure of forest property rights, approximately 99.5% of Galician rural areas are privately owned and, particularly, almost 38% are monte vecinal en mano común (MVMC) [55], collective private property where the ownership is assigned to a group of neighbours (comuneros) in its capacity as a rural community and not as an administrative entity [62,63]. Therefore, the neighbours in the community are simultaneously owners and managers of economically productive territorial units, the MVMCs, in their capacity as residents of those places where these communal areas are traditionally located [31,64,65].
According to official statistics, Galicia currently has 3326 MVMCs, with a total surface area of 663,488.96 ha and an average area of 219.48 ha per MVMC [55], distributed throughout almost the entire Galician region. In the assembly of comuneros, the governing body of these collective communities, each communard represents a local inhabited house, that is, an independent family unit, so there are as many communards as there are families living in the village. In 2019, Galicia had 118,564 community owners [55]. However, in spite of the importance of MVMCs for the Galician forestry sector, only 30% of MVMCs have a management project, and the percentage of area under certified management is no more than 7.5% [63]. These factors, among others, hinder the management of MVMCs and can lead to the emergence of various conflicts between community members. In the absence of a management document that objectively regulates management and attempts to maximise the benefits obtained from the MVMC, it is easy for conflicts to arise between community members.

2.2. Material and Methods

This study was based on the use of official georeferenced cartography in GIS (geographic information system) format. By intersecting the GIS layers of the MVMCs and SACs with the forest fire layer, we obtained the historical series of forest fires for four different territorial units: MVMC, SAC, intersection areas between MVMCs and SACs (MVMC-SAC) and areas of MVMCs that do not intersect with SACs (MVMC no SAC). This procedure allowed us to evaluate possible differences between them, and to assess whether there was any change in the fire regime after the official publication of the regional decree of SACs in Galicia (2004). Using a single statistic for the amount of fire is problematic. In some cases, firefighting extinguishes a fire before it burns all of the area that the arsonist apparently intended to affect, and the arsonist returns to set new fires. In other cases where the fire meets the arsonist’s goals, there is only one arson attempt. Therefore, we used two complementary measures—fire rates (N° of fires/100 ha) and area burned by fire (ha). [66].
For the planned procedure we used, as mentioned above, cartographies for the MVMCs, SACs and historical series of forest fires. The cartography of the MVMCs [55] was formed using 3034 records for which 20 different fields were collected. For its part, the mapping of SAC zones, obtained from MITERD [57], consisted of 59 SAC zones with a total surface area of 375,130 ha.
Regarding human-caused fires, on which we base this paper, the official source is the state database of the Ministry of Agriculture, Fisheries and Food [66] (MAPA). In this case, the period used was between 1999 and 2014, as this is a temporary range that covers the years immediately before and after the adoption of conservation policies. As previously indicated, this study is limited to arson fires and those caused by various acts of negligence, resulting in a database with 96,468 forest fires in Galicia (91.4% of the regional total, according to the database used). For this division, forest fires in which the cause was coded as “unknown”, “negligence” or “intentional” were taken as data. In this respect, it should be noted that the coding “unknown” usually means that no investigation of cause was carried out, but in the authors’ professional experience, such fires are usually due to anthropogenic reasons. It is also worth remembering that in Galicia, wildfire activity has a bimodal distribution every year: a period between weeks 8 to 18 at the end of winter and beginning of spring, and a period of activity higher than the previous one, between weeks 25 to 44 during the summer [61]. We chose to use annual data; we felt a greater disaggregation of the data would not contribute anything.
It was important to check whether the existing fuel models in MVMC-SAC and MVMC no SAC were similar, as this factor could determine the behaviour of wildfires and, consequently, the area burnt [67]. For this purpose, we intersected the GIS layers of these territorial units (MVMC-SAC and MVMC no SAC) with the fuel models of the MFE4 [68], the base mapping of the fourth national forest inventory corresponding to the year 2009. The MFE is the cartography of the forest mass situation, carried out by the Nature Data Bank (Ministry for Ecological Transition-MITECO) and following a conceptual model of the hierarchical land uses developed by the forest classes, especially in wooded areas. The MFE uses a working methodology based on photo-interpretation with field verification and provides detailed vector information for the whole Spanish territory on the structural type or main use of each tessera, the degree of cover and the main tree species mapped, among others. The MFE also includes 15 different fuel models that are subsequently grouped into 5 classes (no data, grassland, scrubland, litter under trees and pruning and forestry residues), as shown in Table A1 of Appendix A.
Table 1 summarises the three main sources of work for this analysis.
It should also be clarified that climate data were not taken into account in the statistical analyses because, although data prior to 2004 and data subsequent to this year were compared, the comparisons were made between territorial units within the same period of time such that the climate regimes affecting them were the same; consequently, climate was not an aspect we considered. Furthermore, as can be seen in Figure 3, both temperature and precipitation remained fairly stable during the study period. This was confirmed by the second sectoral report on climate and extreme events, published in 2015 by Meteogalicia [69], which states that in the period 1961–2013 a stable and continuous increase in mean annual temperature of 0.18 °C per decade was observed in Galicia, so there was no substantial change in the period under study in this paper. Precipitation values also remained very stable, according to statistics provided by Meteogalicia [69]. It should also be remembered that 91.4% of fires in Galicia are caused by man, so the weather is not a determining factor in their occurrence.
Figure 4 explains the methodological process we followed to analyse the occurrence of fires in SAC and MVMC areas. Both GIS layers were intersected with the forest fire layer, which allowed for the obtention of the number of forest fires for four territorial categories: MVMC, SAC, MVMC-SAC (intersection zones) and MVMC no SAC. This allowed us to evaluate the possible differences between them before and after the official publication of the regional decree on SACs in Galicia (2004) and to analyse whether the fire regime observed in each territorial unit differed from the regime observed for Galicia as a whole. Particular attention was also paid to determining whether the occurrence of fires in MVMCs varied after being included, in whole or in part, in the Natura 2000 network (Figure 5 and Figure 6).
Figure 7 and Figure 8 show the analysis that was carried out to check the differences in the fuel models of the MVMC-SAC and MVMC no SAC. As can be seen in Figure 8, the most frequent fuel model in both territorial units was scrubland, with very similar percentages in both cases. The great similarity between the two territorial units allowed us to disregard this factor, as it did not lead to a different occurrence of forest fires.
The statistical comparison of the obtained results was performed by means of an analysis of Student’s t means, [70] in order to check if the observed differences were statistically significant. This analysis was carried out, as previously indicated, for the number of fires per 100 ha and for the area burned by fire (ha). As mentioned above, these two parameters were chosen because in areas with many human-caused fires, some of them are usually the result of a successful action of the means of extinction; that is, if part of the area that was intended to be burned is saved, the arsonist will be impelled to cause a new fire, resulting in an increase in the occurrence of fires [71]. For these calculations, a bilateral test was carried out, as the sign of the potential difference was not known (the declaration of protection may have meant both an increase in the occurrence of fires and a decrease). The level of significance used was 5%.
Specifically, this study aims to answer three major questions related to the causality and dynamics of forest fires in Galicia and argue for the possible statistical results we obtained:
Issue 1. Is there a significant difference in the number of arson fires and/or in the burned/fire area in the SACs before and after 2004?
Issue 2. In the MVMC-SAC intersection zone, is there a significant difference in the number of arson fires and/or in the burned/fire area before and after 2004?
Issue 3. After 2004, was there a significant difference in the fire regimes of MVMC-SAC and MVMC no SAC?

3. Results

The analysis carried out allowed us to find certain differences in the fire regime of the SACs and the MVMCs. The differences found in the SACs are particularly relevant, as they also affected the area burnt by fire (AB/fire), which increased notably in this territorial unit.
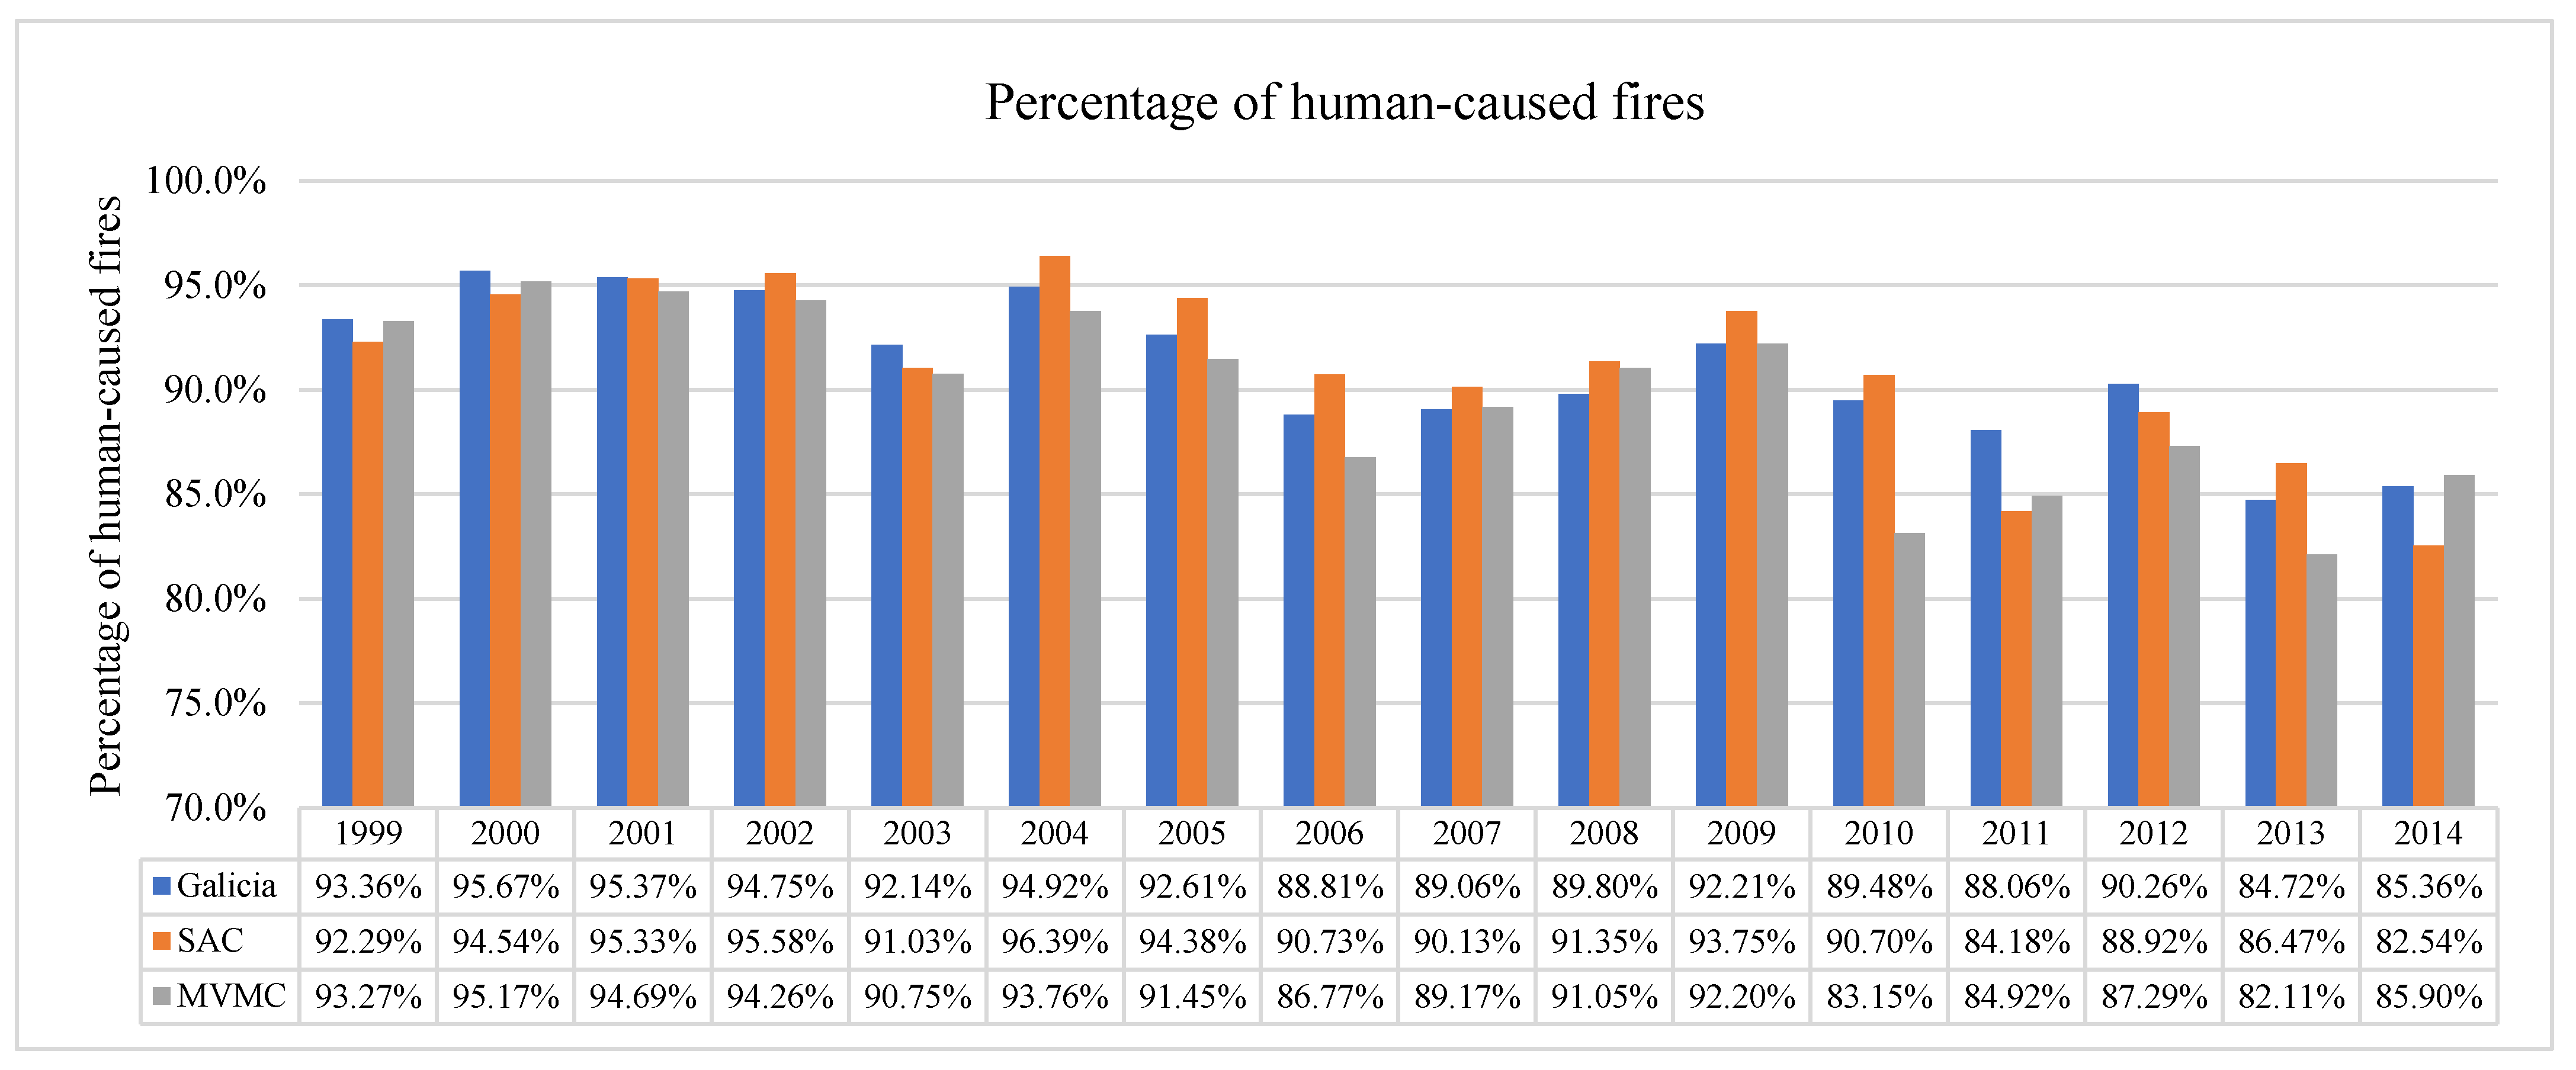
Figure 9 shows the percentages of human-caused forest fires produced in Galicia during the period 1999–2014 for each territorial unit. Although the percentages of human-caused forest fires for each study area were practically identical, it is worth mentioning that these were higher for the MVMC, where up to 91.97% of the fires that occurred between 1999 and 2014 were caused by man or as a result of various acts of negligence. Of the total number of human-caused forest fires in Galicia between 1999 and 2014, 9.95% occurred in SACs.
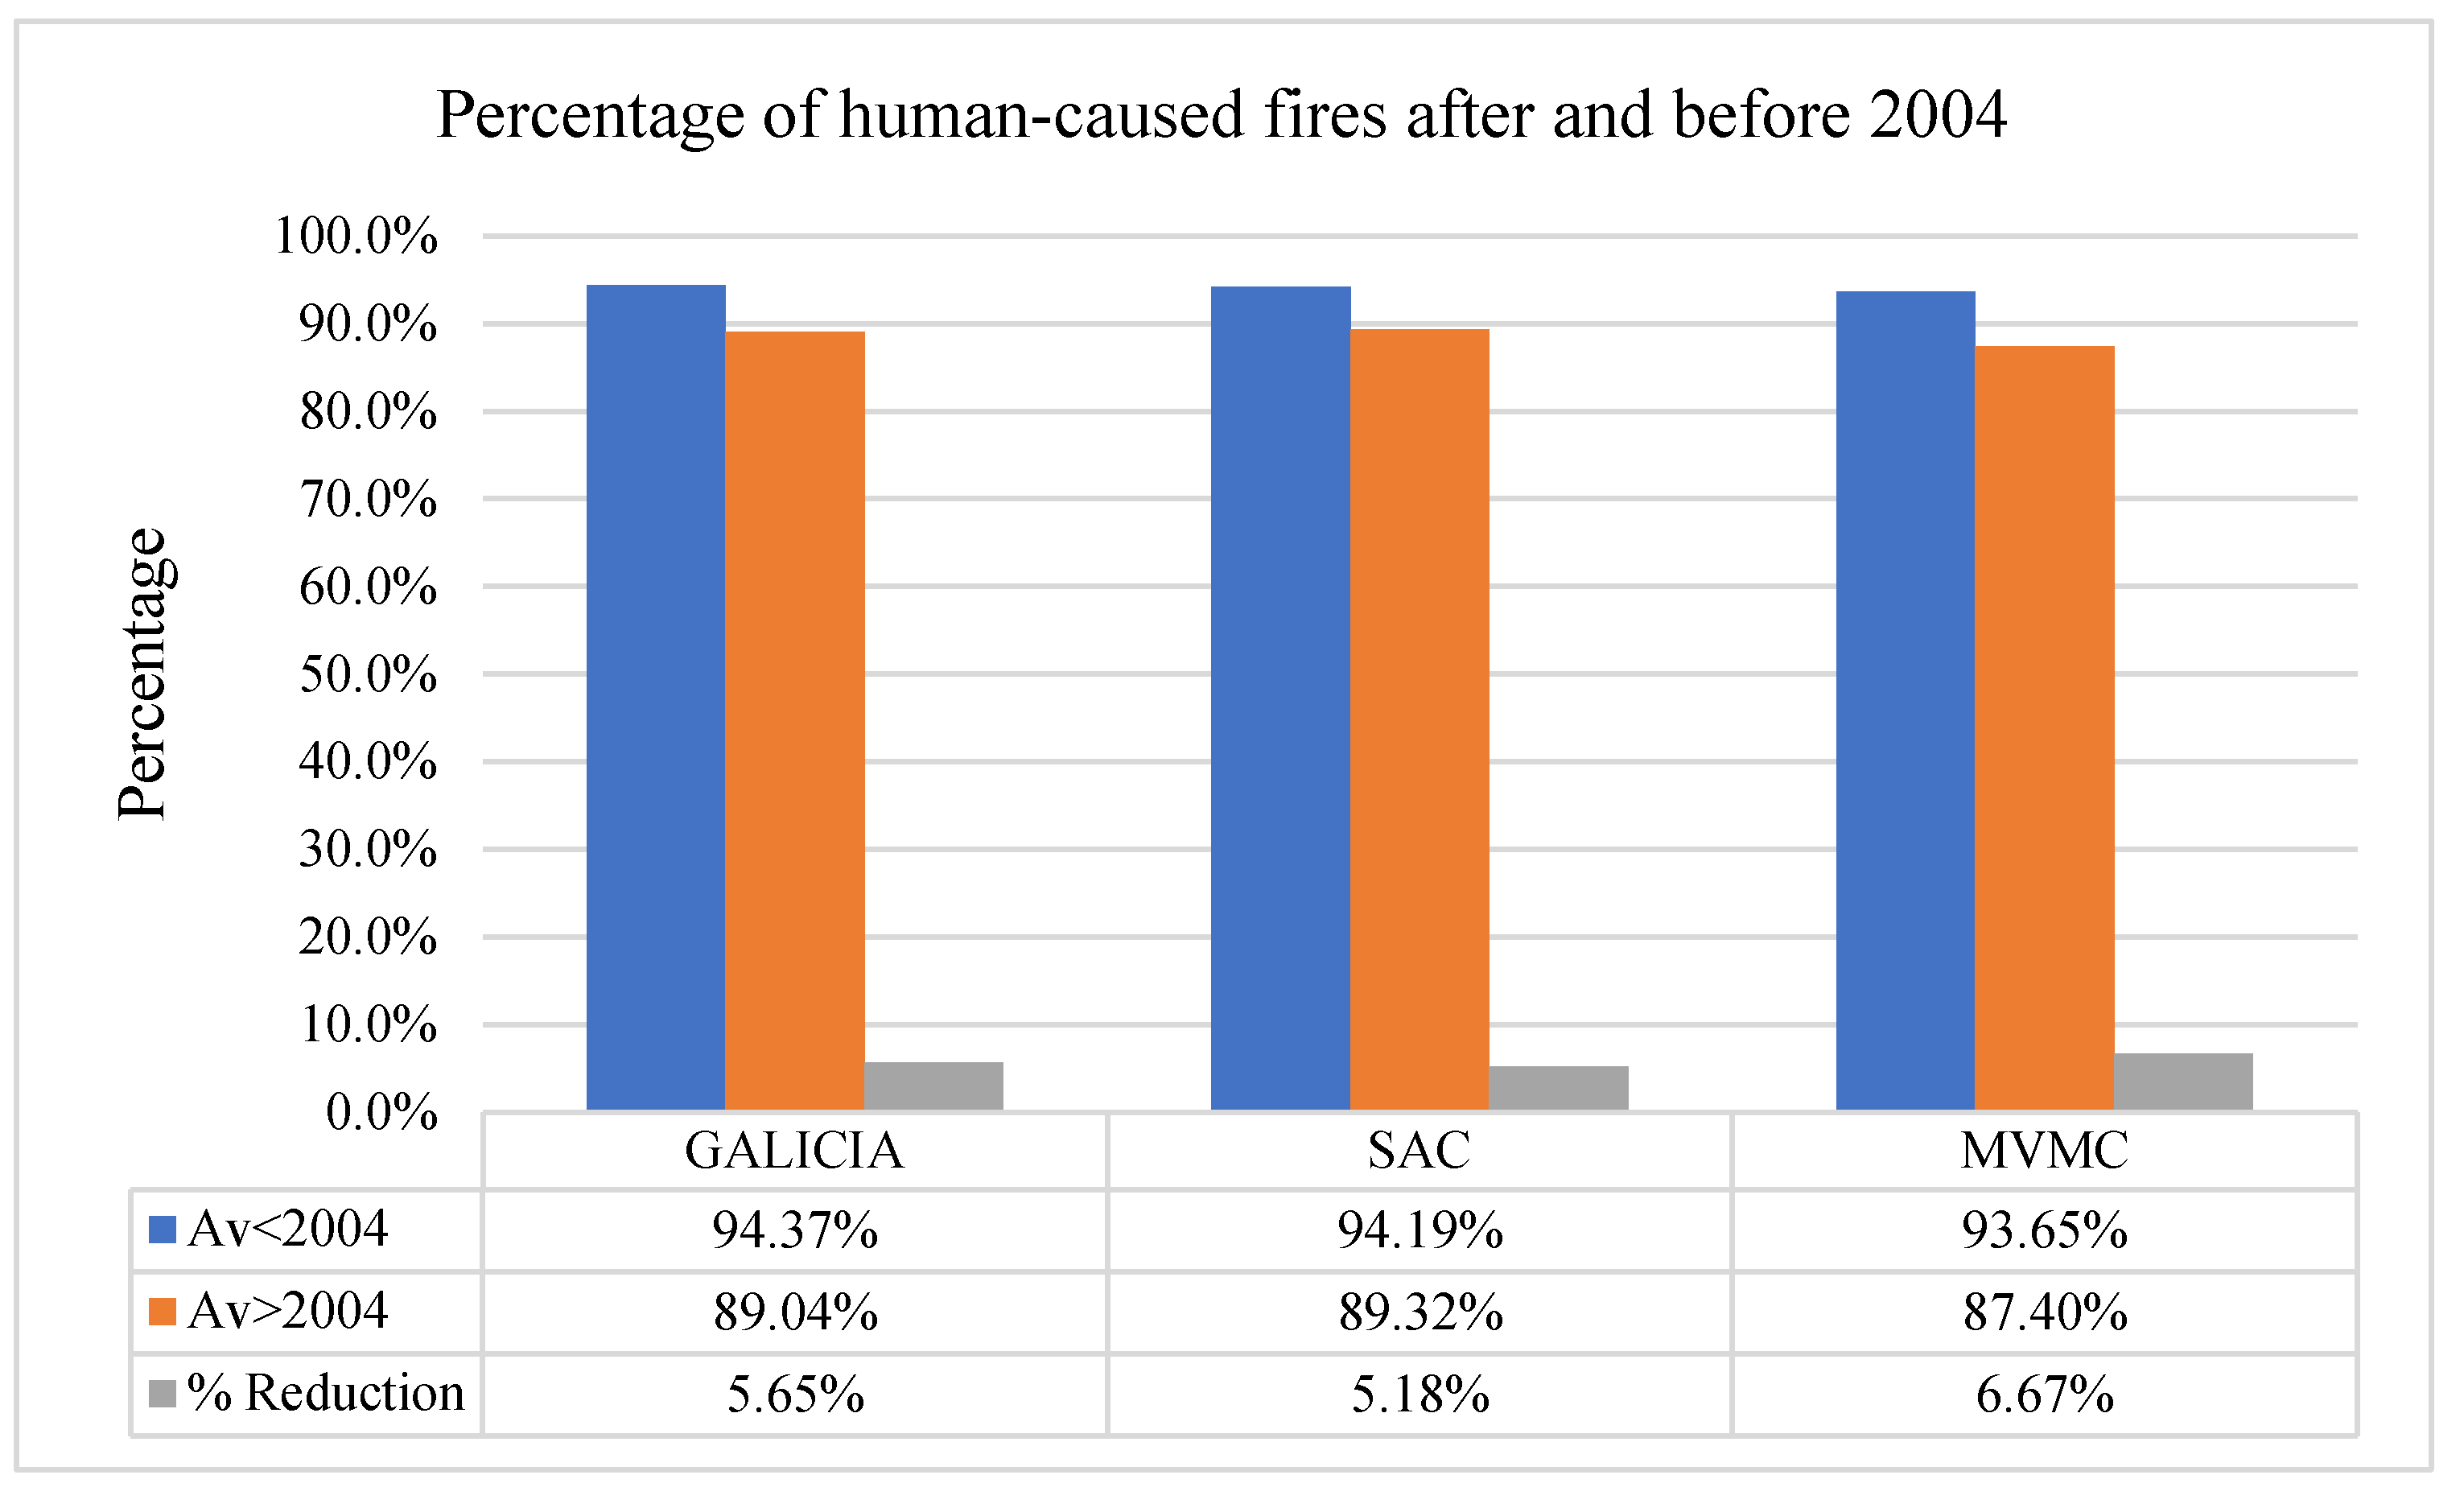
In SACs, the percentage of human-caused forest fires was 91.14% (Figure 10). A significant reduction in intentionality (percentage of human-caused forest fires) was also observed after 2005, between 5 and 6 percentage points. However, although the percentages of reduction were very similar, the smallest reduction was found precisely in the SACs where, in addition, the overall reduction in the number of fires was greater than that observed among the intentional fires. Despite the general downward trend, we observed that there was greater intentionality in the SACs.
Regarding the rate of human-caused forest fires before and after 2004 in each territorial unit analysed, 
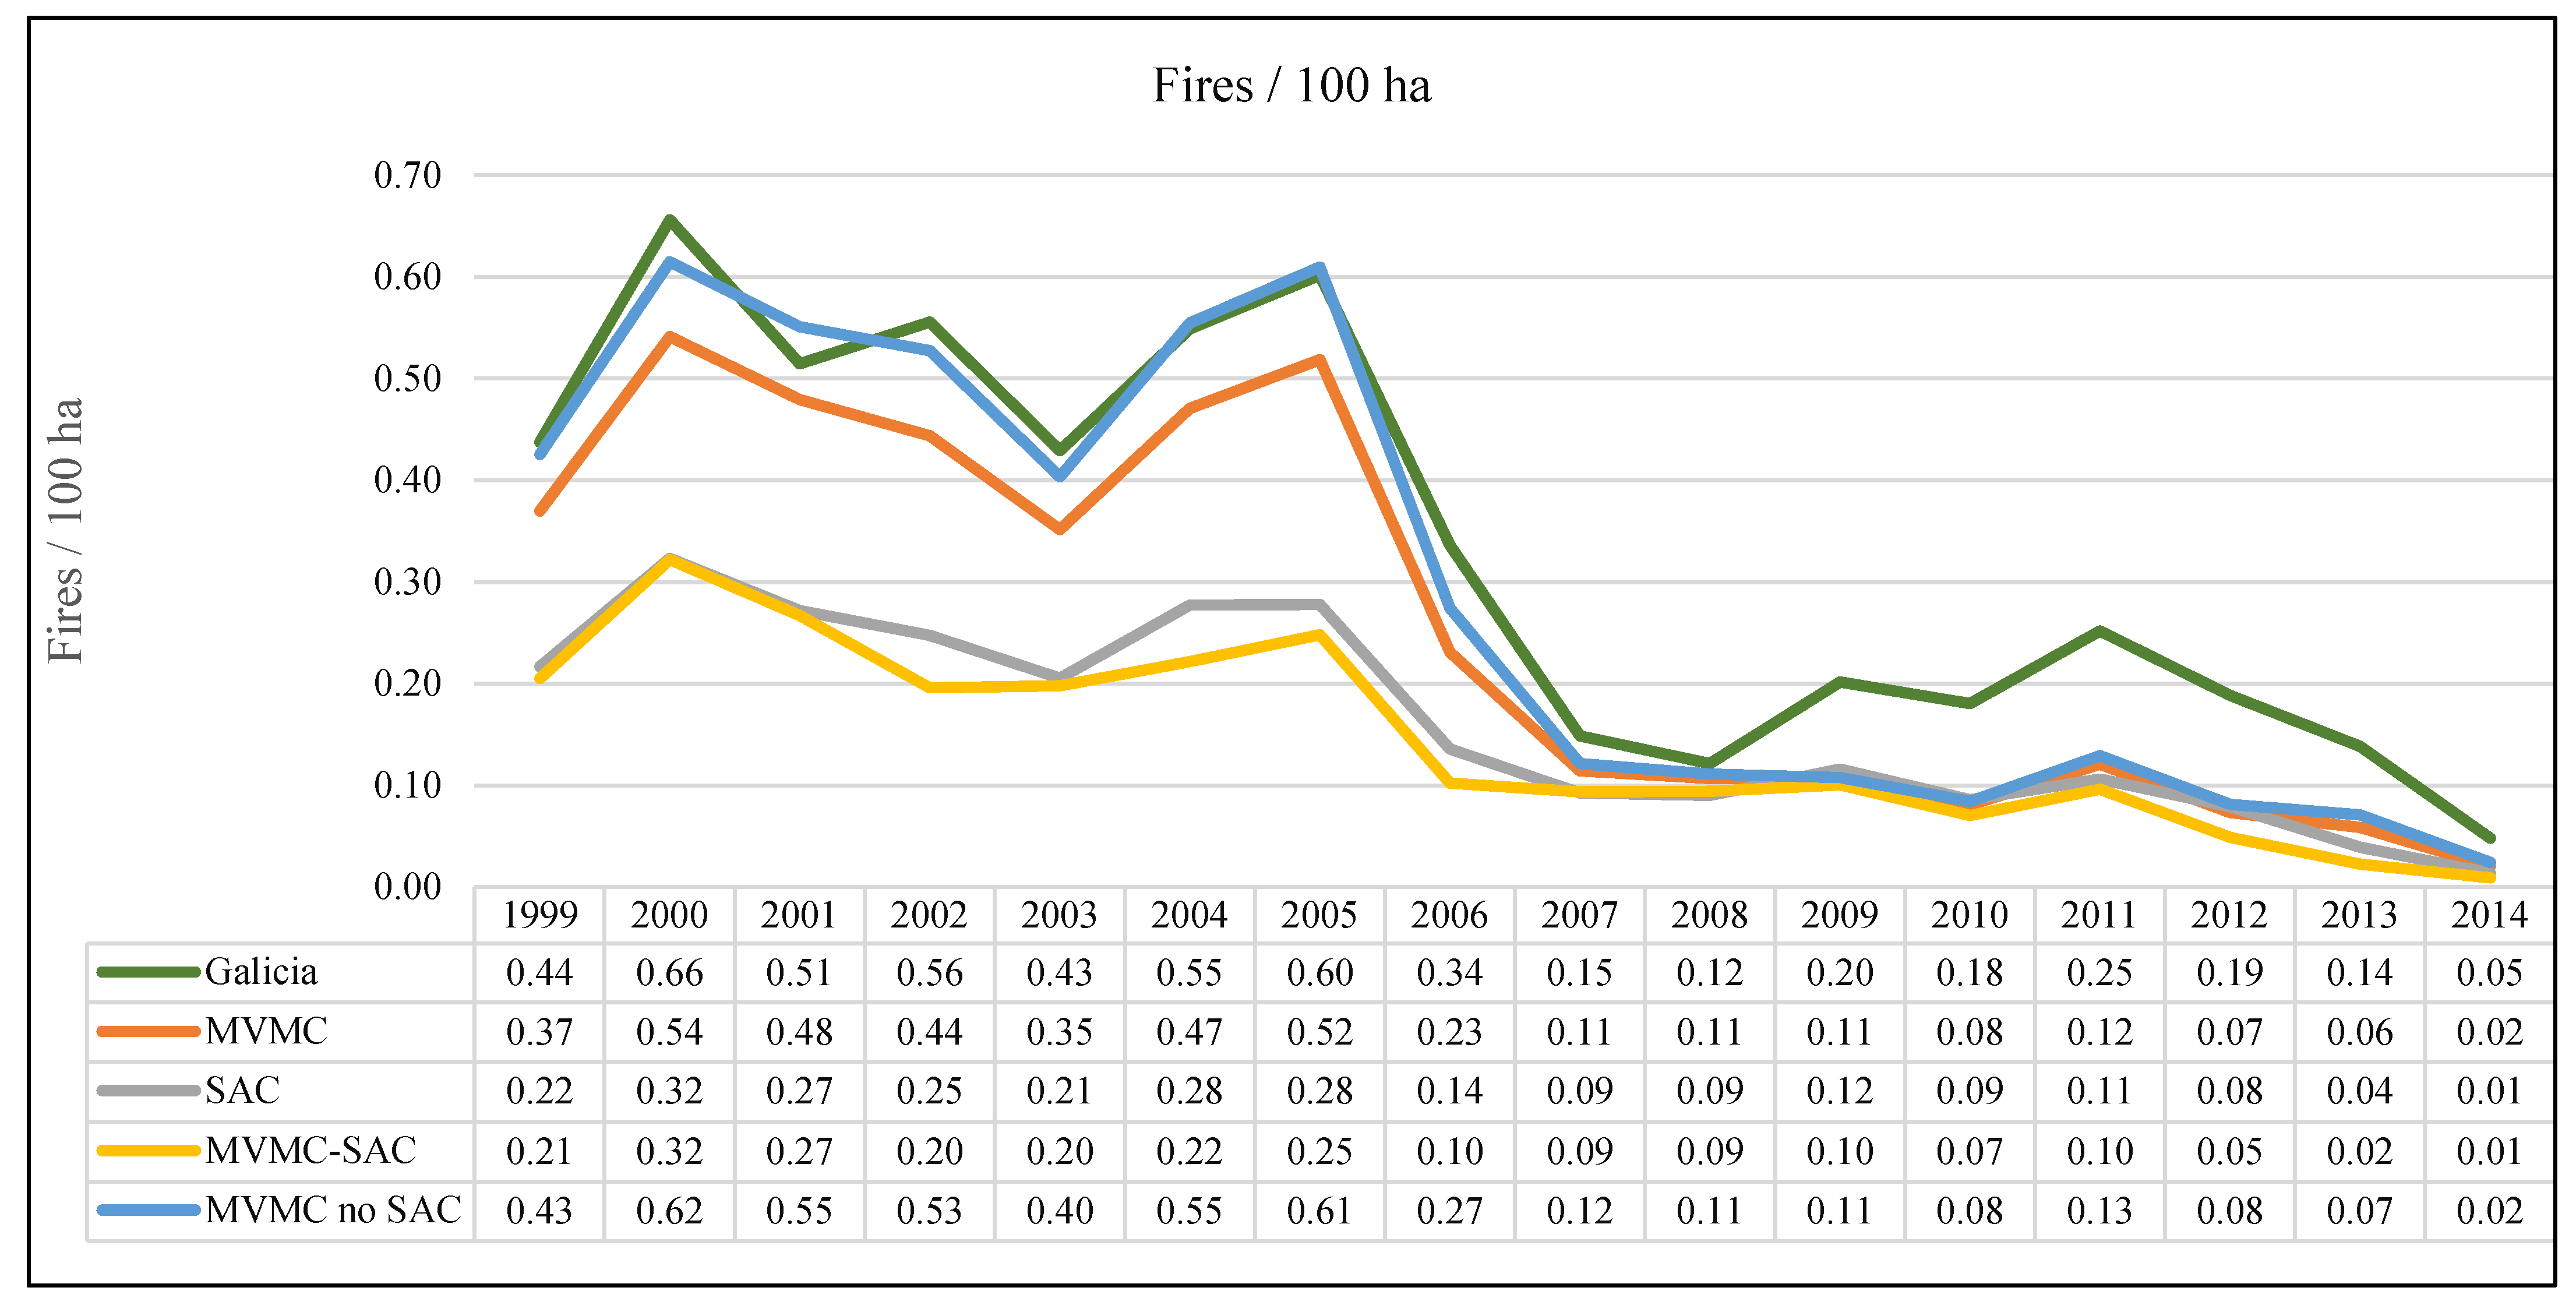
Table 2 shows that the highest rate of wildfires before 2004 was reached by the whole of Galicia (0.52 fires/100 ha), followed by MVMC no SAC (0.51 fires/100 ha). After 2004, the reduction in the intentionality rate was generalized, although higher in MVMC and MVMC no SAC.
After 2004, the rate of forest fires for the different territorial groups analysed tended to converge, with very close values between all of them, such that the SACs did not seem to benefit from the same decrease as the other study groups (Figure 11).
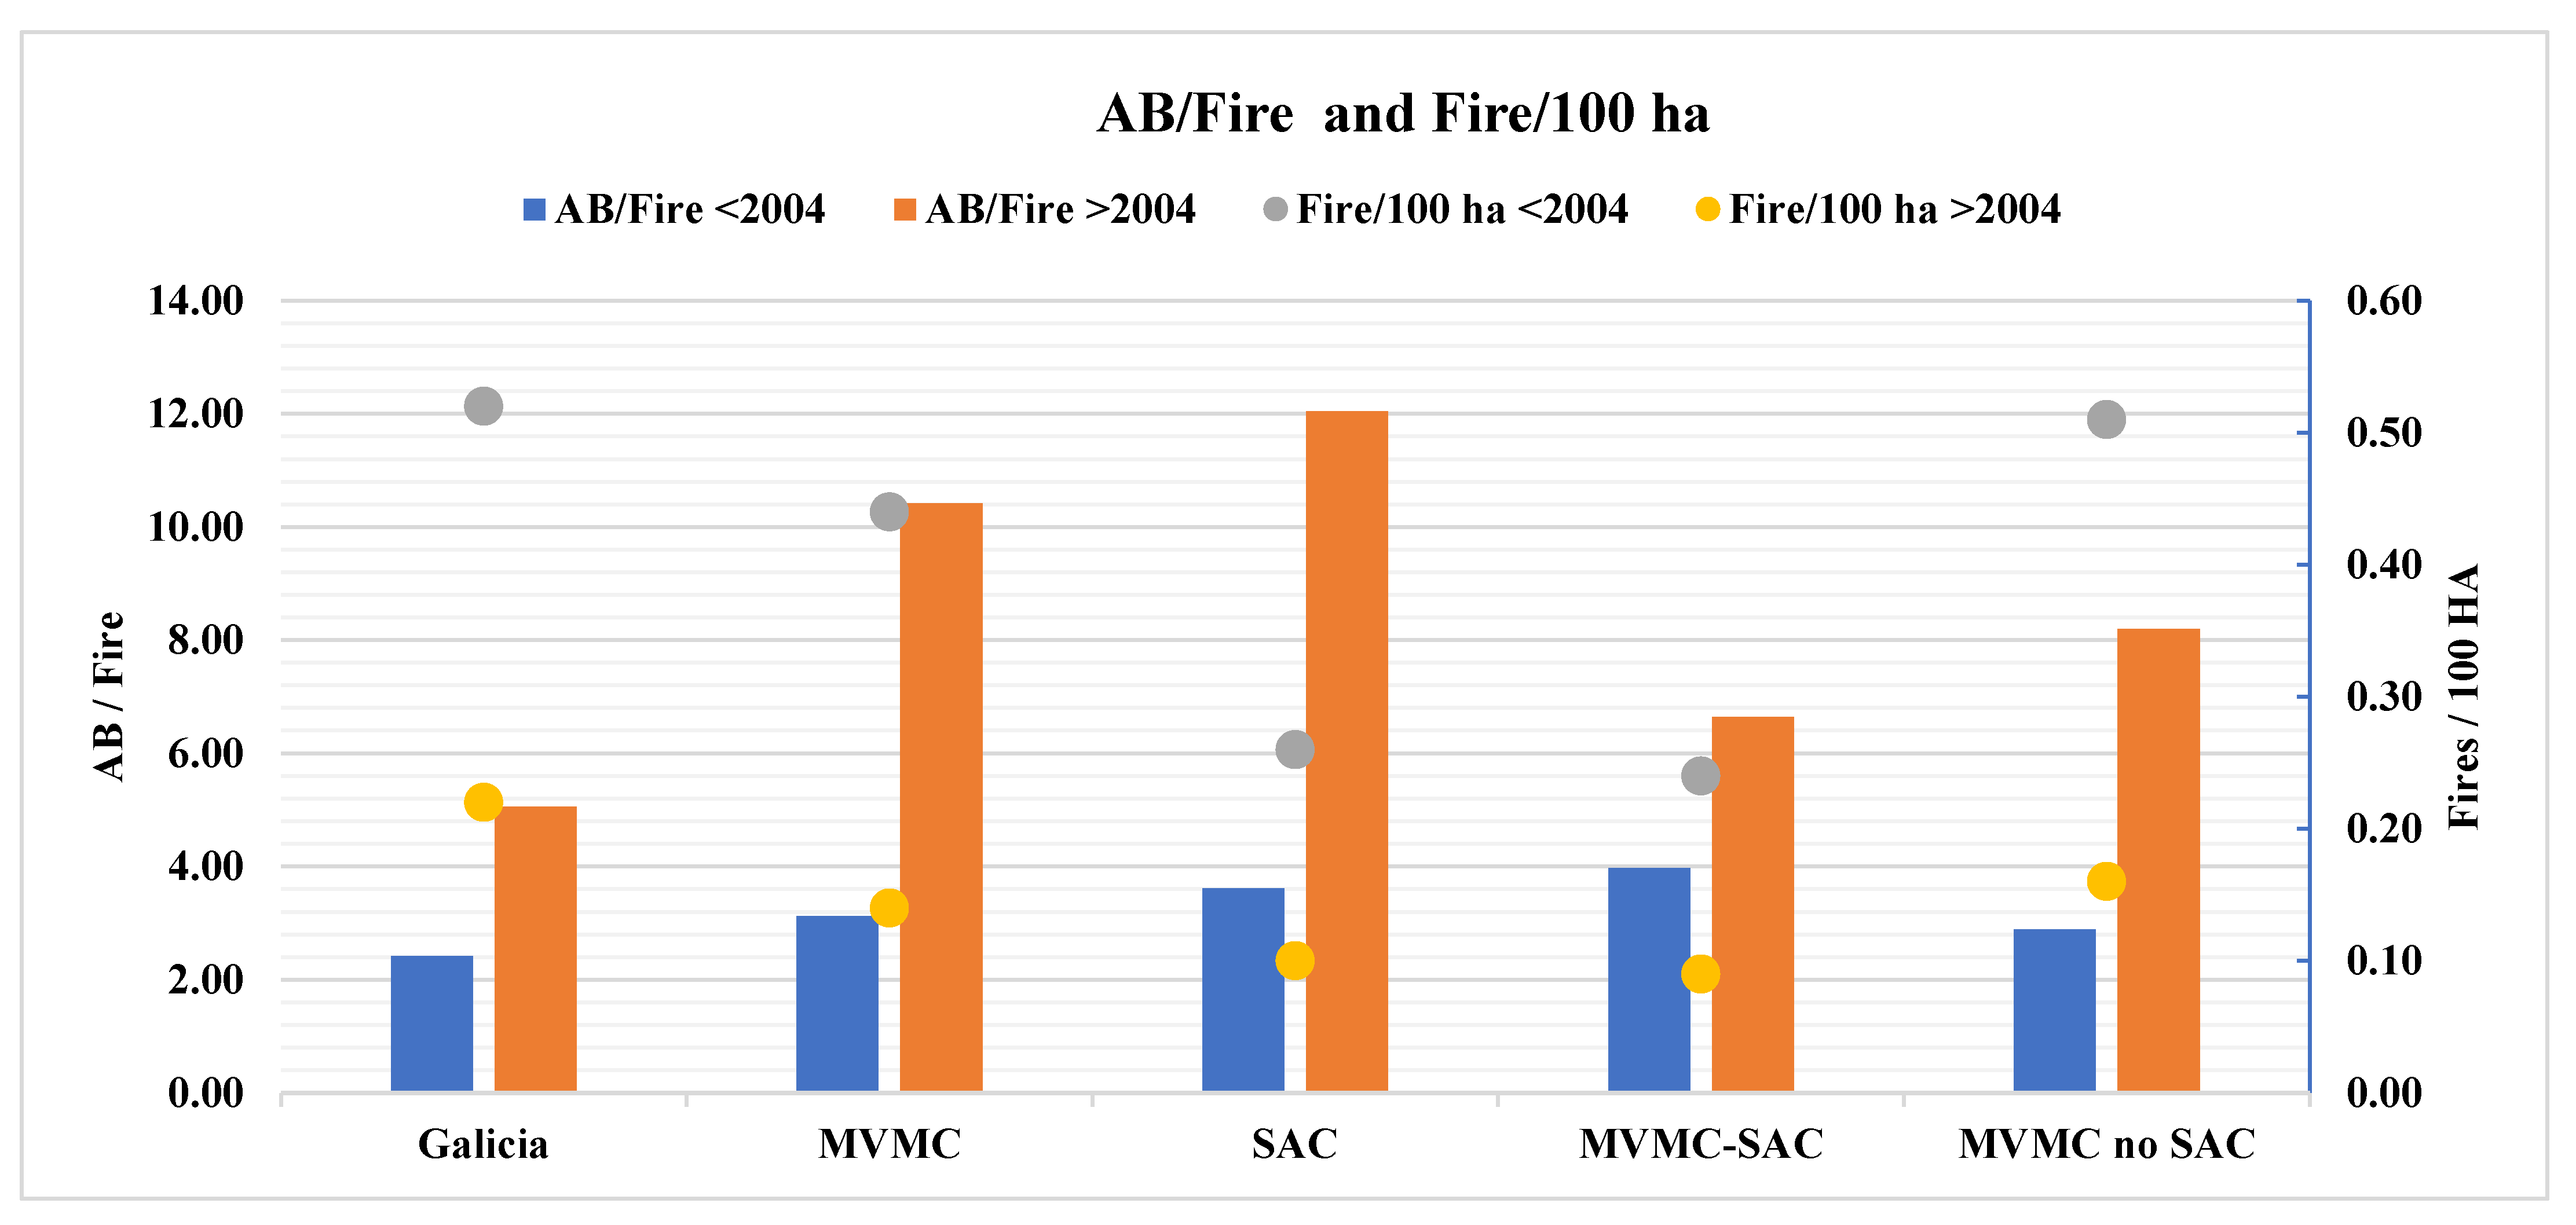
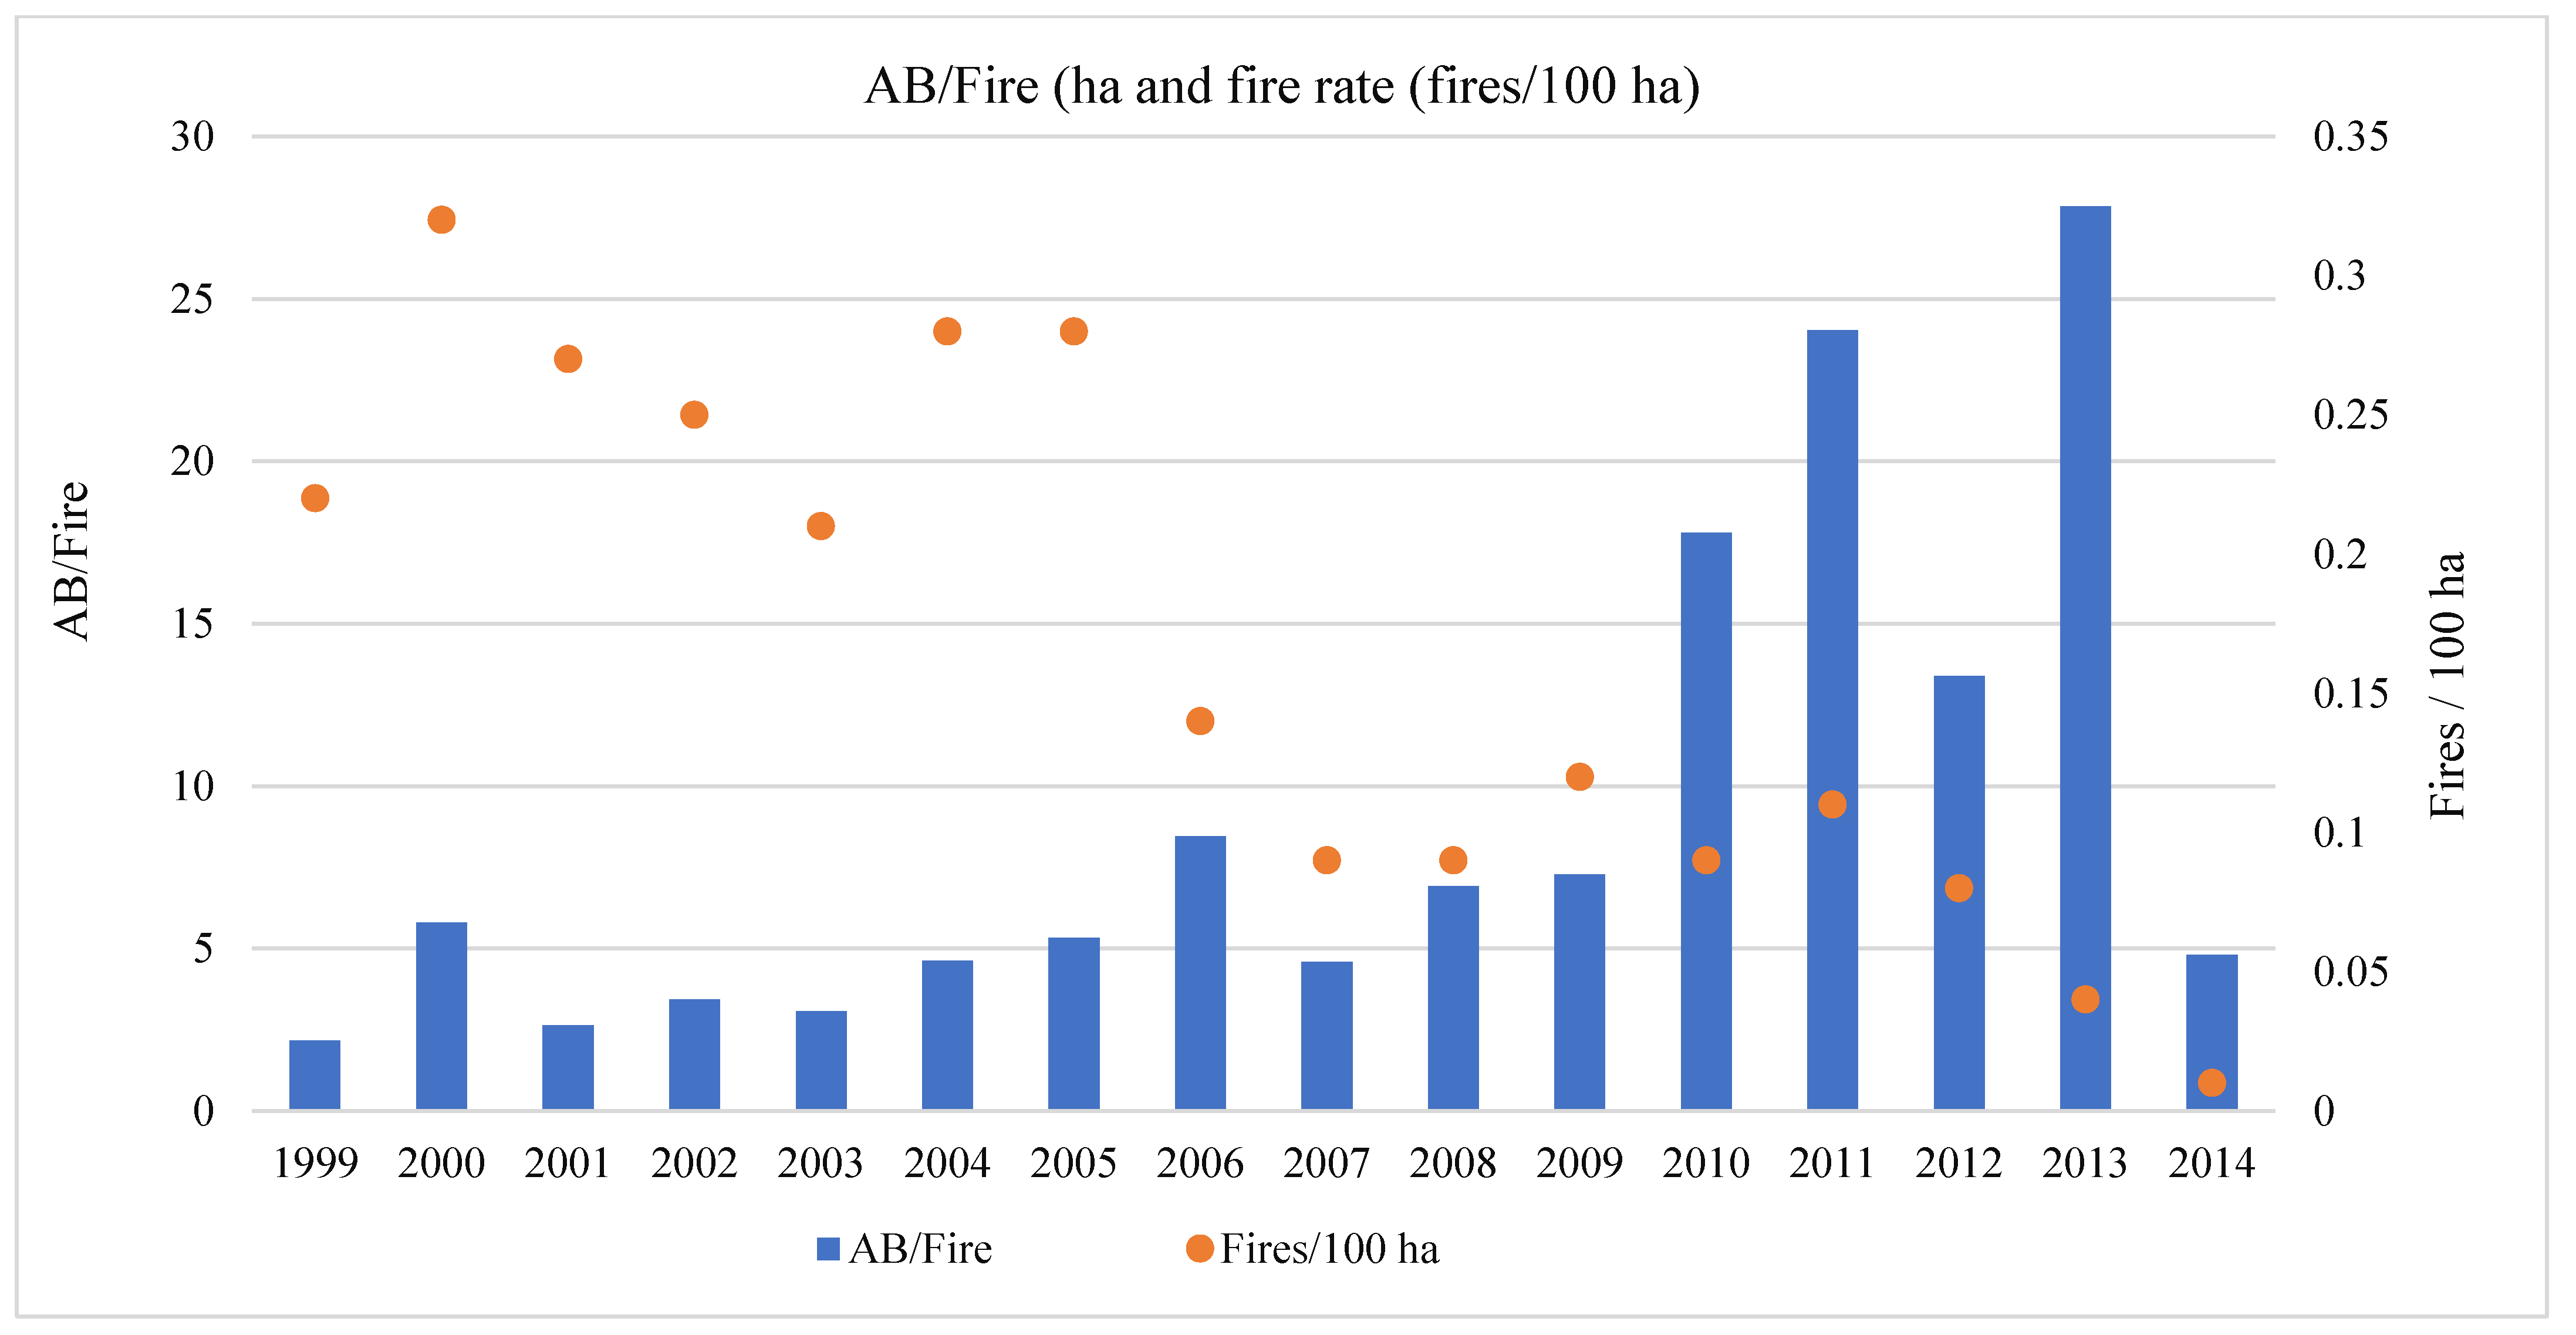
A more detailed analysis of the obtained results found that the area burned by fire (AB/fire) increased significantly after 2004 in all territorial categories studied. Interestingly, the highest percentage of increase occurred in MVMCs, where the area burned by fire increased by 233.36%, as well as in SACs, where the increase was 232.68% (Table 3). In these SACs, the area burned by fire was even the largest of all studied categories (
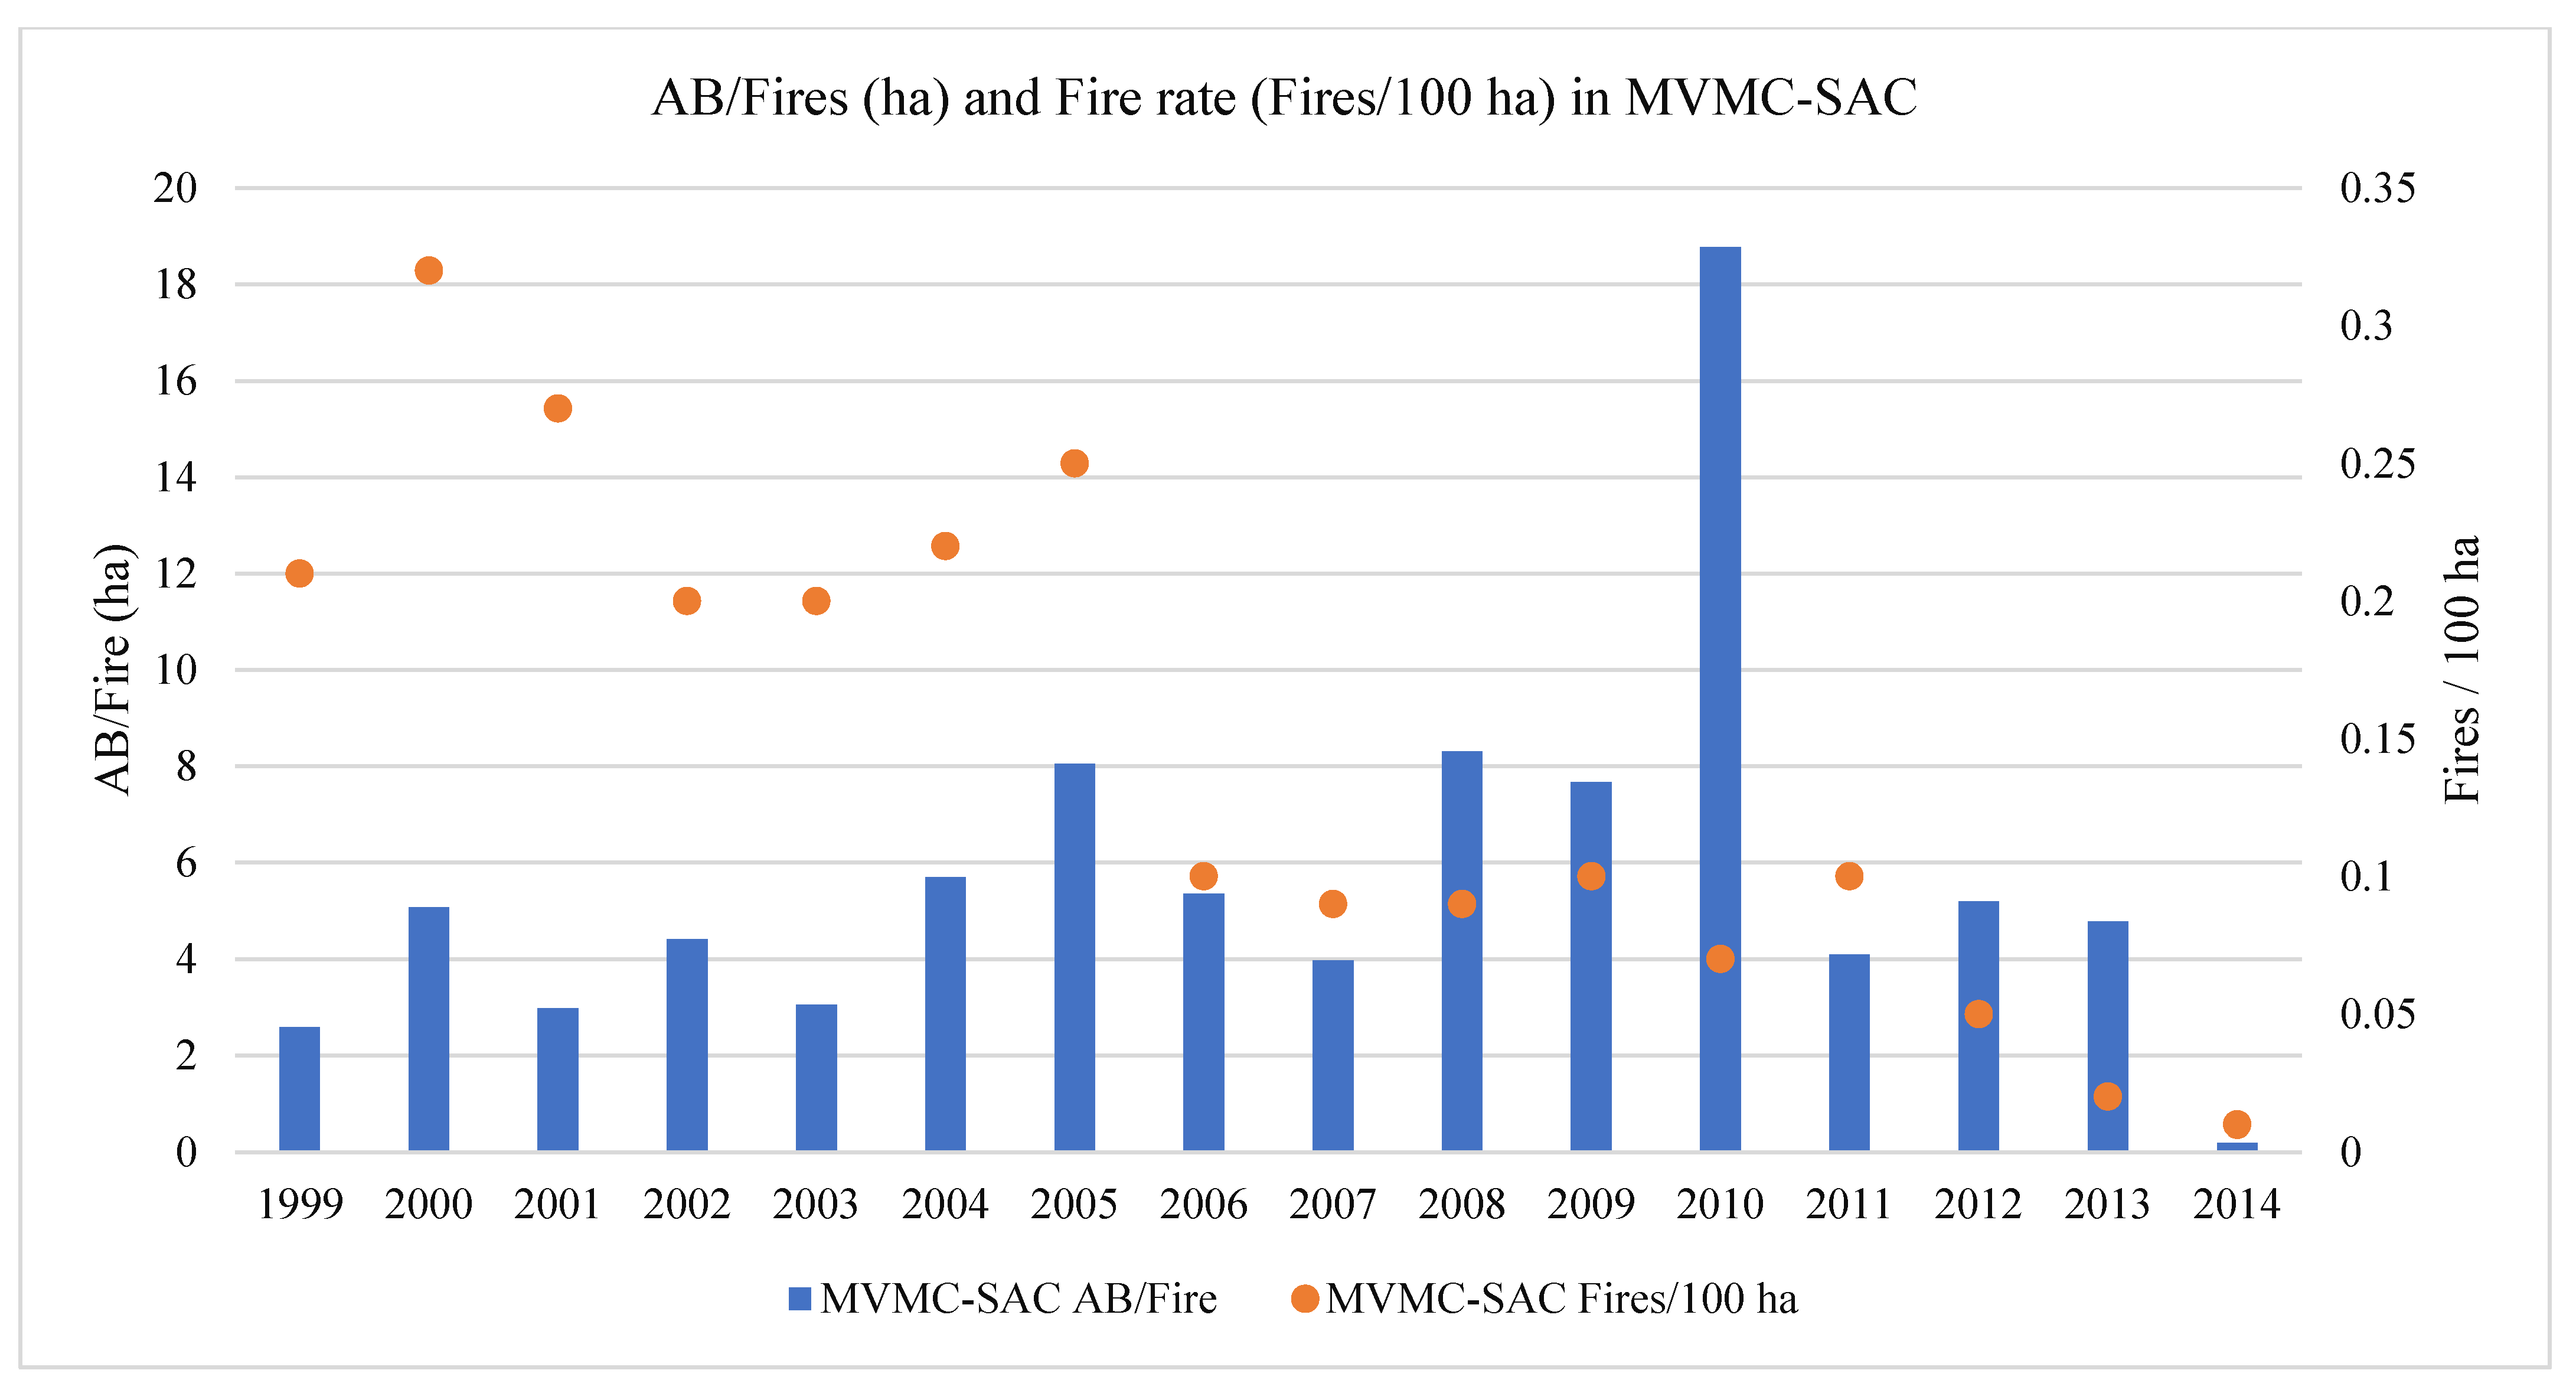
Figure 12). In the MVMC-SAC intersection areas, however, the percentage increase was the smallest, which could indicate that the property regime had some influence on the fire regime.
In relation to the property regime, it should also be noted that the only territorial group in which there was a reduction in the annual burned area between 1999–2014 was the MVMC–SAC (30.96%). This means that, despite the increase in the area burned by forest fire in the analysis period, the reduction in the number of fires compensated for the damage caused by this type of accident, a circumstance that was not found for the remaining groups.
Finally, in order to answer the questions posed above and check if the differences detected were statistically significant, mean comparison analyses were carried out considering homogeneous variances (Table 4, Table 5 and Table 6). The results are shown and analysed below.
For the analysis of intentionality in SACs (Issue 1), the null hypothesis was rejected both for the rate of forest fires and for the area burned by fire (Table 4), allowing us to conclude that the differences in existing means were significantly different, although in the opposite direction in both cases. Thus, while there was a significant decrease in the number of fires from 2004 onwards (Figure 13), the area affected by fire was much higher after that year.
With regard to MVMCs that included SAC (Figure 14) or with area included within a SAC (Issue 2), Table 5 shows that there were no significant differences in the area affected by fire after 2004, although there were significant differences in the rate of forest fires. However, this reduction could correspond to the general decrease also observed for Galicia, so it is not firstly attributable to the approval of the autonomous decree regulating these protected areas. It should be remembered that, as seen in Table 4, in the SACs there were significant differences in the area affected by forest fires, so that difference could correlate to changes in private properties. In other words, if there were significant differences in the SACs and no significant differences in the MVMC-SACs, these differences must be due to the private properties in the SACs.
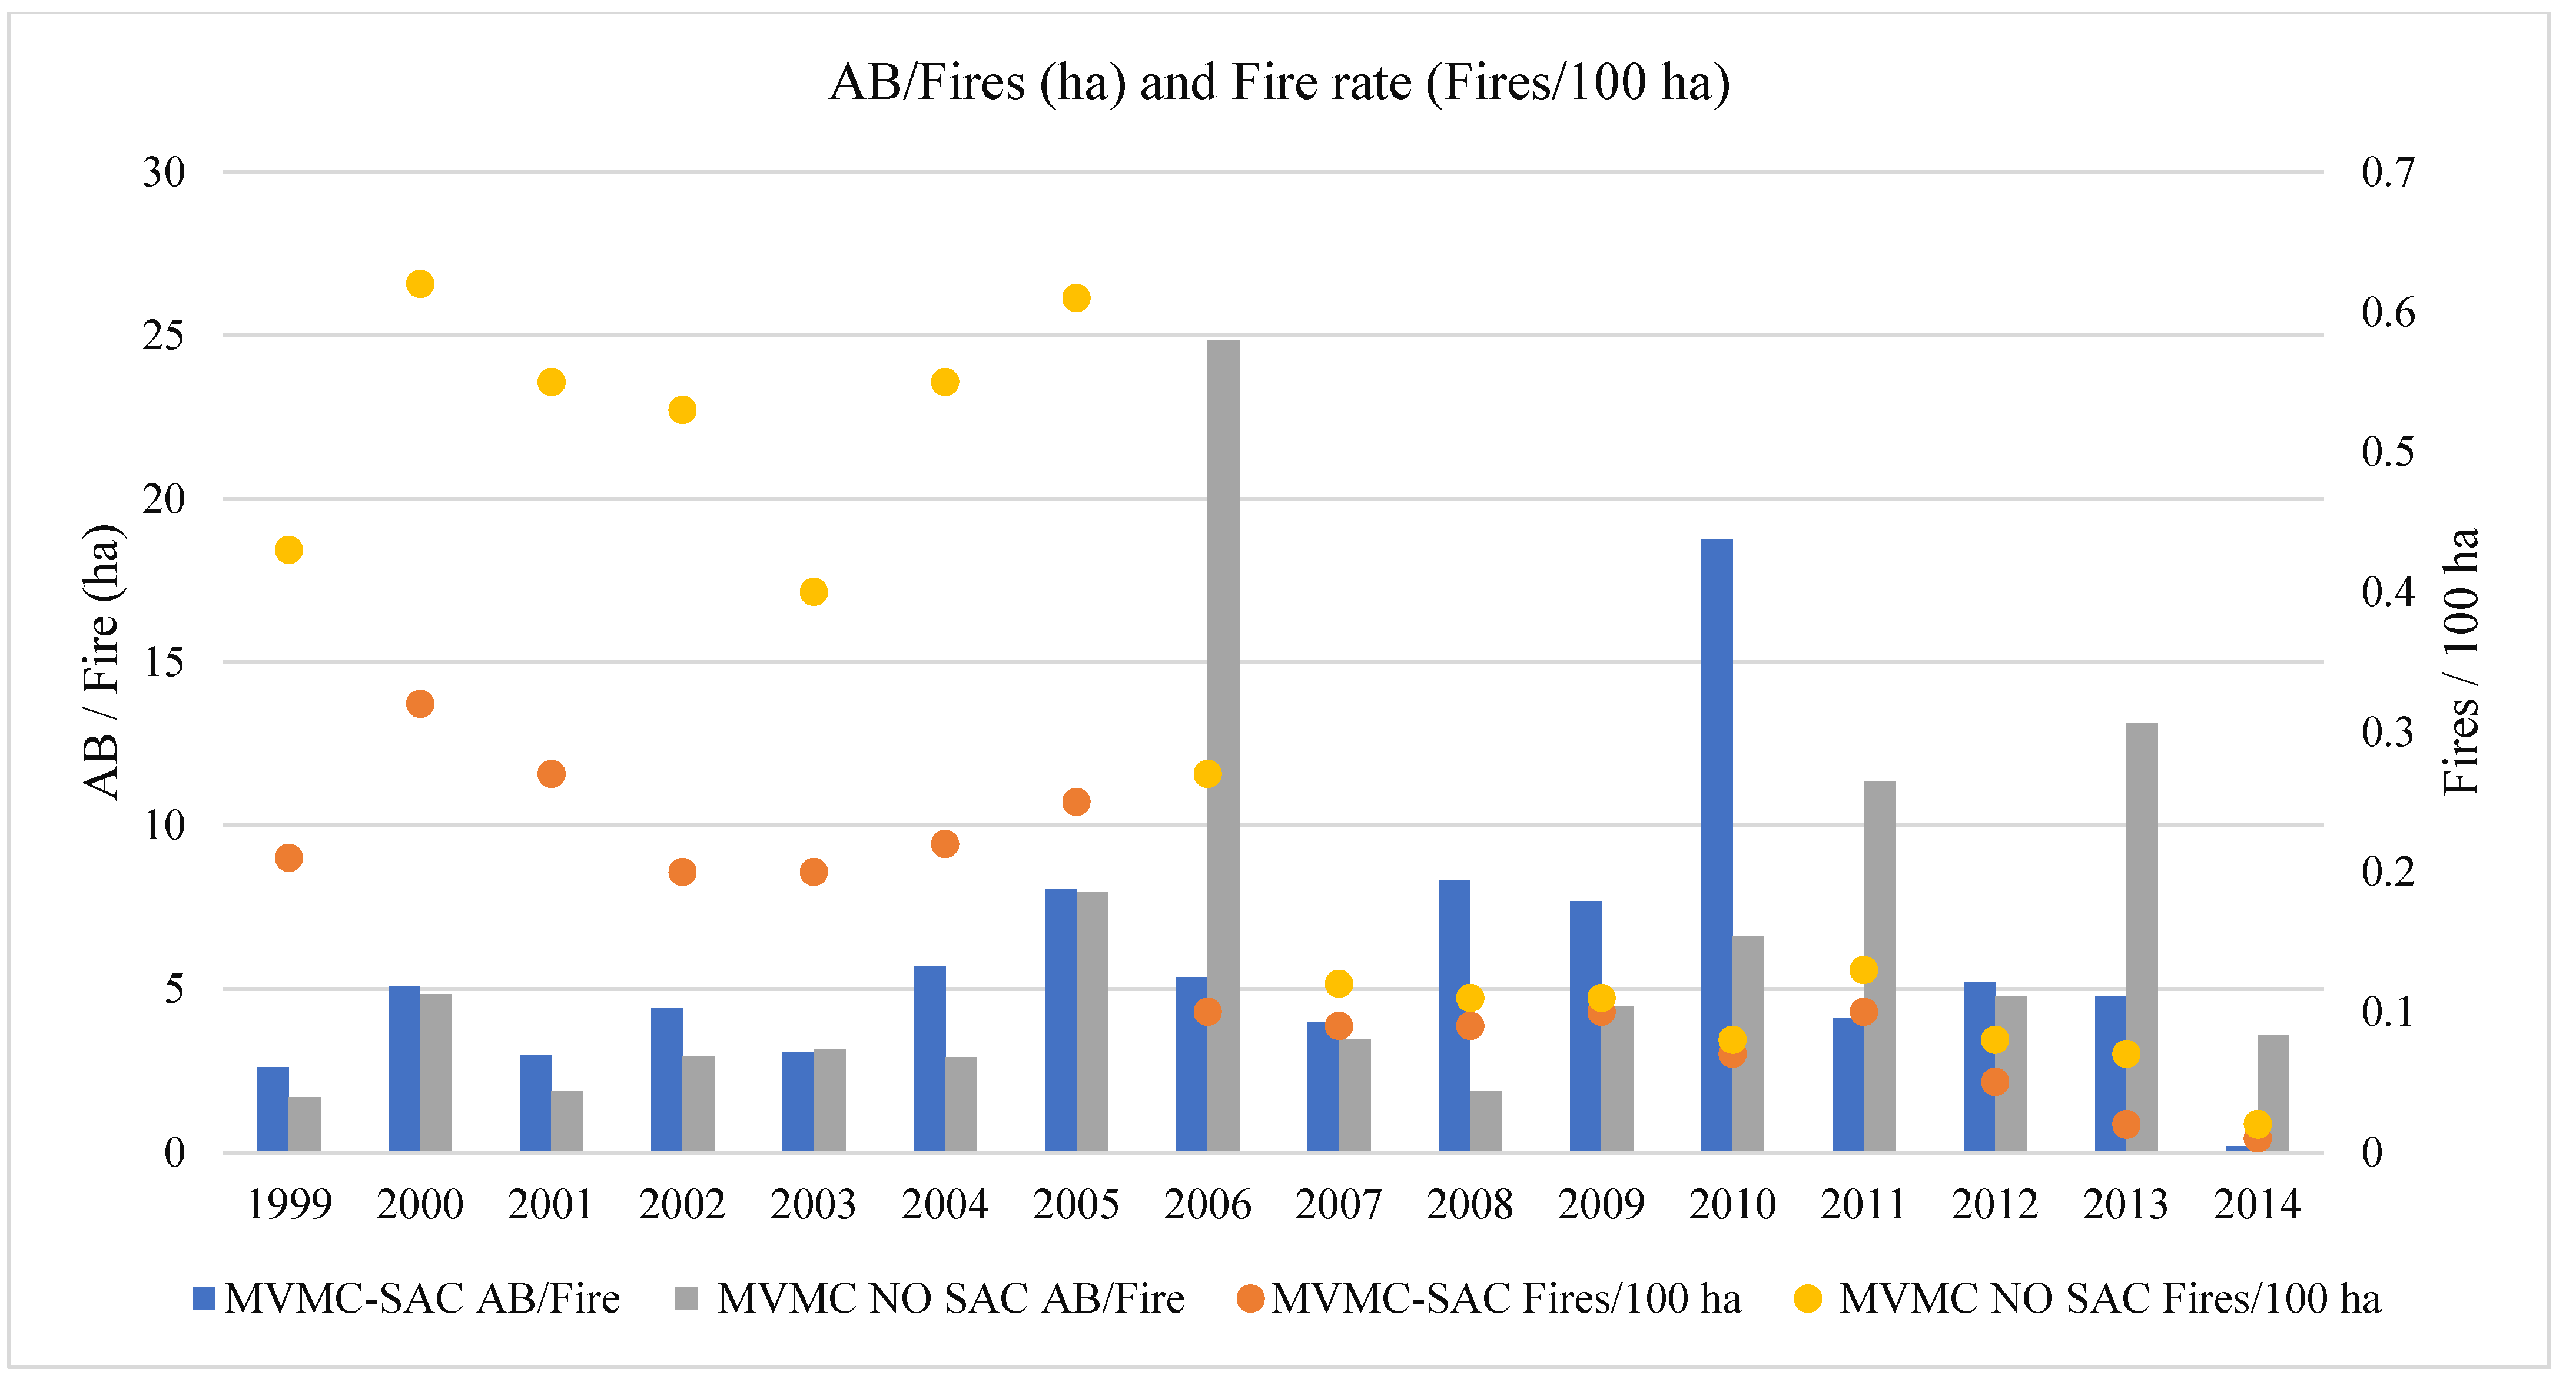
Finally, with regard to issue 3, the absence of significant differences was observed, both in the rate of forest fires and in the area burned by fire after 2004, for both MVMC-SAC and MVMC no SAC (Figure 15 and Table 6). Therefore, the official declaration of the Natura 2000 network does not seem to be decisive in the dynamics of the studied forest fires. This result corroborates what is observed in Table 5 with respect to the particular properties, since in this case the presence of the SAC did not seem to have any consequence.
To summarise, the results obtained are shown in Table 7. The decrease in the number of fires was generalised and very important after 2004, so significant differences were expected. However, it is noteworthy that there were significant differences in the area burnt in the SACs (Issue 1).

4. Discussion

According to the results we obtained, it can be seen that the Natura 2000 network did not have a very positive effect on the forest fire regime in the SACs. On the one hand, the percentage of forest fires caused by man decreased less in the SACs (Figure 10) than in the other territorial units analysed. We also saw that the SACs suffered a significant increase in the area burnt by fire (232.68% for the study period, as shown in Table 3). Likewise, the SACs did not have the generalized decrease in the number of fires observed for other areas of Galicia. While the rate of fires in the MVMCs decreased very significantly after 2007, the rate in SACs was not as favourable (Table 2 and Figure 11). It can be assumed, however, that the fact that the SACs had a smaller decrease in the number of fires than other territorial units may be due to Galicia’s de facto conservation policy, which leads to respect for certain areas of higher ecological value. In reality, the fact that these SACs have a high ecological value is due to the absence of forest fires.
In view of the results obtained, it cannot be exhaustively established that the cause of this unfavourable behaviour was the promulgation of Decree 72/2004, since the explanation could be found in several factors. However, taking into account that more than 90% of forest fires in Galicia are caused by man, these data seem to indicate a certain opposition to the Natura 2000 network, as the scientific literature has stated [9,34,35,36,37]. This unfavourable behaviour could also be explained by land abandonment caused by the Natura network; land abandonment increases the available fuel, which favours an increase in the area burned by forest fires [72]. This issue will be discussed in detail below.
The larger burned area by fire in the SACs may be due to several reasons. On the one hand, it could be due to the fact that SACs are usually further away from means of fire suppression, so the time to reach the fire is longer. Consequently, this longer reaction time leads to a large affected area. On the other hand, this greater burned area could also be due to the incompatibility of certain activities and/or preventive infrastructures against forest fires with the Natura 2000 network [73], a circumstance that has not yet been adequately addressed by the managers of the Natura 2000 network. In this regard we agree with Foresta et al., 2016 [73], on the advisability of carrying out various works that allow the reduction of existing fuel, such as clearing and pruning. In any case, although these circumstances could explain the poor results observed for protected areas (SACs), the results obtained seem to indicate the existence of other additional factors. This seems to be indicated by the fact that the increase in the area burnt in the SACs after 2004 was statistically significant, but not in the case of the MVMC-SACs. In fact, the AB/fire after 2004 in the SACs almost doubled the AB/fire of the MVMC-SACs (12.04 ha versus 6.64 ha; Table 3). Considering that almost 99.5% of the Galician forest is in individual private ownership, it can be concluded that this excess of burned area in SACs mainly affected private estates. The obtained results (Table 4, Table 5 and Table 6) confirm this difference in behaviour between individual private properties and collective private properties (MVMCs), since the statistical differences detected in the SACs were not repeated in the MVMC-SACs. This argument is ratified by the fact that the differences found between MVMC-SAC and MVMC-no SAC were not statistically significant, so the declaration of this legal protection did not cause any change for these territorial units.
On the basis of the above, it is necessary to ask whether the statistical differences we detected were due to the property regime. In this sense, Ficko & Boncina (2019) [74] found that private owners of private forests and those residing in areas with a high proportion of protected forests in Slovenia, with unfavourable physical and socio-economic conditions, were not in favour of greater forest conservation. In a way, if the Natura 2000 network provoked the rejection of the owners of the protected land [21], it would be reasonable to think that this rejection would be greater when the protected land was in individual private ownership, and not public or joint, since economic bankruptcy would be perceived differently. In this respect, it is worth recalling what Van der Berg & Koole (2006) [75] stated for the Netherlands, where rural residents showed a clear preference for active nature management, while urban residents, whose economy depended on other factors, considered managed landscapes to be significantly less beautiful than wild landscapes. It is also necessary to recall the arguments of Bhandari & Jianhua (2017) [76], with whom we agree when they affirmed that the conservation of biodiversity is very difficult if local communities depend on it to meet their needs. We also agree with them when they stated that, for the proper development of strategies that affect the natural environment, it is essential to understand the dependence that local communities have on that natural environment. Therefore, the best conservation outcomes occur when local communities are empowered [77]. The biggest challenges for the functioning of the Natura 2000 network are indisputably the level and quality of public participation in its implementation and management, the general negative perception of the public regarding it, the lack of flexibility of the responsible authorities and insufficient consideration of the local context [21]. In this regard, a European Commission report published in 2014 [78] stated that conflicts may arise between nature conservation and other human activities due to the fact that nature conservation may have important consequences for other land use activities and thus for the landowner and users, who are likely to disagree with these land use changes. Thus, some activities that may be subject to restrictions or regulations are, among others, grazing, mowing, removal of scrub, hunting and fishing [78].
It is clear, therefore, that avoiding this rejection greatly influences the success of conservation measures, so it is worth considering how best to avoid such rejection. In this sense, authors such as Kamal & Grodzinska-Jurczak (2014) [79] or Schröter-Schlaack et al. (2014) [80] have suggested the need to put in place compensatory financial mechanisms to cover the costs that the Natura 2000 network represents for landowners. Others, however, such as Oldekop et al. (2016) [79], have insisted on the synergy between conservation and socio-economic development linked to the management of areas to be conserved by local communities. In this respect, the adoption of agreements or contracts with landowners/land users would be important. This would be of particular relevance for recurrent measures such as mowing, for example, rather than the application of restrictions or the requirement of administrative licenses [78].
In accordance with the above, the fact that the Natura 2000 network has not achieved the desired results may not be due to the legislation itself, as stated in a report by the European Commission published in 2016 [81], but to a poor implementation of it and, more specifically, to the incompatibility of the preventive measures that we pointed out earlier and to the perception that the rural population has of them. As Kati et al. 2015 [82] said, it may even be due to the lack of will on the part of public administrations to meet the objectives of the Natura network. Be that as it may, the commission’s report stated that up to 80% of respondents belonging to the agricultural and forestry sector thought at the time of polling that the European directives to safeguard biodiversity were not very important.
We do not agree with Moreira et al. (2011) [83] when they mentioned that the interventions to be carried out in the Natura 2000 network should promote the renaturalisation process, that is, the homeostatic capacity of natural ecosystems and their degree of resilience, because although this is true, it does not seem to be enough. In this regard, we believe that the preventive measures and infrastructures to be developed in the Natura 2000 network should tend to the integral recovery of the rural environment, as well as the recovery of certain traditional forestry practices aimed at, for example, eliminating fuel, and even to the economic use of small masses of hardwoods, because the landowner only considers his land to be valuable if he obtains remuneration from it (financial or otherwise). At this point it is worth recalling the existence of a direct relationship between forest fires and social conflicts [29,30,31], as well as the relationship between ineffective forest policies and forest fires [32,33,34]. This is particularly important in regions such as Galicia, where arson forest fires are very frequent. It should also be remembered that biodiversity protection measures can lead to land abandonment, which can lead to an increase in the number of fires by favouring the growth of available fuel [35,36,37,38,41,42,43]. In any case, a better understanding of the causes of conflict and respect for the traditional practices of local communities will help the Natura 2000 network be more successful.

5. Conclusions

In view of the various controversies that have accompanied the Natura 2000 network since its creation, as mentioned at the beginning of this article, it was necessary to analyse the result that it has had on the fire regime, since in Galicia, as has been said, most forest fires are human-caused. In this sense, an increase in the number of wildfires occurring in the SACs or an increase in the burnt area could indicate a rejection of the Natura 2000 network. It was also necessary for our study to focus on the MVMCs, due to the great importance of the MVMCs in the forestry sector in Galicia. This allowed us to observe the differences that exist in different types of property.
Once the necessary calculations were made, we found that the answers to the three questions posed, with which we intended to evaluate the effects of the Natura 2000 network on the fire regime, were uneven. However, in terms of the results obtained, it can be said that the declaration of protection has not brought any benefit to the fire regime for the SACs. On the contrary, the significant increase in burned area in these areas seems to indicate a certain rejection of the Natura 2000 network, mainly by privately owned farms and not communal ownerships such as MVMCs. However, this increase may be due to many other causes not analysed in this study. Therefore, future work should focus on the possible relationship between the occurrence of fires and the property regime. The socio-economic conditions of protected areas also need to be considered, since if the population of those areas perceives the Natura 2000 network as a risk to their living conditions, they will hardly accept it.
It is also necessary to analyse whether the criteria used by the Natura 2000 network in its classification are the most appropriate. For example, although Article 2 of the Habitats Directive [1] states that economic, social and cultural requirements must be taken into account, it should be remembered that socio-economic conditions were not taken into account during the selection process [78]. Consequently, if the criteria are not appropriate, it is very likely that the result obtained will be very unfavourable or that there will be some social opposition. If the Natura 2000 network areas had been selected on purely environmental criteria, the number of fires would certainly be lower, as shown by official statistics for those SACs that do have outstanding environmental value [
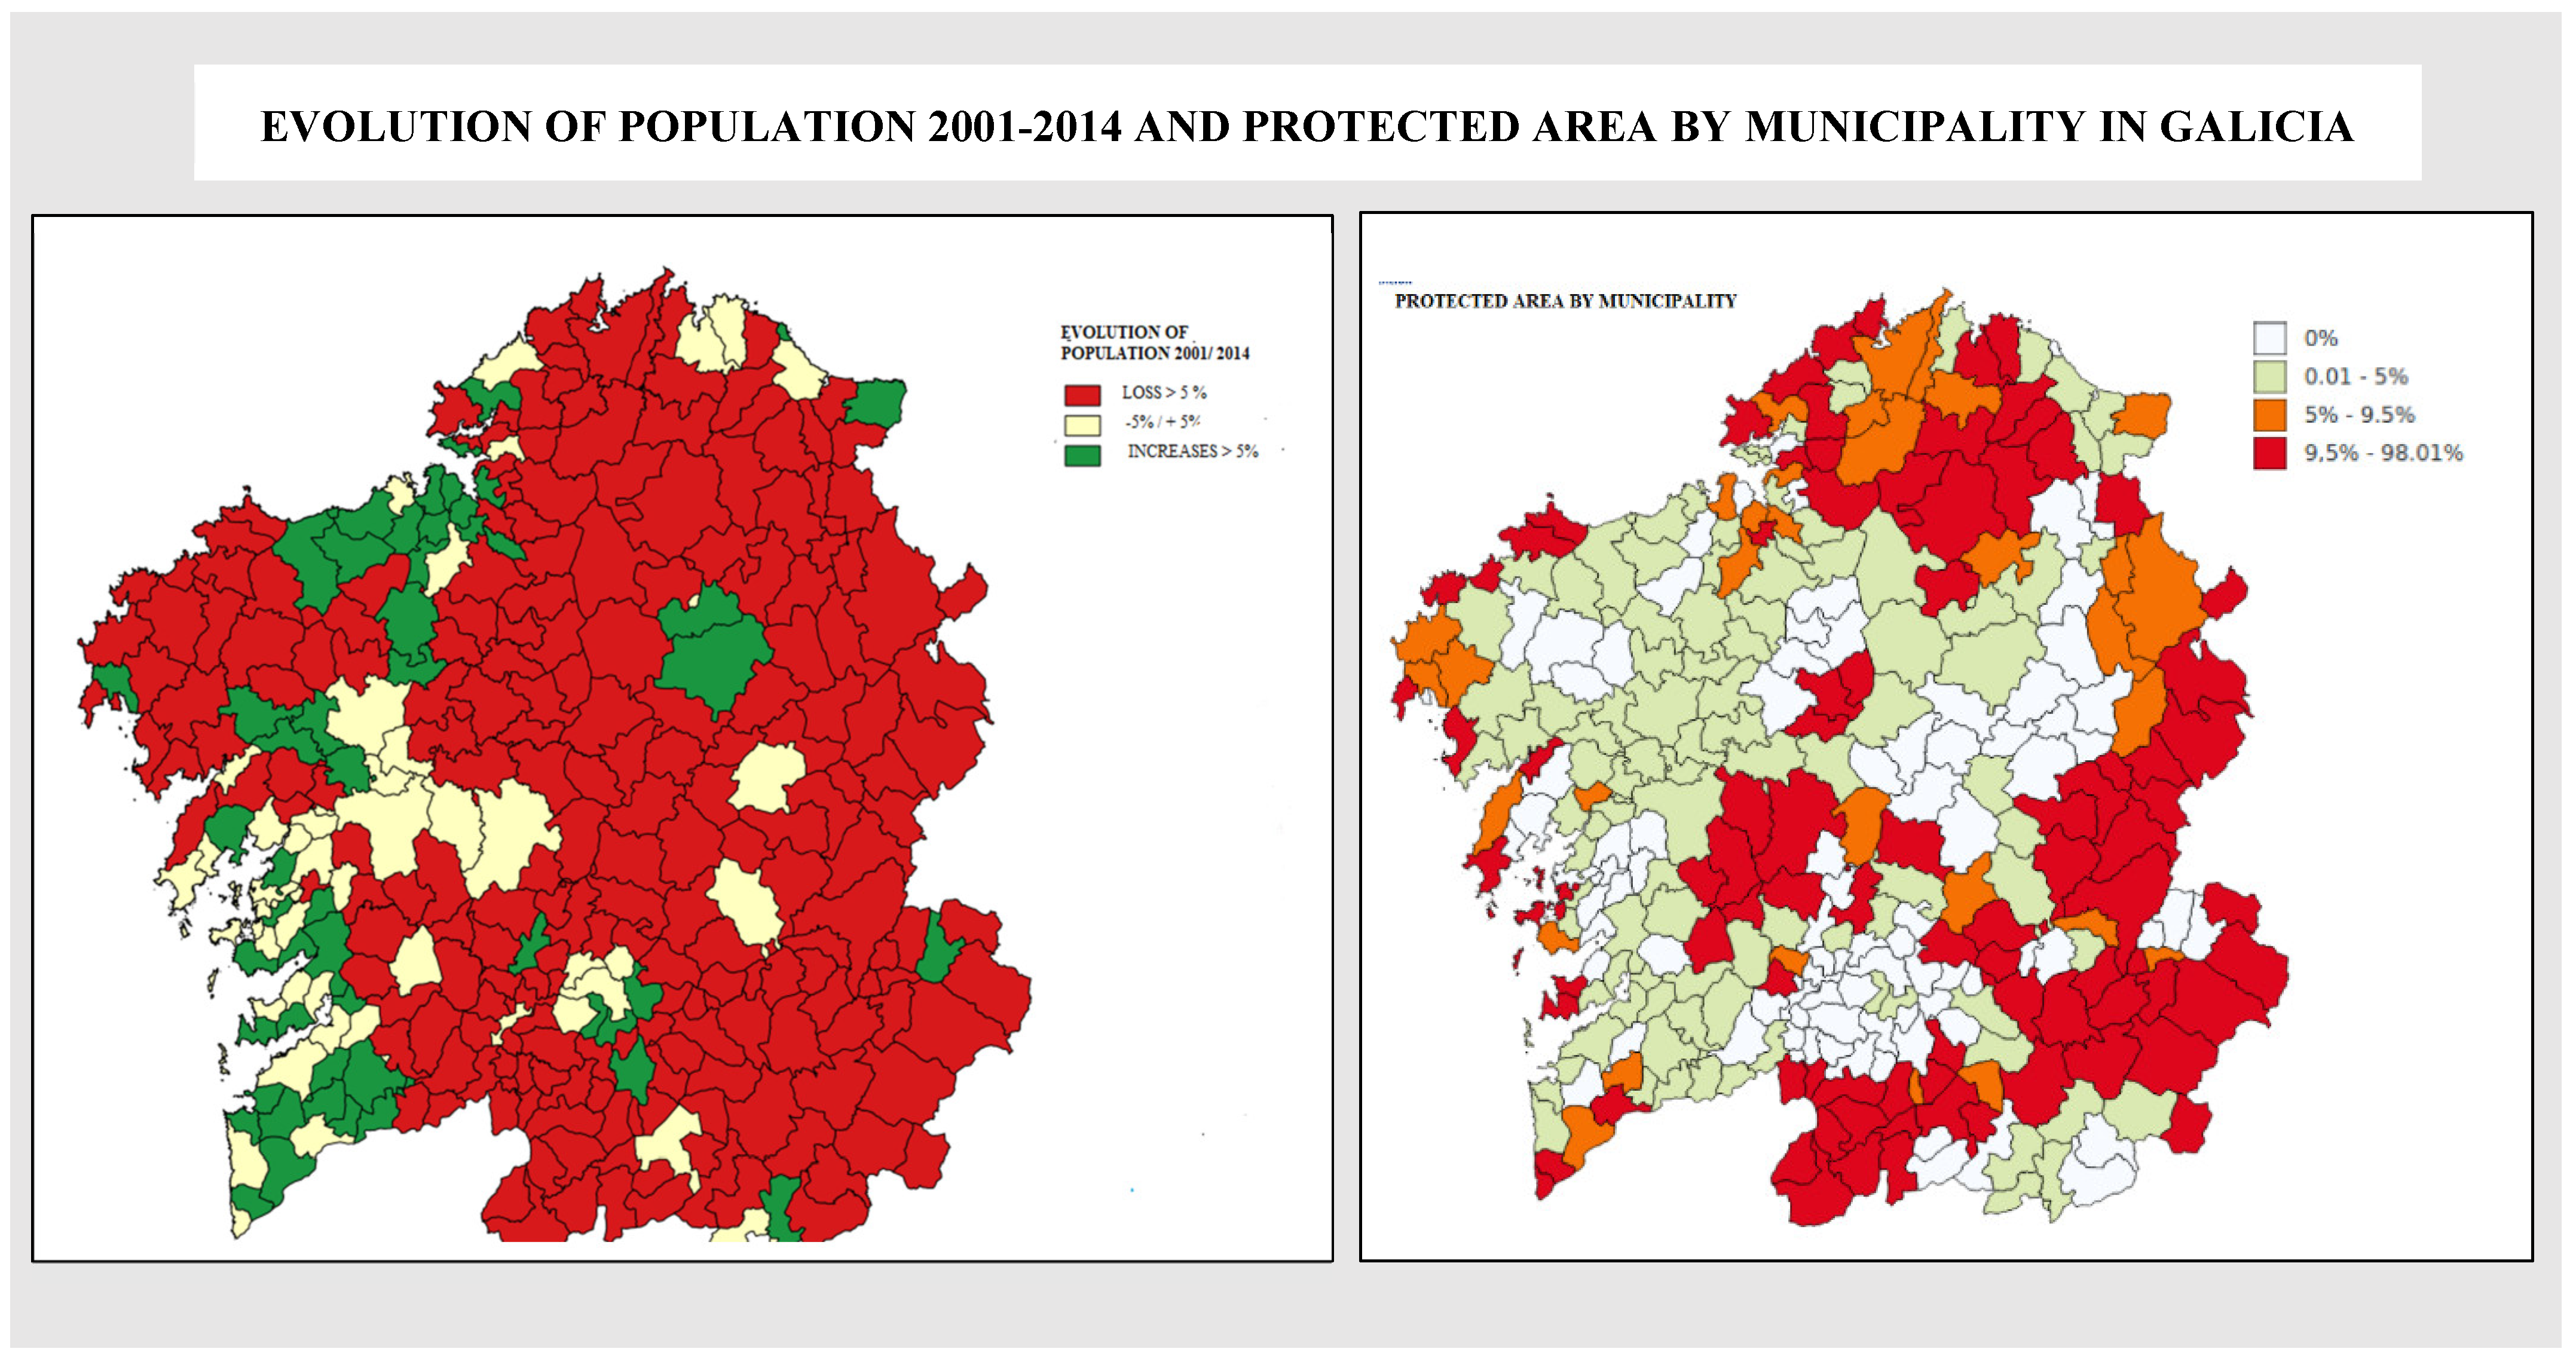
66]. In fact, as mentioned above, the fact that these SACs have a high ecological value is due to the absence of forest fires. However, in most cases the SAC classification seemed to respond only to the legal obligation to reach a sufficient surface area. At the same time, the classification tried to focus on less populated areas, probably in order to obtain less social opposition. This can be seen in Figure A1 of Appendix A [84], where it can be observed that the Natura 2000 network is mainly located in the most depopulated municipalities of Galicia (West Zone) and in those municipalities where there was a greater loss of population between 2001 and 2014. By acting in this way, it is likely that areas that do not have the ecological value necessary to be protected are being protected, while areas of high ecological value remain unprotected. Anyway, we understand that the success of the Natura 2000 network will depend, to a large extent, either on promoting the socio-economic development of the resident population in the protected lands (which would have the detrimental effect of promoting the abandonment of land), or, preferably, on allowing the economic use that has traditionally occurred in the protected lands. It should be recalled in this regard that it has been the local communities who, through sustainable management of resources, have so far conserved these lands [9]. In any case, the success of the Natura 2000 network will require the observation of environmental and socio-economic factors as well as analysis of the consequences that the implementation and management of this ecological network have for the rural population.

Author Contributions

Conceptualization, M.F.M.P. and G.L.R.; methodology, M.F.M.P. and G.L.R.; software, G.L.R.; validation, M.F.M.P. and V.R.V.; formal analysis, M.F.M.P. and G.L.R.; investigation, G.L.R.; resources, M.F.M.P.; data curation, G.L.R.; writing—original draft preparation, G.L.R.; writing—review and editing, G.L.R., M.F.M.P. and V.R.V.; visualization, M.F.M.P., G.L.R. and V.R.V.; supervision, M.F.M.P. and V.R.V.; project administration, M.F.M.P.; funding acquisition, M.F.M.P. All authors have read and agreed to the published version of the manuscript.

Funding

With the support of a grant from the Xunta de Galicia (Competitive Reference Groups ED431C-2021-27).

Institutional Review Board Statement

Not applicable.

Informed Consent Statement

Not applicable.

Data Availability Statement

Not applicable.

Conflicts of Interest

The authors declare no conflict of interest.

Appendix A

Table A1. Fuel models according to MFE.
GrupoCodeDefinition
No data0No information available
Grassland1Thin, dry, low grass, completely covering the ground.
Some scattered woody plants may appear, occupying less than 1/3 of the surface.
Fuel quantity (dry matter): 1–2 t/ha.
2Thin, dry, low grass, completely covering the ground.
Scattered woody plants cover 1/3 to 2/3 of the area, but fire spread is through grass.
Fuel quantity (dry matter): 5–10 t/ha.
3Thick, dense, dry, tall grass (>1 m).
There may be some scattered woody plants.
Fuel quantity (dry matter): 4–6 t/ha.
Scrubland4Very dense thicket or young plantation; over 2 m high; with dead branches inside.
Spread of fire through plant canopies.
Fuel quantity (dry matter): 25–35 t/ha.
5Dense green scrub, less than 1 m high.
Spread of fire through leaf litter and grass.
Fuel quantity (dry matter): 5–8 t/ha.
6Similar to model 5, but with more flammable species or with cuttings and larger plants.
Fire spread in moderate to strong winds.
Fuel quantity (dry matter): 10–15 t/ha.
7Scrubland of highly flammable species; 0.5 to 2 m high, located as undergrowth in coniferous stands.
Fuel quantity (dry matter): 10–15 t/ha.
Litter under trees8Dense forest, no scrub.
Spread of fire through tightly packed leaf litter.
Fuel quantity (dry matter): 10–12 t/ha.
9Similar to model 8, but with less compact litter, consisting of long, stiff needles or foliage of large-leaved broadleaves.
Fuel quantity (dry matter): 7–9 t/ha.
10Forest with a large amount of firewood and fallen trees, as a consequence of windstorms, intense pests, etc.
Fuel quantity (dry matter): 30–35 t/ha.
Pruning and forestry residues11Clear and heavily thinned forest. Remains of pruning or thinning.
Scattered pruning or thinning debris, with herbaceous plants resprouting.
Fuel quantity (dry matter): 25–30 t/ha.
12 Predominance of debris over trees.
Remains of pruning or thinning covering the whole ground.
Fuel quantity (dry matter): 50–80 t/ha.
13Large accumulations of coarse and heavy debris, covering the entire ground.
Fuel quantity (dry matter): 100–150 t/ha.
Figure A1. Evolution of population (2001–2014) and protected area by municipality.
Forests 13 01161 g0a1

References

  1. Directiva 92/43/CEE del Consejo, de 21 de Mayo de 1992, Relativa a la Conservación de los Hábitats Naturales y de la Fauna y Flora Silvestres. DOUE-L-1992-81200. Available online: https://www.boe.es/buscar/doc.php?id=DOUE-L-1992-81200 (accessed on 1 December 2021).
  2. Orlikowska, E.H.; Roberge, J.M.; Blicharska, M.; Mikusiński, G. Gaps in ecological research on the world’s largest internationally coordinated network of protected areas: A review of Natura 2000. Biol. Conserv. 2016, 200, 216–227. [Google Scholar] [CrossRef]
  3. Sperandii, M.G.; Barták, V.; Acosta, A.T.R. Effectiveness of the Natura 2000 network in conserving Mediterranean coastal dune habitats. Biol. Conserv. 2020, 248, 108689. [Google Scholar] [CrossRef]
  4. D’Amen, M.; Bombi, P.; Campanaro, A.; Zapponi, L.; Bologna, M.A.; Mason, F. Protected areas and insect conservation: Questioning the effectiveness of Natura 2000 network for saproxylic beetles in Italy. Anim. Conserv. 2013, 16, 370–378. [Google Scholar] [CrossRef]
  5. Trochet, A.; Schmeller, D. Effectiveness of the Natura 2000 network to cover threatened species. Nat. Conserv. 2013, 4, 35–53. [Google Scholar] [CrossRef]
  6. Guareschi, S.; Bilton, D.T.; Velasco, J.; Millán, A.; Abellán, P. How well do protected area networks support taxonomic and functional diversity in non-target taxa? The case of Iberian freshwaters. Biol. Conserv. 2015, 187, 134–144. [Google Scholar] [CrossRef] [Green Version]
  7. Maiorano, L.; Amori, G.; Montemaggiori, A.; Rondinini, C.; Santini, L.; Saura, S.; Boitani, L. On how much biodiversity is covered in Europe by national protected areas and by the Natura 2000 network: Insights from terrestrial vertebrates. Conserv. Biol. 2015, 29, 986–995. [Google Scholar] [CrossRef]
  8. Barnes, M.D.; Craigie, I.D.; Harrison, L.B.; Geldmann, J.; Collen, B.; Whitmee, S.; Balmford, A.; Burgess, N.D.; Brooks, T.; Hockings, M.; et al. Wildlife population trends in protected areas predicted by national socio-economic metrics and body size. Nat. Commun. 2016, 7, 12747. [Google Scholar] [CrossRef]
  9. Müller, A.; Schneider, U.A.; Jantke, K. Is large good enough? Evaluating and improving representation of ecoregions and habitat types in the European Union’s protected area network Natura 2000. Biol. Conserv. 2018, 227, 292–300. [Google Scholar] [CrossRef]
  10. Gameiro, J.; Silva, J.P.; Franco, A.M.; Palmeirim, J.M. Effectiveness of the European Natura 2000 network at protecting Western Europe’s agro-steppes. Biol. Conserv. 2020, 248, 108681. [Google Scholar] [CrossRef]
  11. Lovrić, M.; Lovrić, N.; Schraml, U. Modeling policy networks: The case of Natura 2000 in Croatian forestry. For. Policy Econ. 2019, 103, 90–102. [Google Scholar] [CrossRef]
  12. Traba, J.; de la Morena EL, G.; Morales, M.B.; Suárez, F. Determining high value areas for steppe birds in Spain: Hot spots, complementarity and the efficiency of protected areas. In Biodiversity and Conservation in Europe; Springer: Dordrecht, The Netherlands, 2006; pp. 13–33. [Google Scholar]
  13. Guixé, D.; Arroyo, B. Appropriateness of Special Protection Areas for wide-ranging species: The importance of scale and protecting foraging, not just nesting habitats. Anim. Conserv. 2011, 14, 391–399. [Google Scholar] [CrossRef] [Green Version]
  14. Heino, M.; Kummu, M.; Makkonen, M.; Mulligan, M.; Verburg, P.H.; Jalava, M.; Räsänen, T.A. Forest Loss in Protected Areas and Intact Forest Landscapes: A Global Analysis. PLoS ONE 2015, 10, e0138918. [Google Scholar] [CrossRef]
  15. Hellwig, N.; Walz, A.; Markovic, D. Climatic and socioeconomic effects on land cover changes across Europe: Does protected area designation matter? PLoS ONE 2019, 14, e0219374. [Google Scholar] [CrossRef] [PubMed] [Green Version]
  16. Alphandéry, P.; Fortier, A. Can a Territorial Policy be Based on Science Alone? The System for Creating the Natura 2000 Network in France. Sociol. Rural. 2001, 41, 311–328. [Google Scholar] [CrossRef]
  17. Hiedanpää, J. European-wide conservation versus local well-being: The reception of the Natura 2000 Reserve Network in Karvia, SW-Finland. Landsc. Urban Plan. 2002, 61, 113–123. [Google Scholar] [CrossRef]
  18. Julien, B.; Lammertz, M.; Barbier, J.M.; Jen, S.; Ballesteros, M.; Bovis, C.D.; Krott, M. VOicing Interests and ConcErns: NATURA 2000: An ecological network in conflict with people. For. Policy Econ. 2000, 1, 357–366. [Google Scholar]
  19. Visser, M.; Moran, J.; Regan, E.; Gormally, M.; Skeffington, M.S. The Irish agri-environment: How turlough users and non-users view converging EU agendas of Natura 2000 and CAP. Land Use Policy 2007, 24, 362–373. [Google Scholar] [CrossRef]
  20. Sotirov, M.; Lovric, M.; Winkel, G. Symbolic transformation of environmental governance: Implementation of EU biodiversity policy in Bulgaria and Croatia between Europeanization and domestic politics. Environ. Plan. C Gov. Policy 2015, 33, 986–1004. [Google Scholar] [CrossRef]
  21. Blicharska, M.; Orlikowska, E.H.; Roberge, J.-M.; Grodzinska-Jurczak, M. Contribution of social science to large scale biodiversity conservation: A review of research about the Natura 2000 network. Biol. Conserv. 2016, 199, 110–122. [Google Scholar] [CrossRef]
  22. Pietrzyk-Kaszyńska, A.; Cent, J.; Grodzińska-Jurczak, M.; Szymańska, M. Factors influencing perception of protected areas—The case of Natura 2000 in Polish Carpathian communities. J. Nat. Conserv. 2012, 20, 284–292. [Google Scholar] [CrossRef]
  23. Paavola, J. Protected Areas Governance and Justice: Theory and the European Union’s Habitats Directive. Environ. Sci. 2004, 1, 59–77. [Google Scholar] [CrossRef] [Green Version]
  24. Koemle, D.; Lakner, S.; Yu, X. The impact of Natura 2000 designation on agricultural land rents in Germany. Land Use Policy 2019, 87, 104013. [Google Scholar] [CrossRef]
  25. Loureiro, M.L.; Alló, M. Os incendios forestais eo seu su impacto económico: Proposta para unha axenda investigadora. Rev. Galega Econ. 2018, 27, 129–142. [Google Scholar] [CrossRef]
  26. Palaiologou, P.; Ager, A.A.; Nielsen-Pincus, M.; Evers, C.R.; Day, M.A. Social vulnerability to large wildfires in the western USA. Landsc. Urban Plan. 2019, 189, 99–116. [Google Scholar] [CrossRef] [Green Version]
  27. Gitas, I.Z.; Polychronaki, A.; Katagis, T.; Mallinis, G. Contribution of remote sensing to disaster management activities: A case study of the large fires in the Peloponnese, Greece. Int. J. Remote Sens. 2008, 29, 1847–1853. [Google Scholar] [CrossRef]
  28. Mallinis, G.; Emmanoloudis, D.; Giannakopoulos, V.; Maris, F.; Koutsias, N. Mapping and interpreting historical land cover/land use changes in a Natura 2000 site using earth observational data: The case of Nestos delta, Greece. Appl. Geogr. 2011, 31, 312–320. [Google Scholar] [CrossRef]
  29. Marey-Pérez, M.F.; Gómez-Vázquez, I.; Díaz-Varela, E. Different approaches to the social vision of communal land management: The case of Galicia (Spain). Span. J. Agric. Res. 2010, 8, 848. [Google Scholar] [CrossRef] [Green Version]
  30. Ganteaume, A.; Camia, A.; Jappiot, M.; San-Miguel-Ayanz, J.; Long-Fournel, M.; Lampin, C. A Review of the Main Driving Factors of Forest Fire Ignition Over Europe. Environ. Manag. 2012, 51, 651–662. [Google Scholar] [CrossRef] [Green Version]
  31. Caballero, G. Community-based forest management institutions in the Galician communal forests: A new institutional approach. For. Policy Econ. 2015, 50, 347–356. [Google Scholar] [CrossRef]
  32. Molina, C.M. Comparative assessment of wildland fire legislation and policies in the European Union: Towards a Fire Framework Directive. For. Policy Econ. 2013, 29, 1–6. [Google Scholar] [CrossRef]
  33. Galiana, L.; Aguilar, S.; Lázaro, A. An assessment of the effects of forest-related policies upon wildland fires in the European Union: Applying the subsidiarity principle. For. Policy Econ. 2013, 29, 36–44. [Google Scholar] [CrossRef]
  34. López-Rodríguez, G.; Rodríguez-Vicente, V.; Marey-Pérez, M. Study of Forest Productivity in the Occurrence of Forest Fires in Galicia (Spain). Sustainability 2021, 13, 8472. [Google Scholar] [CrossRef]
  35. Bouillon, C.; Ramiro, M.F.; García, B.F.; Sirca, C.; Long-Fournel, M.; Casula, F.; Pintus, G.V. Forest Fires under Climate, Social and Economic Changes in Europe, the Mediterranean and Other Fire-Affected Areas of the World. Available online: https://www.researchgate.net/publication/281383404_Forest_fires_under_climate_social_and_economic_changes_in_Europe_the_Mediterranean_and_other_fire-affected_areas_of_the_world_FUME_lessons_learned_and_outlook (accessed on 2 January 2022).
  36. Loureiro, M.L.; Barreal, J. Modelling spatial patterns and temporal trends of wildfires in Galicia (NW Spain). For. Syst. 2015, 24, e022. [Google Scholar] [CrossRef] [Green Version]
  37. Viedma, O.; Moity, N.; Moreno, J.M. Changes in landscape fire-hazard during the second half of the 20th century: Agriculture abandonment and the changing role of driving factors. Agric. Ecosyst. Environ. 2015, 207, 126–140. [Google Scholar] [CrossRef]
  38. Galiana-Martín, L. Spatial Planning Experiences for Vulnerability Reduction in the Wildland-Urban Interface in Mediterranean European Countries. Eur. Countrys. 2017, 9, 577–593. [Google Scholar] [CrossRef] [Green Version]
  39. Regos, A.; Brotons, L.; Aquilué, N.; de Cáceres, M. Uso de Estrategias Oportunistas de Extinción para Reducir el Impacto de los Incendios en Condiciones Climáticas Extremas. In Proceedings of the 6th Spanish Forestry Congress, Vitoria, Spain, 10–14 June 2013. [Google Scholar]
  40. Farina, A. Principles and Methods in Landscape Ecology; Chapman & Hall: London, UK, 1998; 235p. [Google Scholar]
  41. Anderson, W.R.; Cruz, M.G.; Fernandes, P.M.; McCaw, L.; Vega, J.A.; Bradstock, R.A.; Fogarty, L.; Gould, J.; McCarthy, G.; Marsden-Smedley, J.B.; et al. A generic, empirical-based model for predicting rate of fire spread in shrublands. Int. J. Wildland Fire 2015, 24, 443–460. [Google Scholar] [CrossRef] [Green Version]
  42. Wyse, S.V.; Perry, G.L.; O’Connell, D.M.; Holland, P.S.; Wright, M.J.; Hosted, C.L.; Whitelock, S.L.; Geary, I.J.; Maurin, K.J.; Curran, T.J. A quantitative assessment of shoot flammability for 60 tree and shrub species supports rankings based on expert opinion. Int. J. Wildland Fire 2016, 25, 466–477. [Google Scholar] [CrossRef] [Green Version]
  43. Boubeta, M.; Lombardía, M.J.; Marey-Pérez, M.; Morales, D. Poisson mixed models for predicting number of fires. Int. J. Wildland Fire 2019, 28, 237–253. [Google Scholar] [CrossRef]
  44. Bergseng, E.; Vatn, A. Why protection of biodiversity creates conflict—Some evidence from the Nordic countries. J. For. Econ. 2009, 15, 147–165. [Google Scholar] [CrossRef]
  45. Khabarov, N.; Krasovskiy, A.; Obersteiner, M.; Swart, R.; Dosio, A.; San-Miguel-Ayanz, J.; Durrant, T.; Camia, A.; Migliavacca, M. Forest fires and adaptation options in Europe. Reg. Environ. Change 2014, 16, 21–30. [Google Scholar] [CrossRef] [Green Version]
  46. Krasovskii, A.; Khabarov, N.; Migliavacca, M.; Kraxner, F.; Obersteiner, M. Regional aspects of modelling burned areas in Europe. Int. J. Wildland Fire 2016, 25, 811–818. [Google Scholar] [CrossRef] [Green Version]
  47. Costafreda-Aumedes, S.; Vega-Garcia, C.; Comas, C. Improving fire season definition by optimized temporal modelling of daily human-caused ignitions. J. Environ. Manag. 2018, 217, 90–99. [Google Scholar] [CrossRef] [PubMed]
  48. Boubeta, M.; Lombardía, M.J.; González-Manteiga, W.; Marey-Pérez, M.F. Burned area prediction with semiparametric models. Int. J. Wildland Fire 2016, 25, 669–678. [Google Scholar] [CrossRef]
  49. Corona, P.; Ascoli, D.; Barbati, A.; Bovio, G.; Colangelo, G.; Elia, M.; Garfì, V.; Iovino, F.; Lafortezza, R.; Leone, V.; et al. Integrated forest management to prevent wildfires under Mediterranean environments. Ann. Silvic. Res. 2015, 39, 1–22. [Google Scholar] [CrossRef]
  50. Lafortezza, R.; Corry, R.C.; Sanesi, G.; Brown, R.D. Cultural determinants of spatial heterogeneity in forest landscapes. In Patterns and Processes in Forest Landscapes; Springer: Dordrecht, The Netherlands, 2008; pp. 17–32. [Google Scholar]
  51. Goldarag, Y.J.; Mohammadzadeh, A.; Ardakani, A.S. Fire Risk Assessment Using Neural Network and Logistic Regression. J. Indian Soc. Remote Sens. 2016, 44, 885–894. [Google Scholar] [CrossRef]
  52. Pérez, M.M.; Vicente, V.R.; Maseda, R.C. Using GIS to measure changes in the temporal and spatial dynamics of forestland: Experiences from north-west Spain. Forestry 2006, 79, 409–423. [Google Scholar] [CrossRef] [Green Version]
  53. Marey-Pérez, M.F.; Calvo-González, A.; Domínguez-Torres, G. Are the communal forest owners involved in the management of their lands?: A qualitative analysis for the case of Galicia (Spain). Bosque 2014, 35, 207–215. [Google Scholar] [CrossRef] [Green Version]
  54. Alvarez-Diaz, M.; González-Gómez, M.; Otero-Giraldez, M.S. Detecting the socioeconomic driving forces of the fire catastrophe in NW Spain. Forstwiss. Centralblatt 2015, 134, 1087–1094. [Google Scholar] [CrossRef]
  55. Anuario de Estadística Forestal 2019. Consellería do Medio Rural, Dirección Xeral de Planificación e Ordenación Forestal; Xunta de Galicia: Santiago de Compostela, Spain, 2019; 120p.
  56. Chas-Amil, M.; Prestemon, J.; McClean, C.; Touza, J. Human-ignited wildfire patterns and responses to policy shifts. Appl. Geogr. 2014, 56, 164–176. [Google Scholar] [CrossRef]
  57. MITERD. 2020. Available online: https://www.miteco.gob.es/es/biodiversidad/temas/espacios-protegidos/red-natura-2000/lic.aspx (accessed on 1 December 2021).
  58. Barreiro, J.B.; Hermosilla, T. Socio-geographic analysis of wildland fires: Causes of the 2006’s wildfires in Galicia (Spain). For. Syst. 2013, 22, 497–509. [Google Scholar]
  59. Barreal, J.; Jannes, G. Spatial and Temporal Wildfire Decomposition as a Tool for Assessment and Planning of an Efficient Forest Policy in Galicia (Spain). Forests 2020, 11, 811. [Google Scholar] [CrossRef]
  60. Vega, J.A.; Arellano-Pérez, S.; Fernández, C.; Fontúrbel, T.; Ruiz, A.D. Os incendios forestais do cambio global xa estan aquí. Un desafío e unha ocasión para lograr unha resposta social consensuada. In Unha Nova Xeración de Lunes? Actas do Coloquio Galaico-Portugúes Sobre Incendios Forestais; Diaz-FierrosViqueira, F., Ed.; Consello da Cultura Galega: Santiago de Compostela, Spain, 2021; pp. 49–119. [Google Scholar] [CrossRef]
  61. PLADIGA 2020. Plan de Prevención e Defensa contra os Incendios Forestais de Galicia; Consellería do Medio Rural, Xunta de Galicia: Santiago de Compostela, Spain, 2020; 260p. [Google Scholar]
  62. Elands, B.H.; O’Leary, T.N.; Boerwinkel, H.W.; Wiersum, K.F. Forests as a mirror of rural conditions; local views on the role of forests across Europe. For. Policy Econ. 2004, 6, 469–482. [Google Scholar] [CrossRef]
  63. Arenas-Ruiz, S.; Díaz-Balteiro, L.; Rodriguez-Soalleiro, R. Impacto de la fiscalidad en la rentabilidad de plantaciones forestales de particulares y montes vecinales en mano común en Galicia. Inf. Tec. Econ. Agrar. 2021, 117, 311–326. [Google Scholar] [CrossRef]
  64. Pagdee, A.; Kim, Y.-S.; Daugherty, P.J. What Makes Community Forest Management Successful: A Meta-Study From Community Forests Throughout the World. Soc. Nat. Resour. 2006, 19, 33–52. [Google Scholar] [CrossRef]
  65. Guadilla-Sáez, S.; Pardo-De-Santayana, M.; Reyes-García, V. Forest commons, traditional community ownership and ecological consequences: Insights from Spain. For. Policy Econ. 2020, 112, 102107. [Google Scholar] [CrossRef]
  66. Official Databases of Forest Fires; Ministry of Agriculture, Fisheries and Food, Government of Spain. Available online: https://www.miteco.gob.es/es/biodiversidad/estadisticas/Incendios_default.aspx (accessed on 1 December 2021).
  67. Fidalgo-González, L.; Arellano-Pérez, S.; Álvarez-González, J.G.; Castedo-Dorado, F.; Ruiz-González, A.D.; González-Ferreiro, E. Estimación de la distribución vertical de combustibles finos del dosel de copas en masas de Pinus sylvestris empleando datos LiDAR de baja densidad. Rev. Teledetec. 2019, 53, 1–16. [Google Scholar] [CrossRef]
  68. MAPA. Mapa Forestal de España, MFE25; Ministerio de Agricultura, Pesca y Alimentación, Gobierno de España: Madrid, Spain, 2009. [Google Scholar]
  69. MeteoGalicia. Consellería de Medio Ambiente, Territorio e Infraestructuras. Xunta de Galicia. Anuarios e Informes Climatolóxicos. Available online: https://cambioclimatico.xunta.gal/c/document_library/get_file?file_path=/portal-cambio-climatico/Documentos_xeral/Segundo-Informe.pdf (accessed on 14 July 2022).
  70. Rubio Hurtado, M.J.; Berlanga, V. Cómo aplicar las pruebas paramétricas bivariadas t de Student y ANOVA en SPSS. REIRE Rev. D’innov. Recer. Educ. 2012, 5, 83–100. [Google Scholar]
  71. Fuentes-Santos, I.; Marey-Pérez, M.F.; González-Manteiga, W. Forest fire spatial pattern analysis in Galicia (NW Spain). J. Environ. Manag. 2013, 128, 30–42. [Google Scholar] [CrossRef]
  72. Loepfe, L.; Martinez-Vilalta, J.; Oliveres, J.; Piñol, J.; Lloret, F. Feedbacks between fuel reduction and landscape homogenisation determine fire regimes in three Mediterranean areas. For. Ecol. Manag. 2010, 259, 2366–2374. [Google Scholar] [CrossRef]
  73. Foresta, M.; Carranza, M.L.; Garfì, V.; Di Febbraro, M.; Marchetti, M.; Loy, A. A systematic conservation planning approach to fire risk management in Natura 2000 sites. J. Environ. Manag. 2016, 181, 574–581. [Google Scholar] [CrossRef]
  74. Ficko, A.; Bončina, A. Public attitudes toward environmental protection in the most developed countries: The Environmental Concern Kuznets Curve theory. J. Environ. Manag. 2018, 231, 968–981. [Google Scholar] [CrossRef] [PubMed]
  75. Berg, A.E.V.D.; Koole, S.L. New wilderness in the Netherlands: An investigation of visual preferences for nature development landscapes. Landsc. Urban Plan. 2006, 78, 362–372. [Google Scholar] [CrossRef]
  76. Bhandari, D.; Jianhua, Z. Household Dependency on Buffer Zone Community Forest and its Implication for Management of Chitwan National Park, Nepal. Int. J. Sci. 2017, 3, 68–80. [Google Scholar] [CrossRef]
  77. Oldekop, J.A.; Holmes, G.; Harris, W.E.; Evans, K.L. A global assessment of the social and conservation outcomes of protected areas. Conserv. Biol. 2016, 30, 133–141. [Google Scholar] [CrossRef] [Green Version]
  78. European Commission. Establishing Conservation Measures for Natura 2000. Available online: https://ec.europa.eu/environment/nature/natura2000/management/docs/conservation%20measures.pdf (accessed on 1 December 2021).
  79. Kamal, S.; Grodzinska-Jurczak, M. Should conservation of biodiversity involve private land? AQ methodological study in Poland to assess stakeholders’ attitude. Biodivers. Conserv. 2014, 23, 2689–2704. [Google Scholar] [CrossRef] [Green Version]
  80. Schröter-Schlaack, C.; Ring, I.; Koellner, T.; Santos, R.; Antunes, P.; Clemente, P.; Mathevet, R.; Borie, M.; Grodzińska-Jurczak, M. Intergovernmental fiscal transfers to support local conservation action in Europe. Z. Wirtsch. 2014, 58, 98–114. [Google Scholar] [CrossRef]
  81. Commission Staff Working Document. Fitness Check of the Birds and Habitats Directives. 2016. Available online: https://ec.europa.eu/environment/nature/legislation/fitness_check/ (accessed on 15 December 2021).
  82. Kati, V.; Hovardas, T.; Dieterich, M.; Ibisch, P.L.; Mihok, B.; Selva, N. The challenge of implementing the European network of protected areas Natura 2000. Conserv. Biol. 2014, 29, 260–270. [Google Scholar] [CrossRef] [Green Version]
  83. Moreira, F.; Viedma, O.; Arianoutsou, M.; Curt, T.; Koutsias, N.; Rigolot, E.; Barbati, A.; Corona, P.; Vaz, P.; Xanthopoulos, G.; et al. Landscape—Wildfire interactions in southern Europe: Implications for landscape management. J. Environ. Manag. 2011, 92, 2389–2402. [Google Scholar] [CrossRef] [Green Version]
  84. Marey Pérez, M.F. Sostenibilidade dos Espazos Protexidos; Fundación Jacinto Calvo: Lugo, Spain, 2018. [Google Scholar]
Figure 1. Location map with the distribution of the MVMCs (neighbouring forests in common ownership) and SACs (special conservation areas) in Galicia.
Forests 13 01161 g001
Figure 2. The distribution of the MVMCs and SACs in Galicia.
Forests 13 01161 g002
Figure 3. The distribution of the climatological stations used in the study and the historical evolution of temperature and precipitation during the study period. The temperatures used were mean minimum temperature (ta_min), mean maximum temperature (ta_max) and mean temperature (ta_av). The annual precipitation (P) was measured in mm. The historical evolution of the number of human-induced fires was superimposed on the climate charts.
Forests 13 01161 g003
Figure 4. Overview of the methodological process. The superposition of several layers of information (forest fires, MVMC and SAC) allowed us to determine whether there were differences in the occurrence of forest fires in each of the different territorial units analysed.
Forests 13 01161 g004
Figure 5. Official mapping of SACs and MVMCs (2021), showing the distribution of Galician MVMCs where human-induced forest fires occurred during the period under review compared to the distribution of SACs. Both layers intersect to create the territorial units MVMC-SAC and MVMC no SAC. The coordinate reference system used in the production of the maps was ETRS89/UTM Zone 29N.
Forests 13 01161 g005
Figure 6. Cartography of intersections. Occurrence of forest fires in MVMC ꓵ SAC intersection zones and in MVMCs outside SACs. By intersecting the SAC (grey colour), forest fires (yellow colour) and MVMC (brown colour) layers, we obtained the territorial units in which the different occurrences of forest fires were subsequently analysed. The ochre colour shows the areas included in the territorial unit MVMC no SAC. The coordinate reference system used in the production of the maps was ETRS89/ UTM Zone 29N.
Forests 13 01161 g006
Figure 7. The image shows the intersection of the MVMC-SAC (with a squared pattern) and MVMC no SAC with the Spanish forest map (MFE), allowing for the evaluation of existing fuel models in each of them as well as any differences.
Forests 13 01161 g007
Figure 8. Fuel models in MVMC no SAC and in MVMC-SAC. The most frequent fuel model in both territorial units was scrubland, with very similar percentages in both cases. The remaining fuel models were very poorly represented in MVMC-SAC and MVMC no SAC.
Forests 13 01161 g008
Figure 9. Percentage of human-caused fires in the territorial units of study for the period 1999–2014. Human-caused forest fires are those where the cause is coded as unknown, negligence or arson.
Forests 13 01161 g009
Figure 10. Percentage of human-caused forest fires in the territorial units of study for the period 1999–2014. Shown are the mean value of human-caused fires before (blue colour) and after 2004 (ochre colour), and the percentage reduction that occurred after 2004. As can be seen, the highest percentage of human-caused forest fires after 2004 was found in the SACs, as well as the lowest percentage reduction.
Forests 13 01161 g010
Figure 11. Historical evolution (1999–2014) of the fire rate in each territorial group analysed. After 2004, the rate of forest fires for the different territorial groups analysed tended to converge.
Forests 13 01161 g011
Figure 12. Fire rate (yellow and grey dots) and area burned by fire in each territorial study unit before and after 2004. Fire rates (periods 1999–2004, and 2005–2014) are also included. The area burnt was higher after 2004 in all the territorial units analysed, while fire rates were lower for the same period.
Forests 13 01161 g012
Figure 13. The area burnt per fire (AB/fire) and the rate of fires per 100 ha in the SACs (orange dots) during the study period. The decrease in the fire rate is similar to that observed in Galicia. A notable increase in the area burnt per fire is observable.
Forests 13 01161 g013
Figure 14. The area burnt per fire (AB/fire) and the rate of fires per 100 ha (orange dots) in the MVMC-SAC during the study period. The decrease in the fire rate is similar to that observed in Galicia. Except for a very remarkable increase in 2010, no major differences were seen in the area burned by fire.
Forests 13 01161 g014
Figure 15. The area burnt per fire (AB/fire) and the rate of fires per 100 ha (orange and yellow dots) in MVMC-SAC and MVMC no SAC during the study period. The rate of fires per 100 hectares in both territorial units was similar after 2005.
Forests 13 01161 g015
Table 1. Official databases used in the study.
TypeSourceFormatFields
MVMCCMRShapeIdentification number, name, area, date of classification, municipality, forest district, province, type of management (public or private). Year 2019.
SACMITERDShapeIdentification code, name and surface. Year 2019.
FiresMAPAShapeIdentification code, location data (province, municipality, leaf, grid, spindle, UTM coordinates), cause, total affected area and affected area according to type of property and vegetation plot, date of detection. Period 1999–2014.
MFEMITECOShapeA number of fields describing the ecology and structure of the masses, including the dominant species or fuel model.
Table 2. For each territorial unit studied, table shows the number of human-caused forest fires and the rate of forest fires (fires/100 ha). The differences between the periods studied are shown in two ways: through a quotient of the averages (<2004/≥2005) and through the percentage reduction observed in the forest fire rates (fires/100 ha).
YearHuman-Caused Forest Fires and Fires/100 ha
GaliciaMVMCSACMVMC-SACMVMC no SAC
FiresF/100 haFiresF/100 haFiresF/100 haFiresF/100 haFiresF/100 ha
<2004 TOTAL56,5593.1417,2082.6657871.5423021.4114,9063.08
≥2005 TOTAL39,9092.2292681.4338881.0414470.8978211.61
Av < 2004 (1)9426.50.5228680.44964.50.26383.670.242484.330.51
Av ≥ 2005 (2)3990.90.22926.80.14388.80.10144.70.09782.10.16
½2.363.092.482.653.18
% Reduction57.6667.6859.6962.2868.52
Table 3. Area burned by forest fire (AB/fires, ha) and percentage of the area burned over the total area (%/ST) in the territorial units of study, period 1999–2014. As in the previous tables, the percentage reduction is shown.
YearGaliciaMVMC TOTALSACMVMC SACMVMC NO SAC
AB/Fire% s STAB/Fire% s STAB/Fire% s STAB/Fire% s STAB/Fire% s ST
Av < 042.421.323.121.423.620.973.970.952.891.52
Av ≥ 055.051.3410.421.5912.041.086.640.668.201.62
% Red−108.76−1.40−233.36−11.50−232.68−11.50−67.3630.96−183.79−6.46
Table 4. Significant differences in the rate of forest fires and in the area burned by fire (BA/wildfire) in SACs, before and after 2004.
SAC before and after 2004
Fire RateAB/Fire
1999/042005/141999/042005/14
Average0.2570.10363.6212.04
Variance0.00180.0051.82471.5
Remarks610610
Grouped variance0.0039 46.61
Degrees of freedom14 14
Statistic t4.7701 −3.0842
P(T≤t) two tails0.0003 0.0115
Critical value of t (two queues)2.1447 2.2281
ConclusionThere are significant differencesThere are significant differences
Table 5. Significant differences in the rate of forest fires and in the area burned by fire (BA/wildfire) in MVMC with SAC, before and after 2004.
MVMC–SAC before and after 2004
Fire RateAB/Fire
1999/042005/141999/042005/14
Average0.2350.0883.966.64
Variance0.0020.0041.6323.92
Remarks610610
Grouped variance0.0036 15.9616
Degrees of freedom14 14
Statistic t4.6952 −1.6372
P(T≤t) two tails0.0003 0.1298
Critical value of t (two queues)2.1447 2.2009
ConclusionThere are significant differencesNo significant differences
Table 6. Significant differences in the rate of forest fires and in the area burned by fire (BA/wildfire) in MVMC-SAC and MVMC no SAC after 2004.
MVMC-SAC and MVMC no SAC (AB/Fire)
Fire RateAB/Fires
MVMC_SACMVMC no SACMVMC_SACMVMC no SAC
Average0.0890.1616.648.19
Variance0.0040.02923.9247.1
Remarks10101010
Grouped variance0.0166 35.5121
Degrees of freedom18 18
Statistic t−1.2621 −0.5841
P(T≤t) two tails0.2309 0.5663
Critical value of t (two queues)2.1788 2.1009
ConclusionNo significant differencesNo significant differences
Table 7. The results obtained in the statistical analysis for each of the questions posed.
IssuesFire Rate
(Wildfire/100 ha)
AB/Fire
1. Is there a significant difference in the number of fires and/or the area burnt/fire before and after 2004 in the SACs?YesYes
2. In the MVMC-SACs, is there a significant difference in the number of fires and/or in the area burnt/fire before and after 2004?YesNo
3. Was there a significant difference in the fire regimes of MVMC-SAC and MVMC no SAC after 2004?NoNo
Publisher’s Note: MDPI stays neutral with regard to jurisdictional claims in published maps and institutional affiliations.

