Article

Prediction of Wildfire Fuel Load for Pinus densiflora Stands in South Korea Based on the Forest-Growth Model

1
Forest Fire and Landslide Division, National Institute of Forest Science, 57 Hoegi-ro, Dongdaemun-gu, Seoul 02455, Korea
2
Department of Forest Science, Kongju National University, 54 Daehak-ro, Yesan 32439, Korea
*
Author to whom correspondence should be addressed.
Submission received: 11 July 2022 / Revised: 24 August 2022 / Accepted: 25 August 2022 / Published: 28 August 2022

Abstract

:
A prediction model was developed for the wildfire fuel load of Korean red pine (Pinus densiflora) stands with susceptibility to forest fire based on the forest-growth model. Furthermore, a time-series analysis was performed on the variation in forest-fire fuel load according to forest management. National Forest Inventory stand data of 1434 plots for P. densiflora stands were used, and the final forest-fire fuel load prediction model was developed using the Weibull function and mortality model. The fit index of the diameter distribution model ranged from 0.58 (0th percentile) to 0.96 (50th percentile), and that of the mortality model was 0.68. The prediction of the stand growth variation after 20 years based on the growth data of managed and unmanaged stands indicated a mean stand density of 1518 trees per ha for unmanaged stands, and 885 trees per ha for managed stands. Regarding the variation in the available canopy fuel load distribution, the predicted annual increase was approximately 0.7 ton/ha for unmanaged stands and approximately 0.5 ton/ha for managed stands. These findings will contribute to setting fuel management criteria to prevent forest fire spread while providing the quantitative data of the characteristics of stand growth variation and the predicted wildfire fuel load.

1. Introduction

High temperatures and dryness caused by greenhouse gas emissions foster environmental conditions that facilitate the incidence of mega wildfires, and the greenhouse gases generated by forest fires in turn facilitate climate change to display a self-amplifying phenomenon [1]. The rate of this phenomenon has recently increased further. During 2019–2020, as of 9 March 2020, bushfires in Australia had burnt a total area of 18.6 million hectares, destroyed over 5900 buildings, and killed at least 64 people [2,3]. Other notable occurrences of wildfires include the southeastern Australia wildfire in 2019, which was extinguished in 2020, and wildfires in California (U.S.; June 2020), Greece (August 2021), and Portugal (2017 and 2022). South Korea has also experienced increased occurrences of bushfires. The frequency of occurrence of large-scale forest fires in South Korea has increased from once per 2–3 years to every year since 2017, with a consequent increase in socioeconomic damages [4].
Among the various factors driving large-scale forest fires, topography and climate are the key determinants of forest-fire behavior and are natural conditions that cannot be controlled by human efforts [5,6]. Fuel is another key factor in forest-fire management as it can be controlled through treatments such as thinning and pruning during forest management. Typical forest fuel management projects include prescribed fire and forest management.
Major countries around the world are shifting from wildfire management policies centered on wildfire evolution to wildfire risk-reduction management, which includes preventive wildfire management policies [7]. The U.S. Forest Service has recently developed the Forest Fuel Management: Ten-Year Strategy to protect regional communities from forest fires and improve the restoration capacity of forests. The investment costs 2.42 billion USD each year for continuous forest management [8]. The Rural Fire Service in New South Wales in Australia has also made efforts for active fuel management and the advancement of relevant techniques [9].
Similarly, in South Korea, wildfire fuel management is carried out through forest thinning rather than methods that affect weather conditions. Approximately 8000 ha of forest area has been selected each year since 2021 for the implementation of methods that develop fire-resistant forests. The forest-tending project for the prevention of forest fires differs from tending projects for timber production in that the characteristics of forest-fire behavior are the dominant factor considered. Suitable criteria and target sites for thinning and pruning should be determined through comprehensive reflection of the frequency of forest fires and the risk of facility damage. Although systematic criteria exist for timber production, such as the criteria of residual tree density per mean tree diameter in the forest [10,11], the management of forest-fire fuels lacks proper regulations and criteria owing to the severe lack of related studies.
In the U.S., forest stand growth and yield are analyzed using the forest vegetation simulator, and forest-fire behavior is quantitatively evaluated according to the forest tree distribution using the fire and fuels extension (FFE) system [12]. In Australia, the burnt area and the volume of removed trees are quantitatively analyzed using the Parks and Wildlife Service, and Sustainable Timber Tasmania for a simultaneous effect on timber production and fuel reduction in the target forest [13]. In South Korea, studies have reported on the estimated level of combustible fuels in the forest according to tree type and component [14,15,16]. However, the methods applied in these studies were static, i.e., only current stands were analyzed regarding the fuel load to limit the time-series variation prediction in a forest structure. To select forests that are susceptible to wildfire and determine the accurate timing of fuel management, a method to predict the future forest-fire fuel load based on the current estimated forest-fire fuel load is required.
In the field of forestry, efforts have been made to establish a system to predict future forest structure and growth using the forest-growth model. Notably, the dynamic stand growth model is mainly used to predict the growth of various stands according to individual characteristics [17]. One such model is the Weibull-function-based diameter distribution model that can predict the tree density per diameter according to the stand characteristics. As the diameter at breast height (DBH) and tree density are critical factors in the estimation of combustible materials in a forest fire, the diameter distribution model is likely to be an important means of accurately predicting the variation in forest-fire fuel load.
The purpose of this study was to develop a model to predict the variation in wildfire fuel load over time using a diameter distribution model incorporating tree mortality rate. Furthermore, the prediction model for forest-fire fuel load was used to comparatively analyze time-series variation in forest fuel load according to forest management. Based on these results, the impact of forest management on wildfire behavior was indirectly assessed. Currently, the amount of wildfire fuel defines only the amount of fuel in the upper part of a tree (crown fuel load).

2. Materials and Methods

2.1. A Review of Research Trends

Factors that affect the spread of wildfires are weather, topography, and fuel. Although fuel provides the material to burn when a wildfire spreads, it is considered an important environmental factor for wildfire prevention because it is the only artificially manageable element [18,19]. Overseas, to identify the cause and risk of the spread of wildfires, numerous datasets have been constructed through various studies [20]. In particular, in the case of the United States and Canada, the fuel characteristics of canopy layers of eight major coniferous species were analyzed, and these are used to develop a system to prevent the spread of wildfire. Data on the fuel characteristics of the canopy layer of various coniferous species were converted into a database, which was used for fuel model development [21,22]. To understand the time-series of fuel changes of the forest, Scott et al. developed a model using satellite imagery data on the canopy and breast height section and data from field surveys as variables [23]. Thomas et al. constructed a biophysical model in which a canopy fuel and vegetation index obtained from satellite image data was used as the main variable [24] to estimate the quantity of forest fuel. However, this method simply determines the static fuel change for the current stand. To efficiently perform fuel management to prevent the spread of forest fires, characteristics of the canopy fuel should be identified and its spatiotemporal changes should be predicted. Therefore, a methodology that uses the forest-growth model incorporating forest growth dynamics and accurately predicts changes in the quantity of fuel available for forest fires is needed.

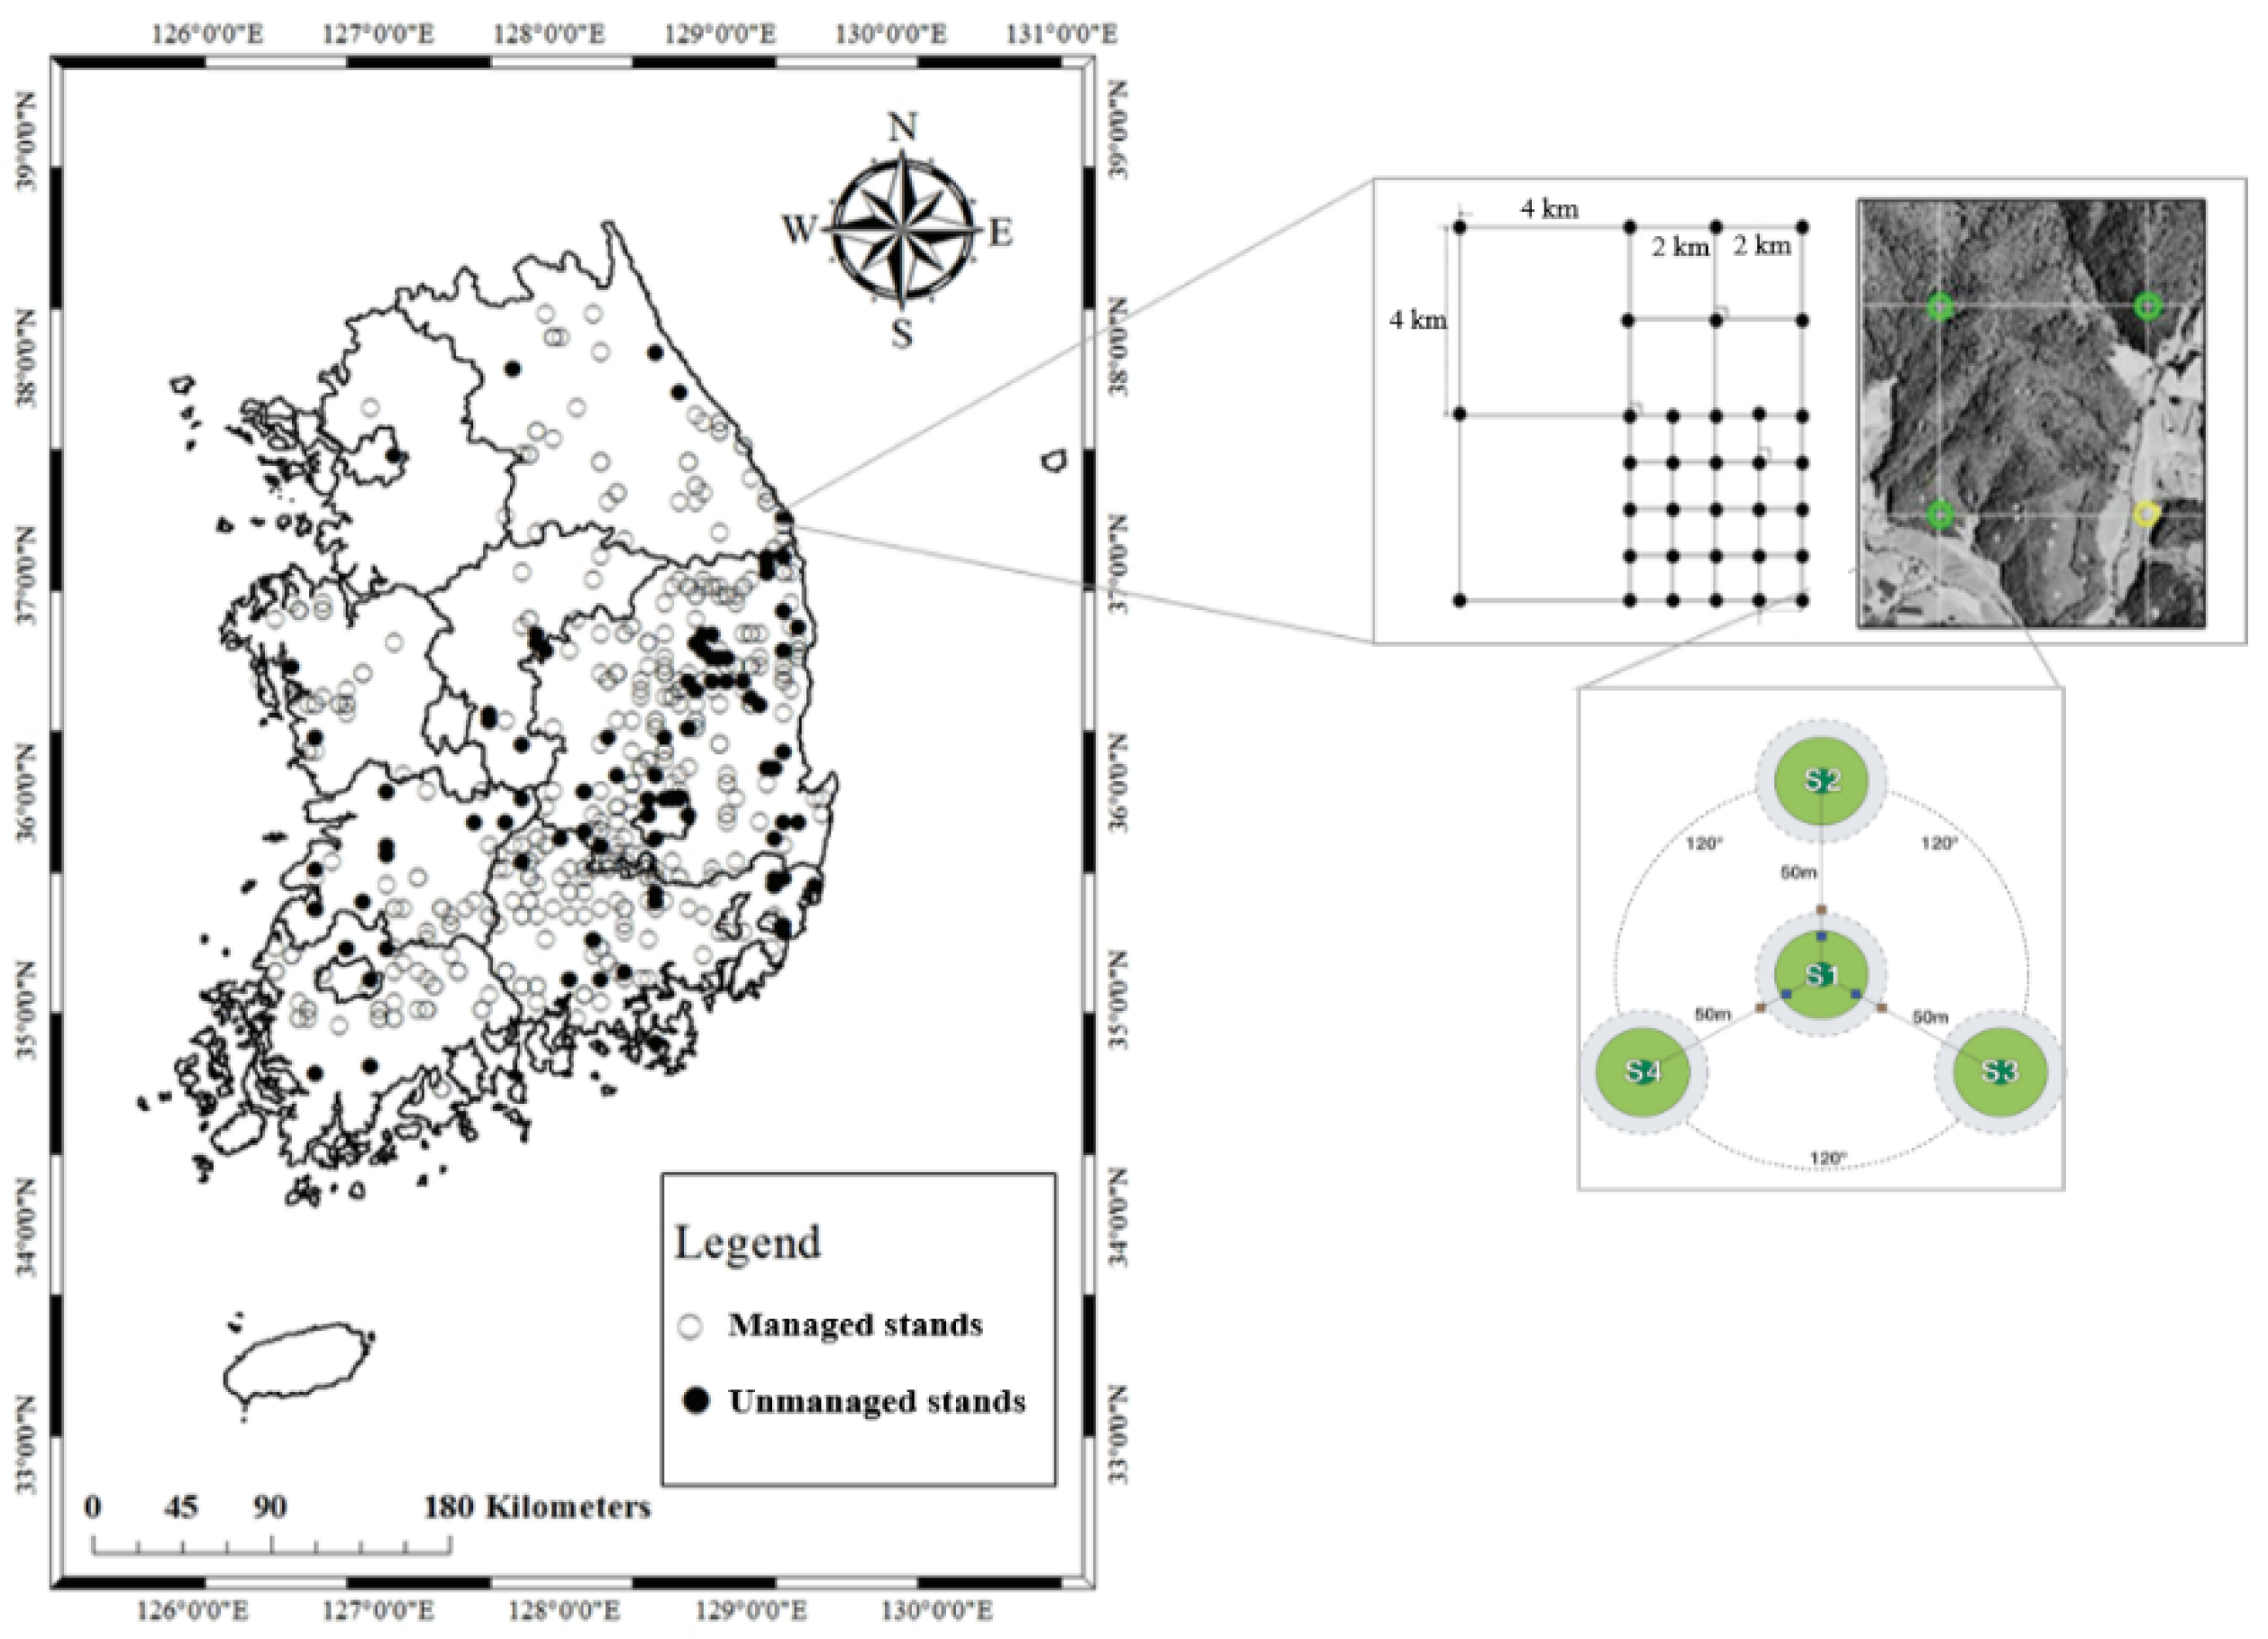
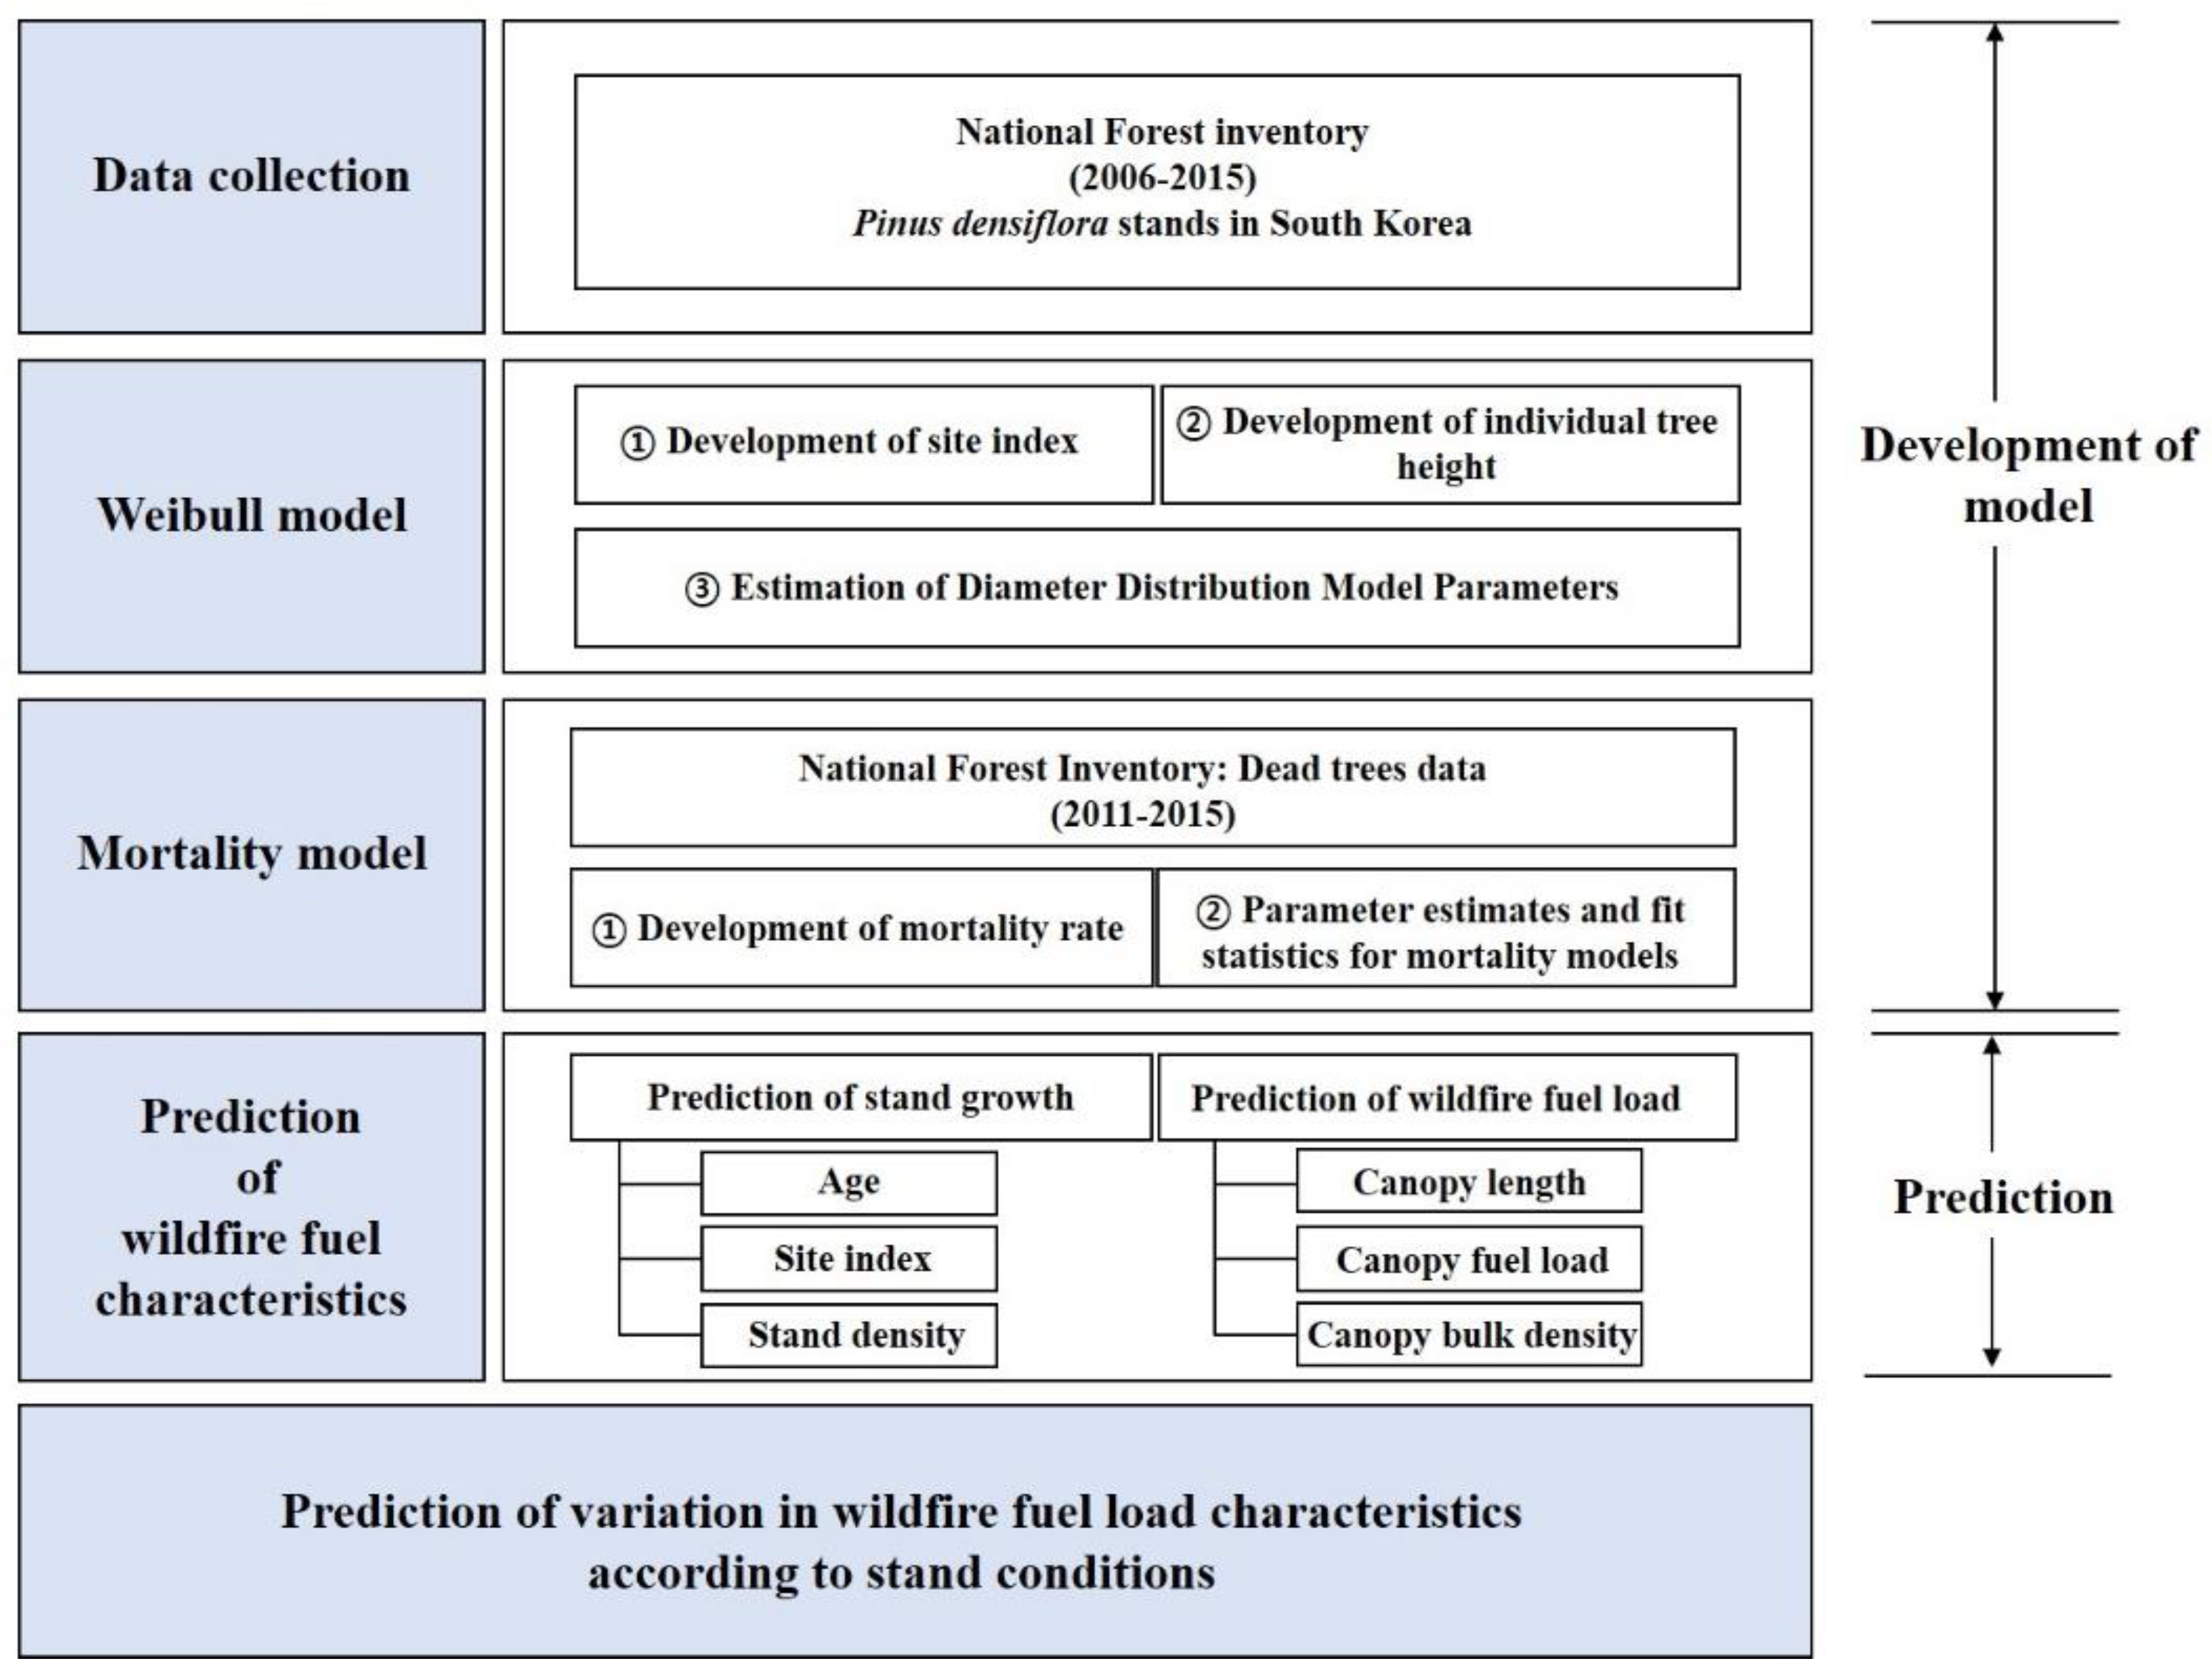
2.2. Data Collection

The National Forest Inventory has been collecting forest data as a national statistics project, through surveys performed every 5 years by the Korea Forest Service, since 1972 [25]. Through systematic cluster sampling, National Forest Inventory data comprise the permanent plots aligned in 4km × 4km intervals with four subplots in three directions at 0°, 120°, and 240° [26]. Among the permanent plots constructed in the past decade (2006–2015), the data for 1434 plots in pure forests in which Pinus densiflora stands accounted for ≥75% were extracted for use in the development of the model (Figure 1).
Among the tree mortality data of the National Forest Inventory, the data of 53 plots for the P. densiflora mortality survey (2011–2015) were used in the analysis (Table 1). The mortality rate (dependent variable) was calculated by dividing the total volume per ha of dead trees in the past five years (B) by the total volume of trees (A) in identical plots [27].

2.3. Development of the Wildfire Fuel Load Prediction Model

For the diameter distribution model, the Weibull function was applied to estimate the density of trees per diameter. In the parameter estimation for the diameter distribution model, forest data containing the site index of the target stand is essential. Thus, a site index equation was formed for the P. densiflora stands of 30 years of age using the Chapman-Richards (C-R) growth model that allows for the analysis of the correlation between index age and dominant tree height. To incorporate the mortality rate in the predicted tree density, the logistic equation developed by Hamilton [28] was used to predict the final tree density per diameter. This was applied to the canopy fuel estimation equation for P. densiflora in South Korea [15] to finalize the forest-fire fuel load prediction model. A schematic process flow of the study is presented in Figure 2.

2.3.1. Estimation of Tree Height Growth and Site Index

The C-R growth model was used to predict tree height. In this model, two sigmoid curves show the general index age and tree height growth patterns [29,30]. Converting the tree height curve according to standard index age through the anamorphic method, the tree height curve can be derived per index site. The C-R model was based on the anamorphic site index estimation equation (Equation (2)), which aided the estimation of the site index (Table 2).
Height = b 0 ( 1 exp ( b 1 Age ) ) b 2
Site   index = Height   1 exp ( b 1 Index   age ) 1 exp ( b 1 Age )
Note: age is the mean age of surveyed forest stands (years); height is the mean tree height of surveyed forest stands (m); index age is the growing conditions age of surveyed forest stands (years).
The tree height growth model (Equation (3)) was used to estimate the individual tree height per tree diameter and the branching height.
Indivldual   tree   height = 1.2 + b 0 ( 1 exp b 1 DBH ) b 2
Note: DBH is the diameter at breast height (cm).

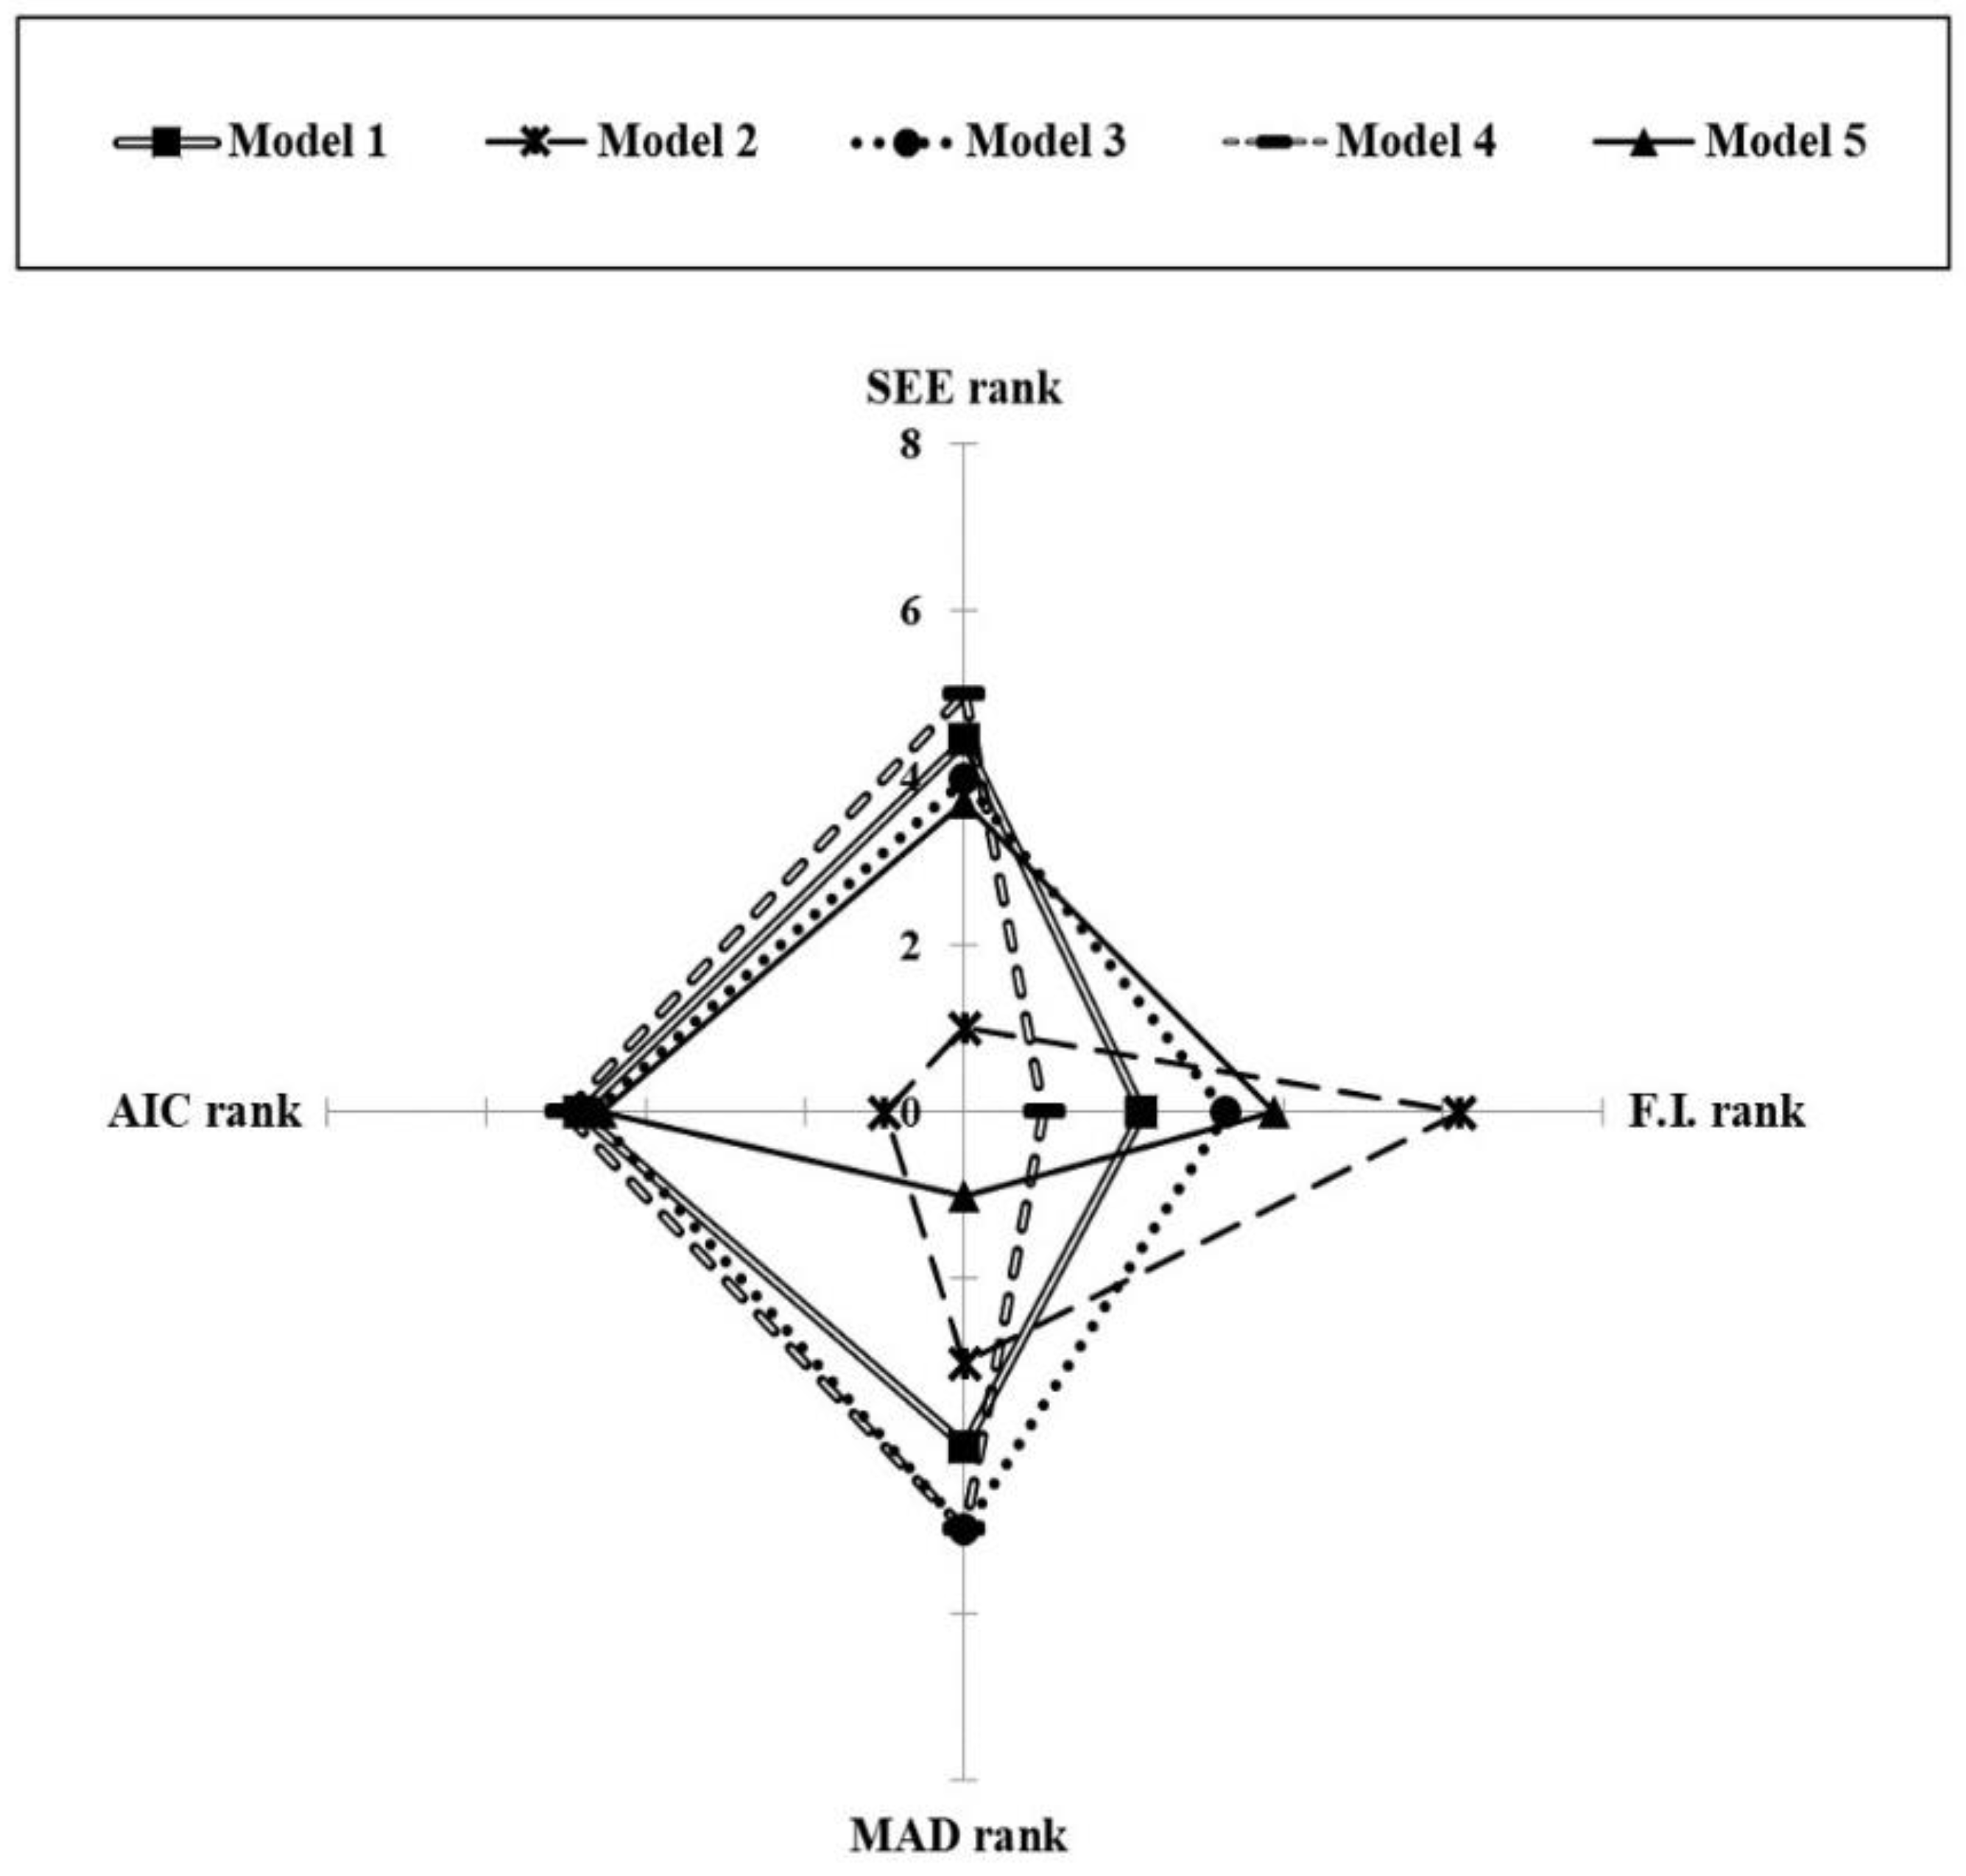
2.3.2. Estimation of Diameter Distribution Model Parameters

The diameter distribution model used in this study applied the Weibull function (Equation (4)). For the parameter estimation, the percentile-based parameter recovery method suggested by [31] was used to list the minimum diameter (D0), the 25th percentile of the diameter (D25), the 50th percentile of the diameter (D50), and the 95th percentile of the diameter (D95) for tree diameters in the target stand. The regression equation (Equation (5)) was used to point out a specific percentile. In the percentile-based estimation equation, the most important independent variable is the quadratic mean diameter Dq, which was estimated using Equation (6). To use the parameter recovery method based on percentile, the parameter recovery equations (Equations (7)–(9)) were used.
F ( x ) = 1 exp [ ( x a b ) c ] .
Note: a is the location parameter; b is the scale parameter; c is the shape parameter; and x ≥ a > 0, b > 0, and c > 0.
D i = f ( D q , Age )
Note: Dq is the quadratic mean diameter (cm), and i = 0 ,   25 ,   50 ,   and   95 th   percentiles .
D q = exp [ d 0 + d 1 ( 1 H d ) + d 2 ln ( Age ) + d 3 ln ( Age × TPH ) ]
Note: TPH is the number of trees per ha.
a = n 1 / 3 ( D 0 D 50 ) n 1 / 3 1 ,   if   a < 0 ,   then   a = 0
c = In [ In ( 1 0.95 ) In ( 1 0.25 ) ] In [ D 95 a D 25 a ]
b = a γ 1 γ 2 + a γ 2 γ 1 2 γ 2 + Dq 2 γ 2
Note: γ 1 = γ [ 1 + 1 c ] , γ 2 = γ [ 1 + 2 c ] .

2.3.3. Development of Mortality Model

To optimize the mortality model, the model ranking method based on statistical analyses as suggested by [32] was used (Equation (10)). This method differs from those of traditional standard or ordinal ranks in that it shows the magnitude of difference between models, not just the rank order. In this study, five volume models with the lowest value were selected for model validation and final model fitting (Table 3).
R i = 1 + [ ( m 1 ) ( S i S min ) S max S min ]
Note: R i is the relative rank of model i (I = 1, 2,…m); S i is the goodness-of-fit statistics produced by model i ; S min is the minimum value of the good-of-fit statistics; and S max is the maximum value of the goodness-of-fit statistics.

2.4. Prediction of Wildfire Fuel Characteristics

The available canopy fuel load was estimated using the logarithmic regression (Equation (11)) suggested by [15] for P. densiflora, with the following inputs: β 0 : −2.380 and β 1 : 1.637. The term ‘canopy’ in regard to wildfires generally refers to the canopy of tree stands or the crown of individual trees [33]. In the present study, the canopy length and canopy volume per ha suggested by Cruz et al. [33] was used to estimate the stand-specific available canopy bulk density (Equations (12)–(14)).
ln Wt = β 0 + β 1 l n D
Note: Wt is the available crown fuel weight (kg), β i ( i = 0 , 1 ) is the estimated parameter, and D is the diameter at breast height (cm).
CL = i = 1 n ( CL ( i ) × TEF i ) i = 1 n TEF i
CAV = i = 1 n ( CL ( i ) × TEF i ) i = 1 n TEF i × 10 , 000
Note: CAV is the canopy volume (m3), CL i is the canopy length (m) of the i th individual tree, and TEF i is the tree expansion factor corrected to a per ha basis for the i th tree.
Available   canopy   bulk   density = i = 1 n ( ACFL i × TEF i ) CAV
Note: ACFL i is the available crown fuel load (kg) of the i th individual tree.

2.5. Data Collection for Target Stands

Data on stand growth characteristics per stand are required for the prediction of variation in forest fire fuel according to forest management. Hence, data from the National Forest Inventory were categorized into a group of stands with the forest management aiming mainly at timber production as defined by the Korea Forest Service [34], and a group of stands with management restricted by the forest reserve and forest protection regulations. As a result, the data of 1085 plots for managed stands and 349 plots for unmanaged stands were collected (Table 4). Based on the data collected for the stand growth characteristics, the time-dependent tree density per diameter was estimated. Based on this, the forest-fire fuel load predicted according to forest management was comparatively analyzed.

3. Results

3.1. Parameter Estimation per Stand for Diameter Distribution and Mortality Models

As shown in Table 2, the accuracy of the defined parameters of the Weibull function and site index of P. densiflora stands was evaluated based on the fit index (F.I.) and the coefficient of variation. First, the F.I. of the C–R growth model for the P. densiflora stands was 0.97 and the F.I. of the parameters of the Weibull function ranged from 0.58 (D0) to 0.96 (D50), which were in line with the parameter F.I range of 0.51–0.98 for the model of main coniferous trees in South Korea [35,36,37]. To select the optimum mortality model, the model ranking was performed from the smallest absolute statistical value and irrespective of the variables in each model. The mortality model of the highest rank was Model 2, with DBH, site index, and stand density as independent variables (Table 5). In the selection of the optimum model with the smallest mean area using the model ranking suggested by [38], the highest accuracy was shown by Model 2 (2.8) compared to Model 5 (3.3), Model 1 (3.9), Model 4 (4.0), and Model 3 (4.2). Hence, Model 2 was selected as the final mortality model (Figure 3).

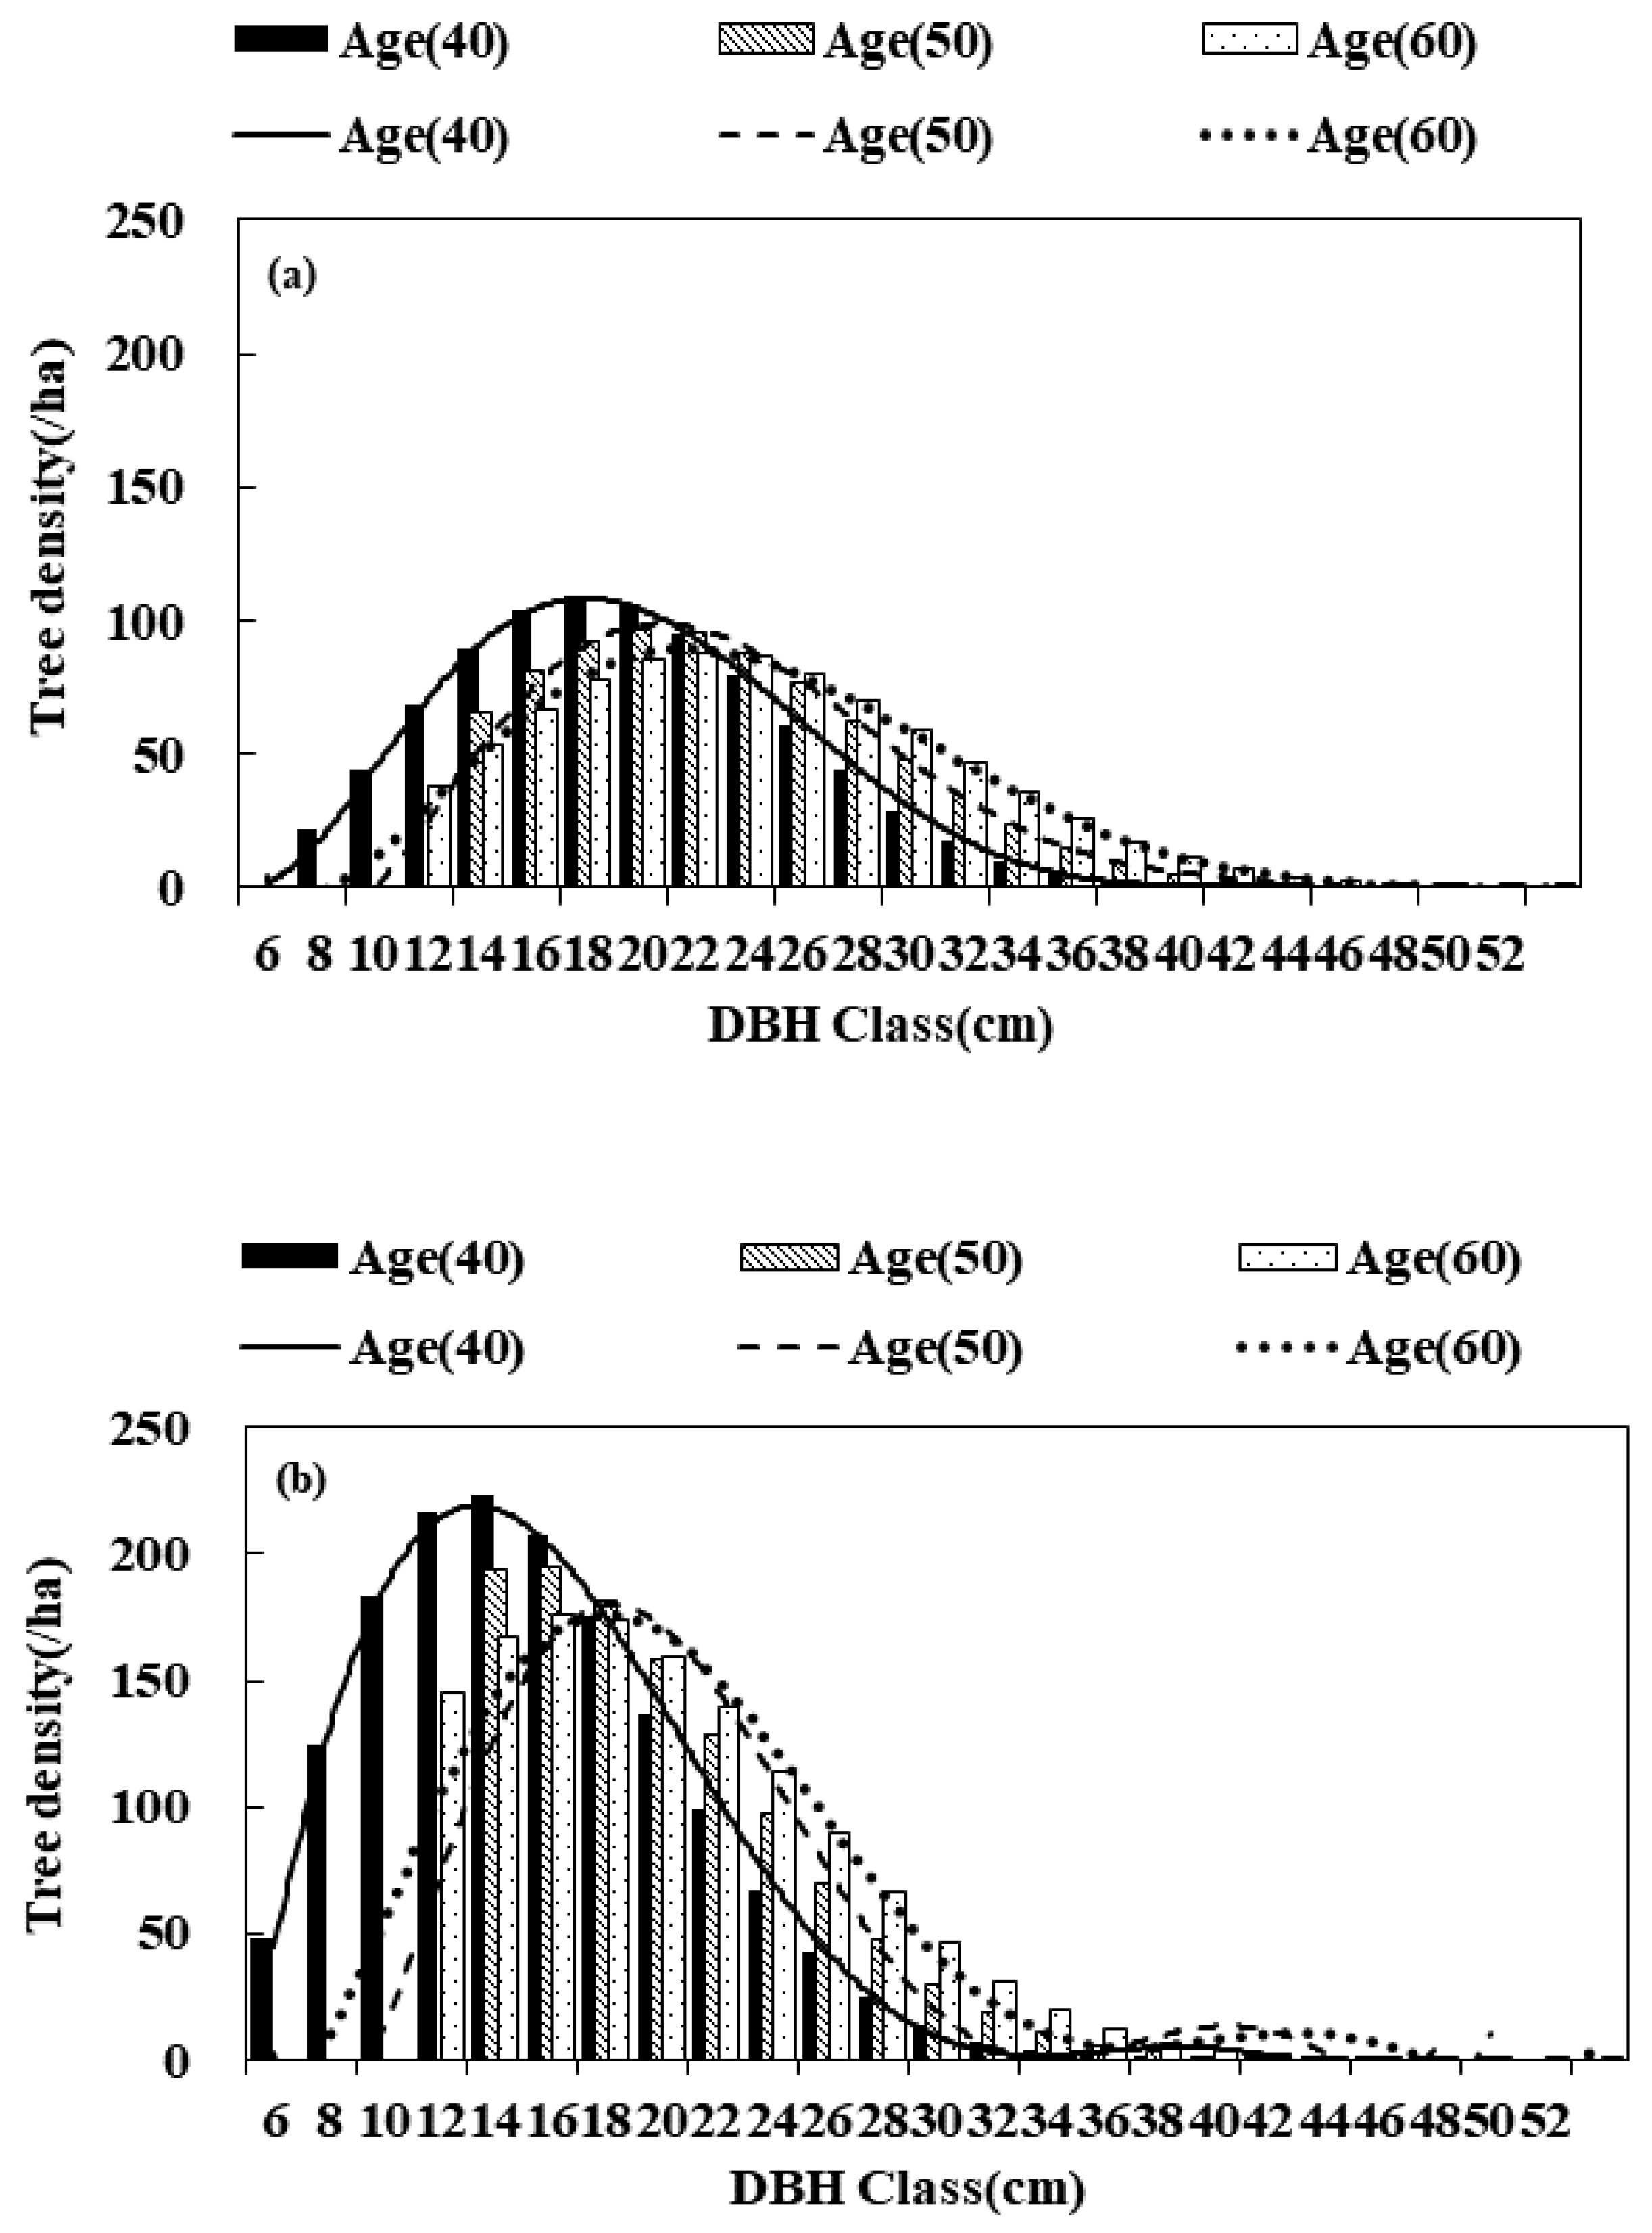
3.2. Prediction of Variation in Stand Growth According to Stand Conditions

The predicted stand growth for managed and unmanaged P. densiflora stands is as follows (Figure 4).
In contrast to the prediction of a decrease over time from 1.0% to 0.4% after 20 years at 40 years of age for the mortality of managed stands, the mortality of unmanaged stands was predicted to increase from 1.7% to 4.7% after 20 years at 40 years of age. The result was attributed to the closed canopy in unmanaged stands leading to excessive competition and a consequent increase in mortality. Compared to live trees, dead trees catch fire more easily and are burnt completely down to the core with greater susceptibility to wildfire. An increase in the number of dead trees in unmanaged stands can thus lead to a larger forest fire than in managed stands. Meanwhile, previous studies reported the mean mortality rate to be 0.5–4.2% for coniferous trees, which was consistent with the result in the present study [39,40,41,42]. The predicted growth of managed stands indicated that the mean stand density was 885.3 trees per ha, suggesting a time-dependent increase in DBH reflecting the maximum tree density (40 years: 18 cm → 50 years: 20 cm → 60 years: 24 cm). For unmanaged stands, the mean stand density was 1518.8 trees per ha, showing an increase in mean tree diameter reflecting the maximum tree density (40 years: 14 cm → 50 years: 16 cm → 60 years: 18 cm), with a relatively low growth rate compared to that of managed stands. The results of this study are consistent with those of previous studies reporting a decrease in mutual competition among forest trees in line with reduced stand density via forest management activities [43,44] and a positive impact on DBH by an increase in light, nutrient, or water availability [45,46,47].

3.3. Prediction of Variation in Wildfire Fuel Load Characteristics According to Stand Conditions

The result of the predicted time-dependent wildfire fuel characteristics using the forest wildfire fuel load prediction model for managed and unmanaged stands is presented in Table 6.
The available canopy fuel load of managed stands was predicted to show an annual increase of approximately 0.5 ton/ha, from 20.0 ton/ha at 40 years to 29.2 ton/ha at 50 years to 32.8 ton/ha at 60 years, whereas unmanaged stands showed a predicted annual increase of approximately 0.7 ton/ha, from 30.0 ton/ha at 40 years to 41.2 ton/ha at 50 years to 50.1 ton/ha at 60 years. The available canopy bulk density of managed stands was predicted to be 0.157 kg/m3 at 40 years of age, 0.192 kg/m3 at 50 years, and 0.221 kg/m3 at 60 years, with a lower trend of increase than that of unmanaged stands with the prediction of 0.181 at kg/m3 at 40 years, 0.229 kg/m3 at 50 years, and 0.280 kg/m3 at 60 years. A low-canopy bulk density indicates a low heat energy consumption per volume upon forest fire, as the area of distribution of combustible fuel is high [48,49]. Hence, compared to unmanaged stands, the larger spatial distribution of fuels in managed stands could reduce the rates of heat radiation and conductivity. In addition, regarding forest structure, managed stands showed a gradual increase in the proportion of large-diameter trees over time (40 years: 20% → 50 years: 38% → 60 years: 41%), whereas unmanaged stands were maintained as a highly dense forest with a concentrated population of medium-diameter trees (40 years: 76% → 50 years: 74% → 60 years: 74%). Total biomass increases with the facilitated DBH growth via forest management [50]. However, the conversion of trees towards large-diameter trees drives the canopy to increase the proportion of thick branches that are less susceptible to forest fire. As the proportion of easily combustible materials (i.e., leaves and branches <1 cm) decreases, wildfire risk is reduced [10]. In addition, the increased space between trees as a result of forest management activities could lower the relative risk of crown fire spread across trees. In overseas criteria, the minimum threshold is suggested to be 0.067 kg/m3 by [51] and 0.100 kg/m3 by [52]. By applying the criteria to P. densiflora stands in South Korea, the risk is up to 3.4-fold higher in managed stands and up to 4.3-fold higher in unmanaged stands. Thus, currently, the forests in South Korea are highly susceptible to forest fire, and it is necessary to provide appropriate fuel management in consideration of these findings.

4. Discussion

This study was conducted to develop a wildfire fuel load prediction model based on the forest-growth model for P. densiflora trees that are susceptible to forest fire, and to apply the model to predict the variation in forest-fire fuel load according to forest management as an indirect measure of the effect of forest management on forest-fire behavior. The conventional estimation of wildfire fuel load is a static model that is used to estimate the current fuel load of a given forest with the limitation of being unable to predict future load. To complement this limitation, the mortality model was applied to the diameter distribution model in this study to predict a variation in stand growth according to stand conditions. The developed model allowed the prediction of variation in forest-fire fuel load.
The results of this study verified that the F.I. of the two models were of a favorable level in terms of utility: 0.58 (D0) to 0.96 (D50) for the diameter distribution model and 0.68 for the mortality model. The predicted variation in stand growth after 20 years based on the growth data of managed and unmanaged stands showed that the forest structure of unmanaged stands was maintained at a level of 1518 trees per ha on average with a high concentration of medium-diameter trees, whereas the forest structure of managed stands was predicted to exhibit a level of 885 trees per ha on average with a higher density of large-diameter trees. An analysis of the available canopy fuel load showed that the load is predicted to increase each year by approximately 0.7 ton/ha in unmanaged stands and by approximately 0.5 ton/ha in managed stands. Thus, these results suggest that forest management is an effective method to reduce combustible fuel load in the forest by reducing the mortality rate and facilitating tree growth towards the formation of a healthy forest. When the risk of crown fire spread was assessed based on the minimum threshold suggested in overseas criteria, the risk was 3.4-fold higher in managed stands and 4.3-fold higher in unmanaged stands. This implicates the need for continuous fuel management.
This study is significant in having determined the stand-level characteristics and founding the basis for predicting future forest-fire fuel load. Nevertheless, a limitation of this study is that the level of ingrowth of trees of ≥6 cm DBH could not be reflected in the forest-growth model. If this is complemented in the future, a system for predicting various forest dynamics can be established. In overseas countries, meteorological factors and/or seasonal variations in forest-fire fuel load are predicted and applied in the determination of urgent areas and respective timings for fuel management [13,53,54]. The findings of this study are expected to be useful in setting the criteria for overall fuel management to reduce forest fire damage based on the screening of critical areas for fuel management and their respective timings. This study will be beneficial for forest fire risk assessment at the landscape level based on the spatial modeling of forest attribute data such as forest stock map data.

Author Contributions

Conceptualization, S.-J.L., S.-Y.K. and Y.-J.L.; methodology, S.-J.L.; validation, S.-J.L., S.-Y.K. and Y.-J.L.; writing—original draft preparation, K.-W.S., J.-Y.R. and C.-G.K.; writing—review and editing, K.-W.S., J.-Y.R. and C.-G.K. All authors have read and agreed to the published version of the manuscript.

Funding

This study is the result of the development of a large-scale forest fire mechanism life and customized damage reduction management device (FE0500-2018-09-2022), which is a research project of the National Forest Research Institute.

Data Availability Statement

Not applicable.

Acknowledgments

Not applicable.

Conflicts of Interest

The authors declare no conflict of interest.

References

  1. UNEP (United Nations Environment Programme). Spreading Like Wildfire: The Rising Threat of Extraordinary Landscape Fires; A UNEP Rapid Response Assessment: Nairobi, Kenya, 2022; p. 126. [Google Scholar]
  2. Werner, J.; Lyons, S. The Size of Australia’s Bushfire Crisis Captured in Five Big Numbers. ABC News, Retrieved August 2020. Available online: https://www.abc.net.au/news/science/2020-03-05/bushfire-crisisfive-big-numbers/12007716 (accessed on 1 August 2020).
  3. Green, M. Australia’s Massive Fires Could Become Routine, Climate Scientists Warn, REUTERS, 2020. Available online: https://www.reuters.com/article/us-climate-change-australia-report-idUSKBN1ZD06W (accessed on 10 July 2022).
  4. KFS (Korea Forest Service). Annals of Forest Fire Statistics; KFS (Korea Forest Service): Daejeon, South Korea, 2020; p. 70.
  5. Bessie, W.D.; Johnson, E.A. The relative importance of fuels and weather on fire behavior in subalpine forests. Ecology 1995, 76, 747–762. [Google Scholar] [CrossRef]
  6. Pollet, J.; Omi, P.N. Effect of thinning and prescribed burning on crown fire severity in ponderosa pine forests. J. Wildland Fire 2002, 11, 1–10. [Google Scholar] [CrossRef]
  7. Johnson, A.S.; Hale, P.E. The historical foundations of prescribed burning for wildlife: A south-eastern perspective. In Proceedings: The Role of Fire for Non-Game Wildlife Management and Community Restoration: Traditional Uses and New Directions; General Technical Report NE-288; Mark, F.W., Russell, K.R., Moorman, C.E., Eds.; USDA Forest Service, Northeastern Research Station: Washington, DC, USA, 2002. [Google Scholar]
  8. U.S. Department of Agriculture. 2022 USDA Explanatory Notes-Forest Service; USDA: Washington, DC, USA, 2021; pp. 1–213.
  9. Mylek, M. Understanding the acceptability of fuel management strategies used to reduce wildfire risk in Australia. Environ. Manag. 2021, 65, 433–447. [Google Scholar] [CrossRef] [PubMed]
  10. Kim, Y.H.; Kim, T.W.; Won, H.K.; Lee, K.H.; Shin, M.Y. Estimation of timber production by thinning scenarios using a forest stand yield model. J. Korean For. Soc. 2012, 101, 592–598. [Google Scholar]
  11. Park, J.H.; Jung, S.Y.; Yoo, B.O.; Lee, K.S.; Park, Y.B.; Kim, H.H. The production objectives and optimal standard of density control using stand density management diagram for Pinus densiflora forests in Korea. J. Korean For. Soc. 2017, 106, 457–464. [Google Scholar]
  12. Lucas, W.; Francois, P.; Matt, J.; Rod, L.; William, M. Standfire: An IFT-DSS Module for Spatially Explicit, 3D Fuel Treatment Analysis. Final Report for JFSP Project 12-1-03-30. 2016. Available online: https://hal.archives-ouvertes.fr/hal-01674989 (accessed on 10 July 2022).
  13. Morgan, G.W.; Tolhurst, K.G.; Poynter, M.W.; Cooper, N.; McGuffog, T.; Ryan, R.; Wouters, M.A.; Stephens, N.; Black, P.; Sheehan, D. Prescribed burning in south-eastern Australia: History and future directions. Aust. For. 2020, 83, 4–28. [Google Scholar] [CrossRef]
  14. Jang, M.N.; Kim, S.Y.; Lee, Y.J. Estimation of forest fire fuel load models using crown structure characteristics for Pinus densiflora S. et Z. stands in Gyeongbuk province. J. Agric. Life Sci. 2021, 55, 49–56. [Google Scholar] [CrossRef]
  15. Kim, S.Y. A Study on the Analysis of Fuel Characteristics for Forest Fire Hazard Assessment. Ph.D. Thesis, Kongju National University, Yesan, South Korea, 2015. [Google Scholar]
  16. Kim, S.Y.; Lee, Y.J.; Jang, M.N.; Kwon, C.G.; Lee, B.D.; Ahn, H.Y. Comparison of fuel characteristics between Pinus densiflora and Pinus koraiensis in Gangwon province. Crisisonomy 2017, 13, 105–115. [Google Scholar] [CrossRef]
  17. Seo, J.H.; Son, Y.M.; Lee, K.H.; Lee, W.K.; Son, Y.H. The estimation of stand biomass and net carbon removals using dynamic stand growth model. J. Korea For. Energy 2005, 24, 37–45. [Google Scholar]
  18. Pyne, S.J.; Andrews, P.L.; Laven, R.D. Introduction to Wildland Fire; John Wiley & Sons: Hoboken, NJ, USA, 1996; p. 769. [Google Scholar]
  19. Vaillant, N.M.; Fites-Kaufman, J.A.; Stephens, S.L. Effectiveness of prescribed fire as a fuel treatment in Californian coniferous forests. Int. J. Wildland Fire 2009, 18, 165–175. [Google Scholar] [CrossRef]
  20. Dimitrakopoulos, A.P.; Panov, P.I. Pyric properties of some dominant Mediterranean vegetation species. Int. J. Wildland Fire 2001, 10, 23–27. [Google Scholar] [CrossRef]
  21. Scott, J.H.; Reinhardt, E.D. Assessing Crown Fire Potential by Linking Models Of Surface and Crown Fire Behavior; Forest Service, US Department of Agriculture: Washington, DC, USA, 2001; p. 59.
  22. Reinhardt, E.; Duncan, L.; Scott, J. FuelCalc: A method for estimating fuel characteristics. In Proceedings of the RMRS-P-41, Portland, OR, USA, 28–30 March 2006; US Department of Agriculture, Forest Service, Rocky Mountain Research Station: Fort Collins, CO, USA, 2006; pp. 273–282. [Google Scholar]
  23. Scott, K.; Oswald, B.; Farrish, K.; Unger, D. Fuel loading prediction models developed from aerial photographs of the Sangre de Cristo and Jemez mountains of New Mexico, USA. Int. J. Wildland Fire 2002, 11, 85–90. [Google Scholar] [CrossRef]
  24. Thomas, D.J.; Tina, L.B.; Alan, Y. Predicting continuous variation in forest fuel load using biophysical models: A case study in south-eastern Australia. Int. J. Wildland Fire 2013, 22, 318–332. [Google Scholar]
  25. Yim, J.S.; Kim, R.H.; Lee, S.J.; Son, Y.M. Land use change assessment by permanent sample plots in national forest inventory. J. Clim. Chang. Res. 2015, 6, 33–40. [Google Scholar] [CrossRef]
  26. Kim, D.H. Accounting for Forest Resources Using the National Forest Inventory Data. Ph.D. Thesis, Chonbuk National University, Daejeon, South Korea, 2016. [Google Scholar]
  27. Son, Y.M.; Jeon, J.H.; Lee, S.J.; Yim, J.S.; Kang, J.T. Development of estimated equation for mortality rates by forest type in Korea. J. Korean For. Soc. For Sci. 2017, 106, 450–456. [Google Scholar]
  28. Hamilton, D.A. Event Probabilities Estimated by Regression; Intermountain Forest & Range Experiment Station, Forest Service, US Department of Agriculture: Washington, DC, USA, 1974; pp. 1–152.
  29. Pyo, J.K.; Lee, Y.J.; Son, Y.M.; Lee, K.H.; Moon, H.S. Estimation of site index equation for Pinus densiflora at Mt. Osu region using Schnute growth function. J. Agric. Life Sci. 2009, 43, 9–14. [Google Scholar]
  30. Son, Y.M.; Lee, K.H.; Kim, R.H.; Seo, J.H. Stand development estimate and carbon stocks/removals assessment using stand growth monitoring. J. Korea For. Energy 2006, 25, 42–48. [Google Scholar]
  31. Lee, Y.J.; Coble, D.W. A new diameter distribution model for unmanaged loblolly pine plantations in East Texas. South. J. Appl. For. 2006, 30, 13–20. [Google Scholar] [CrossRef]
  32. Poudel, K.P.; Cao, Q.V. Evaluation of methods to predict Weibull parameters for characterizing diameter distributions. For. Sci. 2013, 59, 243–252. [Google Scholar] [CrossRef]
  33. Cruz, M.G.; Alexander, M.E.; Wakimoto, R.H. Assessing canopy fuel stratum characteristics in crown fire prone fuel types of western North America. Int. J. Wildland Fire 2003, 12, 39–50. [Google Scholar] [CrossRef]
  34. KFS (Korea Forest Service). The 6th National Forest Inventory Report; KFS: Daejeon, South Korea, 2012; p. 60.
  35. Abino, A.C.; Kim, S.Y.; Lumbres, R.I.C.; Jang, M.N.; Youn, H.J.; Park, K.H.; Lee, Y.J. Performance of Weibull function as a diameter distribution model for Pinus thunbergii stands in the eastern coast of South Korea. J. Mt. Sci. 2016, 13, 822–830. [Google Scholar] [CrossRef]
  36. Lumbres, R.I.C.; Lee, Y.J. Percentile-based Weibull diameter distribution model for Pinus kesiya stands in Benguet province, Philippines. South. For. 2014, 76, 117–123. [Google Scholar] [CrossRef]
  37. Lee, S.J.; Kim, S.Y.; Lee, B.D.; Lee, Y.J. Estimation of canopy fuel characteristics for Pinus densiflora stands using diameter distribution models: Forest managed stands and unmanaged stands. J. Korean Soc. For. Sci. 2018, 107, 412–421. [Google Scholar]
  38. Harcombe, P.A.; Marks, P.L. Five years of tree mortality in a Fagus–Magnolia forest, southeast Texas (USA). Oecologia 1983, 57, 49–54. [Google Scholar] [CrossRef] [PubMed]
  39. Harcombe, P.A. Stand development in a 130-year-old spruce–hemlock forest based on age structure and 50 years of mortality data. For. Ecol. Manag. 1986, 14, 41–58. [Google Scholar] [CrossRef]
  40. Lee, S.J.; Kim, S.Y.; Kwon, C.G.; Lee, B.D.; Lee, Y.J. Influence of Forest Management Activities on Forest Fire Fuels in Coarse Woody Debris for Pinus densiflora Stands in South Korea. Crisisonomy 2020, 16, 97–103. [Google Scholar] [CrossRef]
  41. McArdle, R.E.; Meyer, W.H.; Bruce, D. The Yield of Douglas Fir in the Pacific Northwest; USDA Forest Service: Washington, DC, USA, 1949; Volume 201, p. 71.
  42. Van Mantgem, P.J.; Stephenson, N.L.; Byrne, J.C.; Daniels, L.D.; Franklin, J.F.; Fulé, P.Z.; Harmon, M.E.; Larson, A.J.; Smith, J.M.; Taylor, A.H.; et al. Widespread increase of tree mortality rates in the western United States. Science 2009, 323, 521–524. [Google Scholar] [CrossRef]
  43. Mäkinen, H.; Isomäki, A. Thinning intensity and growth of Scots pine stands in Finland. For. Ecol. Manag. 2004, 201, 311–325. [Google Scholar] [CrossRef]
  44. Peltola, H.; Kilpeläinen, A.; Kellomäki, S. Diameter growth of Scots pine (Pinus sylvestris) trees grown at elevated temperature and carbon dioxide concentration under boreal conditions. Tree Physiol. 2002, 22, 963–972. [Google Scholar] [CrossRef]
  45. Bae, S.W.; Hwang, J.H.; Lee, S.T.; Kim, H.S.; Jeong, J.M. Changes in soil temperature, moisture content, light availability and diameter growth after thinning in Korean pine (Pinus koraiensis) plantation. J. Korean For. Soc. 2010, 99, 397–403. [Google Scholar]
  46. Son, Y.; Lee, Y.Y.; Jun, Y.C.; Kim, Z.S. Light availability and understory vegetation four years after thinning in a Larix leptolepis plantation of central Korea. J. For. Res. 2004, 9, 133–139. [Google Scholar] [CrossRef]
  47. Son, Y.H.; Jun, Y.C.; Lee, Y.Y.; Kim, R.H.; Yang, S.Y. Soil CO2 evolution, litter decomposition, and nitrogen availability 4 years after thinning in a Japanese larch plantation. Commun. Soil Sci. Plant Anal. 2004, 35, 1111–1122. [Google Scholar] [CrossRef]
  48. Mutch, R.W.; Quigley, T.M. Forest Health in the Blue Mountains: A Management Strategy for Fire-Adapted Ecosystems; USDA Forest Service, Pacific Northwest Research Station: Washington, DC, USA, 1993; p. 14.
  49. Sando, R.W. A Method of Evaluating Crown Fuels in Forest Stands; Research Paper NC-84; North Central Forest Experiment Station, Forest Service, US Department of Agriculture: Washington, DC, USA, 1972; p. 10.
  50. Juodvalkis, A.; Kairiukstis, L.; Vasiliauskas, R. Effects of thinning on growth of six tree species in north-temperate forests of Lithuania. Eur. J. For. Res. 2005, 124, 187–192. [Google Scholar] [CrossRef]
  51. Williams, D.F. Fuel Properties before and after Thinning in Young Radiata Pine Plantations; Research Report 3; Fire Management Branch, Department of Conservation and Environment: Parramatta, Australia, 1978.
  52. Agee, J.K. The influence of forest structure on fire behavior. In Proceedings of the 17th Annual Forest Vegetation Management Conference, Redding, CA, USA, 16–18 January 1996; pp. 52–68. [Google Scholar]
  53. Burrows, N.; McCaw, L. Prescribed burning in southwestern Australian forests. Front. Ecol. Environ. 2013, 11, 25–34. [Google Scholar] [CrossRef]
  54. Bhadoria, R.S.; Pandey, M.K.; Kundu, P. RVFR: Random Vector Forest Regression Model for Integrated & Enhanced Approach in Forest Fires Predictions. Ecol. Inform. 2001, 66, 101–471. [Google Scholar]
Figure 1. Geographical distribution of study sites for Pinus densiflora stands in South Korea.
Forests 13 01372 g001
Figure 2. Schematic process flow of the study.
Forests 13 01372 g002
Figure 3. Rank analysis of the simple volume models using the validation dataset (note: the model with the smallest area inside the box represents the best model). AIC: Akaike information criterion; SEE: standard error of estimate; F.I.: fit index; and MAD: mean absolute difference.
Forests 13 01372 g003
Figure 4. Predicted tree density in (a) managed stands and (b) unmanaged stands in each DBH class of the following stand ages: 40 years, 50 years, and 60 years.
Forests 13 01372 g004
Table 1. Summary of observed dead trees statistics for Pinus densiflora stands in South Korea.
DBH
(cm)
Height
(m)
No. of Dead Trees
(/ha)
Volume
(m3/ha)
11.0 ± 2.4 6.0 22.0 5.3 ± 1.4 2.3 9.9 181.8 ± 10.1 25.0 625.0 6.4 ± 2.9 0.2 28.4
Note: Mean ± S . E . min . max . , DBH: diameter at breast height.
Table 2. Parameter estimates and fit statistics for site index (SI), individual tree height (HT), quadratic mean diameter (Dq), and percentiles of the diameter distribution (D0, D25, D50, and D95) models.
EquationParameterParameter EstimateF.I.RMSEC.V.
2
(SI)
b 0 14.870.971.877.48
b 1 0.04
b 2 1.34
3
(HT)
b 0 20.430.972.298.21
b 1 0.05
b 2 1.13
6
(Dq)
β 0 4.390.760.154.98
β 1 −10.80
β 2 0.54
β 3 −0.25
5
(D0)
β 0 1.350.582.5527.96
β 1 0.51
β 2 −0.06
5
(D25)
β 0 −1.330.901.7612.06
β 1 0.88
β 2 −0.04
5
(D50)
β 0 −1.390.961.327.15
β 1 1.04
β 2 −0.03
5
(D95)
β 0 3.360.862.849.60
β 1 1.20
β 2 0.06
Note: fitness index = 1 i = 1 n | Y i Y i ^ | 2 i = 1 n | Y i Y ¯ i | 2 ; root mean square error = i = 1 n | Y i Y i ^ | 2 n ; coefficient of variation = i = 1 n | Y i Y ¯ i | 2 X ¯ .
Table 3. Mortality model forms used in this study.
Model NumberFunctional Model Form
Model 1 M = ( a + bSI ) ( BA c exp ( dTPH ) ) 1
Model 2 M = ( 1 + exp ( a + bDBH + cSI + dTPH ) ) 1
Model 3 M = ( a + bSI ) ( 1 + exp ( cBA + dTPH ) ) 1
Model 4 M = ( 1 + exp ( a + ( b / DBH ) + ( cDensity ) + ( dBA ) + ( eDBH ) + ( fDBH 2 ) ) ) 1
Model 5 M = ( 1 + exp ( a + bDBH + cSI + d ( HT / AGE ) ) ) 1
Note: M is mortality; SI is site index; BA is basal area; TPH is tree per hater; and DBH is the diameter at breast height.
Table 4. Summary of observed statistics for Pinus densiflora stands in South Korea.
Managed Stands
(n = 84,871 Observations from 1085 Plots)
Unmanaged Stands
(n = 22,966 Observations from 349 Plots)
VariableMeanS.D.Min.Max.MeanS.D.Min.Max.
Age (years)37.58.910.091.538.211.220.089.2
DBH (cm)19.15.96.341.716.65.98.247.3
Height (m)14.33.35.429.413.52.97.324.5
Crown height (m)6.22.32.115.15.52.01.613.3
D09.34.06.033.07.73.06.027.0
D2514.75.56.037.012.05.26.041.0
D5018.56.36.043.015.96.37.049.5
D9529.77.67.066.027.48.812.066.0
Dq20.05.96.342.717.76.28.648.5
TPH961.7318.4200.01500.01645.11027.2225.06950.0
Notes: Di is the diameter at breast height (cm) in the i = 0, 25, 50, and 95th percentiles; Dq is the quadratic mean diameter (cm); S.D. is the standard deviation; Min is the minimum; and Max is the maximum.
Table 5. Parameter estimates and fit statistics for mortality models in Pinus densiflora stands.
ModelParameterS.E.EF.I.M.A.DA.I.C
abcdef
Model 10.52−0.01−0.480.27 3.930.371.33151.53
Model 222.63−1.080.22–0.01 0.760.681.2525.48
Model 33.96−0.07−0.200.01 3.660.451.09143.84
Model 4−2.4211.440.090.080.430.034.210.271.35159.21
Model 5−0.330.080.18–8.93 3.500.501.35139.04
Note: standard error of estimate = i = 1 n | Y i Y i ^ | 2 n 2 ; fitness index = 1 i = 1 n | Y i Y i ^ | 2 i = 1 n | Y i Y ¯ i | 2 ; mean absolute difference = i = 1 n | V i V i ^ | n ; and Akaike information criterion = n In ( RSS N ) + 2 k .
Table 6. Estimation of canopy fuel loads by scenarios of managed stands (trees per ha (TPH) = 900, site index (SI) = 13), and unmanaged stands (TPH = 1600, SI = 12).
ClassificationForest TypeStand Age
PresentAfter 10 YearsAfter 20 Years
ACFL
(ton/ha)
Managed20.029.232.8
Unmanaged30.041.250.1
ACBD
(kg/m3)
Managed0.1570.1920.221
Unmanaged0.1810.2290.280
Note: ACFL is the available crown fuel load; ACBD is the available crown bulk density.
Publisher’s Note: MDPI stays neutral with regard to jurisdictional claims in published maps and institutional affiliations.

