Article

Structure Degradation Induced by Wetting and Drying Cycles for the Hilly Granitic Soils in Collapsing Gully Erosion Areas

1
School of Hydraulic & Ecological Engineering, Nanchang Institute of Technology, Nanchang 330099, China
2
Jiangxi Academy of Water Science and Engineering, Nanchang 330099, China
3
College of Resources and Environment, Huazhong Agricultural University, Wuhan 430070, China
*
Authors to whom correspondence should be addressed.
Submission received: 31 July 2022 / Revised: 27 August 2022 / Accepted: 1 September 2022 / Published: 5 September 2022

Abstract

:
The hydrological and mechanical properties of granitic residual soils can be significantly altered by periodical wetting and drying (W-D) cycles. The soil structure degradation induced by W-D cycles can lead to soil mass failure and collapsing gully erosion in granitic hilly slopes in south China. However, limited attempts have been made at a comprehensive investigation of the effects of W-D cycles on the structure degradation of granitic residual soils, especially at the pedon scale. The purpose of this paper is to investigate the structural degradation of granite soils induced by W-D cycles and explore its potential influence on the development of collapsing gully erosion. The granitic soil properties, including hydraulic properties, shear strength, and disintegration characteristics, were performed after W-D cycles. The results indicated that the W-D cycles altered the soil pore structure, leading to variations in soil hydraulic properties. Specifically, with increasing alternate W-D cycles, the initial saturated water content and residual water content decreased, while the saturated hydraulic conductivity increased. Meanwhile, increasing W-D cycles contributed significantly to variations in cohesion and internal friction strength by decreasing the shear strength variables, especially the soil cohesion strength. Correspondingly, soil disintegration was increased during W-D cycles. Furthermore, most degradation of soil structure was recorded within the first two cycles of W-D. The obtained results indicate that the W-D cycles weaken soil structure, increase rainwater infiltration, decrease soil shear strength and disintegration resistance, and accelerate soil erosion. A vicious cycle of granitic slope failure induced by W-D cycles is eventually formed. This study provides useful information about the mechanism of soil mass failure and collapsing gully erosion in granitic hilly slopes.

1. Introduction

Soil erosion is a serious threat to the sustainability of global development due to its chronic influences on the ecological system and social services [1]. Collapsing gullies, a fragmented erosion landform in hilly granitic areas of southern China, are developed by slope collapse under the combination of water and gravity [2,3]. The predominant character of this erosion landform is the high-steep headwalls and sidewalls, as well as a sloping gully floor with sediment accumulation [4] (Figure 1). According to the existing research, collapsing gully erosion in southern China is different from the well-known gully erosion in the Loess Plateau or in black-soil regions, and the erosional landform has some similarities with those in Italy, Brazil, and Madagascar, which are locally termed as “calanchi” [5], “voçorocas” [6], and “lavaka” [7], respectively, but whether these international landforms are the same as the collapsing gully still remains inconclusive. Although highlighted as a national concern since it was regarded as the dominant factor for the deterioration of the ecological environment in southern China, the erosion mechanism of the collapsing gully is still under investigation.
The abundant precipitation accompanied with high temperature in tropical and subtropical areas of southern China is widely accepted as one of the most predominant environmental factors for collapsing gully formation [2]. Soils in these areas suffer from dramatic wetting and drying (W-D) cycles under this climatic condition, which accelerates soil structural degradation, including physical, hydrological, and mechanical properties [8,9,10,11]. During rainfall, the increase in water content causes an increase in the volume of soil voids, while upon drying, the volume shrinks, with cracks even occurring [12]. Earlier studies concerning the effects of W-D cycles on soil physical and mechanical properties were mainly conducted on soil aggregates and focused on the possible relationship between aggregate water stability and W-D cycles [13]. It has been found that soil particle rearrangement generated by W-D cycles could alter the soil pore system, which consequently, would facilitate aggregate formation [14,15]. Due to the variation in soil aggregate structure, irreversible compression [16], progressive shrinkage [17], and cracking behavior [18] had been observed for compacted core samples under the influence of W-D cycles. In addition, different results have been reported about the effects of multiple W-D cycles on soil physical and mechanical properties. Kalkan [8] found that the swelling potential of clayey soils decreased with the increasing frequency of W-D cycles, but it reached equilibrium at the fifth W-D cycle; Tang et al. [18] found that the cracking water content and surface crack ratio for clay slurry kept increasing in the first three W-D cycles but reached an equilibrium state during the subsequent cycles; meanwhile, He et al. [10] found that the number of soil cracks did not change significantly after the second cycle of W-D. Generally, soil deformation, including void ratio, shrinkage, and cracks generated by W-D cycles, is accompanied by a variation of soil structure stability and strength, which would definitely influence slope stability and/or erosion process. However, most of these publications about the effects of W-D cycles were concentrated on soils with well-aggregated or expansive clays, and little attention has been paid to granitic soils.
The structure of granitic residual soils under soil water-content variation without loading has been scarcely discussed comprehensively due to the less-expansive clay minerals. Meanwhile, our previous studies found a relatively high shrinkage ability of granitic soils during dehydration, though they had kaolinite as the dominant clay mineral [19,20]. In recent years, increasing attention has been paid to the mechanism of collapsing gully erosion for its formation and development, especially the external environmental factors [21,22,23], erosion process [24,25], hydrological process [26], and mechanical properties [27,28,29,30]. However, these studies with regard to mechanical properties were conducted on soils under dehydration or loading, and soils experiencing W-D cycles without loading are closer to the field condition. The soil with textures varying from clay to sandy may possess different deformation characteristics under W-D cycles along the granite soil profile. To make a better understanding of the collapsing gully erosion mechanism, it is necessary to make a comprehensive investigation of the effects of W-D cycles on the structure degradation of granitic soils, especially at a pedon scale.
Against the aforementioned background, the main objective of this study was to (i) investigate the structure degradation, including hydraulic properties, shear strength, and disintegration characteristics, of granite soils induced by W-D cycles; and (ii) explore its potential influence on the development of collapsing gully erosion. Herein, typical granitic residual soils along the weathering profile were collected in collapsing gully erosion areas of southern China, and its shear strength, soil water characteristics, and disintegration properties experienced from different numbers of W-D cycles were evaluated. The obtained results would facilitate the understanding of the mechanism of soil structure degradation and collapsing gully erosion in granitic areas.

2. Materials and Methods
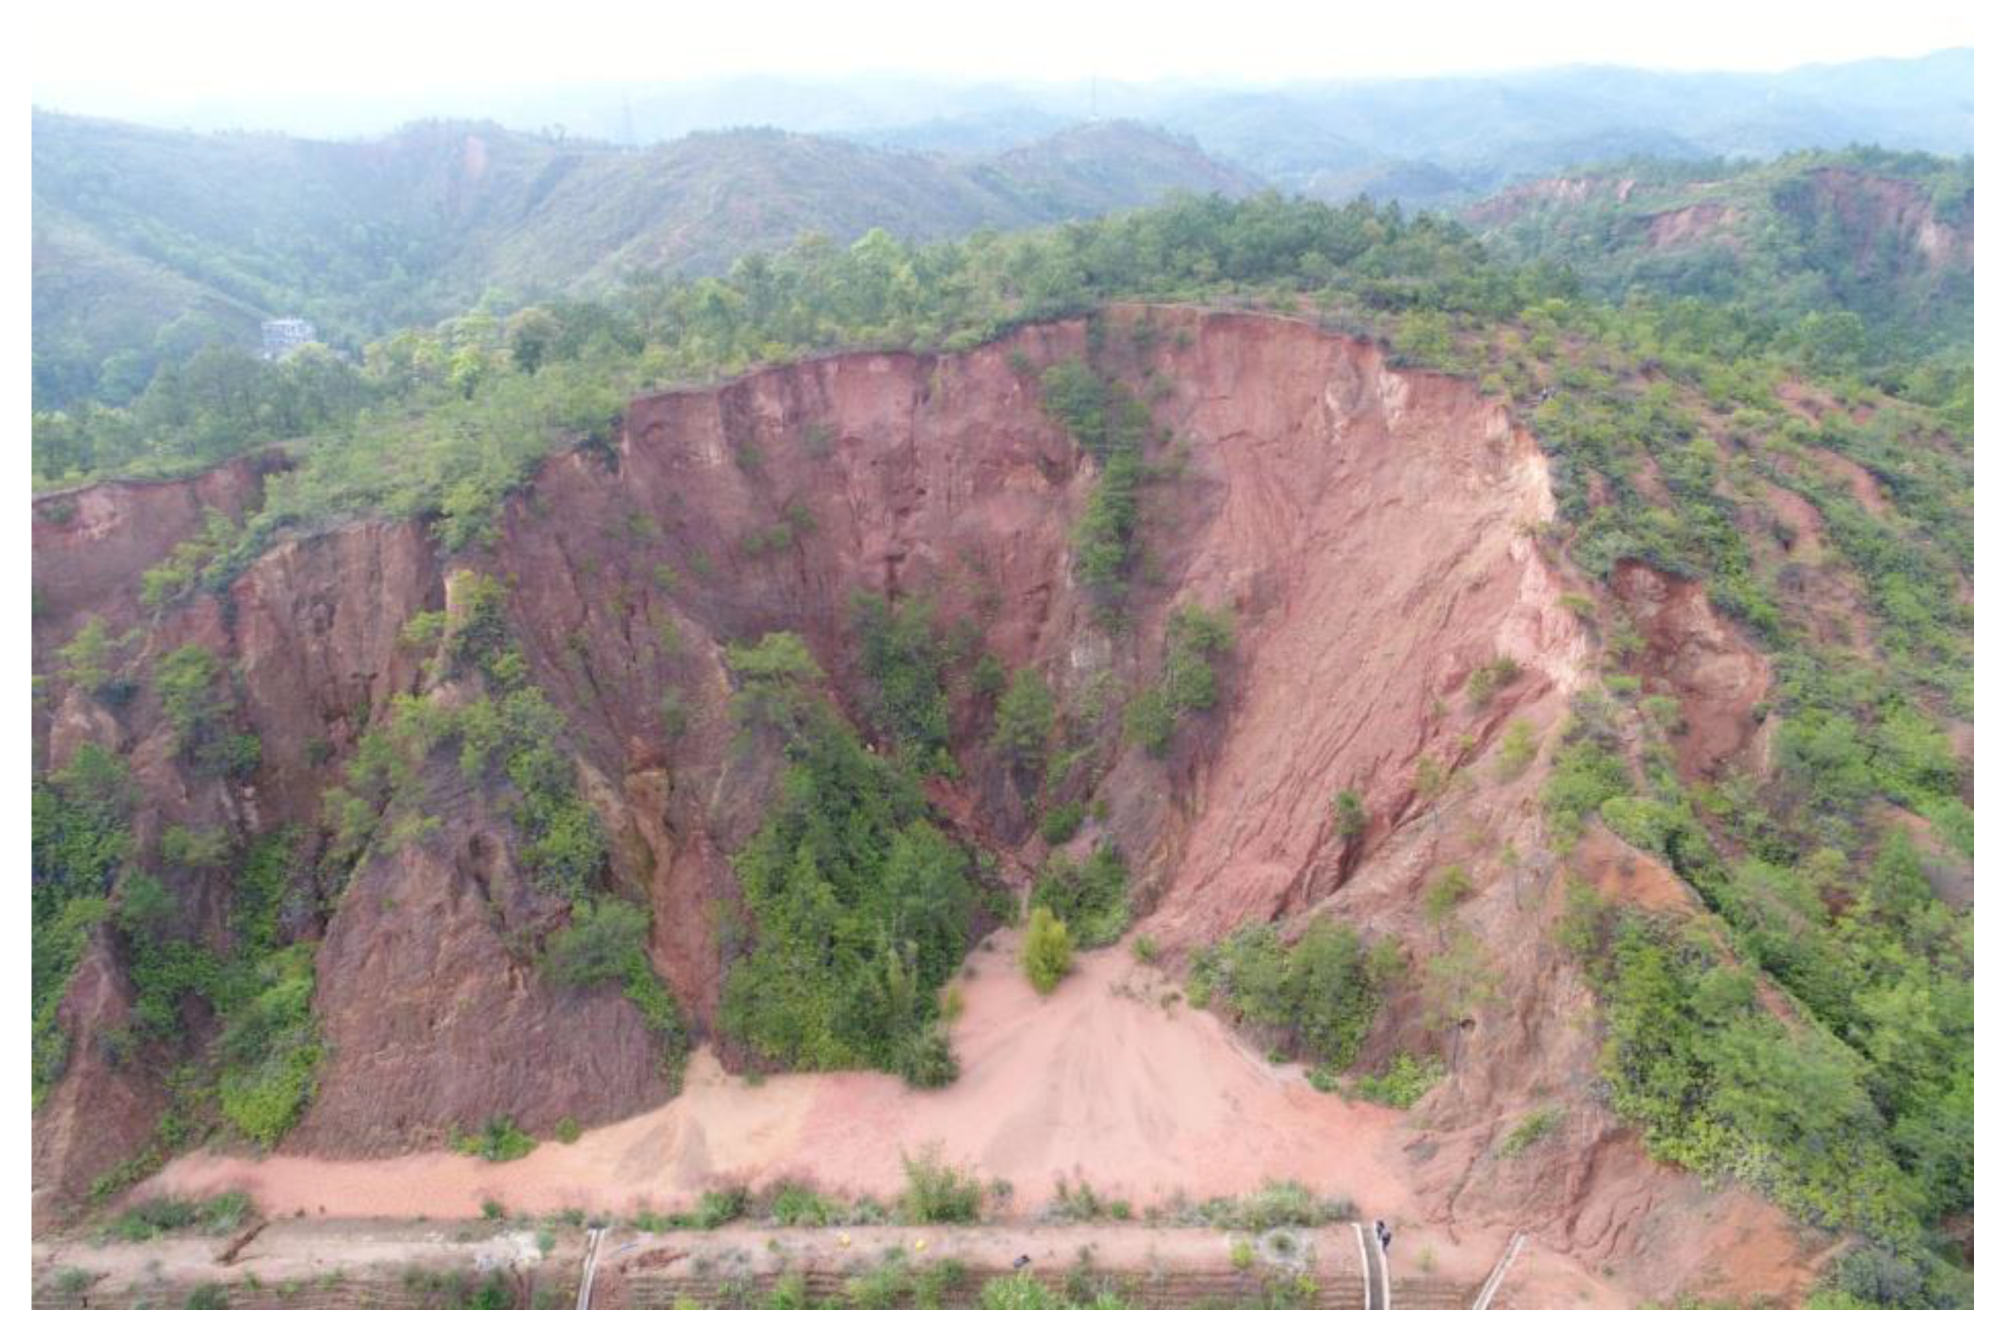
2.1. Study Area

This study was conducted in Tongcheng County (113°46′26″ E, 29°12′39″ N), Hubei province, the north boundary of collapsing gully distribution in southern China (Figure 2). It has been reported that 1102 collapsing gullies have developed in this region, and the annual sediment yield by collapsing gully erosion accounted for over 50% of the total erosion in this area [22]. The study site is in a typical subtropical monsoon climate zone with an average temperature, annual frost-free period, and precipitation of 16.1 °C, 260 days, and 1521 mm, respectively, and the rainy season coincides with hot weather, with 75% of the rain falling from March to September.
A typical weathering crust for granitic soils in the collapsing gully erosion area usually varies from tens to hundreds of meters, with its physicochemical properties exhibiting significant differences along the pedogenic profile [27]. According to the pedogenic process and weathering degree, an intact granitic soil profile could be divided into four layers, including surface layer, lateritic layer, sandy layer, and detritus layer [28].

2.2. Soil Sampling

According to field investigation, typical granitic soil profile with an intact pedogenic layer was selected. The sampling soils were acidic, well-drained, and classified as Alisol [31]. The land-use type was natural secondary forest, and the vegetation mainly included Pinus massoniana, Dicranopteris linearis, Smilax china, and Rosa laevigata [29]. Four soil sampling layers, including surface layer (0~45 cm), lateritic layer (45~170 cm), sandy soil layer (170~430 cm), and detritus layer (>430 cm), were collected in the basis of differences in soil color, soil texture, and soil strength along the profile (Table 1). Undisturbed soil core samples were collected by stainless-steel cylinders for the analysis of soil water retention properties (height 5 cm and inner diameter 5.05 cm), shear strength (height 2 cm and inner diameter 6.2 cm), and disintegration characteristics (height 2 cm and inner diameter 6.2 cm). Additionally, 1~2 kg of the scattered soil samples of each soil layer was collected for the test of physicochemical properties. Each test was conducted three times. A total of 336 soil core samples were collected.

2.3. Measurements

2.3.1. Physicochemical Properties

Physicochemical properties of the composited soils from each horizon and study site were analyzed according to the standard procedures. The soil texture was determined by the wet sieving–pipette method after dispersion [32]. Bulk density, total porosity, and capillary porosity were determined on undisturbed samples using cutting ring method [33]. Atterberg limit tests were performed by using liquid plastic combined tester according to the method of ASTM [34]. The samples were dried at 105 °C for 6 h to test the natural moisture content. Saturated hydraulic conductivity was determined using the TST-55 variable-head permeameter (Soil instrument, Nanjing, China) [20]. Soil organic matter (SOM) was determined by the K2Cr2O7-H2SO4 oxidation method [32]. Free iron (Fed) and aluminum (Ald) were extracted by citrate-bicarbonate-dithionite for determining the fractions of Fed and Ald oxides, and the contents of the iron and aluminum oxide in the extracts were determined by inductively coupled plasma optical emission spectroscopy (ICP-OES) (VISTA-MPX, Varian, Palo Alto, CA, USA) after dilution [35]. Clay minerals were determined by X-ray diffraction after pretreatments [20]. All these measurements were conducted in triplicate and averaged for statistical analysis. Detailed information about the physicochemical properties is summarized in Table 2.
The physicochemical properties showed a significant variation along the granitic weathering soil profile (p < 0.05). Soils in the surface layer had the lowest value of bulk density (1.25 g cm−3) but the highest value of total porosity (40.37%), and a less significant difference was observed for capillary porosity along the profile, revealing that the difference in porosity for granitic weathering soil profile was dominated by the relatively larger pores (noncapillary). Apart from the nonplastic soils in sandy and detritus layers, the Atterberg limits, with its liquid and plastic limit in a range of 59.73~52.32% and 36.88~30.77%, showed a noticeable decreasing trend along the investigated soil profile. The composition of clay minerals with kaolinite as its dominant component (>92%) possessed a less significant difference among different layers. In general, soils in the surface and lateritic layers had higher concentrations of cementing materials, including soil organic matter (10.64~18.62 g kg−1), free iron (18.34~20.19 g kg−1), and aluminum (5.37~5.83 g kg−1), than those in the sandy and detritus layers.

2.3.2. Simulation of Wetting-Drying Cycles

The wetting-drying cycles were simulated in laboratory through the following procedure. Before test, the core samples were vacuum-saturated by deionized water. Drying process was performed in a thermostatic blast oven with a constant temperature (40 ± 1 °C) for simulating the extreme field conditions in the summer of south China [36]. The samples were dried to constant weight, and the relative difference between adjacent weights of each individual sample was less than 0.2%. After the soil samples were artificially dehydrated, wetting process was conducted in the airtight container with constant room temperature. The samples were resaturated by capillary suction in deionized water. The above drying and wetting processes were referred to as a whole W-D cycle. The total number of W-D cycles were designed as 0, 2, 5, and 10 in this study.

2.3.3. Soil Water Retention Properties

Soil water retention properties corresponding to each W-D cycle were determined by centrifuge method [37] with the high-speed refrigerated centrifuge apparatus (HITACHI, CR21G Ⅲ). In order to reach the soil water potential equilibrium for a given centrifugal force, a 120 min run duration was set for each centrifuge step [11,38]. Here, water density was 1 g cm−3 and the acceleration of gravity was 981 cm s−2. The matric water potential h (kPa) was obtained by fitting the SWRCs of the van Genuchten model [39] to the experimental data using origin 9.0 by the following equation:
θ θ r θ s θ r = 1 1 + α h n m
where θ indicates the volumetric soil water content (cm3 cm−3); θ s is the saturated volumetric soil water content (cm3 cm−3); θ r is the residual volumetric soil water content (cm3 cm−3); h is the soil water pressure head (cm); α (cm−1), n, and m are positive fitting parameters (α > 0, n > 1, m = 1−1/n).
Soil water characteristic curve reflects pore size distribution of soil to some extent [40]. Assuming the pores of soil to be circular capillaries with various apertures, these pore diameters are derived from the capillarity equation as [41]:
d = 4 σ c o s α ρ g h
where d is pore diameter (μm), σ is the surface tension of water (N cm−1), α is the contact angle between the water and the pore wall, ρ is the density of water (g cm−3), g is acceleration of gravity (N kg−1) and h is matric suction (cm).
If soil suction is h1 and h2 (h1 < h2), the water content and pore equivalent diameter corresponding to soil suction h1 and h2 are θ1 and θ2, d1 and d2, respectively. Then, the pore ratio between d1 and d2 is (θ1θ2)/θs. Herein, the pores were divided to d1 (>30 μm), d2 (0.3~30 μm) and d3 (<0.3 μm), according to pore equivalent diameter.

2.3.4. Shear Strength

Shear strength of sampling soils was measured through the quadruple direct shear box apparatus (LH-DDS-4, Nanjing TKA Technology Co., Ltd., Shanghai, China). The specimen was fully saturated with deionized water before loading into the direct shear box (height 2 cm and inner diameter 6.2 cm). Then, the sampling soils were tested under four different normal stresses (τ) (50 kPa, 100 kPa, 150 kPa and 200 kPa). To eliminate the variation of soil water content during the test, the shearing rate was set as 2.4 mm min−1 [27]. The shear displacement was about 4 mm for the peak state of shear strength and about 6 mm otherwise. The shearing stress on the failure plane at failure was calculated using the equation: τ = n × r, where n (1.541 kPa when the shear displacement was 0.01 mm) is the conversion ratio and r is the numerical reading of the measure meter. Shear strength parameters were estimated through the Mohr–Coulomb shear strength criterion equation: τ = c + σtanφ [42], where c is the soil cohesion (kPa) and φ is the friction angle (°).

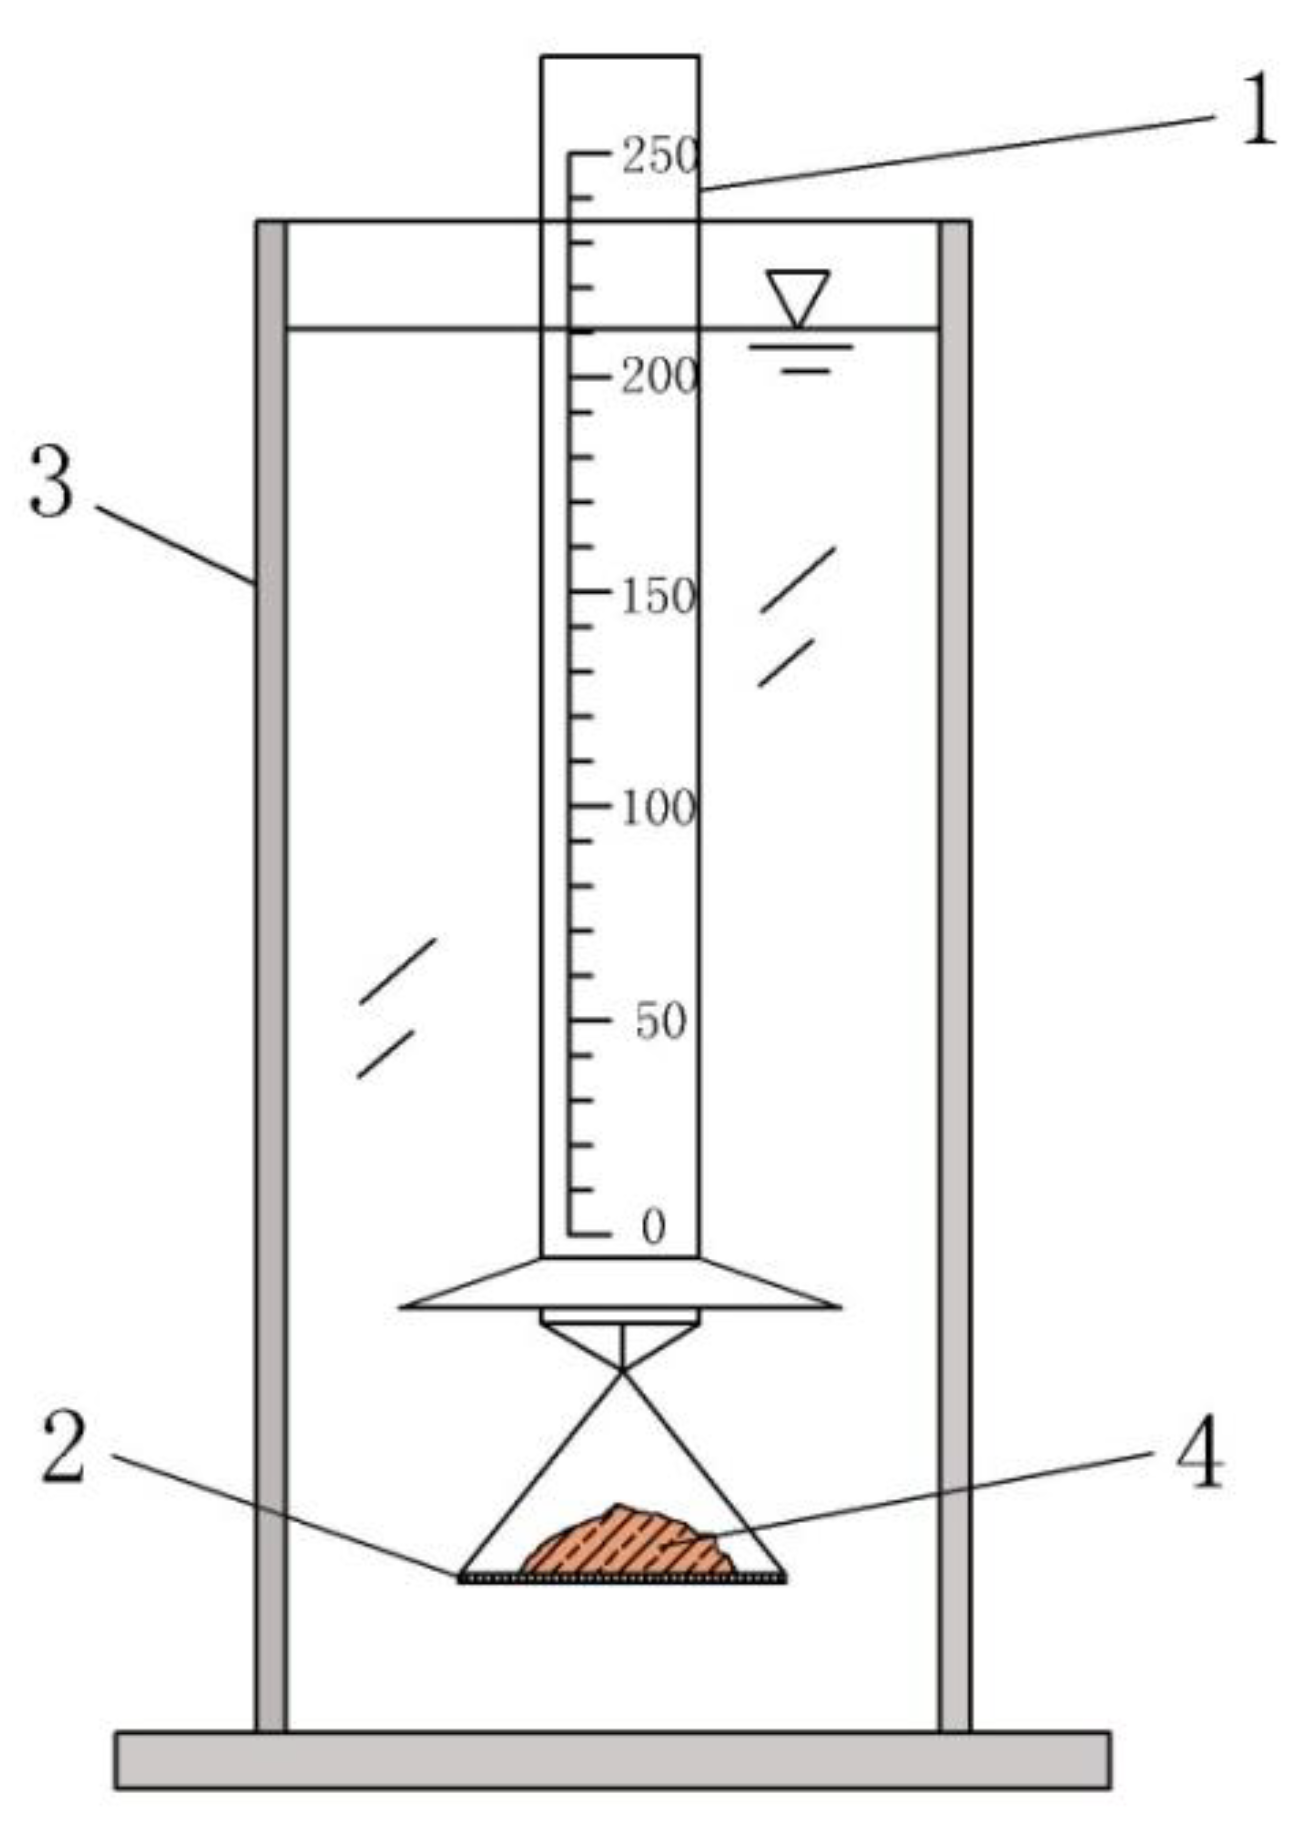
2.3.5. Disintegration Test

The disintegration characteristics of core samples corresponding to each W-D cycle were determined by a self-designed apparatus (Figure 3). Briefly, core samples were placed on a metallic meshy plate (12 cm × 12 cm) with the pore size of 0.8 cm × 0.8 cm. The disintegration rate was determined by water volume variation, which could be elevated by the floating cylinder with the minimum mark of 0.1 cm. When core samples were immersed into water, the mass remaining on the meshy plate decreased with increasing disintegration time, while the exposed height of the floating cylinder increased with the increasing volume of soil–water mixture. The test was terminated until a constant reading or the entire core sample was disintegrated totally. Independent procedure was performed to determine the instant reading of floating cylinder at the initial stable stage when the core sample was immersed into water, and disintegration was prevented by the wax sealing method, regardless of the effect of dissolved salts and gas effusion, which is likely to be very small relative to the soil disintegration [43]. The disintegration rate was calculated according to the following equation [44]:
A t = R 0 R t R 0 R e × 100 %
where At is the disintegration rate at a specific time, %; R0 is the instant reading of the floating cylinder upon the initial immersion of the core sample into water, cm; Rt is the reading of the floating cylinder at a specific time during the immersion of the core sample in water, cm; Re is the reading of the floating cylinder at the complete disintegration of the sample, cm.

2.4. Data Analysis

The normality of the raw data was determined by the Kolmogorov-Smirnov (K-S) test. All data analyses were performed using a SPSS 20.0 software package and significant differences among different treatments were statistically analyzed by one-way ANOVA (p < 0.05). The general linear model (GLM) was used to test the effects of the soil layer and W-D cycles and their interaction on the soil parameters, including hydraulic conductivity, soil water characteristics, and shear strength parameters. All the figures and tables were prepared using OriginPro8.0 and Microsoft Excel 2007.

3. Results and Discussion

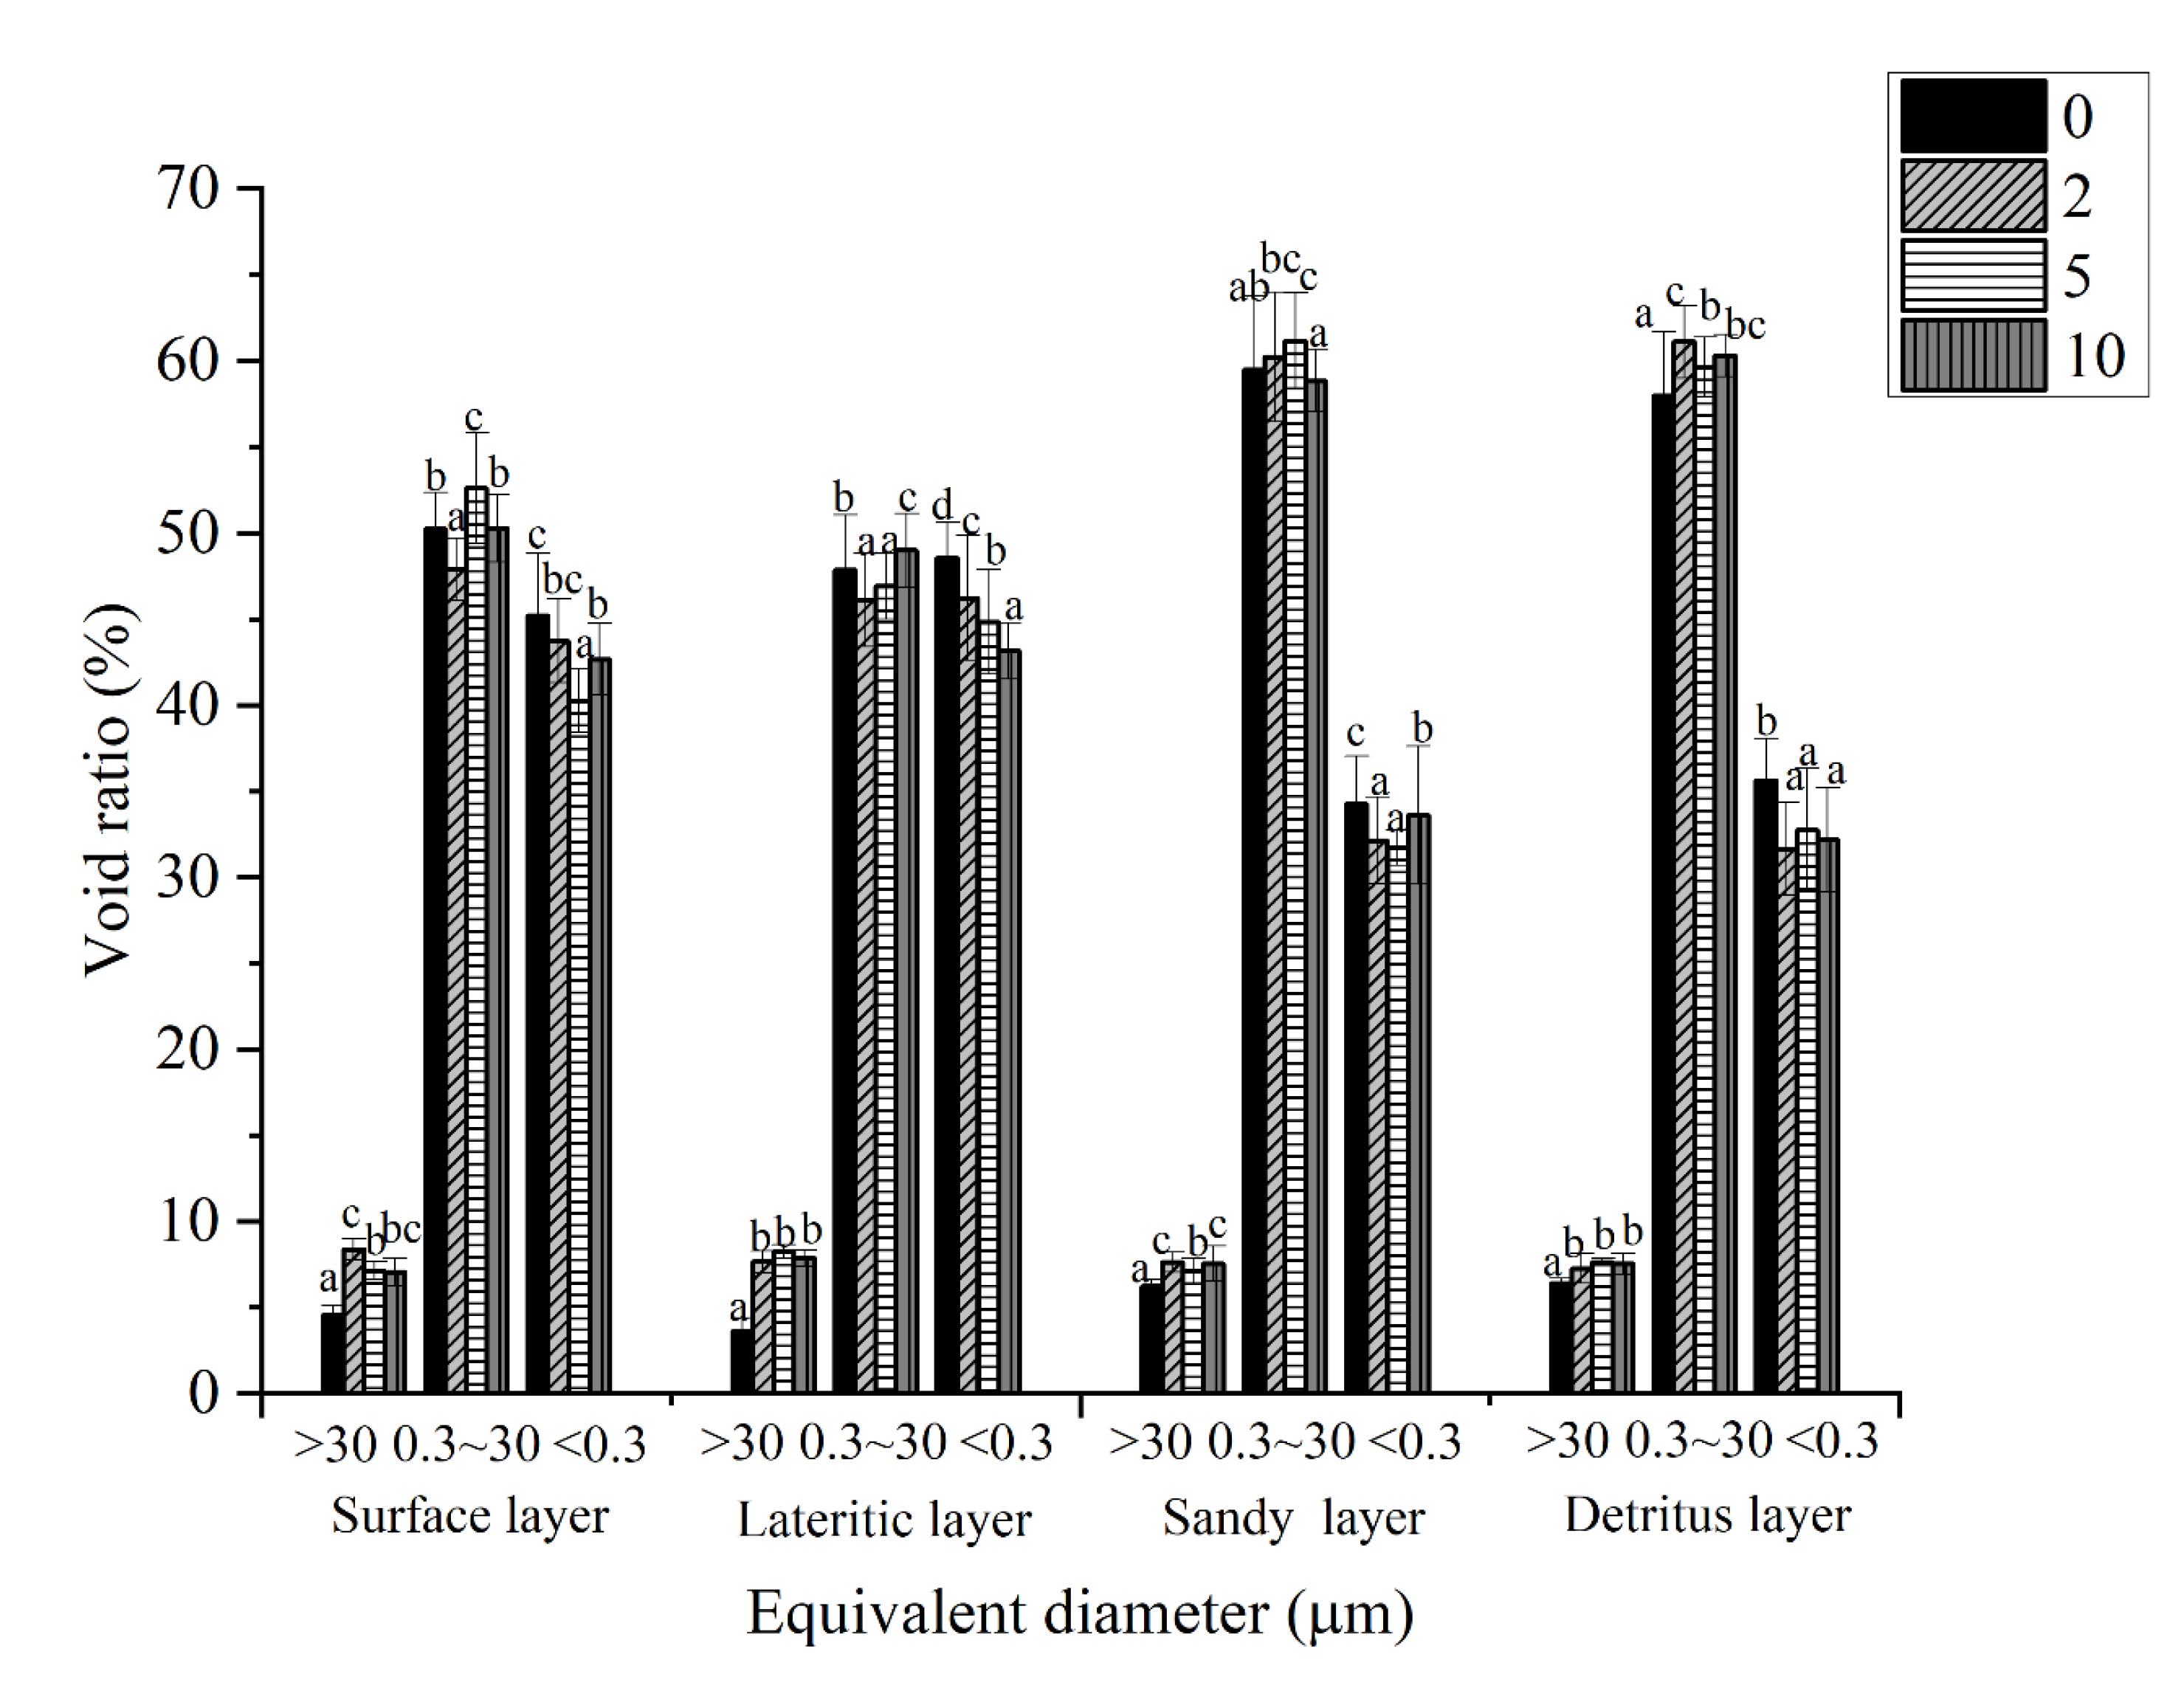
3.1. Soil Hydraulic Properties Induced by W-D Cycles

Soil hydraulic properties, including water retention and saturated hydraulic conductivity under the influence of W-D, were analyzed. According to the relationship between volumetric water content and matric suction (Figure 4), soil water retention capacity decreased consistently with the increasing cycle of the wetting–drying process, especially for soils in surface (Figure 4a) and lateritic layers (Figure 4b), while it showed a slight increasing trend when the W-D cycle increased from 0 to 5 for soils in the sandy and detritus layers (Figure 4c,d). This difference in water retention capacity generated by wetting–drying decreased with the increment in the W-D cycle, and it was more significant at the low matric suction (<100 kPa) than that at the high matric suction. Specifically, the saturated (θs) and residual (θr) water content fitted by van Genuchten (p < 0.05) kept decreasing when the number of wetting-drying cycles increased from 0 to 10, particularly at conditions where the number of W-D cycles was fewer than 5, as a less significant difference was observed for these water contents when the number of W-D cycles increased from 5 to 10 (p > 0.05), and this decreasing trend was more obviously observed for soils in the surface and lateritic layers, e.g., θs decreased from 0.41 cm3 cm−3 to 0.35 cm3 cm−3 for soils in the surface layer, but it decreased from 0.38 cm3 cm−3 to 0.36 cm3 cm−3 for soils in the detritus layer (Table 3). By contrast, the fitting parameter α and n was lightly influenced by W-D cycles irrespective of the pedogenic layers (p > 0.05). This may be related to the change in pore volume and the formation of cracks during W-D cycles [45].
Equivalent diameter distributions of soil pore ratio for granitic soils during W-D cycles were shown in Figure 5. The pore ratio of soil equivalent diameter d1 (>30 μm) showed an increased trend with the increasing cycle of wetting–drying, while the pore ratio of soil equivalent diameter d3 (<0.3 μm) was significantly decreased. Moreover, the variations in pore ratio of soil equivalent diameter d1 for soils in the clay loam layers (surface and lateritic) were greater than those in the sandy loam layers (sandy and detritus). The saturated water conductivity (Ks), as an index relating to soil porosity, showed an increasing trend by W-D cycles, which kept in line with the aforementioned variations in pore ratio of soil equivalent diameter d1. In addition, a significant difference was obtained between the Ks of soils processed with 0 and 2 W-D cycles (p < 0.01), particularly for soils in the lateritic layer in which the corresponding Ks increased from 0.0024 to 0.0273 cm min−1 (Figure 6). However, with the subsequent increasing numbers of W-D cycles, a less significant difference was observed for Ks, reflecting a decreasing influence of W-D cycles on Ks after the second cycle.
The increase in the hydraulic conductivity induced by W-D cycles resulted from the increase in hydraulic active pores [46]. Generally, the Ks of a cracked soil is several orders of magnitude larger than that of an intact soil [47,48]. With the increasing cycle of wetting and drying, the saturated hydraulic conductivity increased by 112%, 1138%, 128%, and 86% for the four soil layers, respectively. The greater increment in Ks for soils in the lateritic layer was generated by the higher content of clay and soil organic matter content (Table 2) [12,49]. However, soils in the surface layer possessing similar physicochemical properties to those in the lateritic layer demonstrated a significant lower increment in Ks (Table 1).

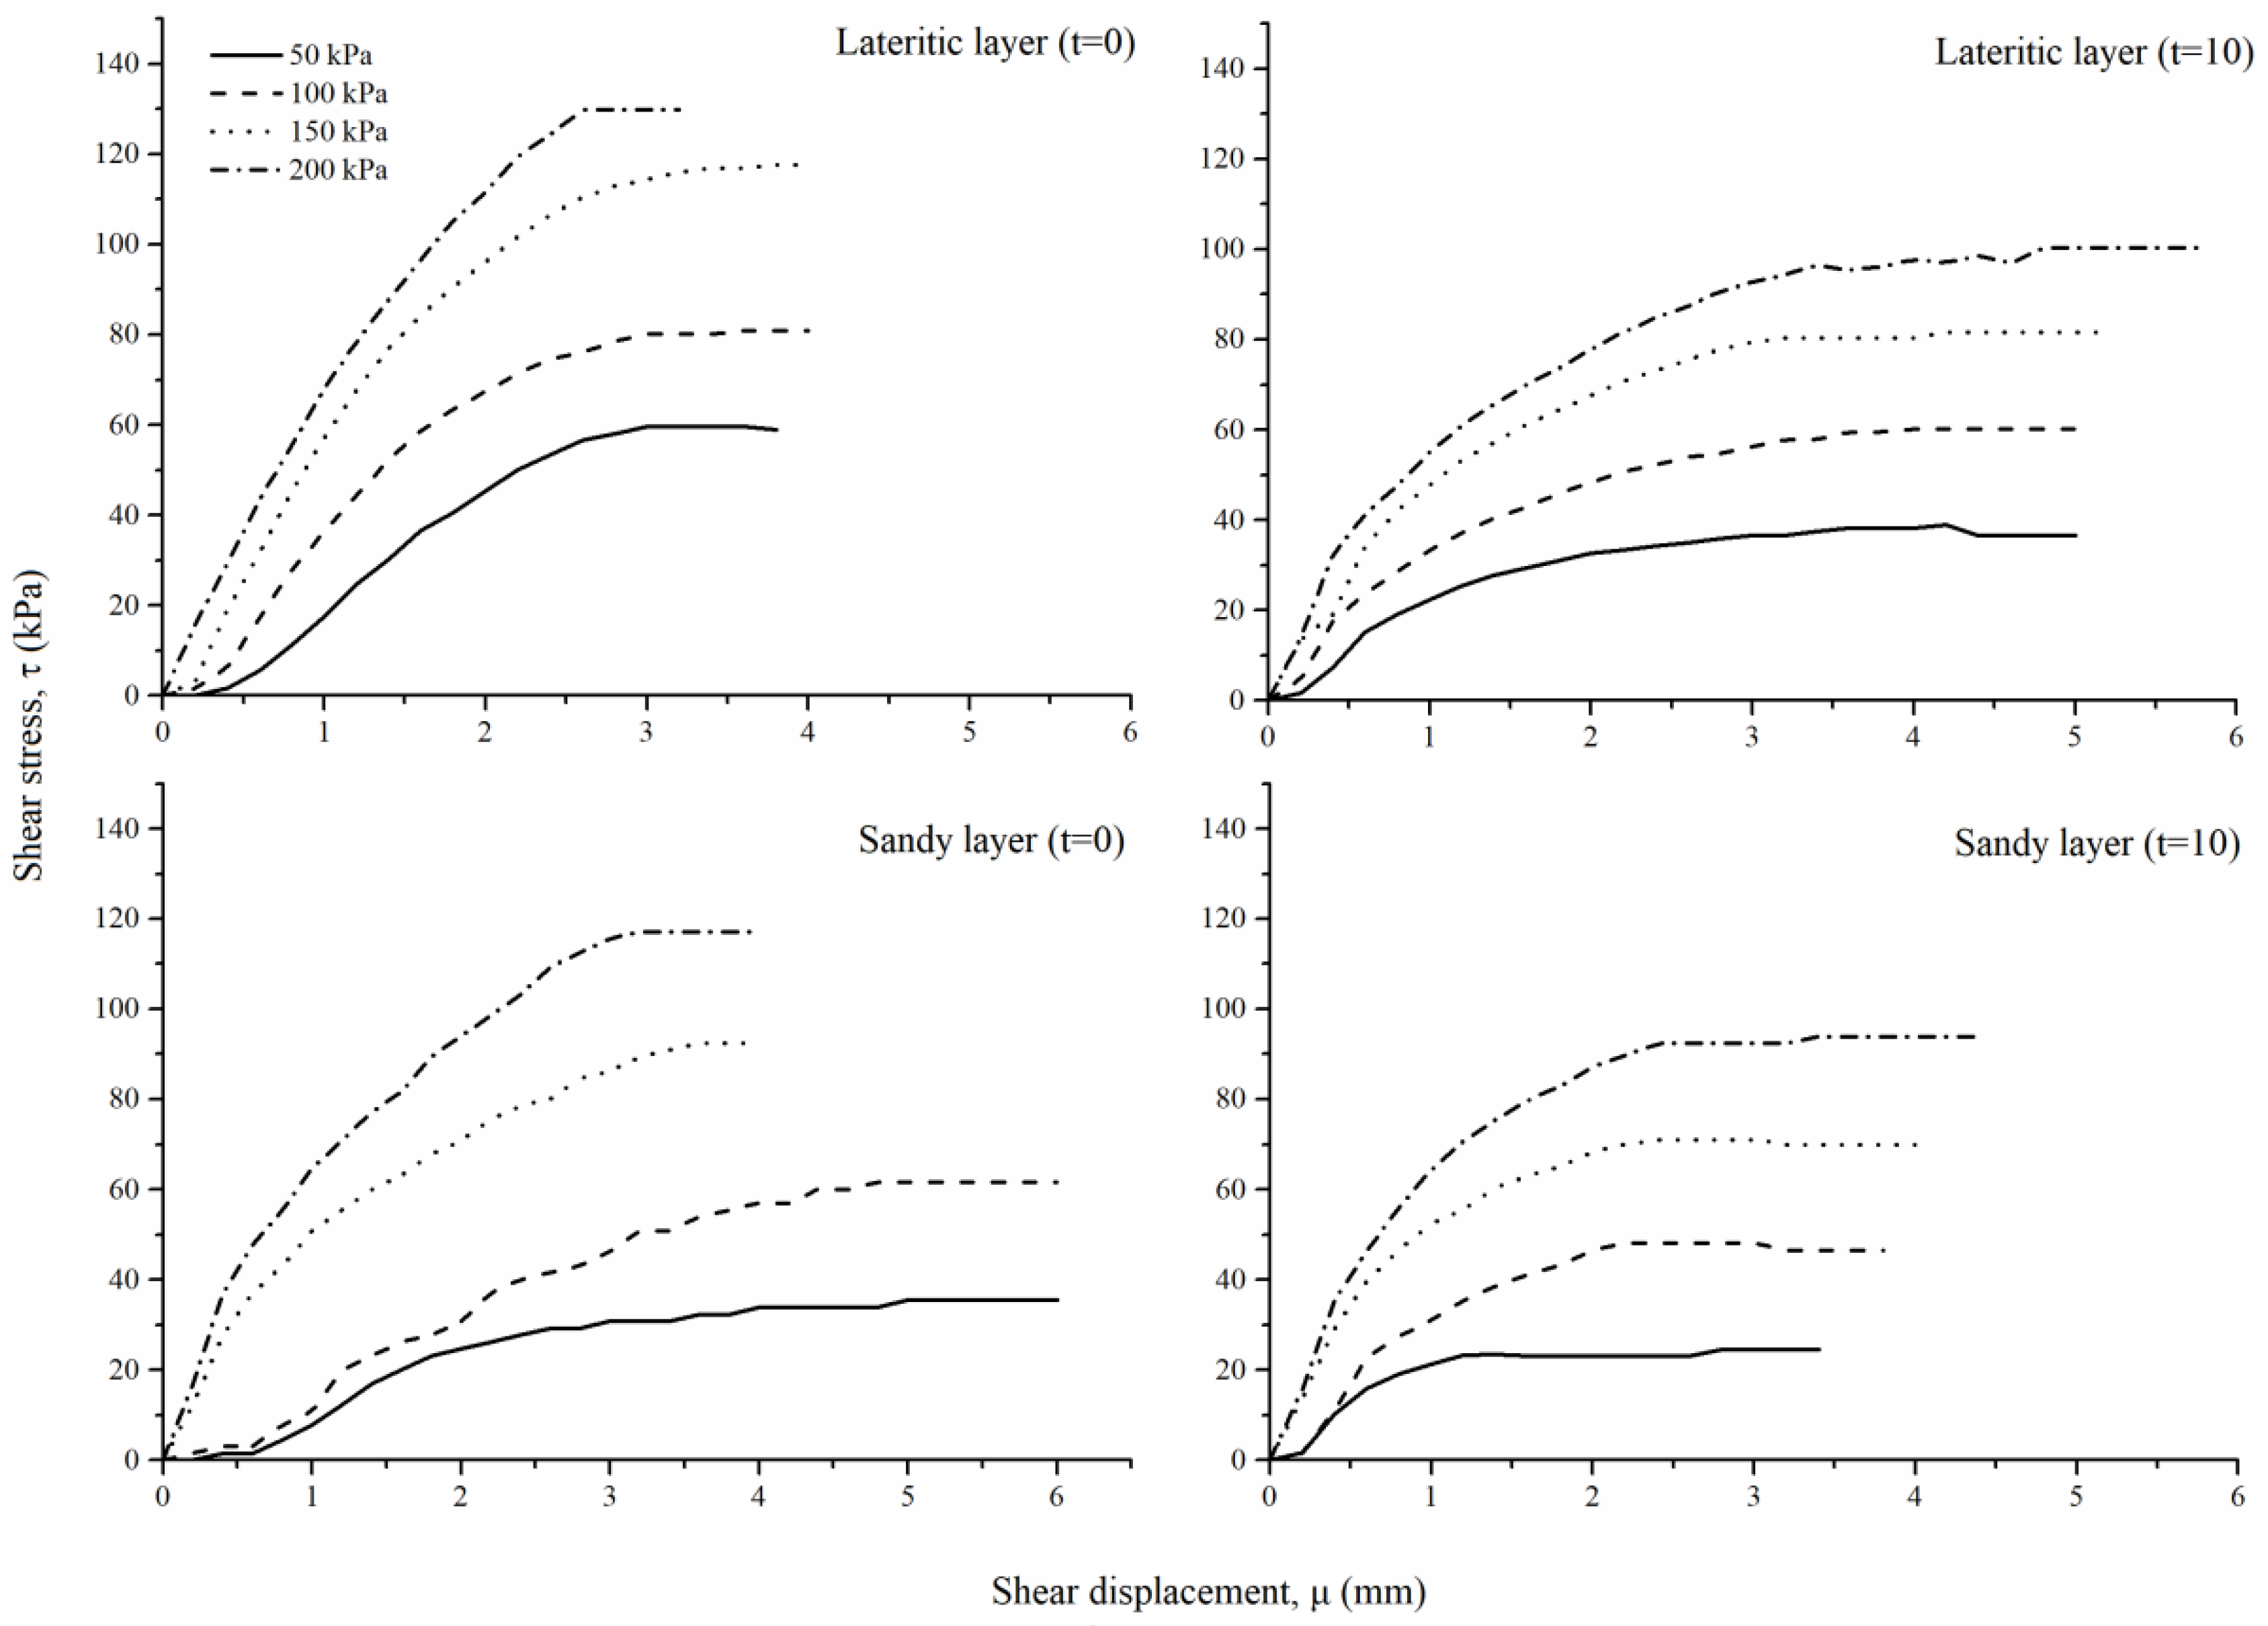
3.2. The Variation of Shear Strength Induced by W-D Cycles

The saturated shear strength for soils endured with different W-D cycles was evaluated. The results of typical direct shear test are shown in Figure 7. The stress–strain curves of granitic soils are roughly the strain-hardening type, and the peak of the curves is closely influenced by W-D cycles. The granitic soils show an obvious shear strength deterioration induced by W-D cycles, and decrease most after two cycles. Furthermore, the soils In the surface layer and lateritic layer show lower shear strengths than those in the sandy and detritus layer.
The cohesion strength ranging from 1.59 to 34.98 kPa decreased significantly from the surface to detritus layer when granitic residual soils suffered free from the W-D cycle (p < 0.05) (Table 4), and this decreasing trend was impacted barely by the W-D process. In addition, the influence of the W-D cycle on the variation in cohesion strength was greater for soils in the clay loam layers (surface and lateritic), e.g., the cohesion strength for soils in the lateritic layers decreased from 28.62 to 10.34 kPa after the tenth W-D cycle. Despite this, the decline in cohesion strength showed a decreasing trend with the increasing cycles of wetting and drying for all the tested soils, which was reflected by the less significant difference in cohesion strength for soils that endured the 5 to 10 W-D cycles. In comparison with cohesion strength, the friction angle increased consistently from the surface (24.15~27.40°) to detritus (32.72~35.10°) layers, and a less significant difference was observed among different numbers of W-D cycles. Obviously, the W-D cycle had a greater influence on cohesion strength than on the friction angle, and the cumulative reduction was in a range of 50~100% for cohesion and 6.78~15.12% for the friction angle.

3.3. The Variation in Disintegration Characteristic

The disintegration experienced a significant different process, especially for soils between the clay loam layers (surface and lateritic) and the sandy loam layers (sandy and detritus) (Figure 8). Except for soils in the surface layer, disintegration was triggered instantly at the initial stage of the disintegration process for soils in three other layers, with its maximum cumulative disintegration amount attaining 100% during the test. The disintegration process was divided into three parts: the static part at the initial stage, dramatic rise part and steady part. The proportion of these parts varied with pedogenic layers and W-D cycles. Here, the static part occupying more than 50% of the whole disintegration process was apparently observed for soils in the surface layer after the fifth W-D cycle, while this part was barely observed for soils in the lateritic layer after the fifth and tenth W-D cycle. After the static stage, the cumulative disintegration amount jumped from 0 to the maximum value and then remained at the steady stage. The time to attain the steady stage generally decreased with the increasing number of W-D cycles and the profile depth, i.e., it was around 20 and 15 min for soils in the surface and lateritic layers, but less than 2 and 1.2 min for soils in the sandy and detritus layers, respectively. Additionally, disintegration was influenced greater by W-D cycles for soils in the upper two layers than those in the sandy and detritus layers. The cumulative disintegration amount varied in a similar trend before the fifth W-D cycle for soils in the surface and lateritic layers, with its disintegration rate showing a less significant difference between 0 and 2 W-D cycles. Additionally, the maximum cumulative disintegration amount varied slightly for surface soils enduring 0 and 2 W-D cycles, with the same situation for surface and lateritic soils enduring 5 and 10 W-D cycles (p > 0.05), but a dramatic difference was observed for these soils when the frequency of W-D cycles increased from 2 to 5 (p < 0.01). In comparison with clay loam soils in the upper two layers, disintegration induced by W-D cycles varied in a relatively smooth trend for sandy loam soils in the sandy and detritus layers.

3.4. The Influence of W-D Cycles on the Collapsing Gully Erosion

Hydromechanical properties are very important for collapsing gully erosion, which is dominated by gravity erosion. Soil structure degradation, including physical, hydrological, and mechanical properties induced by W-D cycles, is helpful for a better understanding of the mechanism of collapsing gully erosion.
Many researchers have found that accumulated irreversible soil deformation or volume increase occurs during multiple W-D cycles [50,51,52,53], progressively leading to an increase in pore volume and average diameter. Moreover, the changes in the soil pore system were dominated by variations in large and macro pores during the sequences of W-D cycles [15,54]. Simultaneously, the ratio, width, and connectivity of cracks increased when soil was subjected to multiple sequences of W-D cycles [55]. These are all reasons that led to the increase in soil hydraulic conductivity. Additionally, the effective connection points between soil particles significantly decreased due to the presence of large soil pores or cracks, which may lead to the degradation of overall soil structure strength and stability. The loss of cement during wetting was also an important reason for the decreasing soil structure strength [43,56]. Furthermore, the extensive disintegration of soils with increasing W-D cycles may also decrease the soil strength [57].
The GLM analysis revealed a significant effect of soil layer and W-D cycles on soil parameters (Table 5). The granitic residual soils present a remarkable heterogeneity from the top to the bottom of the weathering profile (Table 2), and the influences of W-D cycles on soil structure are different due to the differences in clay mineralogy, organic matter, and particle-size distribution [57]. The clay loam soils in the upper two layers were more affected by W-D cycles than sandy loam soils in the sandy and detritus layers. Thus, the rainfall water would infiltrate faster and deeper due to the great increase in soil hydraulic conductivity induced by W-D cycles for the upper two layers. In addition, the lower soil layers (sandy soil layer and detritus layer) had relatively lower shear strength and disintegration resistance due to the loose structure, and shear strength decreased with increasing water content, especially for the lower soil layers [27,28]. Therefore, once the rainfall water infiltrates into the lower two soil layers, soil mass failure occurs. Furthermore, the decreasing shear strength and disintegration resistance increases the soil corrosion due to the W-D cycles. The thickness of the clay loam soils is gradually reduced due to soil runoff erosion, which also leads to the rainfall water infiltrating into the lower two soil layers in the long term. After the rainfall, the soil structure is further degraded due to soil shrinkage caused by evaporation at high temperature. A vicious cycle of granitic slope failure induced by W-D cycles is eventually formed.

4. Conclusions

The effects of W-D cycles on the structure of granitic residual soils present a remarkable heterogeneity from the top to the bottom of the weathering profile. The W-D cycles altered the soil pore structure, leading to variations in soil hydraulic properties, such as the decrease in initial saturated water content and residual water content, in contrast to the increase in saturated hydraulic conductivity with increasing alternating W-D cycles. W-D cycles made significant contributions to the variations of cohesion and internal friction strength, including the decrease in the shear strength variables with increasing W-D cycles, especially the soil cohesion strength. Disintegration was influenced more greatly by W-D cycles for soils in the upper two layers than those in the sandy and detritus layers. Furthermore, most degradation of soil structure was recorded within the first two cycles of W-D. The obtained results indicate that W-D cycles weaken soil structure, increase rainwater infiltration, decrease soil shear strength and disintegration resistance, and eventually lead to slope failure.

Author Contributions

Conceptualization, C.C. and X.L.; methodology, J.X. and J.W.; writing—original draft preparation, J.X.; writing—review and editing, Y.W., P.G., X.L. and L.Z.; funding acquisition, L.Z., Y.W. and C.C. All authors have read and agreed to the published version of the manuscript.

Funding

This research was funded by the National Natural Science Foundation of China (No. 41967012; No. 41807065; No. 41630858), the Water Conservancy Science and Technology Program of Jiangxi Province of China (No. 202223TGKT03; No. 202224ZDKT17) and China Postdoctoral Science Foundation (No. 2018 M640714).

Data Availability Statement

The data that support the findings of this study are available from the corresponding authors upon reasonable request.

Acknowledgments

The authors thank Deqian Zhang, Jie Hu, Je He, and Hao Lu for their help.

Conflicts of Interest

There are no conflicts of interest among the authors and the journal.

References

  1. Borrelli, P.; Robinson, D.A.; Fleischer, L.R.; Lugato, E.; Ballabio, C.; Alewell, C.; Bagarello, V. An assessment of the global impact of 21st century land use change on soil erosion. Nat. Commun. 2017, 8, 2013. [Google Scholar] [CrossRef] [PubMed]
  2. Xu, J.X. Benggang erosion: The influencing factors. Catena 1996, 27, 249–263. [Google Scholar]
  3. Xia, D.; Deng, Y.S.; Wang, S.; Ding, S.W.; Cai, C.F. Fractal features of soil particle-size distribution of different weathering profiles of the collapsing gullies in the hilly granitic region, south China. Nat. Hazards 2015, 79, 455–478. [Google Scholar] [CrossRef]
  4. Luk, S.H.; Yao, Q.Y.; Gao, J.Q.; Zhang, J.Q.; He, Y.G.; Huang, S.M. Environmental analysis of soil erosion in guangdong province: A deqing case study. Catena 1997, 29, 97–113. [Google Scholar] [CrossRef]
  5. Moretti, S.; Rodolfi, G. A typical “calanchi” landscape on the Eastern Apennine margin (Atri, Central Italy): Geomorphological features and evolution. Catena 2000, 40, 217–228. [Google Scholar] [CrossRef]
  6. Bacellar, L.P.; Coelho Netto, A.L.; Lacerda, W.A. Controlling factors of gullying in the Maracujá catchment, southeastern Brazil. Earth Surf. Proc. Land. 2005, 30, 1369–1385. [Google Scholar] [CrossRef]
  7. Cox, R.; Zentner, D.B.; Rakotondrazafy, A.F.M.; Rasoazanamparany, C.F. Shakedown in Madagascar: Occurrence of lavakas (erosional gullies) associated with seismic activity. Geology 2010, 38, 179–182. [Google Scholar] [CrossRef]
  8. Kalkan, E. Impact of wetting-drying cycles on swelling behavior of clayey soils modified by silica fume. Appl. Clay Sci. 2011, 52, 345–352. [Google Scholar] [CrossRef]
  9. Estabragh, A.R.; Moghadas, M.; Javadi, A.A. Effect of different types of wetting fluids on the behaviour of expansive soil during wetting and drying. Soils Found. 2013, 53, 617–627. [Google Scholar] [CrossRef]
  10. He, Y.; Cui, Y.J.; Ye, W.M.; Conil, N. Effects of wetting-drying cycles on the air permeability of compacted Téguline clay. Eng. Geol. 2017, 228, 173–179. [Google Scholar] [CrossRef]
  11. Wang, C.; Zhang, Z.Y.; Yang, L.; Fan, S.M. Geometric and fractal analysis of dynamic cracking patterns subjected to wetting-drying cycles. Soil Tillage Res. 2017, 170, 1–13. [Google Scholar] [CrossRef]
  12. Uday, K.V.; Singh, D.N. Investigation on cracking characteristics of fine-grained soils under varied environmental conditions. Dry. Technol. 2013, 31, 1255–1266. [Google Scholar] [CrossRef]
  13. Tisdall, J.M.; Cockcraft, B.; Uren, N.C. The stability of soil aggregates as affected by organ materials, microbial activity and physical disruption. Aust. J. Soil Res. 1978, 16, 9–17. [Google Scholar] [CrossRef]
  14. Pagliai, M.; La Marca, M.; Lucamenta, G. Changes in soil porosity in remolded soils treated with poultry manure. Soil Sci. 1987, 144, 128–140. [Google Scholar] [CrossRef]
  15. Pires, L.F.; Cooper, M.; Cássaro, F.A.M.; Reichardt, K.; Bacchi, O.O.S.; Dias, N.M.P. Micromorphological analysis to characterize structure modifications of soil samples submitted to wetting and drying cycles. Catena 2008, 72, 297–304. [Google Scholar] [CrossRef]
  16. Wheeler, S.J.; Sharma, R.S.; Buisson, M.S.R. Coupling of hydraulic hysteresis and stress-strain behavior in unsaturated soils. Géotechnique 2003, 53, 41–54. [Google Scholar] [CrossRef]
  17. Alonso, E.E.; Romero, E.; HoFFmann, C.; Carcia Escudero, E. Expansive bentonite-sand mixtures in cyclic controlled-suction drying and wetting. Eng. Geol. 2005, 8, 213–226. [Google Scholar] [CrossRef]
  18. Tang, C.S.; Cui, Y.J.; Shi, B.; Tang, A.M.; Liu, C. Desiccation and cracking behavior of clay layer from slurry state under wetting-drying cycles. Geoderma 2011, 166, 111–118. [Google Scholar] [CrossRef]
  19. Wei, Y.J.; Wu, X.L.; Cai, C.F. Spatial variability of soil shrinkage characteristics in profile of slope disintegration body. Trans. Chin. Soc. Agric. Mach. 2015, 46, 153–159. [Google Scholar]
  20. Wei, Y.J.; Wu, X.L.; Li, X.Y.; Xia, J.W.; Cai, C.F. A novel and facile method for characterizing shrinkage geometry along the granite soil profile. Soil Sci. Soc. Am. J. 2018, 82, 20–30. [Google Scholar] [CrossRef]
  21. Liao, Y.; Yuan, Z.; Zheng, M.; Li, D.; Nie, X.; Wu, X.; Huang, B.; Xie, Z.; Tang, C. The spatial distribution of Benggang and the factors that influence it. Land Degrad. Dev. 2019, 30, 2323–2335. [Google Scholar] [CrossRef]
  22. Deng, Y.S.; Duan, X.Q.; Ding, S.W.; Cai, C.F. Effect of joint structure and slope direction on the development of collapsing gully in tuffaceous sandstone area in South China. Int. Soil Water Conserv. Res. 2020, 8, 131–140. [Google Scholar] [CrossRef]
  23. Huang, J.H.; Jiang, D.J.; Deng, Y.S.; Ding, S.W.; Cai, C.F.; Huang, Z.G. Soil Physicochemical properties and fertility evolution of permanent gully during ecological restoration in granite hilly region of South China. Forests 2022, 12, 510. [Google Scholar] [CrossRef]
  24. Jiang, F.S.; Huang, Y.H.; Wang, M.K.; Lin, J.S.; Zhao, G.; Ge, H.L. Effects of Rainfall Intensity and Slope Gradient on Steep Colluvial Deposit Erosion in Southeast China. Soil Sci. Soc. Am. J. 2014, 78, 1741–1752. [Google Scholar] [CrossRef]
  25. Liao, Y.; Yuan, Z.; Zhuo, M.; Huang, B.; Nie, X.; Xie, Z.; Tang, C.; Li, D. Coupling effects of erosion and surface roughness on colluvial deposits under continuous rainfall. Soil Tillage Res. 2019, 191, 98–107. [Google Scholar] [CrossRef]
  26. Tao, Y.; He, Y.B.; Duan, X.Q.; Zou, Z.Q.; Lin, L.R.; Chen, J.Z. Preferential flows and soil moistures on a Benggang slope: Determined by the water and temperature co-monitoring. J. Hydrol. 2017, 553, 678–690. [Google Scholar] [CrossRef]
  27. Wei, Y.J.; Wu, X.L.; Xia, J.W.; Miller, G.A.; Cai, C.F.; Guo, Z.L.; Arash, H. The effect of water content on the shear strength characteristics of granite soils in South China. Soil Tillage Res. 2019, 187, 50–59. [Google Scholar] [CrossRef]
  28. Xia, J.W.; Cai, C.F.; Wei, Y.J.; Wu, X.L. Granite residual properties in collapsing gullies of south China: Spatial variations and effects on collapsing gully erosion. Catena 2019, 174, 469–477. [Google Scholar] [CrossRef]
  29. Liu, X.Y.; Zhang, X.W.; Kong, L.W.; Wang, G.; Liu, H.H. Formation mechanism of collapsing gully in southern China and the relationship with granite residual soil: A geotechnical perspective. Catena 2022, 210, 105890. [Google Scholar] [CrossRef]
  30. Chinese Academy of Science Flora of China Editorial Board. Flora of China; Science Press: Beijing, China, 2004. [Google Scholar]
  31. IUSS Working Group WRB. World Reference Base for Soil Resources 2014. In International Soil Classification System for Naming Soils and Creating Legends for Soil Maps; World Soil Resources Reports No. 106; FAO: Rome, Italy, 2014. [Google Scholar]
  32. Institute of Soil Science, the Chinese Academy of Science (ISSCAS). Soil Chemical and Physical Analysis; Shanghai Science and Technology Press: Shanghai, China, 1981. [Google Scholar]
  33. ASTM D698; Standard Test Methods for Laboratory Compaction Characteristics of Soil Using Standard Effort. ASCE Journal of Geotechnical Engineering: Reston, VA, USA, 2000; Volume 111, pp. 465–478.
  34. ASTM. Standard Test Methods for Classification of Soil for Engineering Purposes. Annu. Books Geoenviron. Eng. 1992, 127, 67–75. [Google Scholar]
  35. Zhu, F.; Li, Y.B.; Xue, S.G.; Hartley, W.; Wu, H. Effects of iron-aluminium oxides and organic carbon on aggregate stability of bauxite residues. Environ. Sci. Pollut. Res. 2016, 23, 9073. [Google Scholar] [CrossRef]
  36. Goldreich, O.; Goldwasser, Y.; Mishael, Y. Effect of soil wetting and drying cycles on metolachlor ate in soil applied as a commercial or controlled-release formulation. J. Agric. Food Chem. 2011, 59, 645–653. [Google Scholar] [CrossRef]
  37. ASTM D6838-02; Standard Test Methods for Determination of the Soil Water Characteristic Curve for Desorption Using Hanging Column, Pressure Extractor, Chilled Mirror Hygrometer, or Centrifuge. Annual Book of ASTM Standards: West Conshohocken, PA, USA, 2008.
  38. Khanzode, R.M.; Vanapalli, S.K.; Fredlund, D.G. Measurement of soil-water characteristic curves for fine-grained soils. Can. Geotech. J. 2002, 39, 1209–1217. [Google Scholar] [CrossRef] [Green Version]
  39. Genuchten, M.T.V. A closed-form equation for predicting the hydraulic conductivity of unsaturated soils. Soil Sci. Soc. Am. J. 1980, 44, 892–898. [Google Scholar] [CrossRef]
  40. Radulovich, R.; Solorzano, E.; Sollins, P. Soil Macropore Size Distribution from Water Breakthrough Curves. Soil Sci. Soc. Am. J. 1989, 53, 556–559. [Google Scholar] [CrossRef]
  41. Watson, K.W.; Luxmoore, R.J. Estimating Macroporosity in a Forest Watershed by use of a Tension Infiltrometer 1. Soil Sci. Soc. Am. J. 1986, 50, 578–582. [Google Scholar] [CrossRef]
  42. Terzaghi, K. The shear resistance of saturated soils. In Proceedings of the 1st International Conference Soil Mechanics Foundation Engineering, Cambridge, MA, USA, 22–26 June 1936; Volume 1, pp. 54–56. [Google Scholar]
  43. Zhang, Z.Z.; Liu, W.; Han, L.; Chen, X.C.; Cui, Q.; Yao, H.; Wang, Z.L. Disintegration behavior of strongly weathered purple mudstone in drawdown area of three gorges reservoir, China. Geomorphology 2018, 315, 68–79. [Google Scholar] [CrossRef]
  44. Zhang, S.; Tang, M.H. Experimental study of disintegration mechanism for unsaturated granite residual soil. Rock Soil Mech. 2013, 34, 1668–1673. (In Chinese) [Google Scholar]
  45. Kong, L.; Sayem, H.; Tian, H.H. Influence of drying-wetting cycles on soil-water characteristic curve of undisturbed granite residual soils and microstructure mechanism by NMR T2 relaxometry. Can. Geotech. J. 2017, 55, 208–216. [Google Scholar] [CrossRef]
  46. Schwen, A.; Bodner, G.; Scholl, P.; Buchan, G.D.; Loiskandl, W. Temporal dynamics of soil hydraulic properties and the water-conducting porosity under different tillage. Soil Tillage Res. 2011, 113, 89–98. [Google Scholar] [CrossRef]
  47. Boynton, S.S.; Daniel, D.E. Hydraulic conductivity tests on compacted clay. J. Geotech. Eng. 1985, 111, 465–478. [Google Scholar] [CrossRef]
  48. Albrecht, B.A.; Benson, C.H. Effect of desiccation on compacted natural clays. J. Geotech. Geoenviron. Eng. 2001, 127, 67–75. [Google Scholar] [CrossRef]
  49. Peng, X.H.; Horn, R. Anisotropic shrinkage and swelling of some organic and inorganic soils. Eur. J. Soil Sci. 2007, 58, 98–107. [Google Scholar] [CrossRef]
  50. Pires, L.F.; Bacchi, O.O.; Reichardt, K. Gamma ray computed tomography to evaluate wetting/drying soil structure changes. Nucl. Instr. Meth. Phys. Res. B 2005, 229, 443–456. [Google Scholar] [CrossRef]
  51. Nowamooz, H.; Masrouri, F. Hydromechanical behaviour of an expansive bentonite-silt mixture in cyclic suction-controlled drying and wetting tests. Eng. Geol. 2008, 101, 154–164. [Google Scholar] [CrossRef]
  52. Nowamooz, H.; Mrad, M.; Abdallah, A.; Masrouri, F. Experimental and numerical studies of the hydromechanical behaviour of a natural unsaturated swelling soil. Can. Geotech. J. 2009, 46, 393–410. [Google Scholar] [CrossRef]
  53. Chen, R.; Ng, C.W.W. Impact of wetting-drying cycles on hydro-mechanical behavior of an unsaturated compacted clay. Appl. Clay Sci. 2013, 86, 38–46. [Google Scholar] [CrossRef]
  54. Sartori, G.; Ferrari, G.A.; Pagliai, M. Changes in soil porosity and surface shrinkage in a remolded, saline clay soil treated with compos. Soil Sci. 1985, 139, 523–530. [Google Scholar] [CrossRef]
  55. Lu, Z.H.; Chen, Z.H.; Pu, Y.B. A CT study on the crack evolution of expansive soil during drying and wetting cycles. Rock Soil Mech. 2002, 23, 417–422. [Google Scholar]
  56. Zhang, D.; Chen, A.Q.; Liu, G.C. Laboratory investigation of disintegration characteristics of purple mudstone under different hydrothermal conditions. J. Mt. Sci. 2012, 9, 127–136. [Google Scholar] [CrossRef]
  57. Tang, C.S.; Wang, D.Y.; Shi, B.; Li, J. Effect of wetting-drying cycles on profile mechanical behavior of soils with different initial conditions. Catena 2016, 139, 105–116. [Google Scholar] [CrossRef]
Figure 1. A typical collapsing gully in the hilly granitic regions of southern China.
Forests 13 01426 g001
Figure 2. Location of sampling site Tongcheng County (C), Hubei Province (B), China (A).
Forests 13 01426 g002
Figure 3. Schematic of disintegration tests. 1. Floating cylinder: graduated cylinder with a measuring range of 250 mL and minimum scale of 2 mL; 2. metallic meshy plate: the size is 10 cm × 10 cm; the grid aperture is 1 cm × 1 cm; it is connected to the floating cylinder with a thin thread; 3. glass flume: the size is 25 cm (width) × 25 cm (length) × 80 cm (height), and it is filled with pure water; 4. soil sample.
Forests 13 01426 g003
Figure 4. Soil water characteristic curves of experimental soils under W-D cycles (ad) represent soil water characteristic curves of experimental soils of surface layer, lateritic layer, sandy layer and detritus layer, respectively.
Forests 13 01426 g004
Figure 5. Equivalent diameter distributions of soil pore ratio for granitic soils during W-D cycles. For the same range of equivalent diameter and soil layer, different letters (a–c) indicates significant differences (p < 0.05) between different numbers of W-D cycles.
Forests 13 01426 g005
Figure 6. Saturated hydraulic conductivity of experimental soils. For the same soil layer, different letters (a,b) indicate significant differences (p < 0.05) between different numbers of W-D cycles.
Forests 13 01426 g006
Figure 7. The typical stress–strain curves of experimental soils under W-D cycles.
Forests 13 01426 g007
Figure 8. The disintegration process of experimental soils under W-D cycles. (ad), represent the disintegration process of experimental soils of surface layer, lateritic layer, sandy layer and detritus layer, respectively.
Forests 13 01426 g008
Table 1. Basic information about the selected soil layers.
Soil LayerThic-ness
(cm)
Soil ColorSoil StructureSoil Description
WetDry
Surface layer0~452.5YR 6/65YR 6/6Granular, loose structureHigh organic matter content and biological activity with a large number of roots and plant residues; high hydraulic conductivity; heavy texture with residual quartz sand; high weathering degree; clay minerals, mainly including kaolinite and illite; high cohesion and resistance to water erosion
Lateritic layer45~1702.5YR 4/45YR 5/8Platy, massive dense structureHeavy texture with fewer macropores and low hydraulic conductivity; high weathering degree; clay minerals mainly including kaolinite and illite; highest cohesion and resistance to water erosion; without root and biological activity
Sandy layer170~4307.5YR 5/47.5YR 7/4Crumb, pseudogranular structureLight texture with a large amount of primary minerals (quartz sand and biotite); medium hydraulic conductivity; low weathering degree; low cohesion and resistance to water erosion
Detritus layer>4302.5YR 8/210YR 8/1Fragmental, tight structureLight texture with much coarse quartz sand and biotite; very low weathering degree; medium hydraulic conductivity; similar configuration to granite rock; low cohesion and resistance to water erosion
Note: The soil color was described by Chinese standard soil color card.
Table 2. Physicochemical properties of experimental soils.
ParametersSurface LayerLateritic LayerSandy LayerDetritus Layer
Clay, %34.80 ± 0.56 d45.50 ± 0.39 c14.29 ± 0.12 b9.71 ± 0.12 a
Silt, %23.71 ± 0.57 c23.98 ± 0.67 c28.46 ± 1.09 b31.69 ± 1.16 a
Sand, %41.49 ± 1.13 b30.52 ± 1.13 a57.24 ± 0.97 c58.60 ± 1.27 c
Bulk desity, g cm−31.25 ± 0.01 c1.43 ± 0.03 a1.37 ± 0.01 b1.34 ± 0.02 b
Total porosity, %50.97 ± 1.97 a46.42 ± 1.03 c47.41 ± 0.98 bc50.45 ± 1.16 ab
Capillary porosity, %40.37 ± 1.85 a40.92 ± 0.62 a39.09 ± 2.35 a39.63 ± 0.50 a
Liquid limit, %59.73 ± 1.22 a52.32 ± 1.87 b36.52 ± 0.92 c32.28 ± 0.78 d
Plastic limit, %36.88 ± 0.70 a30.77 ± 1.46 b21.35 ± 0.92 c23.43 ± 0.66 c
SOM, g kg−118.62 ± 0.61 a10.64 ± 0.16 b4.35 ± 0.21 c1.66 ± 0.07 d
Fed, g kg−118.34 ± 0.77 b20.19 ± 0.55 a6.22 ± 0.27 c4.95 ± 0.16 d
Ald, g kg−15.83 ± 0.14 a5.37 ± 0.29 b2.30 ± 0.16 c1.35 ± 0.06 d
Vermiculite, %2000
1.4 nm, %0200
Illite, %5468
Kaolinite, %93949492
Soil textureClay loamclaySandy loamSandy loam
Note: For each parameter, different letters (a–d) indicate significant differences (p < 0.05) between different soil layers.
Table 3. The soil water characteristic curve parameters fitted by the van Genuchten (1980) model for experimental soils under W-D cycles [39].
Soil LayerW-D Cyclesθs
(cm3 cm−3)
θr
(cm3 cm−3)
αnR2
Surface layer00.406 ± 0.016 a0.195 ± 0.012 a0.034 ± 0.005 a1.188 ± 0.012 a0.998 ***
20.372 ± 0.034 b0.174 ± 0.013 b0.046 ± 0.004 b1.177 ± 0.008 b0.999 ***
50.349 ± 0.030 c0.169 ± 0.023 b0.048 ± 0.007 b1.169 ± 0.013 bc0.998 ***
100.348 ± 0.022 c0.166 ± 0.015 b0.050 ± 0.005 b1.168 ± 0.007 c0.997 ***
Lateritic layer00.394 ± 0.012 a0.182 ± 0.028 a0.021 ± 0.003 a1.218 ± 0.011 a0.997 ***
20.352 ± 0.015 b0.163 ± 0.016 b0.030 ± 0.006 b1.197 ± 0.010 b0.996 ***
50.334 ± 0.013 bc0.157 ± 0.011 c0.031 ± 0.004 b1.193 ± 0.005 b0.996 ***
100.332 ± 0.010 c0.154 ± 0.008 c0.031 ± 0.010 b1.194 ± 0.009 b0.995 ***
Sandy layer00.392 ± 0.022 a0.116 ± 0.017 a0.070 ± 0.007 a1.254 ± 0.013 a0.999 ***
20.372 ± 0.024 b0.109 ± 0.026 b0.079 ± 0.005 b1.253 ± 0.011 ab0.999 ***
50.363 ± 0.035 b0.103 ± 0.009 bc0.081 ± 0.004 b1.256 ± 0.007 bc0.999 ***
100.361 ± 0.017 b0.099 ± 0.014 c0.082 ± 0.008 b1.260 ± 0.011 c0.999 ***
Detritus layer00.383 ± 0.011 a0.102 ± 0.021 a0.056 ± 0.010 a1.311 ± 0.009 a0.999 ***
20.367 ± 0.026 b0.090 ± 0.011 b0.056 ± 0.008 b1.330 ± 0.006 b0.999 ***
50.361 ± 0.019 b0.087 ± 0.010 c0.056 ± 0.007 bc1.336 ± 0.013 bc0.997 ***
100.357 ± 0.021 b0.083 ± 0.022 c0.057 ± 0.002 c1.341 ± 0.010 c0.997 ***
Note: for the same parameter and soil layer, different letters (a–c) indicate significant differences (p < 0.05) between different W-D cycles. *** indicates that the fitting equation is significantly at 99% confidence level.
Table 4. Shear strength of experimental soils under W-D cycles.
Soil Layer02510
C (KPa)φ (°)C (KPa)φ (°)C (KPa)φ (°)C (KPa)φ (°)
Surface layer34.98 ± 1.23 a27.40 ± 1.53 a24.65 ± 1.21 b25.94 ± 1.23 b19.88 ± 0.96 bc25.35 ± 1.36 b17.49 ± 0.93 c24.15 ± 1.92 b
Lateritic layer28.62 ± 0.96 a24.91 ± 1.04 a16.70 ± 1.37 b23.08 ± 1.40 ab12.72 ± 1.01 bc21.84 ± 2.05 b10.34 ± 0.62 c21.68 ± 0.74 b
Sandy layer7.16 ± 0.52 a31.94 ± 1.83 a3.18 ± 0.27 b29.51 ± 0.83 b0.80 ± 0.02 c28.25 ± 1.43 bc0.00 ± 0.00 c27.11 ± 2.03 c
Detritus layer1.59 ± 0.72 a35.10 ± 1.30 a0.00 ± 0.00 b33.86 ± 1.04 b0.00 ± 0.00 b33.48 ± 1.68 b0.00 ± 0.00 b32.72 ± 1.90 b
Note: for the same shear strength parameter and soil layer; different letters (a–c) indicate significant differences (p < 0.05) between different W-D cycles.
Table 5. p values from the general linear model (GLM) to test the influence of soil layer and W-D cycles and their interaction on the soil parameters.
θs
(cm3 cm−3)
θr
(cm3 cm−3)
αnKs
(cm min−1)
C
(KPa)
φ
(°)
Soil layer0.610.01 *0.02 *0.04 *0.570.00 **0.03 *
W-D cycles0.03 *0.00 **0.01 *0.02 *0.00*0.00 ***0.04 *
Soil layer × W-D cycles0.97 *0.03 *0.04 *0.050.950.00 **0.85
Note: * significant different at the 0.05 level; ** significant different at the 0.01 level; *** significant different at the 0.001 level.
Publisher’s Note: MDPI stays neutral with regard to jurisdictional claims in published maps and institutional affiliations.

