Article

Evaluation of Plant Growth and Potential of Carbon Storage in the Restored Mangrove of an Abandoned Pond in Lubuk Kertang, North Sumatra, Indonesia

by
Rizka Amelia
1,2,
Mohammad Basyuni
1,2,*,
Alfinsyahri Alfinsyahri
2,
Nurdin Sulistiyono
1,2,
Bejo Slamet
1,2,
Yuntha Bimantara
1,2,
Salma Safrina Hashilah Harahap
1,2,
Mikrajni Harahap
1,2,
Insar Maulid Harahap
2,
Shofiyah Sabilah Al Mustaniroh
1,
Sigit D. Sasmito
3 and
Virni Budi Arifanti
4
1
Center of Excellence for Mangrove, Universitas Sumatera Utara, Medan 20155, Indonesia
2
Department of Forestry, Faculty of Forestry, Universitas Sumatera Utara, Kampus USU 2 Bekala, Deli Serdang 20353, Indonesia
3
Environmental Research Institute, National University of Singapure (NUS), 21 Lower Kent Ridge Road, Singapore 119077, Singapore
4
Research Center for Ecology and Ethnobiology, National Research and Innovation Agency, Cibinong 16911, Indonesia
*
Author to whom correspondence should be addressed.
Submission received: 3 December 2022 / Revised: 7 January 2023 / Accepted: 9 January 2023 / Published: 15 January 2023
(This article belongs to the Special Issue Biomass Estimation and Carbon Stocks in Forest Ecosystems)

Abstract

:
Mangrove forest in Lubuk Kertang Village, West Brandan sub-district has been converted around 20 ha annually (1996–2016) into various non-forest land use. Rehabilitation can be a solution to restore the condition of the ecosystem so that it can resume its ecological and economic functions. This paper discusses the evaluation of mangrove rehabilitation carried out by planting 6000 propagules in December 2015 and 5000 seedlings in May 2016 with Rhizophora apiculata species in abandoned ponds. Monitoring was carried out every 6 months from 2016 to 2022. In the restored area, 11 true mangrove species and 3 associated mangrove species were found. The percentage of plants that survived after seven years was 69.42% for planting using propagules and 86.38% for planting with seedlings. The total biomass carbon stocks stored by 7-year-old plants using propagules was 51.18 Mg ha−1, while the carbon stored by planting using seedlings was 56.79 Mg ha−1. Soil carbon stocks at the planted site with propagules were 506.89 ± 250.74 MgC ha−1, and at the planted site with seedlings were 461.85 ± 102.23 MgC ha−1. The total ecosystem carbon stocks (including aboveground carbon) in the planted site using propagules were 558.07 MgC ha−1, while planting using seedlings were 518.64 MgC ha−1. The dataset and findings on the carbon storage evaluation of mangrove rehabilitation will be useful for blue carbon research community and policymakers in the context of the climate change mitigation strategy for Indonesia.

1. Introduction

Mangrove forests are coastal habitats that dominate the intertidal zone in tropical and subtropical coastal areas [1,2]. Mangroves have highly important roles for coastal ecological functions and economic source for coastal livelihoods, and their high carbon stocks are substantial for climate change mitigation. In this regard, although mangroves constitute only 0.5% of the global coastal area, this ecosystem can store three to five times more carbon than other types of terrestrial forests or about 300 Mg ha−1 to over 1023 Mg ha−1 [3,4,5,6].
In 2020, Indonesia had 2.7 Mha of mangrove forests that are spread over 34 provinces [7]. Mangrove forests in Indonesia, which are located in Sumatra, are generally found in the areas of Asahan, Batubara, Deli Serdang, Tangjung Balai, Nias, Labuhanbatu, and Serdang Bedagai to Langkat Regency. In 1990, the area of mangrove forests in North Sumatra was 59,645.79 ha, where the deforestation rate was 1.51% per year [8]. Recent data shows that the area of mangroves in North Sumatra was recorded to be 66,873 ha in 2000, to 57,010 ha in 2022 [7]. Specifically, the mangrove forest located in Lubuk Kertang Village, Brandan Barat District, continues to experience degradation and forest conversion. The area of the damaged mangrove forests in this area reached 740 ha of a total of 1200 ha, with area of critical degraded mangrove forest status was up to 528 ha.
Previous restoration studies have showed the impact of mangrove restoration on carbon stocks; for example, in the iconic Westgate bridge restoration forest in Melbourne in southeastern Australia, the age of the mangroves had a significant effect on carbon stocks ranging from 30 ± 5 MgC ha−1 in the youngest stands (13 years) to 94 ± 4 MgC ha−1 in the oldest forest (35 years) [9]. In the restored mangrove forest of Hau Loc, North-Central Vietnam, the average above and below-ground C stock of this forest ranges from 12.7 ± 2.4 Mg ha−1 to 107 ± 10.7 Mg ha−1 [10]
Carbon dioxide and methane (CH4} emissions from the conversion or degradation of mangroves are a major contributor to global greenhouse gas emissions [11,12,13]. Thus, preventing mangrove loss and restoring degraded mangroves are valuable strategies for climate change mitigation [14,15]. Most of the current mangrove restoration and rehabilitation programs in Indonesia including in Lubuk Kertang landscape are commonly implemented for the carbon storage benefit, despite many past restoration initiatives implemented for coastal protection including from coastal erossion and tsunami impacts [16,17]. During and after the 2004 tsunami, mangrove restoration received much attention in Indian Ocean countries (Sri Lanka, Thailand and Indonesia) because of the strong link between mangrove loss and tsunami damage [18,19,20,21].
The degradation of mangrove forests have a negative impact on the livelihoods of fishermen around the area of Lubuk Kertang, including the decrease of fish and shellfish stocks and water pollution increase. Therefore, efforts are needed to rehabilitate the degraded mangroves, especially at the unproductive and abandoned ponds. Restoring the degraded mangrove lands may become one of the potential solutions to enhance ecosystem recovery in this landscape [22,23].
The present work was aimed to evaluate mangrove growth and to monitor the forest structure and carbon stocks of rehabilitated mangrove forests in the abandoned ponds in Lubuk Kertang, North Sumatra, Indonesia. Overall, our data set will be important and assist policymakers in Indonesia via the incorporation of mangrove conservation and restoration for climate change mitigation strategies, in particular to meet the unconditional national carbon emission reduction target of 29% by 2030 as stated in the Contribution Nationally Determined (NDC) as part of the Paris Agreement [24].

2. Materials and Methods
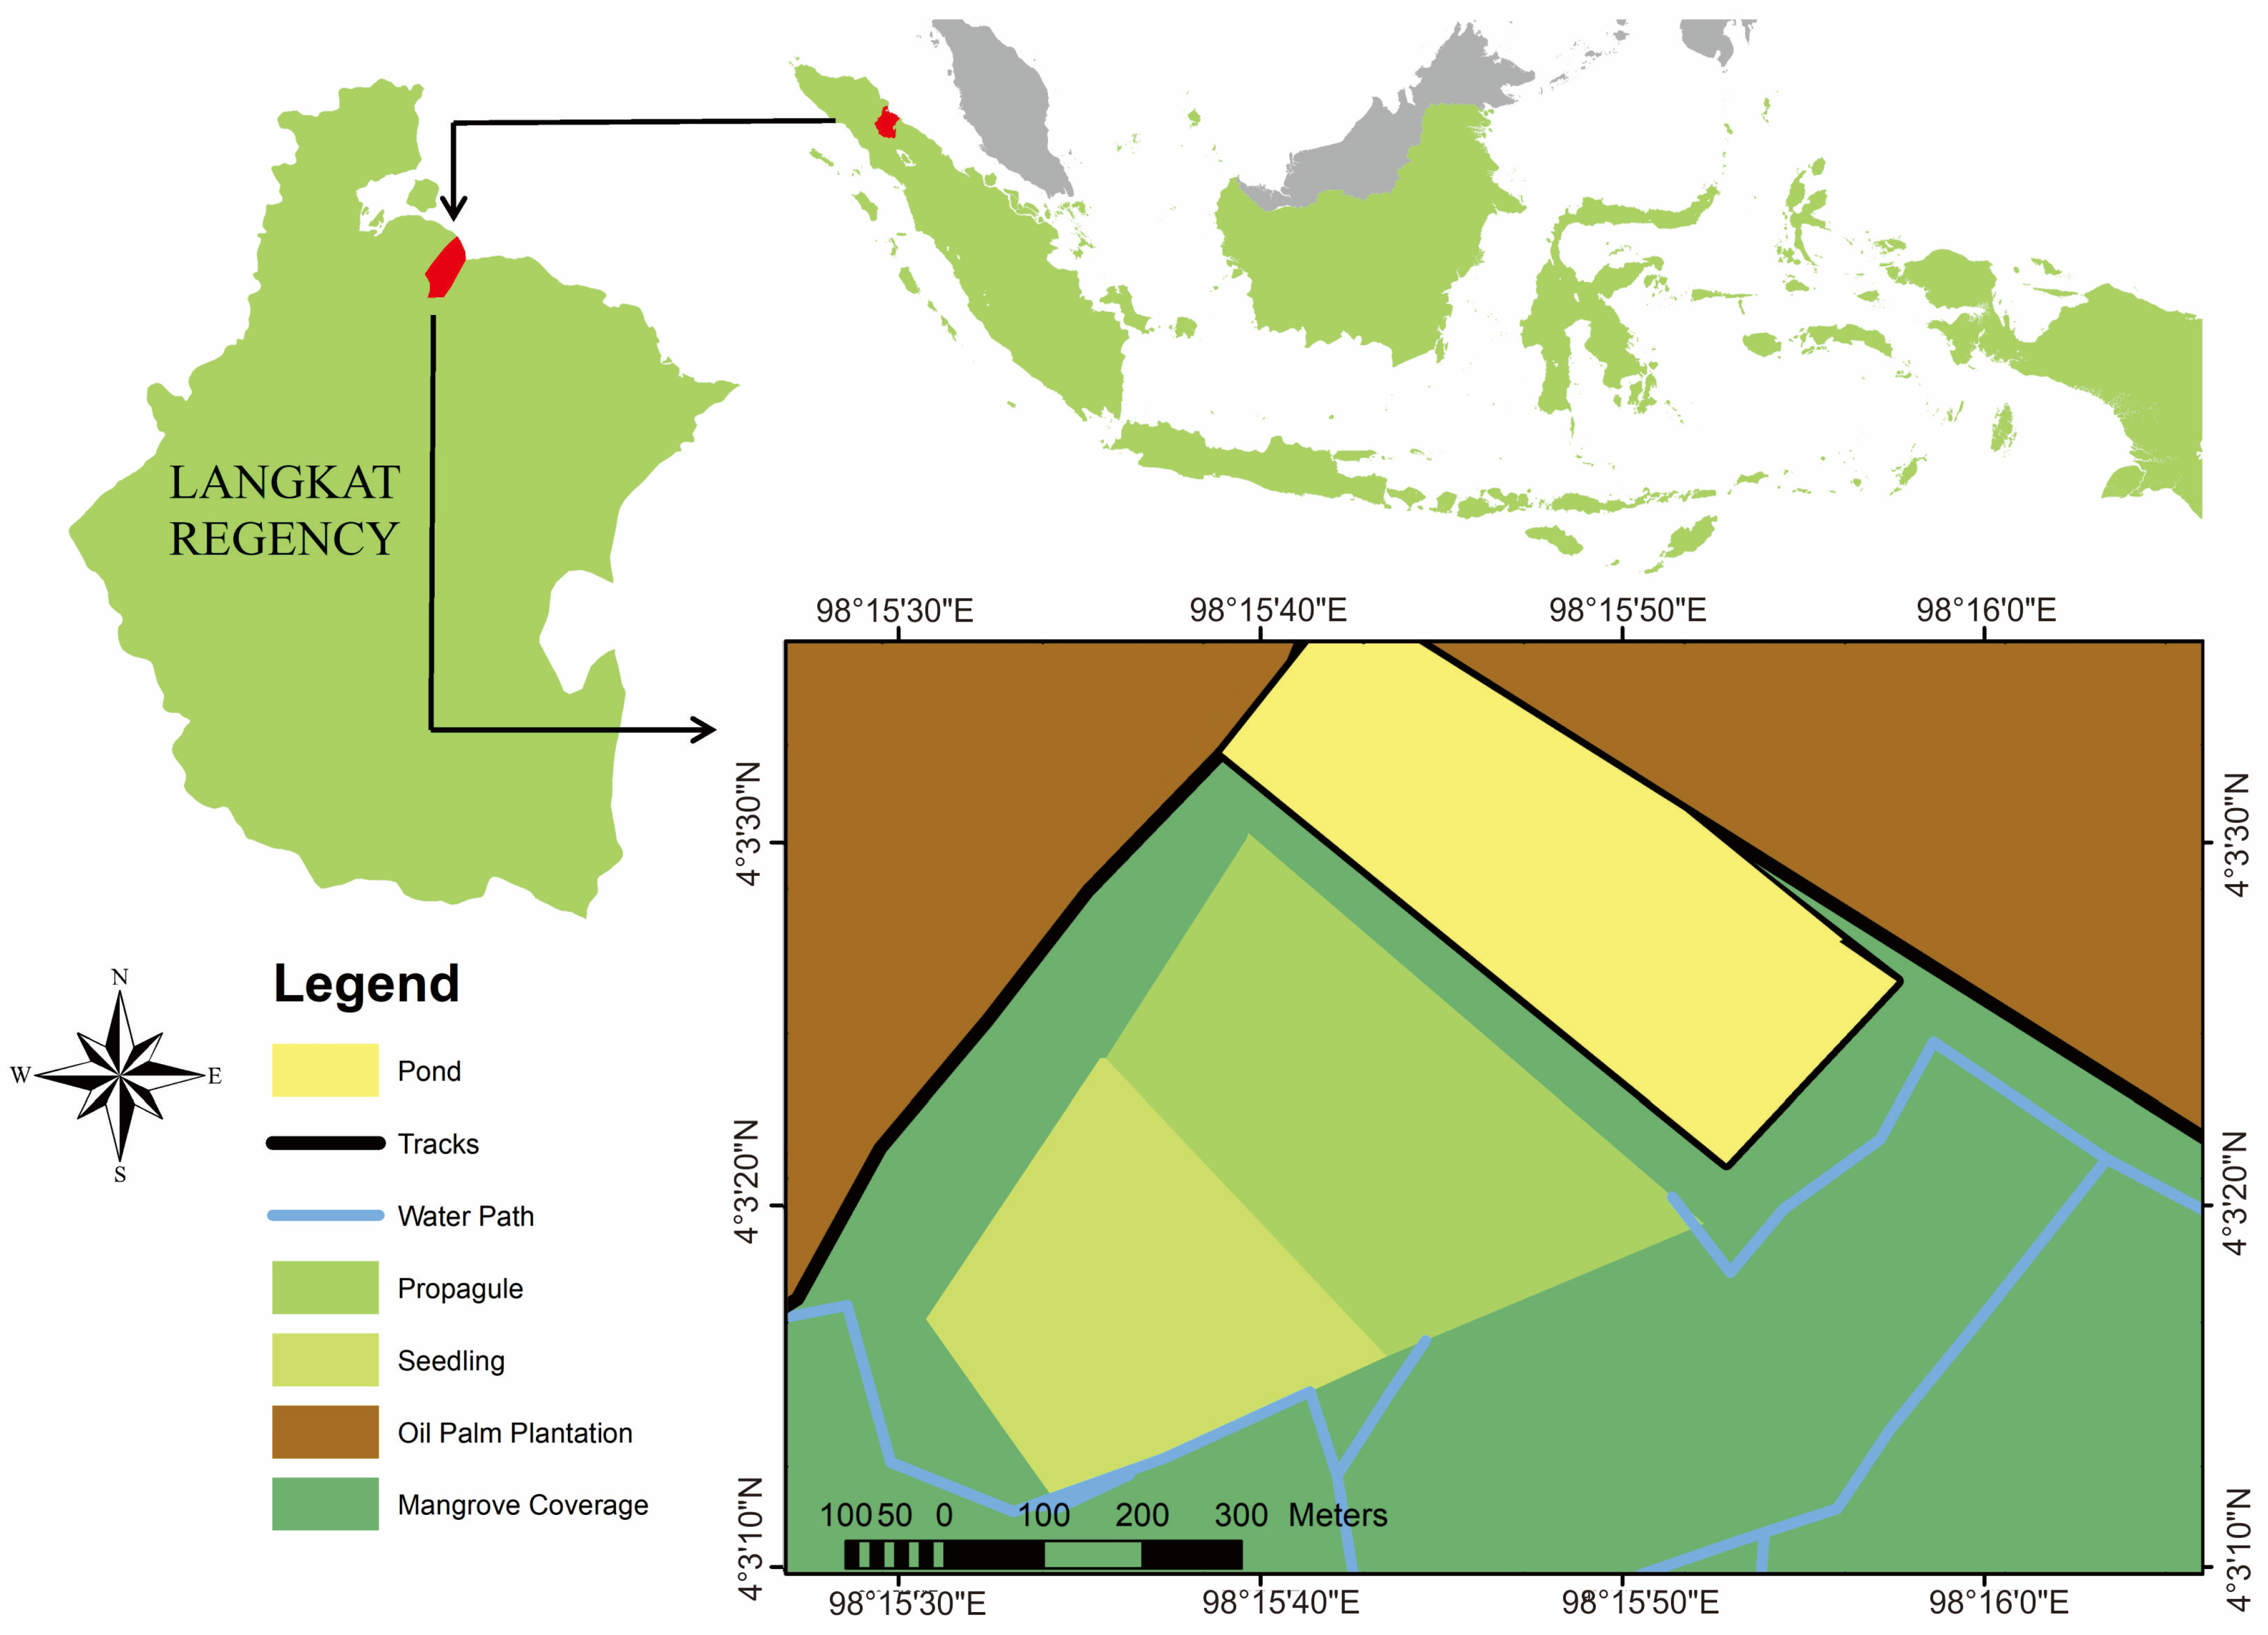
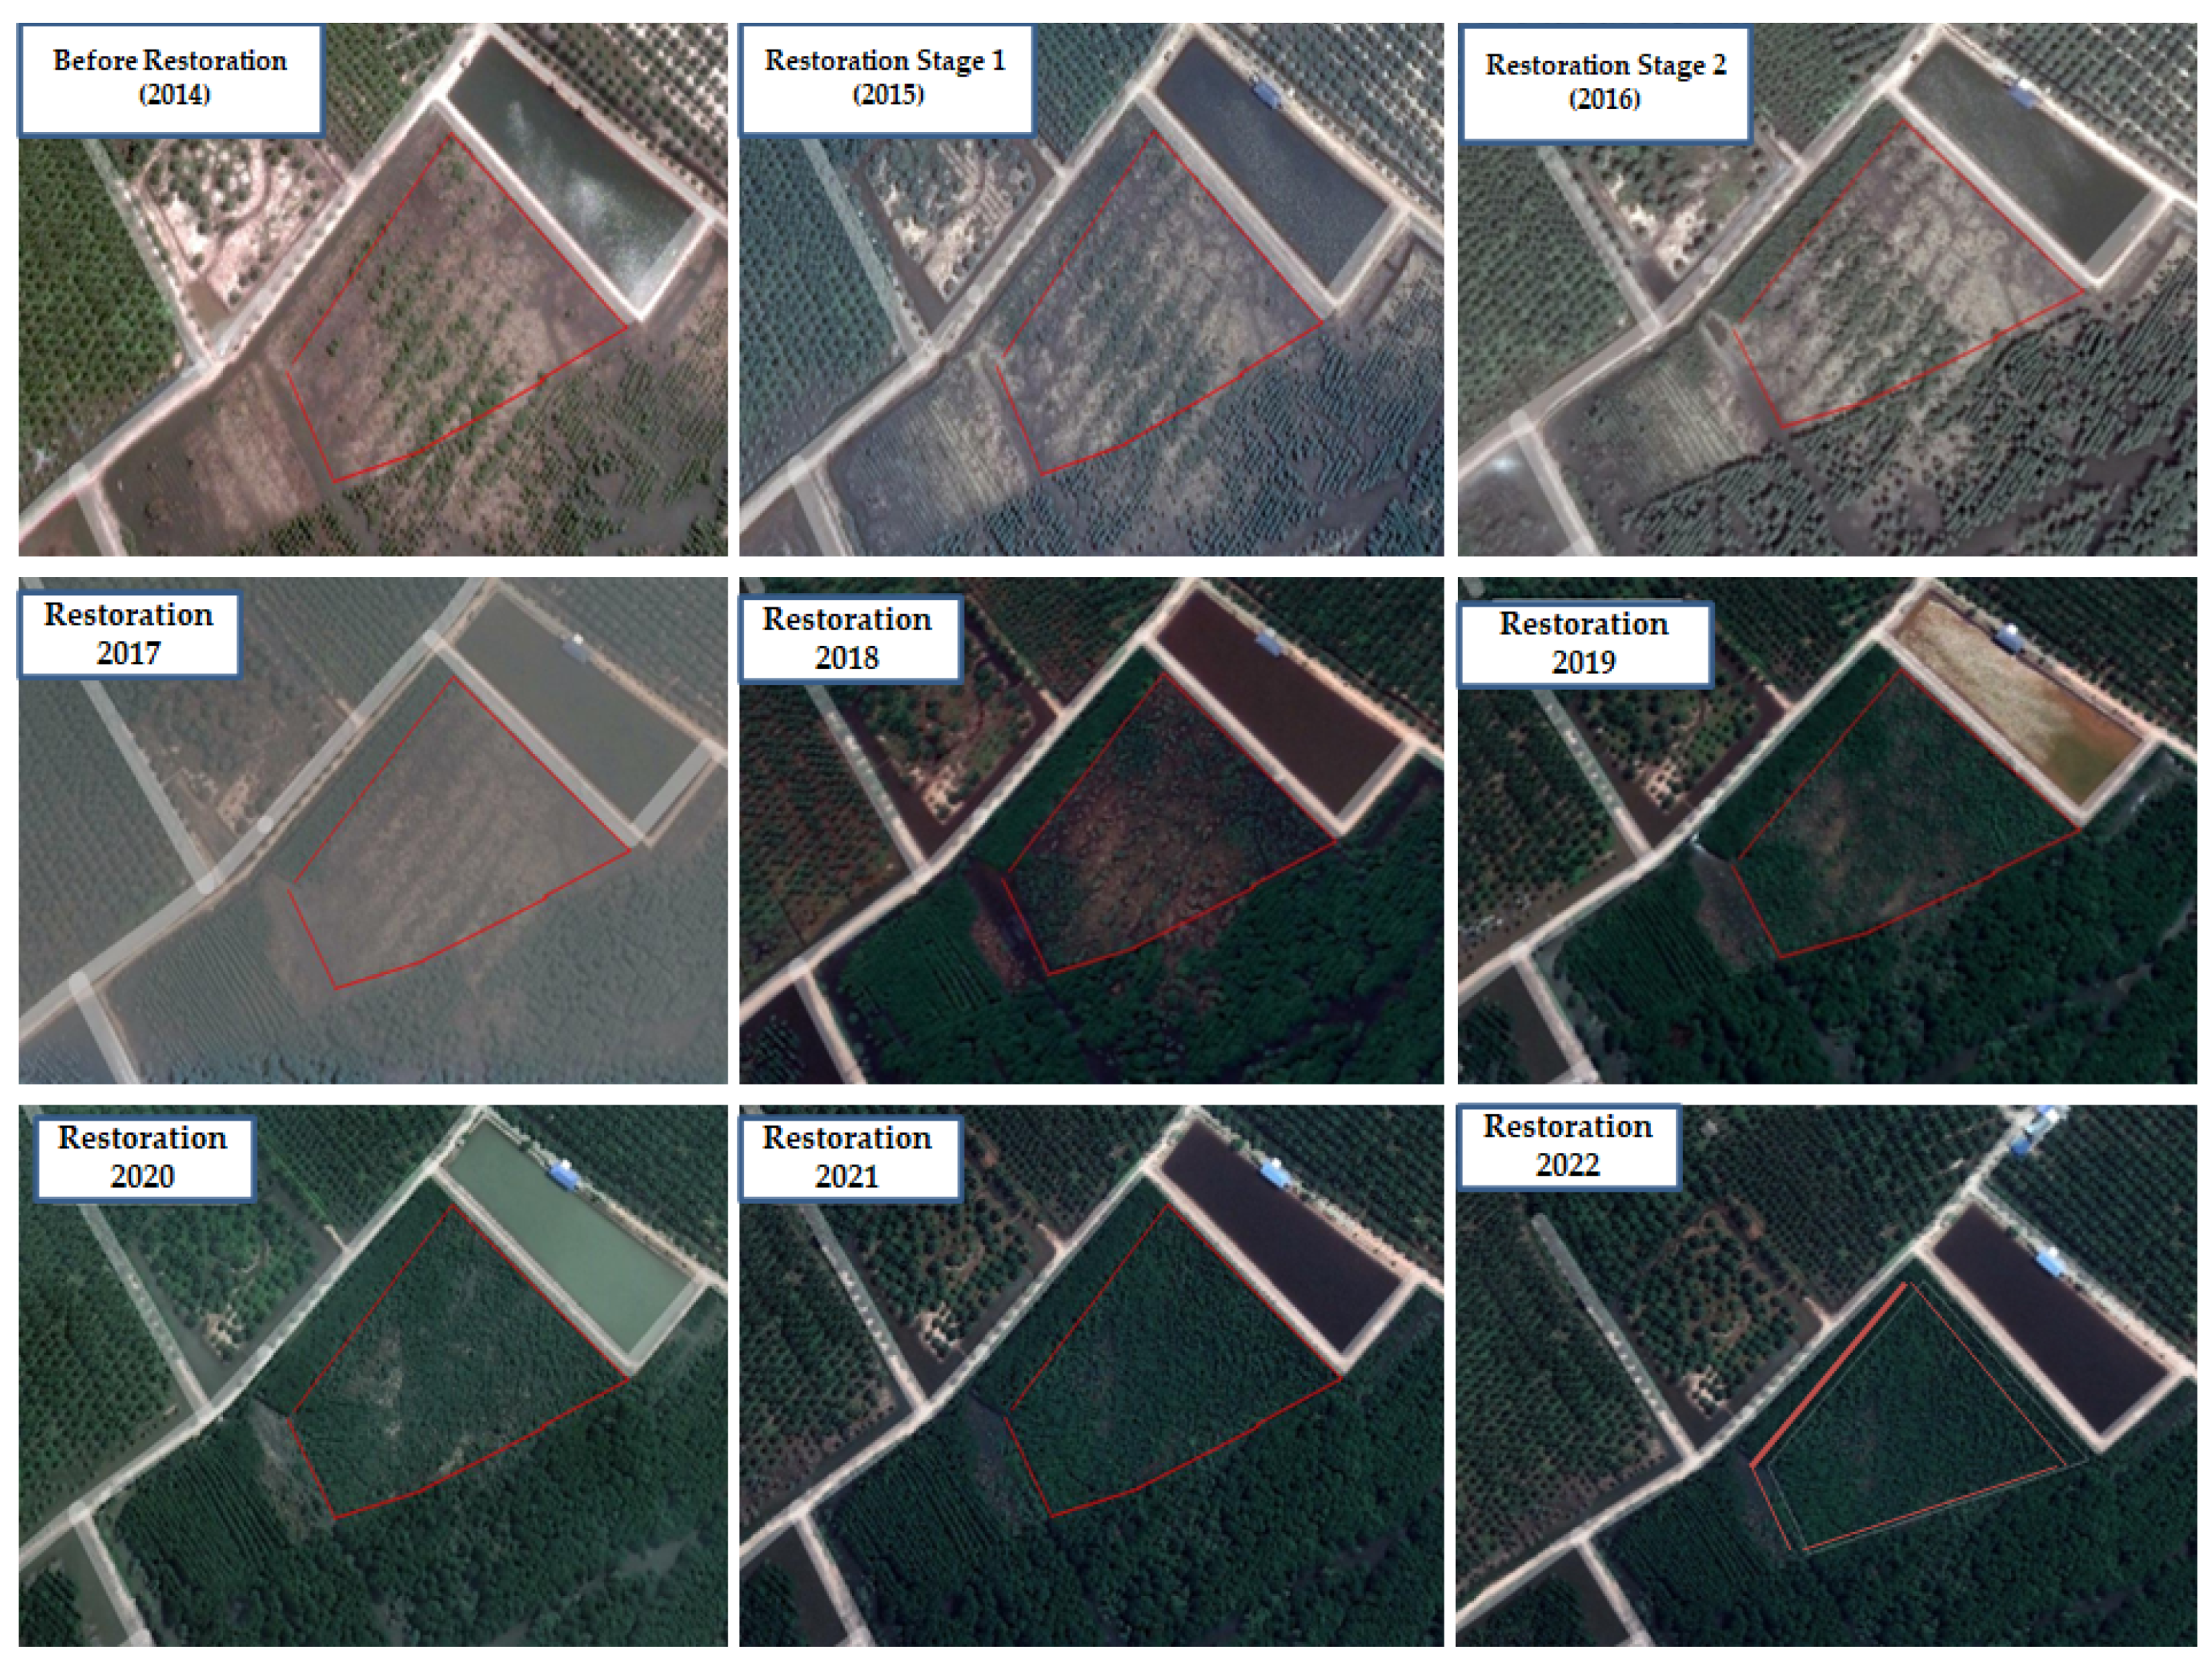
2.1. Study Area

This research was conducted in a mangrove forest rehabilitation area at the Center of excellence for Mangrove (PUI-Pusat Unggulan Iptek Mangrove), Universitas Sumatera Utara, in Lubuk Kertang Village, West Brandan District, Langkat Regency, North Sumatra Province, which is located between 4°3′10″–4°3′35″ N; 98°15′30″–98°15′55″ E (Figure 1 and Figure 2). Planting was carried out in two stages on abandoned pond land with an area of 1.6 ha. The first stage was conducted in December 2015, with a direct seeding method of 6000 propagules. The second stage was conducted in May 2016, using a total of 5000 seedlings planted. The plant Rhizophora apiculata was chosen because around the restored area, there is a secondary forest that is dominated by R. apiculata, making it easier to collect propagules. R. apiculata is a pioneer species with a fairly high survival rate [25].

2.2. Data Collection

Data collection was carried out using two methods as follows: (1) making sample plots and (2) conducting a census by taking an inventory of all restoration areas. Data collection was conducted in eight sample plots (four plots using plants from propagules and four plots from nurseries) of 10 × 10 m in each sample plot with a total of 800 plants. The first measurement was carried out when the plants were 6 months old, and subsequent measurements were carried out every six months until the plants turned 48 months old (Figure 3). The parameters observed included diameter, which was calculated 10 cm from the ground level for the first measurement (marked for each plant sample, so that it is consistent every time the next diameter measurement is taken); height; leaf thickness, which was measured using a caliper by measuring the first 3 leaves on each branch; number of leaves, percentage of life; pests; and diseases. In the fourth, sixth, and seventh years (2019–2022), the census method was employed by measuring all plants in the rehabilitation area, and the parameters observed were the plant species, diameter at breast height (DBH), and height. Individual characteristics were classified into seedling (1.5 m height), sapling (height > 1.5 m, DBH < 5.0 cm), and tree (DBH > 5 cm) [26]. However, in 2021, census measurements could not be carried out due to an increase in the cases of the Delta COVID-19 variant in Indonesia, including in North Sumatra.

2.3. Vegetation Structure

2.3.1. Diversity Index (H′)

To show structural diversity, the Shannon–Wiener diversity index (H′) was used:
H = i = 1 s Pi   ln   Pi  
where, Pi is ni/N (Ni is the number of individuals of a species, and N is the total number of individuals of a species). When the value of H′ is 0–1, it indicates low/little species diversity. When the value of H′ is 1–3, it indicates medium species diversity, and when the value of H′ is greater than 3, it indicates high species diversity. According to Shannon Wiener, the higher the value of diversity indicates higher quality and functionally of the ecosystem [27].

2.3.2. Evenness Index (E)

Evenness is the composition of the number of individuals of each genus in the community. The Evenness index used in this study is based on the Shannon-Wiener function, which to obtain the distribution of macrozoobenthos species in the plantation area [27].
To uniformity index (E) was calculated by using the following formula:
E = H H   max
where E is the number of types; H′ is the Shannon–Wiener diversity index; and Ln is the experience logarithms. The value of Evenness in the population ranges from 0 to 1 with the following criteria [16]: E > 0.6 indicates high Evenness; 0.4 < E < 0.6 indicates medium Evenness; and E < 0.4 indicates low Evenness.

2.3.3. Dominance Index (D)

The dominance index is used to obtain information about the dominant family in a community, and it is calculated using Simpson’s formula as follows [27]:
D = i = 1 s ( n i N ) 2
where, ni is the number of individuals of a species, and N is the number of individuals of all species. The criteria for this index are as follows [24]: when the value of D is close to 0, it indicates that no type is dominant, and when the value of D is close to 1, there is a dominant type.

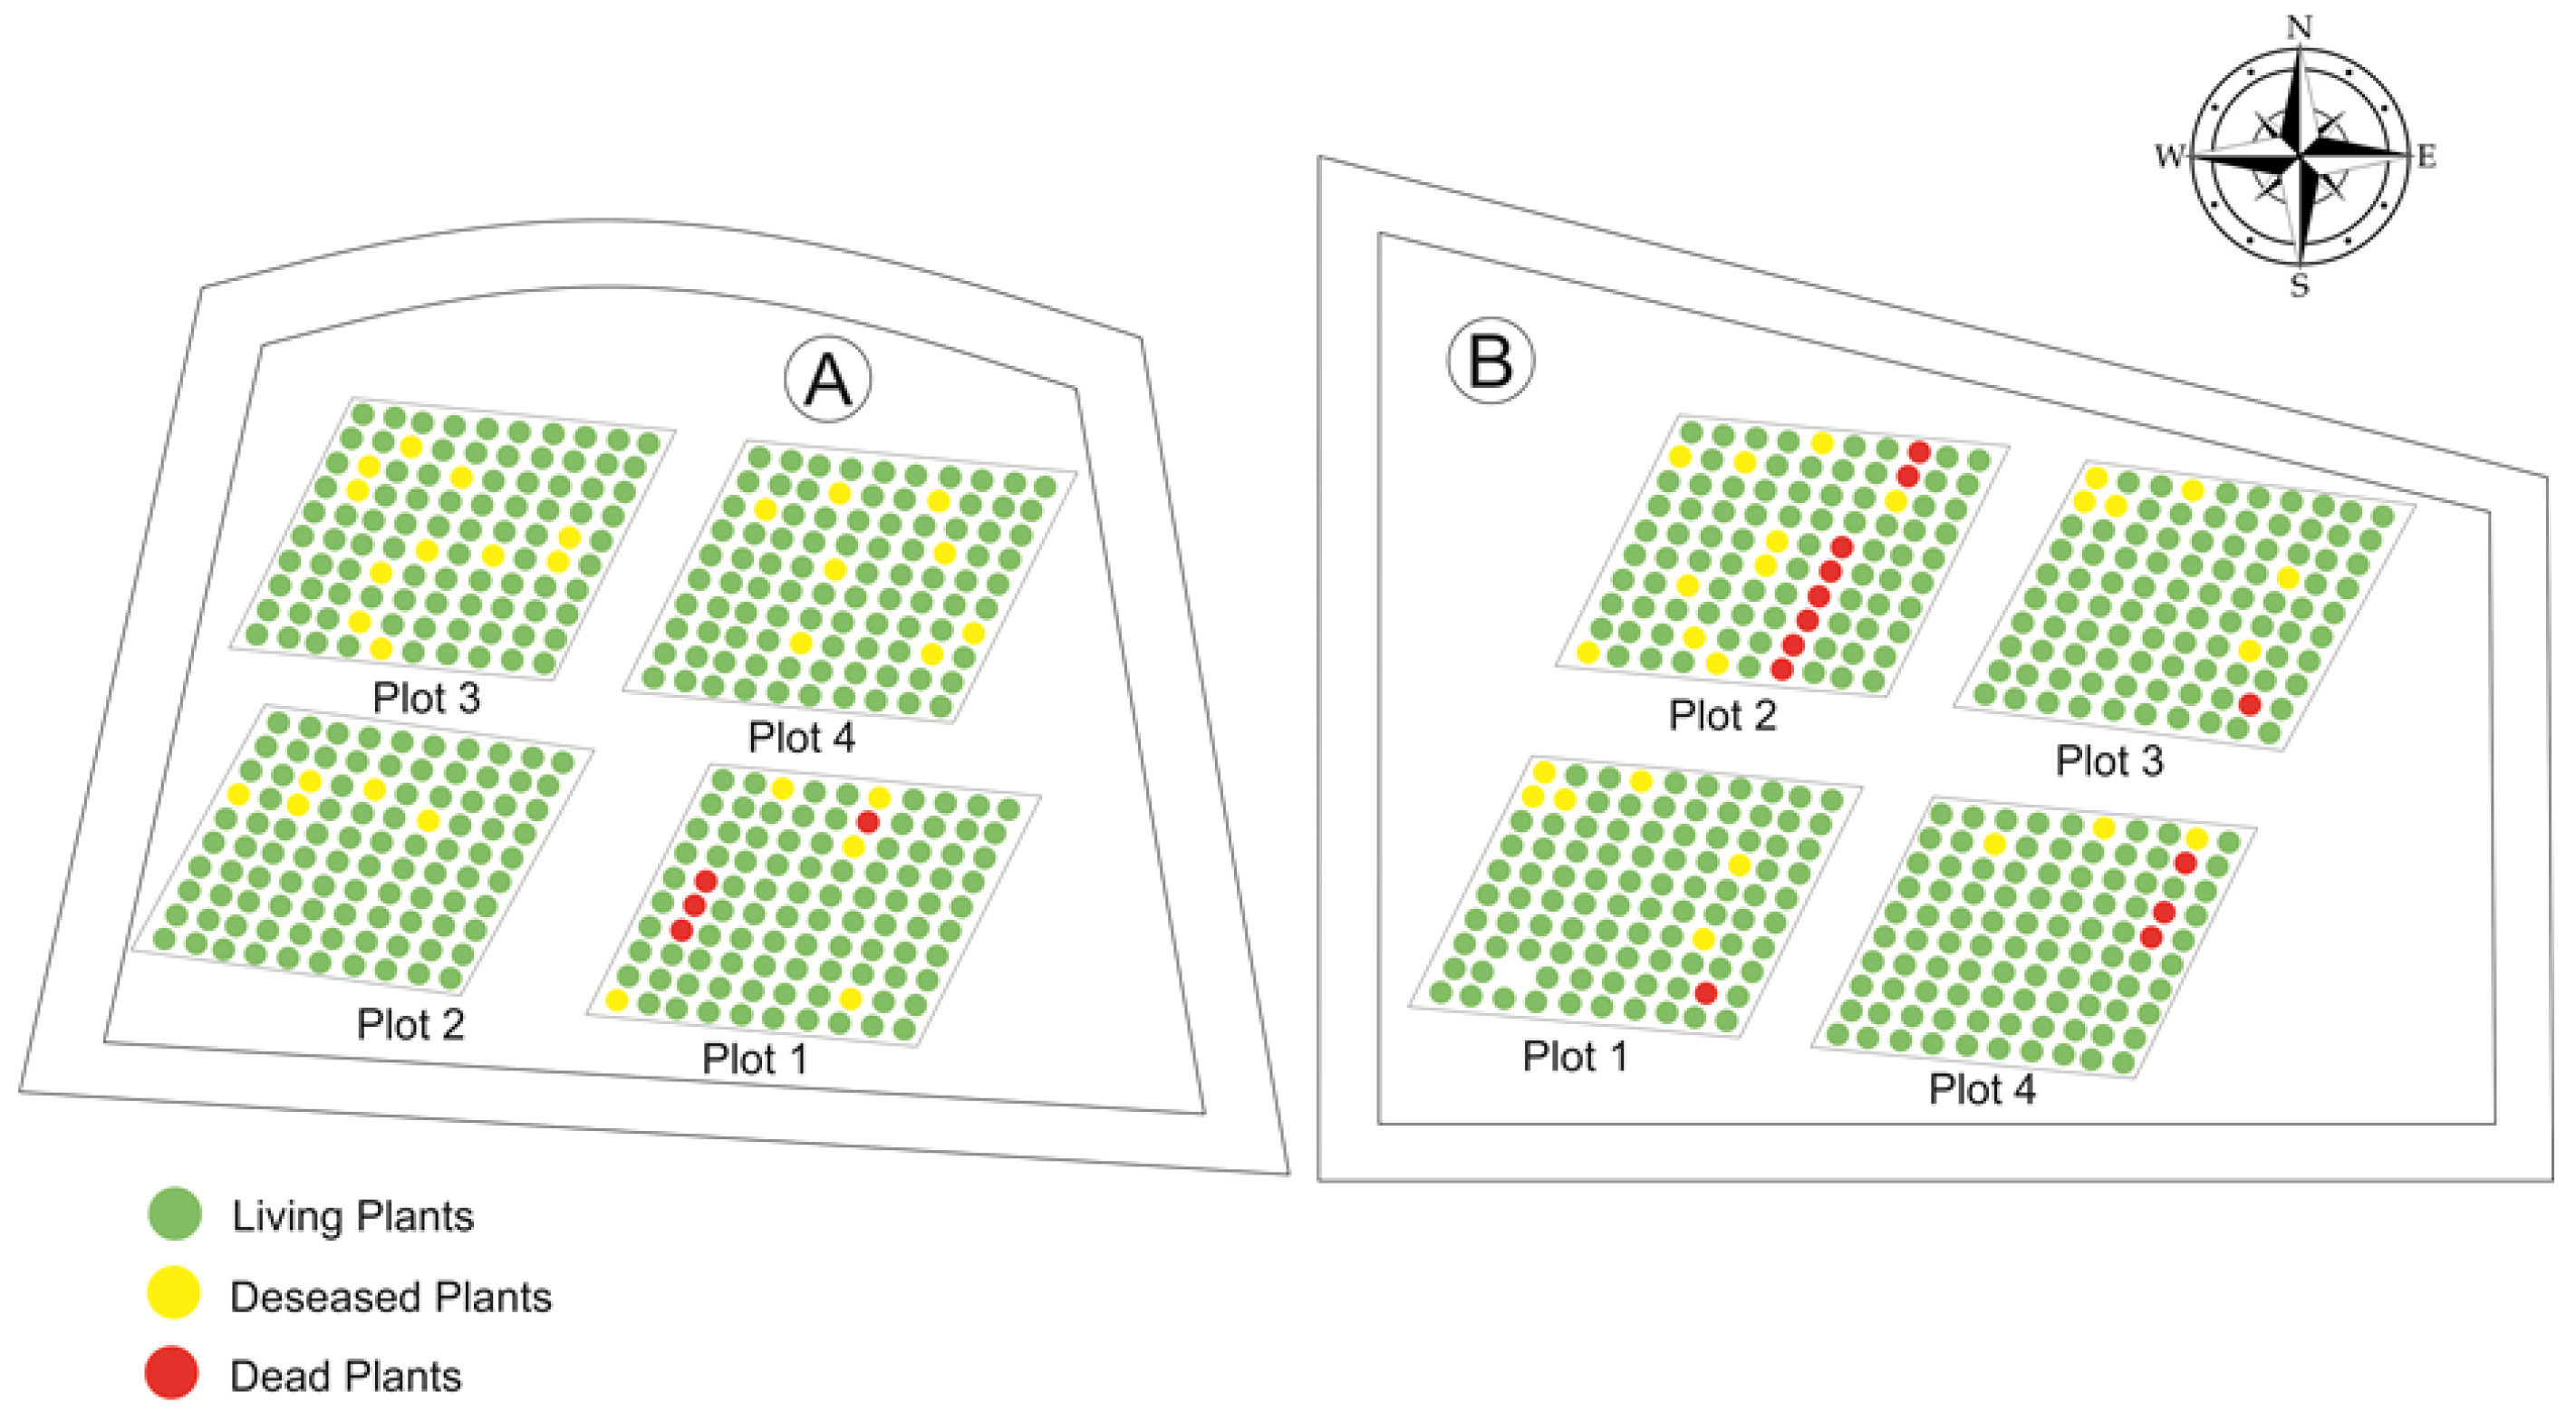
2.4. Survival and Mortality Plants

To determine the level of damage to mangrove stands, the calculation of the intensity of attacks was carried out as follows:
Attack   intensity   = ( n i × V j ) NZ 100 %
where, ni is the number of infected plant seeds in a certain classification, Vj is the value in a certain classification, N is the number of plant seeds observed in one sample plot, and Z is the highest classification. The criteria for damage to mangrove plants are divided into five classifications, namely: namely: namely: a value of 0 (healthy) is given if the tree planting is not damaged or 100% live; a value of 1 (mild) if small parts (0–25%) of the tree planting are died from pest attack; a value of 2 (moderate) if 26–50% of the tree planting are died from pest attack; a value of 3 (heavy) if 51–76% of the tree planting are died from pest attack; a value of 4 (very heavy) if 76–100% of the tree planting are died from pest attack [28].

2.5. Soil Sampling

Soil sampling was carried out to test the texture and chemical properties of the soil (pH, N-total, Na, K, Mg, Ca, CEC, and salinity) using a purposive sampling method by taking a soil sample of 0.5 kg each in 3 plots representing mangrove rehabilitation soils based on planting method: propagule and seedling. Soil sampling for organic carbon content was carried out by collecting sub-samples of 5 cm from the midpoint of the extracted core at 0–15 cm, 20–30 cm, 30– 50 cm, 50–100 cm, and 100–200 cm using a Russian peat corer [29]. Soil samples were carefully dried at 70 °C until constant weight and grounded before being sent to the laboratory for organic carbon concentration analysis. Soil carbon stock (MgC ha−1) was the product of bulk density (g cm−3), soil thickness (cm), and carbon content (%).

2.6. Biomass Assessment

Measurement of tree biomass was performed non-destructively using the 2019–2022 tree census dataset (planted mangrove at 4, 5, and 7 years old, respectively). We only included with ≥5 cm DBH for total biomass estimation (Table 1, [30,31,32,33,34,35,36,37,38]). Biomass carbon stock (MgC ha−1) was the product of biomass (Mg), carbon content of biomass of 50%, and divided by the the area of the sampling plot [30].

2.7. Data Analysis

Data were expressed in mean ± standard deviation (SD). Regression analysis was used to assess the relationship between height, diameter, above-ground biomass, below-ground biomass, number of leaves, and leaf thickness. The statistical significance of carbon stocks between planting treatments was evaluated by performing Tukey test comparison. The p-value < 0.05 was selected as a limit of statistical significance.
Statistical analysis was performed by using Microsoft Excel and the R statistical software [39].

3. Results

3.1. Vegetation Structure

A total of 14 mangrove species were found in the restored forest; the dominant species were Rizophora apiculata, Sonneratia alba, and Rhizophora stylosa. Three minor species were also found, namely Acrostichum aureum, Finlaysonia maritimea, and Sesuvium portulacastrum (Table 2 and Table 3).
Tree diameter, height, and number of leaves were increased at both propagules and seedlings planting method along the age gradient of the plantation from 6 to 48 months old (Table 4). After 6 and 12 months of planting, the average height of propagule planting trees was taller than the height of the seedling planting trees. However, when the plants were 30–48 months old, the average seedling height at seedling planting was taller than the propagule planting’s height. However, this pattern was not much observed for diameter, number and thickness of leaves (Table 4).
After monitoring for 3 consecutive years, in 2020, 15 species of mangrove plants were found across sampling plots, and in 2022, 14 species were found as a result of Sonneratia caseolaris logging. In our 2022 observations, there were 5506 individuals at the restoration site that was planted with propagules; these were divided into 117 seedlings, 1714 saplings, and 3675 individual trees (Table 5).
Meanwhile, at the planting location using seedlings, 13 species of mangrove plants were found, and there were 4482 individuals divided into 147 individual seeds, 1141 individual saplings, and 3194 individual trees (Table 6).
The H′ value at the location that was restored by planting using propagules was in the low-medium category (Table 7). At the seedling level, it was included in the medium category with an H′ value of 1–2. Meanwhile, the sapling level was in the low category with a value of H′ > 1, and the tree level in 2019 was also in the low category. In 2020 and 2022, it was in the medium category with an H′ value of 1–2.
The H′ value at the location that was restored by planting using seedlings was in the low-medium category (Table 8). At the seedling level, it was included in the medium category with an H′ value of 1.1–1.7. Further, sapling and tree classes had H′ value < 1 or categorized as low diversity.
The Evenness index value (E) of propagules planting was classified between low-high (Table 9). For seedling class, E value was >0.6 (high), and subsequently sapling class was low to medium (0.39–0.43), and tree class had medium Evenness index with E value between 0.4–0.6. In addition, the Dominance index value for planting using propagules is the absence of dominant species in the rehabilitation area (Table 10).
The Evenness index value (E) of Seedlings planting was classified between low-high (Table 10). For seedling class, E value was >0.6 (high), and subsequently sapling class was low to medium (0.39–0.56), and tree class had medium Evenness index with E value between 0.4–0.6. In addition, the Dominance index value for planting using propagules is the absence of dominant species in the rehabilitation area (Table 10).

3.2. Survival and Mortality Plants

Table 11 shows that the percentage of planting survival in the rehabilitation area surveyed every six months over 2016 to 2022. Our monitoring showed that after 48 months old, plant survival rates were 87.75% and 92% for respectively planting using propagules and seedlings. However, in 2022 plant survival rates were decreased for both treatments to only 69.42% and 86.38% for planting using propagules and seedlings, respectively. Higher plant survival rates at 48 months old (2019 monitoring) compared to 2022 monitoring were due to low pest attack intensity, with only 7.54% in propagules planting plot and 4.43% in seedlings planting plot (Table 12). We observed that weaver ants (Oecophylla smaragdina) were the main pest in the study site (Supplementary Figure S1).

3.3. Physical and Chemical Properties of Soil

When the plants were 48 months old, soil condition in the study site was dominated by clay (>80%), and followed by silt and sand fractions (Supplementary Table S1). dominated by clay (>80%), and followed by silt and sand fractions (Supplementary Table S1). The pH level at the two planting treatments was similar, ranged between 4.8–5 and classified as acidic. The total N content was low at 0.1%, while the Na content was high (8.5–10.7 me/100 g), above >8 me/100 g, the Ca content was also very low at <2 me/100 g. for the K content at planting using medium propagules, whereas with very high seedlings. The salinity level at both planting locations was very high namely >20 Ppm (Table 13 and Table 14).

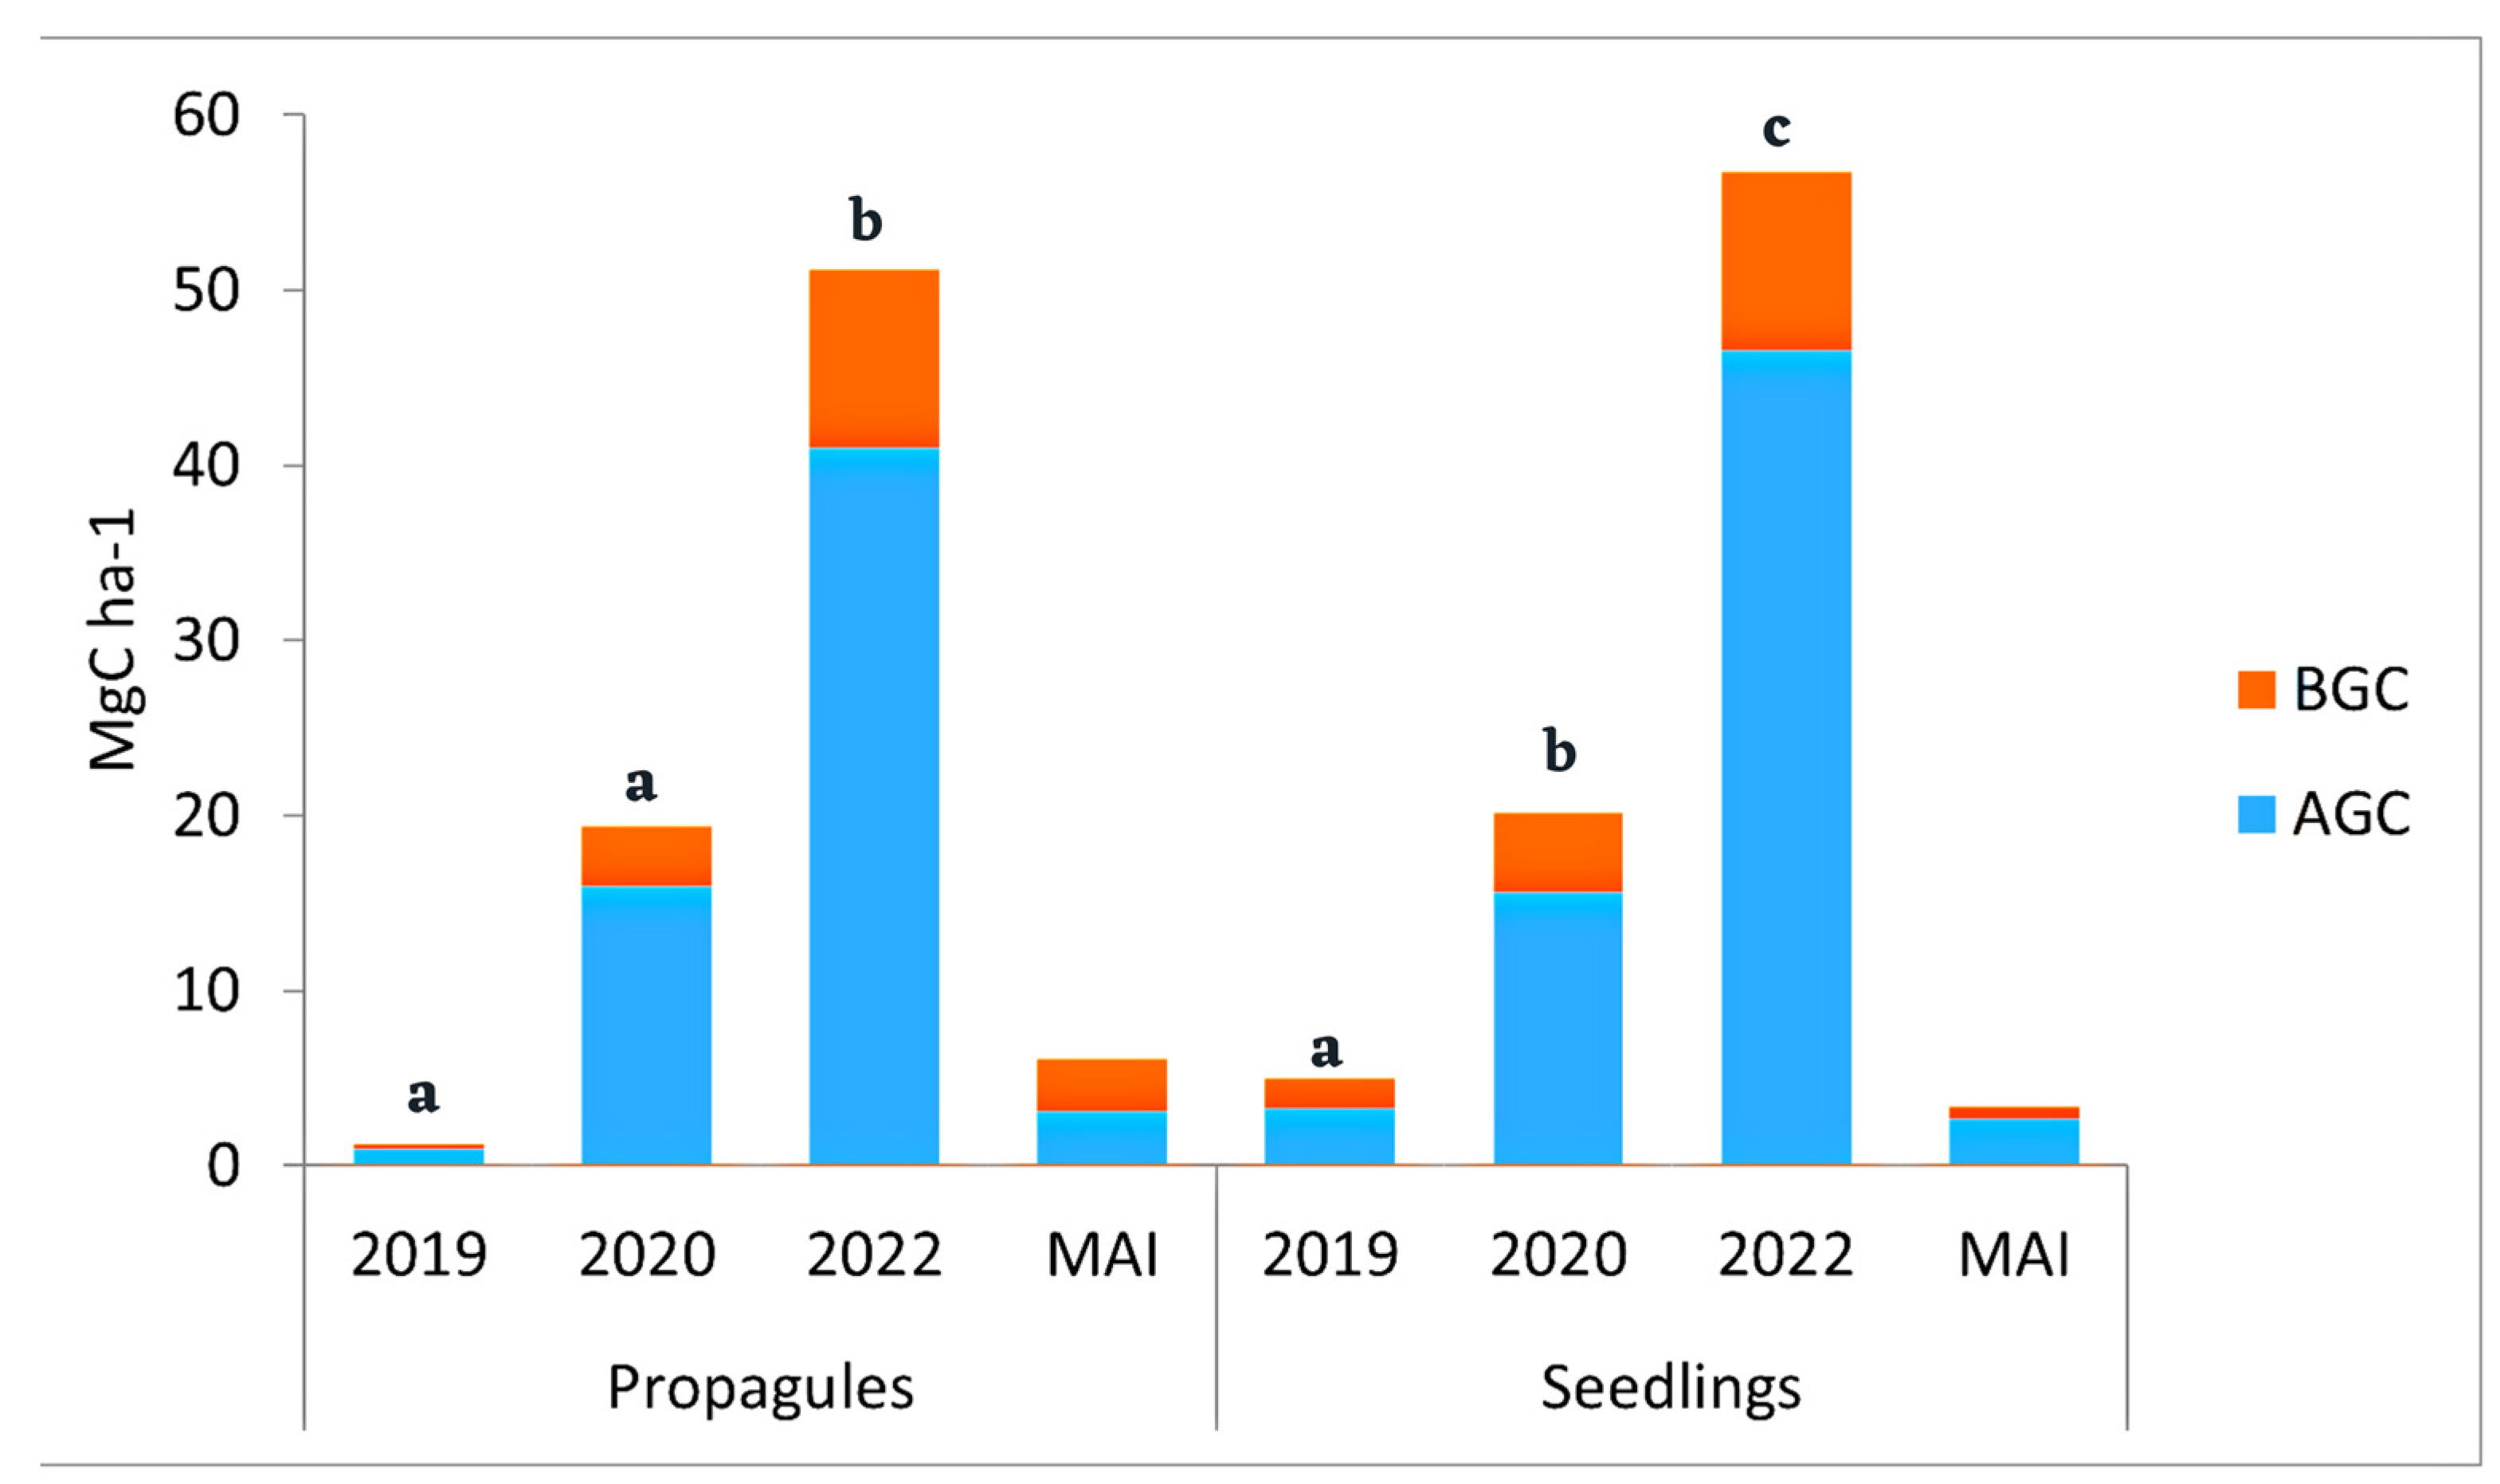
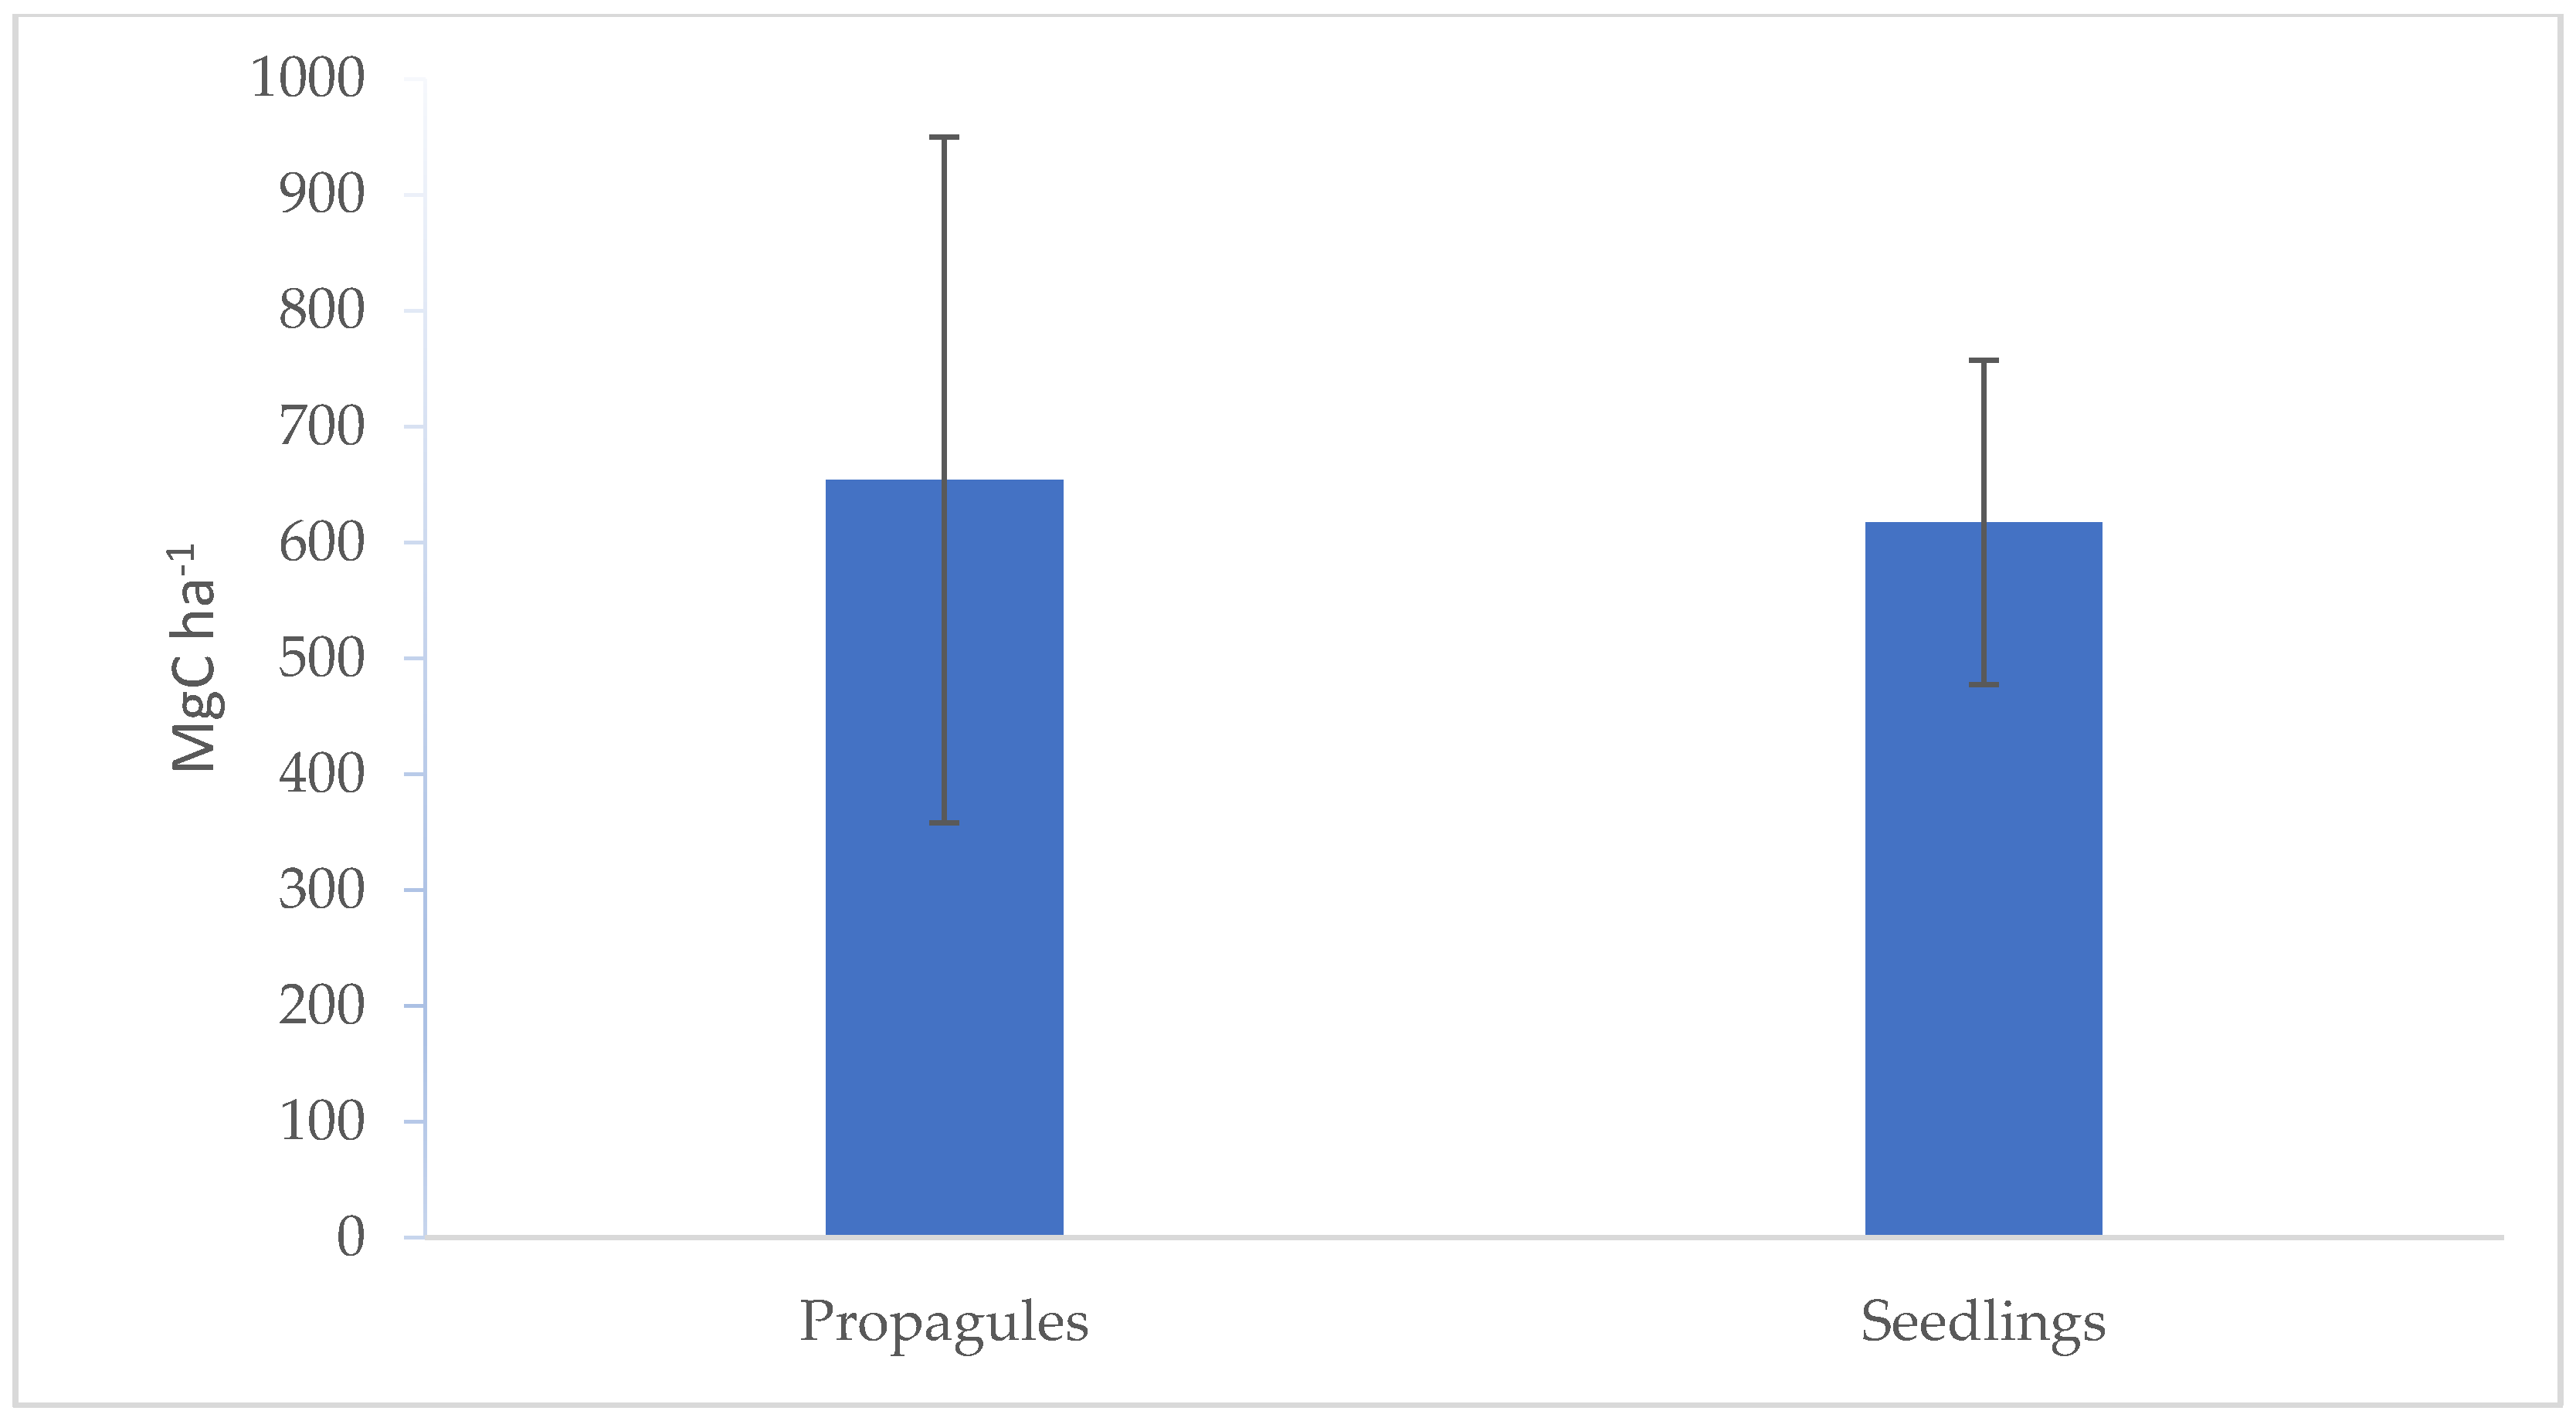
3.4. Carbon Stored in Restored Forests

The aboveground biomass carbon stocks at the four years planting age were 2.13 Mg ha−1 and belowground root biomass carbon stocks were 1.00 Mg ha−1 (Figure 4). Both above- and below-ground biomass were increased significantly after five years old, specifically in the seedling planting plots, to 15.81 Mg ha−1 (for AGC) and 3.98 Mg ha−1 (for BGC). After seven years old, the above-ground carbon stocks at planting using propagules plots were 41.00 Mg ha−1, while at planting using seedling were 46.53 Mg ha−1. The below-ground carbon stocks at planting using propagules plots were 10.18 Mg ha−1, while at planting using seedling plots were 10.26 Mg ha−1. The mean annual increment (MAI) carbon in this restoration area was 6.15 Mg ha−1 for planting using propagules and 3.35 Mg ha−1 for planting using seedlings (Figure 4). Overall, we observed a significant increase in carbon stocks from 2019 to 2022 at both planting using propagules and using seedlings (Figure 4, Supplementary Figures S2 and S3).
Soil carbon stocks at the planted site with propagules were 506.89 ± 250.74 MgC ha−1, and planted site with seedlings were 461.85 ± 102.23 MgC ha−1 (Figure 5). The total ecosystem carbon stocks (including biomass carbon pool) in the planted site using propagules were 558.07 MgC ha−1, while that in the planted site using seedlings were 518.64 MgC ha−1.

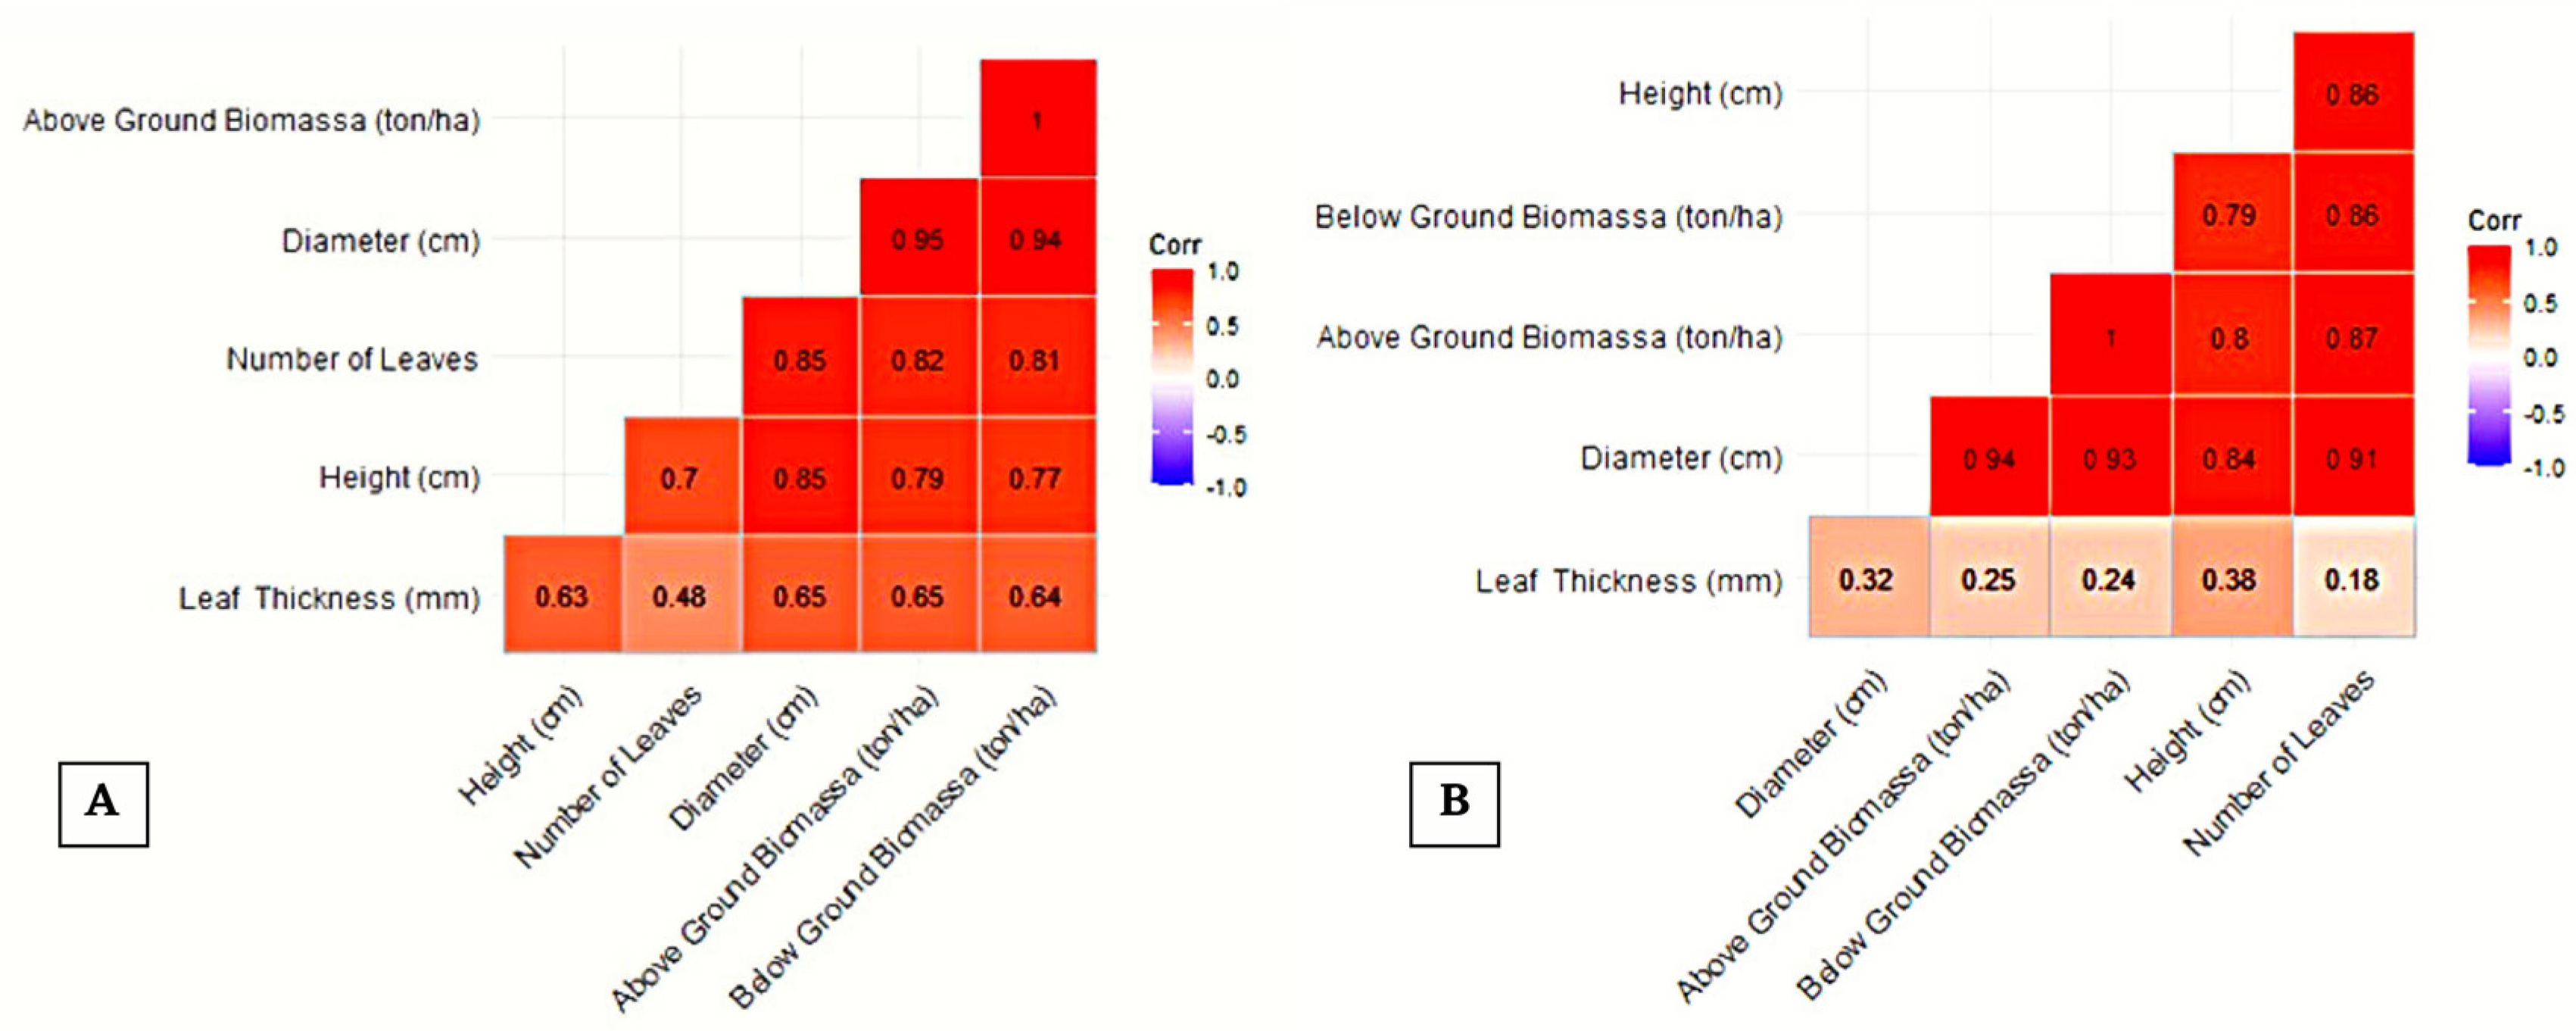
3.5. Growth Correlation

The planting growth relationship between measured parameters at two planting approach sites are summarized in Figure 6. For example, at propagules planting plots (Figure 6A), the correlation between height and diameter was 0.85, and the correlation between height and aboveground biomass was 0.79. At the seedlings planting, we observed tree height and diameter correlation of 0.84, and tree height and above-ground biomass of 0.80 (Figure 6B).

4. Discussion

4.1. Vegetation Structure

At the initial stage of planting in 2016, there was only one species introduced at the study site of abandoned aquaculture pond, namely Rhizophora apiculata. After 7 years, 14 species of mangrove plants were encountered at the restoration site, where the results were not much different from previous research conducted by [40] located near our study site in Lubuk Kertang Village and they recorded 15 mangrove species in secondary mangrove forests. The presence of other species in the restored area was most likely due to propagules movement and being carried by water through the river at high tide, as the rehabilitated aquaculture ponds in this study was located near the river channel and surrounded by secondary forest (Figure 1). According to Balke et al. [41], tidal and river systems within the same catchment are closely connected and have the same WoO (Windows of Opportunity), which is essential for the restoration of coastal vegetation. Seedlings planting plots in general have higher adaptability to cumulative disturbances, such as sediment erosion that causes the uprooting of plant roots, water movement, and inundation stress. Lowering the frequency of disturbances allows more time for plants to acclimate to local condition and is therefore expected to increase growth [42].
The plants that grew from seedlings had higher shoots and larger shoot diameters compared with plants from propagules (Supplementary Figure S2). Therefore, it is suggested that the use of Rhizophora apiculata through seedlings introduction may enhance the success rates of a restoration program rather than propagules. This findings are consistent with previous study by Miyakawa et al. [24] who recommends similar approach for rehabilitation programs on ex-pond land. Furthermore, the mortality percentage of planting using propagules was higher than using seedlings. Therefore, the seedling selection during first planting must also be considered for an improved survival rates can be seen in Supplementary Figures S3–S5.
The high number of S. alba found in the restored areas may be due to similar required environmental condition and suitability of this species with introduced R. apiculata [43]. The increase and decrease in the number of plants at the restoration site over monitoring period was caused by various factors. For example, there was a few number of logging activities in the site with quite significant number of individuals were removed (Supplementary Figure S6A). We also observed that some mature trees have produced new propagules and facilitated new plant establishement after seven years since first planting (Supplementary Figure S6B).

4.2. Survival and Mortality Plants

Overall it is observed that seven years mangrove rehabilitation in aquaculture ponds in this study has high plant survival rates, low mortality rates and pest attacks. Biotic, abiotic, and anthropogenic disturbances affect forest diversity index values, some species may tolerate and adapt with disturbance, while others may fail to survive. The increase in the number of individuals found in our study site was quite high, and due to various factors including the suitability of the habitat for mangrove growth. Although it was formerly an aquaculture pond, the the water exchange of the site was maintained due to its location near the main river and surrounded by a secondary forest that serves as a natural source of seeds for new seedling establishment.
Based on the results of field observations and identification of pests, several types of pests found that attack plants in large numbers, belong to the order of Lepidoptera such as bagworms (Pteroma sp.), green hornworms (Polyura schreiber), and white cocoons (Supplementary Figure S1). Lepidoptera is one of pests that can caused high number of plant mortality especially for young plant establishement [44].
According to Kalshoven [45], other damage observed on the leaves is also caused by the gastropod family, namely the herbivore snail. Root damage is caused by a type of Grapsid crabs that eat roots and stems when they are still propagules, seedlings, and tillers [46] in this mangrove species. Generally, young stems and roots in mangroves attract several types of crabs because they are still quite soft and quite sweet. The worst result of crab attacks is that the stems and roots become hollow and porous [47]. Weaver ants influence the behavior of flower visitors and the reproductive success of their host plants; they have the potential to influence the structure of the pollination network [48].

4.3. Physical and Chemical Properties of Soil

The soil condition of mangrove rehabilitation site in this study has mostly low pH, which may associate with a decrease in the availability of nutrients for plants and the development of microorganisms [49,50]. Soil organic matter including C-organic content plays a very important role in the ability of the soil to maintain soil fertility and productivity through the activity of soil microorganisms [51,52]. Compared to mud or clay dominated sediments, sand sediments contain less organic matter because they have a larger grain structure, low density, and high permeability and are easily washed away, making it difficult to store dissolved organic matter.
Nitrogen is one of the main macronutrients that is very important for plant growth. However, although rehabilitated mangrove land in our study has low nitrogen content, the planting still has high survival rates. However, the the potassium content obtained in the study site was high. According to Tisdale [53], the availability of potassium for plants depends on soil aspects and climatic parameters and is essential to support vegetation growth.
The cation exchange capacity in the rehabilitated land using propagules is lower than the rehabilitated land using seedlings, which indicates that this land has a higher nutrient binding capacity than the land planted with propagules. The Na content in the rehabilitated mangrove area was considered high concentration because it may be influenced by the higher salinity of sea water during high tide water exchange.

4.4. Carbon Stored in Restored Forests

The increase of mangrove biomass carbon stocks can be seen following the increase number of individuals, diameter, height and density of wood, stand type and age, history of vegetation development, composition and structure of the stand [29,54,55]. If this restored forest is left undisturbed and allowed to self-regenerate for more than 25 years, it may achieve the same level of biomass carbon as undisturbed forests [56]. Regeneration efforts (restoration, rehabilitation, and reforestation) can lead to biomass recovery after 40 years [57]. Regeneration can help restore aboveground carbon stocks back to their previous levels in just a few decades, with a faster rate of biomass recovery than in soil carbon stocks [58]. Therefore, the management of mangrove ecosystems can be improved by preventing further land use and cover changes. Promoting rehabilitation is therefore very important and effective for climate change mitigation policies [57].
Mangroves can store carbon per hectare more than three times the average terrestrial tropical forest, indicating that the optimal function of carbon absorption by mangroves reaches 77.9%, where the carbon absorbed is stored in mangrove biomass in tree trunks [6]. The increase in organic matter in trees is positively correlated with tree diameter and height; in this regard, the carbon content of trees especially in the trunk, is high because carbon is the organic material that makes up the trunk cell wall [59,60,61].
Mangrove ecosystems store more carbon in the belowground carbon pool. Mangrove organic carbon is mainly stored in the soil, which contains more than two-thirds of the total carbon stock of mangrove ecosystems [57]. According to Aminudin [54], the rate of increase in tree biomass such as stand age, history of vegetation development, stand composition, and vegetation structure affects forest stand biomass. These results are in line with research conducted by Sasmito et al (2020) [59] in the mangrove forest of Bintuni that the top 100 cm soil carbon stock was not significantly different between post-harvest stands, only varying between 354 ± 71 Mg C ha−1 in 10 year old stands and 442 ± 57 Mg C ha−1 in 15 year old stands.
Mangroves store large stocks of organic carbon (C) in their soil which are important in the global C cycle, the belowground mangrove tree biomass is the main contributor to this organic C stock. Another factor affecting C-organic reserves is the density of soil contents (BD), where the BD of planting using propagules ranges from 0.29–0.76 g/cm3 with an average of 0.63 g/cm3, the BD value of planting using seedlings ranges from 0.44–0.73 g/cm3 with an average of 0.58 g/cm3. Soil BD affects mangrove root growth with dense patches tending to have increased root growth and organic C uptake potential compared to less dense soil patches [62]. Soil C concentration with forest age showed consistent and positive changes, even in the youngest forests (<5 years), this is in line with our observation that soil C content increased over time after 7 years of mangrove reforestation [63]. Based on this finding, this study has limitation to present carbon vegetation and soil for the whole restoration site and not based on species.

5. Conclusions

Overall, it can be concluded that the restoration in this area is classified as successful with a high survival rate of plants, low death rates and pest attacks, large enough carbon stores up to 600–700 Mg h−1. Selection of the right location and type of vegetation is a key factor in carrying out restoration activities. This study also provides important data that is expected to be used by decision makers regarding the promotion of climate change mitigation strategies in Indonesia.

Supplementary Materials

The following supporting information can be downloaded at: https://0-www-mdpi-com.brum.beds.ac.uk/article/10.3390/f14010158/s1, Figure S1. Pests in 2015 and 2016 plots: (A) green hornworm, (B) bagworm, (C) weaver ant, (D) cocoons of Family Lepidoptera, (E) Family of gastropods, (F) Crab; Figure S2. Condition of the land for rehabilitation after 7 years. (A) Planting with seedlings; (B) Planting with propagules; Figure S3. Plant development in the rehabilitation area where planting with propagules was carried out. (A) When planting was carried out in 2015, (B) monitoring in 2016, (C) monitoring in 2017, (D) monitoring in 2018, (E) monitoring in 2019, (F) monitoring in 2020; Figure S4. Plant development in the rehabilitation area where planting using seedlings was carried out. (A) When planting was carried out in 2016, (B) monitoring in 2016, (C) monitoring in 2017, (D) monitoring in 2018, (E) monitoring in 2019, (F) monitoring in 2020; Figure S5. Condition of restored land from initial planting to 2022. (A) planting with propagules in 2015, (B) team members participating in planting propagules, (C) planting using seeds, (D) team members participating in planting with seedlings, (E) monitoring in 2017, (F) monitoring in 2018, (G) monitoring in 2019, (H) monitoring in 2020 using drones, (I) monitoring in 2022 using drones; Figure S6. The current condition of the restoration site. (A) Sonneratia alba was logged, (B) Rhizophora apiculata was logged, (C) R. apiculata planted had produced propagules, (D) S. alba had new seedlings; Table S1. Soil texture of mangrove rehabilitation land in Lubuk Kertang Village.

Author Contributions

Conceptualization, M.B.; methodology, R.A., M.B., A.A. and I.M.H.; validation, R.A., M.B., S.S.A.M. and S.D.S.; formal analysis, A.A. and I.M.H.; investigation, R.A., A.A., I.M.H.; writing—original draft preparation, R.A.; writing—review and editing, M.B., V.B.A., B.S., N.S. and S.D.S.; visualization, Y.B., R.A., A.A. and I.M.H.; supervision, M.B., B.S. and V.B.A.; project administration, S.S.H.H., M.H. and S.S.A.M.; funding acquisition, M.B.; R.A., M.B., S.D.S. and V.B.A. are main contributors for this paper. All authors have read and agreed to the published version of the manuscript.

Funding

This research was funded by a Research Grant from the Indonesian Science Fund and Indonesia Endowment Fund for Education (DIPI/LPDP-RCUK Joint Call) (Grant Number NO. NE/PO14127.1). Center of Excellence for Mangrove, Universitas Sumatera Utara (0753/E5/AL.04/2022) partly covered the APC of this paper.

Data Availability Statement

The data presented in this study are available on request from the corresponding author.

Acknowledgments

We thanks to Muammar Harahap, Musaddad Daulay, Elma Asvira, Winda Ismaini Lestari, Arif Al Habib, Karim Nasution or their help in sampling campaigns and laboratory analysis.

Conflicts of Interest

The authors declare no conflict of interest.

References

  1. Balke, T.; Swales, A.; Levelock, C.; Herman, P.; Bouma, T. Limits to seaward expansion of mangroves: Translating physical disturbance mechanisms into seedling survival gradients. J. Exp. Mar. Biol. Ecol. 2015, 467, 16–25. [Google Scholar] [CrossRef]
  2. Alongi, D.; Tirendi, F.; Clough, B. Below-ground decomposition of organic matter in forests of the mangroves Rhizophora stylosa and Avicennia marina along the arid coast of Western Australia. Aquat. Bot. 2000, 68, 97–122. [Google Scholar] [CrossRef]
  3. Basyuni, M.; Rouf, R.A.; Saragih, M.; Asbi, A.M.; Yuriswan, W. Local wisdom and mitigation action to maintain secondary mangrove forest: A case study of Jaring Halus Village in Langkat, North Sumatra, Indonesia. Adv. Soc. Sci. Educ. Humanit. Res. 2016, 81, 551–555. [Google Scholar] [CrossRef] [Green Version]
  4. Murdiyarso, D.; Purbopuspito, J.; Kauffman, J.B.; Warren, M.W.; Sasmito, S.D.; Donato, D.C.; Manuri, S.; Hanuri, K.; Taberima Kurnianto, S. The potential of Indonesian mangrove forests for global climate change mitigation. Nat. Clim. Chang. 2015, 5, 1089–1092. [Google Scholar] [CrossRef]
  5. Alongi, D.M. Carbon sequestration in mangrove forests. Carbon Manag. 2012, 3, 313–322. [Google Scholar] [CrossRef]
  6. Donato, D.C.; Kauffman, J.B.; Murdiyarso, D.; Kurnianto, S.; Stidham, M.; Kanninen, M. Mangroves among the most carbon-rich forests in the tropics. Nat. Geosci. 2011, 4, 293–297. [Google Scholar] [CrossRef]
  7. Basyuni, M.; Sasmito, S.D.; Analuddin, K.; Ulqodry, T.Z.; Saragi-Sasmito, M.F.; Eddy, S.; Milantara, N. Mangrove Biodiversity, Conservation and Roles for Livelihoods in Indonesia. In Mangroves: Biodiversity, Livelihoods and Conservation; Springer: Singapore, 2022; pp. 397–445. [Google Scholar] [CrossRef]
  8. Basyuni, M.; Sulistiyono, N. Deforestation and reforestation analysis from land-use changes in North Sumatran Mangroves, 1990-2015. IOP Conf. Ser. 2018, 309, 012018. [Google Scholar] [CrossRef]
  9. Carnell, P.E.; Palacios, M.M.; Waryszak, P.; Trevathan-Tackett, S.M.; Masqué, P.; Macreadie, P.I. Blue carbon drawdown by restored mangrove forests improves with age. J. Environ. Manag. 2022, 306, 114301. [Google Scholar] [CrossRef]
  10. Pham, V.H.; Luu, V.D.; Nguyen, T.T.; Koji, O. Will restored mangrove forests enhance sediment organic carbon and ecosystem carbon storage? Reg. Stud. Mar. Sci. 2017, 14, 43–52. [Google Scholar] [CrossRef]
  11. Sidik, F.; Fernanda Adame, M.; Lovelock, C.E. Carbon sequestration and fluxes of restored mangroves in abandoned aquaculture ponds. J. Indian Ocean. Reg. 2019, 15, 177–192. [Google Scholar] [CrossRef]
  12. Lovelock, C.E.; Atwood, T.; Baldock, J.; Duarte, C.M.; Hickey, S.; Lavery, P.S.; Masque, P.; Macreadie, P.I.; Ricart, A.M.; Serrano, O.; et al. Assessing the risk of carbon dioxide emissions from blue carbon ecosystems. Front. Ecol. Environ. 2017, 15, 257–265. [Google Scholar] [CrossRef] [Green Version]
  13. Pendleton, L.; Donato, D.C.; Murray, B.C.; Crooks, S.; Jenkins, W.A.; Sifleet, S.; Craft, C.; Fourqurean, J.W.; Kauffman, J.B.; Marbà, N.; et al. Estimating global ‘blue carbon’ emissions from conversion and degradation of vegetated coastal ecosystems. PLoS ONE 2012, 7, e43542. [Google Scholar] [CrossRef] [Green Version]
  14. Biswas, S.R.; Mallik, A.U.; Choudhury, J.K.; Nishat, A. A unified framework for the restored of Southeast Asian mangroves—Bridging ecology, society and economics. Wetl. Ecol. Manag. 2009, 17, 365–383. [Google Scholar] [CrossRef]
  15. Duarte, C.M.; Losada, I.J.; Hendriks, I.E.; Mazarrasa, I.; Marbà, N. The role of coastal plant communities for climate change mitigation and adaptation. Nat. Clim. Chang. 2013, 3, 961–968. [Google Scholar] [CrossRef] [Green Version]
  16. Djamaluddin, R.; Brown, B.; Lewis, R.R., III. The practice of hydrological restored to rehabilitate abandoned shrimp ponds in Bunaken National Park, North Sulawesi, Indonesia. Biodiversitas J. Biol. Divers. 2019, 20, 160–170. [Google Scholar] [CrossRef] [Green Version]
  17. Irving, A.D.; Connell, S.D.; Russell, B.D.; Hector, A. Restoring coastal plants to improve global carbon storage: Reaping what we sow. PLoS ONE 2011, 6, e18311. [Google Scholar] [CrossRef] [PubMed] [Green Version]
  18. Sasmito, S.D.; Basyuni, M.; Kridalaksana, A.; Saragi-Sasmito, M.F.; Lovelock, C.E.; Murdiyarso, D. Challenges and opportunities for achieving Sustainable Development Goals through restoration of Indonesia’s mangroves. Nat. Ecol. Evol. 2023, 7, 62–70. [Google Scholar] [CrossRef]
  19. Brown, B.; Yuniati, W.; Ahmad, R.; Soulsby, I. Observations of natural recruitment and human attempts at mangrove rehabilitation after seismic (Tsunami and Earthquake) events in Simeulue Island and Singkil Lagoon, Aceh, Indonesia. In Post-Tsunami Hazard; Springer: Berlin/Heidelberg, Germany, 2015; pp. 311–327. [Google Scholar]
  20. Barbier, E.B. Natural barriers to natural disasters: Replanting mangroves after the tsunami. Front. Ecol. Environ. 2006, 4, 124–131. [Google Scholar] [CrossRef]
  21. Santiago-Fandiño, V.; Kontar, Y.A.; Kaneda, Y. (Eds.) Post-Tsunami Hazard: Reconstruction and Restoration; Springer: Cham, Switzerland, 2014; Volume 44. [Google Scholar] [CrossRef]
  22. The Society for Ecological Restored Science and Policy Working Group. The SER Premier on Ecological Restored. 2002. Available online: http://www.ser.org (accessed on 17 October 2022).
  23. Zhang, X.H.; Huang, Q.L.; Zhang, C. Analysis of forest landscape dynamics based on Forest Landscape Restored: A case study of Yong’an city, Fujian province, China. Eur. J. For. Res. 2010, 129, 975–980. [Google Scholar] [CrossRef]
  24. Updated Nationality Determined Contribution Republic of Indonesia. Indonesia Submission of Updated Nationality Determined Contribution (NDC) and of Long-term Strategy on Low Carbon and Climate Resilience 2050. (Minister for the Environment and Forestry: Jakarta). 2021. Available online: https://unfccc.int/sites/default/files/NDC/2022-06/Updated%20NDC%20Indonesia%202021%20-%20corrected%20version.pdf (accessed on 17 October 2022).
  25. Miyakawa, H.; Agus, S.R.; Sarno; Prabowo, A.; Ridwan, A.; Surbakti, H.; Budiono, P.; Ridwan, A.; Okabe, H.; Kadarisman, R. Proyek Peningkatan Kapasitas Untuk Restorasi Ekosistem di Kawasan Konservasi: Panduan Teknis Restorasi di Kawasan Konservasi- Lahan Tambak Ekosistem Mangrove; Ditjen PHKA, Kementerian Lingkungan Hidup dan Kehutanan: Jakarta, Indonesia; Japan International Cooperation Agency (JICA): Tokyo, Japan, 2014. (In Indonesian) [Google Scholar]
  26. Suryanto, P.; Rinarno, Y.D.B.M.; Prianto, S.D.; Hendro, Y.; Hosaka, T.; Numata, S. Recovery of vegetation structure, soil nutrients and late-succession species after shifting cultivation in Central Kalimantan, Indonesia. J. Trop. For. Sci. 2017, 29, 151–162. [Google Scholar]
  27. Odum, H.T. Scales of ecological engineering. Ecol. Eng. 1996, 6, 7–19. [Google Scholar] [CrossRef]
  28. Haneda, N.F.; Suheri, M. Hama Mangrove Di Kecamatan Batu Ampar, Kabupaten Kubu Raya, Kalimantan Barat Mangrove Pests at Batu Ampar, Kubu Raya, West Kalimantan. J. Silvikultur Trop. 2018, 9, 16–23. (In Indonesia) [Google Scholar] [CrossRef]
  29. Kauffman, J.B.; Donato, D.C. Protocols for the Measurement, Monitoring and Reporting of Structure, Biomass and Carbon Stocks in Mangrove Forests; Cifor: Bogor, Indonesia, 2012; Volume 86. [Google Scholar]
  30. Komiyama, A.; Ong, J.E.; Poungparn, S. Allometry, biomass, and productivity of mangrove forests: A review. Aquat. Bot. 2008, 89, 128–137. [Google Scholar] [CrossRef]
  31. Comley, B.W.T.; McGuinness, K.A. Above- and below-ground biomass, and allometry of four common northern Australian mangroves. Aust. J. Bot. 2005, 53, 431–436. [Google Scholar] [CrossRef] [Green Version]
  32. Ong, J.E.; Gong, W.K.; Wong, C.H. Allometry and partitioning of the mangrove, Rhizophora apiculata. For. Ecol. Manag. 2004, 188, 395–408. [Google Scholar] [CrossRef]
  33. Fromard, F.; Puig, H.; Mougin, E.; Marty, G.; Betoulle, J.L.; Cadamuro, L. Structure above-ground biomass and dynamics of mangrove ecosystems: New data from French Guiana. Oecologia 1998, 115, 39–53. [Google Scholar] [CrossRef]
  34. Clough, B.F.; Scott, K. Allometric relationships for estimating aboveground biomass in six mangrove species. For. Ecol. Manag. 1989, 27, 117–127. [Google Scholar] [CrossRef]
  35. Komiyama, A.; Poungparn, S.; Kato, S. Common allometric equations for estimating the tree weight of mangroves. J. Trop. Ecol. 2005, 21, 471–477. [Google Scholar] [CrossRef]
  36. Chave, J.; Andalo, C.; Brown, S.; Cairns, M.A.; Chambers, J.Q.; Eamus, D.; Fölster, H.; Fromard, F.; Higuchi, N.; Kira, T.; et al. Tree allometry and improved estimation of carbon stocks and balance in tropical forests. Oecologia 2005, 145, 87–99. [Google Scholar] [CrossRef] [PubMed]
  37. Tamai, S.; Nakasuga, T.; Tabuchi, R.; Ogino, K. Standing biomass of mangrove forests in southern Thailand. J. Jpn. For. Soc. 1986, 68, 384–388. [Google Scholar]
  38. Poungparn, S.; Komiyama, A.; Jintana, V.; Piriyayaota, S.; Sangtiean, T.; Tanapermpool, P.; Patanaponpaiboon, P.; Kato, S. A quantitative analysis on the root system of a mangrove, Xylocarpus granatum Koenig. Tropics 2002, 12, 35–42. [Google Scholar] [CrossRef]
  39. Horton, N.J.; Kleinman, K. Using R and RStudio for Data Management, Statistical Analysis, and Graphics; CRC Press: Boca Raton, FL, USA, 2015. [Google Scholar]
  40. Basyuni, M.; Fitri, A.; Harahap, Z.A. Mapping and analysis land-use and land-cover changes during 1996–2016 in Lubuk Kertang mangrove forest, North Sumatra, Indonesia. IOP Conf. Ser. 2018, 126, 012110. [Google Scholar] [CrossRef]
  41. Balke, T.; Herman, P.M.; Bouma, T.J. Critical transitions in disturbance-driven ecosystems: Identifying Windows of Opportunity for recovery. J. Ecol. 2014, 102, 700–708. [Google Scholar] [CrossRef]
  42. Balke, T.; Webb, E.L.; Van Elzen, E.; Galli, D.; Herman, P.M.; Bouma, T.J. Seedling establishment in a dynamic sedimentary environment: A conceptual framework using mangroves. J. Appl. Ecol. 2013, 50, 740–747. [Google Scholar] [CrossRef] [Green Version]
  43. Noor, Y.R.; Khazali, M.; Suryadiputra, I.N. Panduan Pengenalan Mangrove di Indonesia; PHK/WI-IP: Bogor, Indonesia, 2006. (In Indonesia) [Google Scholar]
  44. Kutinkova, H.; Andreev, R.; Arnaoudov, V. The Leopard Moth Borer, Zeuzera Pyrina L. (Lepidoptera: Cossidae)—Important Pest in Bulgaria. J. Plant Prot. Res. 2006, 46, 111–115. [Google Scholar]
  45. Kalshoven, L.G.E. Pest of Crops in Indonesia; Ichtiar Baru-Van Hoeve: Jakarta, Indonesia, 1950. [Google Scholar]
  46. Rodríguez-Gironés, M.A.; Gonzalvez, F.G.; Llandres, A.L.; Corlett, R.T.; Santamaría, L. Possible role of weaver ants, O ecophylla smaragdina, in shaping plant–pollinator interactions in South-East Asia. J. Ecol. 2013, 101, 1000–1006. [Google Scholar] [CrossRef]
  47. Dangremond, E.M. Propagule predation by crabs limits establishment of an endemic mangrove. Hydrobiologia 2015, 755, 257–266. [Google Scholar] [CrossRef]
  48. Primavera, J.H.; Esteban, J.M.A. A Review of mangrove Rehabilitation in. The Philippines: Successes, Failures and Future Prospects. Wetl. Ecol. Manag. 2008, 16, 345–358. [Google Scholar] [CrossRef]
  49. Duke, C.N. Gap creation and regenerative processes driving diversity and structure of Mangrove Ecosystems. Wetl. Ecol. Manag. 2001, 9, 257–269. [Google Scholar] [CrossRef]
  50. Feller, I.C. Effects of nutrient enrichment on growth and herbivory of Dwarf Red Mangrove (Rhizophora Mangle). Ecol. Monogr. 1995, 65, 477–505. [Google Scholar] [CrossRef]
  51. Boto, K.G.; Wellington, J.T. Soil characteristics and nutrient status in a Northern Australian Mangrove Forest. Estuaries 1984, 7, 61. [Google Scholar] [CrossRef]
  52. Bray, R.H.; Kurtz, L.T. Determination of Total, Organic, and Available Forms of Phosphorus in Soils. Soil Sci. 1945, 59, 39–46. [Google Scholar] [CrossRef]
  53. Tisdale, S.L.; Beaton, J.D.; Havlin, J.L.; Nelson, W.L. Soil Fertility and Fertilizers: An Introduction to Nutrient Management, 6th ed.; Prentice Hall: Hoboken, NJ, USA, 1999; p. 07458. [Google Scholar]
  54. Aminudin, S. Study of the Potential for Carbon Stock in Community Forest Exploitation (Case Study: Community Forest in Dengok Village, Playen District, Gunung Kidul Regency); Bogor Agricultural University: Bogor, Indonesia, 2008. [Google Scholar]
  55. Harja, D.; Dewi, S.; Van Nordwijk, M.; Ekadinata, A.; Rahmanulloh, A. REDD Abacus SP-User Manual and Software; World Agroforestry Centre-ICRAF, SEA Regional Office: Bogo, Indonesia, 2011. [Google Scholar]
  56. Sasmito, S.D.; Sillanpaa, M.; Hayes, M.A.; Bachri, S.; Saragi-Sasmito, M.F.; Sidik, F.; Hanggara, B.B.; Mofu, W.Y.; Rumbiak, V.I.; Hendri Taberima, S.; et al. Mangrove blue carbon stocks and dynamics are controlled by hydrogeomorphic settings and land-use change. Glob. Chang. Biol. 2020, 26, 3028–3039. [Google Scholar] [CrossRef] [Green Version]
  57. Sasmito, S.D.; Taillardat, P.; Clendenning, J.N.; Cameron, C.; Friess, D.A.; Murdiyarso, D.; Hutley, L.B. Effect of land-use and land-cover change on mangrove blue carbon: A systematic review. Glob. Chang. Biol. 2019, 25, 4291–4302. [Google Scholar] [CrossRef] [PubMed]
  58. Houghton, R.A. How well do we know the flux of CO2 from land-use changes. Tellus B Chem. Phys. Meteorol. 2010, 62, 337–351. [Google Scholar] [CrossRef]
  59. Sasmito, S.D.; Kuzyakov, Y.; Lubis, A.A.; Murdiyarso, D.; Hutley, L.B.; Bachri, S.; Friess, D.A.; Martius, C.; Borchard, N. Organic carbon burial and sources in soils of coastal mudflat and mangrove ecosystems. Catena 2020, 187, 104414. [Google Scholar] [CrossRef]
  60. Alongi, D.M. Carbon cycling and storage in mangrove forests. Annu. Rev. Mar. Sci. 2014, 6, 195–219. [Google Scholar] [CrossRef]
  61. Hilmi, E. Model Pendugaan Cadangan Karbon Rhizophora spp. Dan Pohon Bruguiera spp Pada Tegakan Hutan Mangrove (Studi Kasus di Indragiri Hilir Riau); Bogor Agricultural University: Bogor, Indonesia, 2003. (In Indonesian) [Google Scholar]
  62. Ola, A.; Schmidt, S.; Lovelock, C.E. The effect of heterogeneous soil bulk density on root growth of field-grown mangrove species. Plant Soil 2018, 432, 91–105. [Google Scholar] [CrossRef]
  63. Lunstrum, A.; Chen, L. Soil carbon stocks and accumulation in young mangrove forests. Soil Biol. Biochem. 2014, 75, 223–232. [Google Scholar] [CrossRef]
Figure 1. Map of study location of mangrove restored area in Lubuk Kertang Village, West Brandan District, Langkat Regency, North Sumatra, Indonesia.
Forests 14 00158 g001
Figure 2. The picture of mangrove growth condition in the planting location obtained from Google Earth satellite images between 2014 and 2022.
Forests 14 00158 g002
Figure 3. The layout of the sampling plots of the planting (100 planting for each plot with a total of 800 planting); (A). Planting using seedlings, (B). Planting using propagules. The green circle represent health mangroves, the yellow are pest-affected mangroves, while the red were indicated mortality.
Forests 14 00158 g003
Figure 4. Above-ground (AGC) and below-ground biomass carbon (BGC) stocks stored and mean annual increment (MAI) in rehabilitated land planted with propagules and seedlings. The different letter notation shows significant differences in the Tukey at p < 0.05.
Forests 14 00158 g004
Figure 5. Soil carbon stocks in two planted approaches in rehabilitated aquaculture ponds of Lubuk Kertang.
Forests 14 00158 g005
Figure 6. Relationships between height, diameter, above-ground biomass, underground biomass, number of leaves, and leaf thickness. (A) Planting with propagules; (B) planting with seedlings (the increasing intensity of the red color in the diagram indicates that the correlation was higher).
Forests 14 00158 g006
Table 1. Allometric equations for calculating mangrove tree biomass used in this study [30].
Above-Ground Tree Weight (Wtop in kg)Below-Ground Tree Weight (WR in kg)
Avicennia marina
Wtop = 0.308 DBH2.11 r2 = 0.97, n = 22, Dmax = 35 cm, [31]
Rhizophora apiculata
Wtop = 0.235 DBH2.42 r2 = 0.98, n = 57, Dmax = 28 cm, [32]
Rhizophora spp.
Wtop = 0.128 DBH2.60 r2 = 0.92, n = 9, Dmax = 32 cm, [33]
Wtop = 0.105 DBH2.68 r2 = 0.99, n = 23, Dmax = 25 cm, [34]
Xylocarpus granatum
Wtop = 0.0823 DBH2.59 r2 =0.99, n = 15, Dmax = 25 cm, [34]
Common equation
Wtop = 0.251 p D2.46 r2 = 0.98, n = 104, Dmax = 49 cm, [35]
Wtop = 0.168 pDBH2.47 r2 = 0.99, n = 84, Dmax = 50 cm, [36]
Avicennia marina
WR = 1.28 DBH1.17 r2 = 0.80, n = 14, Dmax =35 cm, [31]
Bruguiera spp.
WR = 0.261 DBH1.86; r2= 0.92, n = 5, Dmax = 15 cm, [31]
WR = 0.0188 (D2H)0.909 r2: unknown, n = 11, Dmax = 33 cm, [37]
Rhizophora spp.
WR = 0.00974 (D2H)1.05 r2: unknown, n = 16, Dmax = 40 cm, [37]
Common equation
WR = 0.199 p 0.899 D2.22 r2 = 0.95, n = 26, Dmax = 45 cm, [35]
Xylocarpus granatum
WR = 0.145 DBH2.55 r2 = 0.99, n = 6, Dmax = 8 cm, [38]
Table 2. Species found in the Lubuk Kertang restored area in 2016–2022 planted with propagules.
Year Observation MethodSpecies
2016–2019SamplingRhizophora apiculata
2019Census
(13 species)
Acrostichum aureum, Avicennia marina, Bruguiera gymnorrhiza, Excoecaria agallocha, Finlaysonia maritima, Nypa frutican, Rhizophora apiculata, Rhizophora mukronata, Rhizophora stylosa, Scyphiphora hydrophylacea, Sesuvium portulacastrum, Sonneratia alba, and Sonneratia caseolaris
2020Census
(14 species)
Acrostichum aureum, Avicennia marina, Aegiceras corniculatum, Bruguiera gymnorrhiza, Excoecaria agallocha, Finlaysonia maritima, Nypa frutican, Rhizophora apiculata, Rhizophora mukronata, Rhizophora stylosa, Scyphiphora hydrophylacea, Sesuvium portulacastrum, Sonneratia alba, and Sonneratia caseolaris
2022Census
(14 species)
Acrostichum aureum, Avicennia marina, Aegiceras corniculatum, Bruguiera gymnorrhiza, Ceriops tagal, Excoecaria agallocha, Finlaysonia maritima, Nypa frutican, Rhizophora apiculata, Rhizophora mukronata, Rhizophora stylosa, Scyphiphora hydrophylacea, Sesuvium portulacastrum, and Sonneratia alba
Table 3. Types of species found in the Lubuk Kertang restored area 2016–2022 planted with seedlings.
YearObservation MethodSpecies
2016–2019SamplingRhizophora apiculata
2019Census
(12 species)
Acrostichum aureum, Avicennia marina, Bruguiera gymnorrhiza, Excoecaria agallocha, Finlaysonia maritima, Nypa frutican, Rhizophora apiculata, Rhizophora mukronata, Rhizophora stylosa, Scyphiphora hydrophylacea, Sesuvium portulacastrum, and Sonneratia alba
2020Census
(12 species)
Acrostichum aureum, Avicennia marina, Bruguiera gymnorrhiza, Excoecaria agallocha, Finlaysonia maritima, Nypa frutican, Rhizophora apiculata, Rhizophora mukronata, Rhizophora stylosa, Scyphiphora hydrophylacea, Sesuvium portulacastrum, and Sonneratia alba
2022Census
(12 species)
Acrostichum aureum, Avicennia marina, Bruguiera gymnorrhiza, Excoecaria agallocha, Finlaysonia maritima, Nypa frutican, Rhizophora apiculata, Rhizophora mukronata, Rhizophora stylosa, Scyphiphora hydrophylacea, Sesuvium portulacastrum, and Sonneratia alba
Table 4. Comparison of height, diameter, number of leaves, and leaf thickness between the propagules and seedlings planting methods from 6 to 48 months after planting.
MonthHeight (cm)Diameter (cm)Number of LeavesLeaf Thickness (mm)
Propagules planting
650.65 ± 13.280.62 ± 0.12 19.93 ± 9.500.54 ± 0.11
1269.86 ± 14.990.86 ± 0.1937.66 ± 16.340.71 ± 0.09
1892.09 ± 20.741.62 ± 0.39107.80 ± 58.550.64 ± 0.10
24105.72 ± 20.961.89 ± 0.42125.27 ±57.930.84 ± 0.41
30123.53 ± 24.622.12 ± 0.46144.48 ± 65.601.02 ± 0.42
36141.14 ± 24.912.42 ± 0.52 165.74 ± 66.011.25 ± 0.44
42157.36 ± 26.062.82 ± 0.46188.77 ± 65.611.41 ± 0.56
48171.44 ± 23.782.98 ± 0.48205.81 ± 64.101.64 ± 0.19
Seedlings planting
638.19 ± 6.76 0.48 ± 0.0719.93 ± 9.400.60 ± 0.13
1245.17 ± 7.740.60 ± 0.0826.25 ± 10.570.80 ± 0.09
1858.10 ± 13.601.33 ± 0.36104.55 ± 55.270.50 ± 0.07
2467.03 ± 14.851.50 ± 0.37120.67 ± 53.640.72 ± 0.13
30158.40 ± 51.911.81 ± 0.37139.63 ± 52.821.15 ± 0.27
36170.36 ± 51.682.02 ± 0.37158.61 ± 52.301.41 ±0.31
42184.40 ± 50.732.48 ± 0.34228.70 ± 59.430.55 ± 0.05
48190.03 ± 50.952.87 ± 0.42288.59 ± 52.431.05 ± 0.05
Table 5. Number of individuals observed in the restored areas planted with propagules using the census method from 2019–2022.
No SpeciesSeedlingSaplingTree
201920202022201920202022201920202022
1Acrostichum aureum101180187------
2Aegiceras corniculatum-1---1-
3Avicennia marina4165176-521
4Bruguiera gymnorrhiza1112502138-218
5Ceriops tagal--5------
6Excoecaria agallocha75492--812
7Finlaysonia maritima7790160------
8Nypa frutican--4333-33
9Rhizophora apiculata891227322233429452293719601871
10Rhizophora mucronata811582115-321
11Rhizophora stylosa241237983162522061266252
12Scyphiphora hydrophyllacea6770172012--11
13Sesuvium portulacastrum78139120------
14Sonneratia alba8581609988021433969434651433
15Sonneratia caseolaris---2--22
Total22821060203934954814352711717143675
Table 6. Number of individuals observed in restored areas planted with seedlings using the census method from 2019–2022.
No SpeciesSeedlingSaplingTree
201920202022201920202022201920202022
1Acrostichum aureum212641------
2Avicennia marina102891614122
3Bruguiera gymnorrhiza15186122418-1-
4Ceriops tagal--2------
5Excoecaria agallocha---131311--2
6Finlaysonia maritima92539------
7Nypa frutican--3---111111
8Rhizophora apiculata621714339325930402061104491996
9Rhizophora mucronata101-251919-44
10Rhizophora stylosa6266115271387262179118
11Scyphiphora hydrophyllacea1311277765311134
12Sesuvium portulacastrum102840------
13Sonneratia alba74513323488012527691215921026
Total 1516102490945414816318514711413194
Table 7. Diversity (H′) observed in the restored areas planted with propagules surveyed between 2019–2022.
No SpeciesSeedlingSaplingTree
201920202022201920202022201920202022
1Acrostichum aureum0.140.300.22------
2Aegiceras corniculatum-0.01---0.01-
3Avicennia marina0.010.010.020.010.020.00-0.020.03
4Bruguiera gymnorrhiza0.03-0.090.000.020.01-0.010.03
5Ceriops tagal-0.050.01------
6Excoecaria agallocha0.020.030.010.020.01--0.030.02
7Finlaysonia maritima0.11-0.20------
8Nypa frutican-0.210.010.000.000.00-0.010.01
9Rhizophora apiculata0.370.330.290.270.290.280.300.320.34
10Rhizophora mucronata0.020.10.040.010.020.02-0.010.02
11Rhizophora stylosa0.240.330.150.220.150.170.040.290.29
12Scyphiphora hydrophyllacea0.020.030.120.030.030.04--0.03
13Sesuvium portulacastrum0.120.270.17--0.35---
14Sonneratia alba0.370.290.350.340.360.350.370.350.36
15Sonneratia caseolaris---0.00--0.070.01-
Total 1.431.861.670.900.900.890.781.051.13
Table 8. Diversity (H′) observed in the restored areas planted with seedling surveyed between 2019–2022.
No SpeciesSeedlingSaplingTree
201920202022201920202022201920202022
1Acrostichum aureum0.060.090.14------
2Avicennia marina0.030.010.040.000.020.020.020.010.00
3Bruguiera gymnorrhiza0.050.070.180.020.030.03-0.01-
4Ceriops tagal--0.01------
5Excoecaria agallocha---0.020.020.02--0.00
6Finlaysonia maritima0.030.090.14------
7Nypa frutican--0.02---0.140.040.02
8Rhizophora apiculata0.370.250.370.240.290.280.130.370.29
9Rhizophora mucronata0.030.01-0.030.020.03-0.020.1
10Rhizophora stylosa0.130.180.260.170.200.210.020.190.12
11Scyphiphora hydrophyllacea0.040.050.100.070.060.050.020.010.05
12Sesuvium portulacastrum0.030.010.14------
13Sonneratia alba0.350.270.350.320.350.340.090.340.36
Total1.121.111.750.860.980.990.430.980.86
Table 9. Index of evenness and dominance of vegetation planting with propagules.
IndexesSeedlingSaplingTree
201920202022201920202022201920202022
Evenness (E)0.600.750.670.410.390.430.560.480.51
Dominance (D)0.310.170.290.510.490.500.500.410.38
Table 10. Index of evenness and dominance of vegetation planting with seedlings.
IndexesSeedlingSaplingTree
201920202022201920202022201920202022
Evenness (E)0.480.480.760.410.470.470.240.470.48
Dominance (D)0.410.500.230.550.470.480.810.430.50
Table 11. Percentage of plant survival and mortality between 6–48 months (2016–2019) of individual observation and followed by plant census for the remaining period up to 2022 or 7 years old.
Years Month% Survival% of Mortality
Planting with Propagules
2016692.507.50
20161291.009.00
20171889.7510.25
20172488.7511.25
20183088.5011.50
20183688.2511.75
20194288.2511.75
20194887.7512.25
201948 (census)71.6028.40
202060 (census)71.8328.17
202272 (census)69.4230.58
Planting with seedlings
2016693.256.75
20161292.507.50
20171892.257.75
20172492.008.00
20183092.008.00
20183692.008.00
20194292.008.00
20194892.008.00
201948 (census)79.8020.20
202060 (census)84.8815.12
202272 (census)86.3813.62
Note: Observations when the plants are 6–48 months old; a sample of 800 seeds is used.
Table 12. Intensity of pest attacks on mangrove stands.
Planting withPlotNumber of PlantsPest Attack Intensity (%)Category
Propagules1926.52mild
2837.23mild
39411.70mild
4854.70mild
Seedlings1932.15mild
2905.55mild
3886.81mild
4943.19mild
Table 13. Analysis of soil chemical properties for planting rehabilitation using propagules.
ParametersUnitStandard ValueRehabilitation LandDescription
pH 4.5–5.54.850Acidic
N-total%0.10–0.200.107Low
Name/100 g>1.08.540Very high
Kme/100 g0.3–0.50.540Medium
Mgme/100 g2.1–8.03.310High
Came/100 g<21.140Very low
KTKme/100 g5–168.200Low
SalinityPpm20–4521.260Very high
Table 14. Analysis of soil chemical properties for planting rehabilitation using seedlings.
ParametersUnitStandard ValueRehabilitation LandDescription
Ph 4.5–5.55.000Acidic
N-total%0.10–0.200.110Low
Name/100 g>1.010.700Very high
Kme/100 g0.6–10.690Very high
Mgme/100 g2.1–8.03.790High
Came/100 g<21.580Very low
KTKme/100 g17–2411.060Medium
SalinityPpm20–4528.670Very high
Disclaimer/Publisher’s Note: The statements, opinions and data contained in all publications are solely those of the individual author(s) and contributor(s) and not of MDPI and/or the editor(s). MDPI and/or the editor(s) disclaim responsibility for any injury to people or property resulting from any ideas, methods, instructions or products referred to in the content.

