Article

Functional Diversity of Soil Microorganisms and Influencing Factors in Three Typical Water-Conservation Forests in Danjiangkou Reservoir Area

1
Research Institute of Forestry, Chinese Academy of Forestry, Beijing 100091, China
2
Taiyuan Forestry and Grassland Engineering Technology Center, Taiyuan 030000, China
*
Author to whom correspondence should be addressed.
Submission received: 9 November 2022 / Revised: 18 December 2022 / Accepted: 26 December 2022 / Published: 29 December 2022

Abstract

:
As a key part of the forest ecosystem, soil microorganisms play extremely important roles in maintaining the ecological environment and the security of water quality in reservoir areas. However, it is not clear whether there are differences in the functional diversity of soil microorganisms in different types of water-conservation forests in reservoir areas, and which factors affect the functional diversity of soil microorganisms. In our study, the Biolog-Eco microplate technique was used to analyze the carbon source metabolic characteristics of soil microbial communities in three typical water-conservation forests and a non-forest land: Pinus massoniana-Quercus variabilis mixed forest (MF), Pinus massoniana forest (PF), Quercus variabilis forest (QF) and non-forest land (CK). The results showed that the average well color development (AWCD), the Shannon diversity index (SDI) and the richness index (S) of the three forest lands was significantly greater than that of the non-forest land (p < 0.05). The mean values of AWCD, SDI and S of the three forests had the same order (QF > PF > MF), but there was no significant difference among different types of forests. The microbial biomass carbon (MBC) and microbial biomass nitrogen (MBN) of QF and PF were higher than those of MF and CK, but the microbial biomass C/N ratio (MBC/MBN) was lower. The variance partitioning analysis (VPA) showed that 86.4% of the variation was explained by plant (community) diversity, soil physical and chemical properties and soil microbial biomass, which independently explained 10.0%, 28.9%, and 14.9% of the variation, respectively. The redundancy analysis (RDA) showed that total phosphorus (TP), microbial biomass carbon (MBC), total nitrogen (TN), number of plant species (Num) and alkali-hydro nitrogen (Wn) were the key factors affecting the functional diversity of soil microorganisms. This study confirmed that forest ecosystem is better than non-forest land in maintaining soil microbial function diversity. Moreover, Quercus variabilis forest may be a better stand type in maintaining the diversity of soil microbial functions in the study area.

1. Introduction

A water-conservation forest is a kind of protection forest with special significance. It comprises the original forest (including original forest and secondary forest) and plantations in the upstream catchment of rivers, reservoirs, and lakes. These forests not only have the usual ecological, economic and social benefits of forests, but also have the functions of conserving and protecting water resources, controlling flooding, and preventing soil erosion [1]. Forest soil plays an important role in the realization of forest function, and good water permeability can effectively control the occurrence and development of soil erosion [2]. Forest soil has adsorption and fixation effects on heavy metals, NH4+ [3,4,5], and most of this process is completed by the activities of soil microorganisms and their enzymes [6]. As an important part of the forest ecosystem, soil microorganisms play key roles in soil fertility formation and biogeochemical cycle processes [7,8,9,10]. Soil microorganisms are widely involved in the biological and biochemical processes of soil, including organic matter degradation, mineralization and humification [11]. They not only reflect soil conditions, but also reflect the status and functions of soil microbial communities [12,13,14]. The mineralization rate of soil organic matter may depend on the community composition and metabolism of soil microorganisms [15].
The methods used to reflect the functional diversity of soil microbial communities usually include the Biolog-Eco microplate culture method, Multiple carbon-sources Substrate-induced Respiration (Multi-SIR) and the MicroRespTM method [16,17]. The Multi-SIR method has the characteristics of low automation, cumbersome operation, and poor convenience, limiting its application [17]. The MicroRespTM method is developed on the basis of combining the advantages of the Biolog-Eco microplate culture method and the Multi-SIR method [18]. However, there are relatively few studies on the MicroRespTM method at present, and its function has not been fully revealed [17]. Biolog-Eco microplate culture can sensitively reflect the dynamic changes in functional microbial communities [19,20], so it is widely used to evaluate the metabolic functional diversity of forest soil microbial communities under different management modes and vegetation types [21,22,23,24].
The current research mainly focuses on the metabolic diversity of soil microbial communities under different altitude gradients, climate change, human disturbance and rhizosphere environment. It has been found that different elevation gradients in alpine meadows significantly influence the metabolism diversity of microbial communities [25]. Elevated CO2 concentration could significantly increase the activity of microbial communities and the utilization of carbon sources in the root zone of Lycium barbarum [26]. Fire changes the soil microenvironment and soil’s biological functions [27], in turn changing soil microbial metabolic patterns and plant growth [28]. Changes in land cover conversion have a significant impact on soil carbon and nitrogen stocks, as well as the soil microbial properties of the topsoil of alpine meadows in the Tibetan Plateau. Alpine meadow soils have the highest soil microbial biomass and microbial metabolic activity of the three land cover types [29].
Previous studies shown that the functional diversity of soil microbial communities is affected by plant composition, soil physical and chemical properties, litter composition, and other factors [30,31,32]. Plant diversity is closely related to the metabolic diversity of the soil microbial community [33,34,35,36], and significantly affects the structure, activity and soil microbial biomass of the soil microbial community [37,38]. The physical and chemical properties of soil can affect the activities of soil microorganisms. For example, as an essential soil property, soil moisture content can regulate the activities of microorganisms and their related processes [39]. Although many studies have focused on soil microorganisms, the study of the functional diversity of soil microbial communities in different forest types is relatively rare.
Danjiangkou reservoir area is the headwaters region of the Middle Route Project of South-to-North Water Transfer in China, which is responsible for providing sustainable and high-quality water sources to North China. As a key national ecological function protection area, the ecological environment and water quality safety in the reservoir area have always been issues of great concern to the government and the public [40,41]. The forest types around the reservoir area are rich, and the most typical forest types include Pinus massoniana-Quercus variabilis mixed forest, Pinus massoniana forest, and Quercus variabilis forest. These forests play extremely important roles in maintaining the ecological environment and water quality security in the reservoir area. However, it is not clear whether there are differences in the functional diversity of soil microorganisms in the three typical water-conservation forests, and if so, what factors affect the functional diversity of soil microorganisms. In our study, three typical water-conservation forests in the Danjiangkou reservoir area are taken as research objects, and the metabolic characteristics of soil microbial communities are analyzed with the Biolog-Eco microplate method.
By comparing the functional diversity of soil microorganisms in three typical water-conservation forests, the forest stands with the most influence on the ecological service function of water-conservation forests were determined. Our study answers the following two questions: (1) Are there significant differences in the functional diversity of soil microorganisms among the three typical water-conservation forests? (2) Regarding plant (community) diversity, soil physicochemical properties, and soil microbial biomass, which are the key factors affecting the functional diversity of soil microorganisms? The analysis of the functional diversity of soil microorganisms and the influencing factors of three typical water-conservation forests will guide the regulation of soil microbial function and future forest management planning.

2. Materials and Methods

2.1. Study Area

The study was carried out in Longkou forest farm (32°41′1″ N, 111°11′0″ E), Danjiangkou City, Hubei Province, China, which is in a subtropical monsoon humid climate area. The altitude range of the study area is 189–201 m asl., and the slope range is 18–21°. The average annual temperature is 15.9 °C, the annual mean sunshine duration is 1950 h, the annual average precipitation is 750–900 mm, and precipitation is concentrated in July, August and September. The annual evaporation is 1979.1 mm. The landform types are mainly low mountains and hills, and the soils type are yellow brown soil and yellow soil, developed from limestone, gneiss, etc., with a loose texture and serious soil erosion. The percentages of sand, silt and clay in the soil are 11%, 41%, and 48%, respectively. The thickness of the soil layer is generally 15–30 cm [42,43]. The forest community types are composed of artificial forest and secondary forest, and the arbors mainly include Pinus massoniana, Quercus variabilis, etc. The shrub types include Artemisia argyi, Ligustrum lucidum, Rosa cymosa, etc., and the herb types mainly include Ophiopogon bodinieri, Oxalis corniculata, Digitaria sanguinalis, Imperata cylindrica, etc.

2.2. Experimental Design and Sample Collection

The experiment began in August 2019, and 12 sample plots (20 m × 20 m) were randomly established within the forest farm. Four treatments with three replications were established: (1) Pinus massoniana-Quercus variabilis mixed forest (MF); (2) Pinus massoniana forest (PF); (3) Quercus variabilis forest (QF); (4) non-forest land (CK: land without arbors, but with (few) shrubs and herbs growing naturally). The distances between the various plots were more than 1000 m. The diagonal five-point sampling method was adopted in the experiment. The soil samples were collected from the 0–20 cm depth by soil drill after removing the organic horizons. The samples were mixed evenly and sieved to remove the visible animal and plant residues on the surface, and then three parallel samples were obtained. The samples were taken back to the laboratory in sterile bags. Some of them were stored at 4 °C in a refrigerator for the determination of soil microbial functional diversity. The other soil samples were air-dried, ground, and sieved through a 2 mm sieve, and the basic physical and chemical properties of the soil were analyzed with conventional methods. The stand characteristics of three typical water-conservation forests were measured, such as tree height, breast height diameter, stand density, and tree age during the experiment (Table 1). Five quadrats of 2 m × 2 m were randomly selected in each plot to investigate the species and number of shrubs and herbs (Table 2).

2.3. Analysis of Soil Physicochemical Properties

The soil pH value was measured by the glass electrode method (soil water ratio 1:2.5). The soil moisture content was measured by the oven-drying method. The NO3--N and exchangeable NH4+-N in the soil samples were extracted with 2 mol/L KCl solution [44], and then determined with a flow analyzer (Braun and Lübbe, Norderstedt, Germany). Total organic carbon (TOC) was determined with the potassium dichromate hydration heating method. Total nitrogen (TN) was measured with the semimicro-Kjeldahl method. Alkali hydrolyzed nitrogen (Wn) was measured with the alkali hydrolysis diffusion method [44]. Soil microbial biomass carbon (MBC) and soil microbial biomass nitrogen (MBN) were measured with the chloroform fumigation extraction method [45,46].

2.4. Determination of Metabolic Characteristics of Soil Microbial Community

The Biolog microplate technique was used to analyze the metabolic characteristics of the soil microbial community. Weighed fresh soil samples equivalent to 30 g of dry mass were added into 270 mL of 0.85% NaCl solution; the soil-to-extraction solution ratio was approximately 1:21 (v/v). The bottle was shaken at 180 r·min−1 for 30 min and the suspension was filtered; then, 3 mL of supernatant was added to 27 mL of NaCl solution, which was thoroughly mixed. Then, the diluted 3 mL of supernatant was added to another 27 mL of NaCl solution. After dilution, this soil solution was finally diluted to 10−3 and prepared for immediate reaction. We inoculated the diluent on an ecological test plate on an ultra-clean workbench; each well was inoculated with 150 μL diluent and incubated at 28 °C. The absorbance at 590 nm (OD590) was read for each well using a Biolog microplate reader (Biolog Inc., Hayward, CA, USA) following incubation at 24, 48, 72, 96, 120, 144, and 168 h, respectively.
Average well color development (AWCD) represents the carbon source utilization rate of the microbial community, which is an important indicator of the ability of the soil microbial community to utilize single carbon source and reflects soil microbial activity and the functional diversity of the microbial community [47]. The calculation formula of AWCD based on the absorbance value of the solution in the hole of the Biolog-Eco microplate is as follows:
AWCD = C i R n
where C i represents the absorbance of each hole; R represents the optical density value of the control well; and n represents the number of carbon sources in the culture medium (n = 31) [27].
The Shannon Wiener diversity index ( H p l a n t   and   H m i c ) is as follows:
H ' = P i ln P i
where P i represents the proportion of the number of individuals of this species to the total number of individuals or the ratio of the absorbance value in the ith noncontrol well to the sum of the absorbance values of all noncontrol wells [48]. H p l a n t represents the Shannon diversity index of the plants, and H m i c represents the Shannon diversity index of the soil microorganisms. The following   H ' m i c is abbreviated as SDI.
Richness index (S) is expressed by the number of carbon source metabolic control wells (AWCD > 0.2).

2.5. Data Analysis

The single well optical density values after 96 h incubation were selected, and SPSS 19.0 software was used to carry out principal component analysis (PCA) to analyze the ability of soil microorganisms to utilize carbon source species in three typical water-conservation forests. Redundancy analysis (RDA) and variance partitioning analysis (VPA) were carried out with Canoco 5.0 to determine the impact of environmental factors on the functional diversity of the soil microorganisms. We used AWCD values of 31 carbon sources with 96 h soil samples and environmental factors for RDA and VPA. Environmental factors included plant community diversity, soil physical and chemical properties, and soil microbial biomass, among which plant community diversity included the number of plant species (Num) and H’plant; soil physical and chemical properties included pH, SWC, TN, TP, TOC, Wn, TOC/TN, NH4+-N, and NO3--N; and soil microbial biomass included MBC, MBN, and MBC/MBN. One-way ANOVA was used to test the differences in plant (community) diversity, physicochemical properties, soil microbial biomass and diversity index (SDI, S) between the three typical water-conservation forests. Fisher’s least significant difference (LSD) test for multiple comparisons was run if significant differences were found (p < 0.05). Data were summarized and calculated using Excel (Microsoft Office 2021) and SPSS 19.0 and plotted using Origin pro9.1.

3. Results

3.1. Plant (Community) Diversity

In terms of plant (community) diversity, the three forests did not show significant differences, but there were significant differences between forests and non-forest lands. Both Num and H’plant of the four treatments are in the same order, QF > MF > PF > CK. Moreover, Num of all the three forests were significantly higher than CK, respectively, while H’plant of QF and MF were significantly higher than CK, respectively, (p < 0.05) (Table 2).

3.2. Soil Physicochemical Properties

QF and MF exhibit more similar properties than PF and CK in pH, TN, TOC, NO3--N. The soils of the three typical water-conservation forests were all acidic, and the range of pH value was 5.30–6.33. The mean value of pH in CK was the highest; PF and QF took second place, and MF was the lowest. This shows that the pH value of coniferous forest was higher than that of the broadleaf forest and coniferous broadleaf mixed forests. The soil water content (SWC) of QF was the highest (18.72 ± 1.78%), showing significant difference from the other two water-conservation forests (p < 0.05). QF and MF had similar TN values and were significantly higher than PF and CK (p < 0.05). The mean value of TOC content was the highest in QF, but QF was only significantly higher than PF and CK (p < 0.05). The NH4+-N content was the highest in MF (1.32 ± 0.71 mg kg−1), but there were no significant differences between PF, QF, and CK (p > 0.05). PF had the highest content of NO3--N (1.98 ± 0.67 mg kg−1), showing significant difference from MF, QF, and CK (p < 0.05). The content of Wn was the highest in QF (56.95 ± 11.95 mg kg−1), but only showed significant difference from CK (p < 0.05). The TP content of CK was the highest (0.33 ± 0.01 g kg−1), and was significantly higher than that of MF, PF, and QF (p < 0.05) (Table 3).

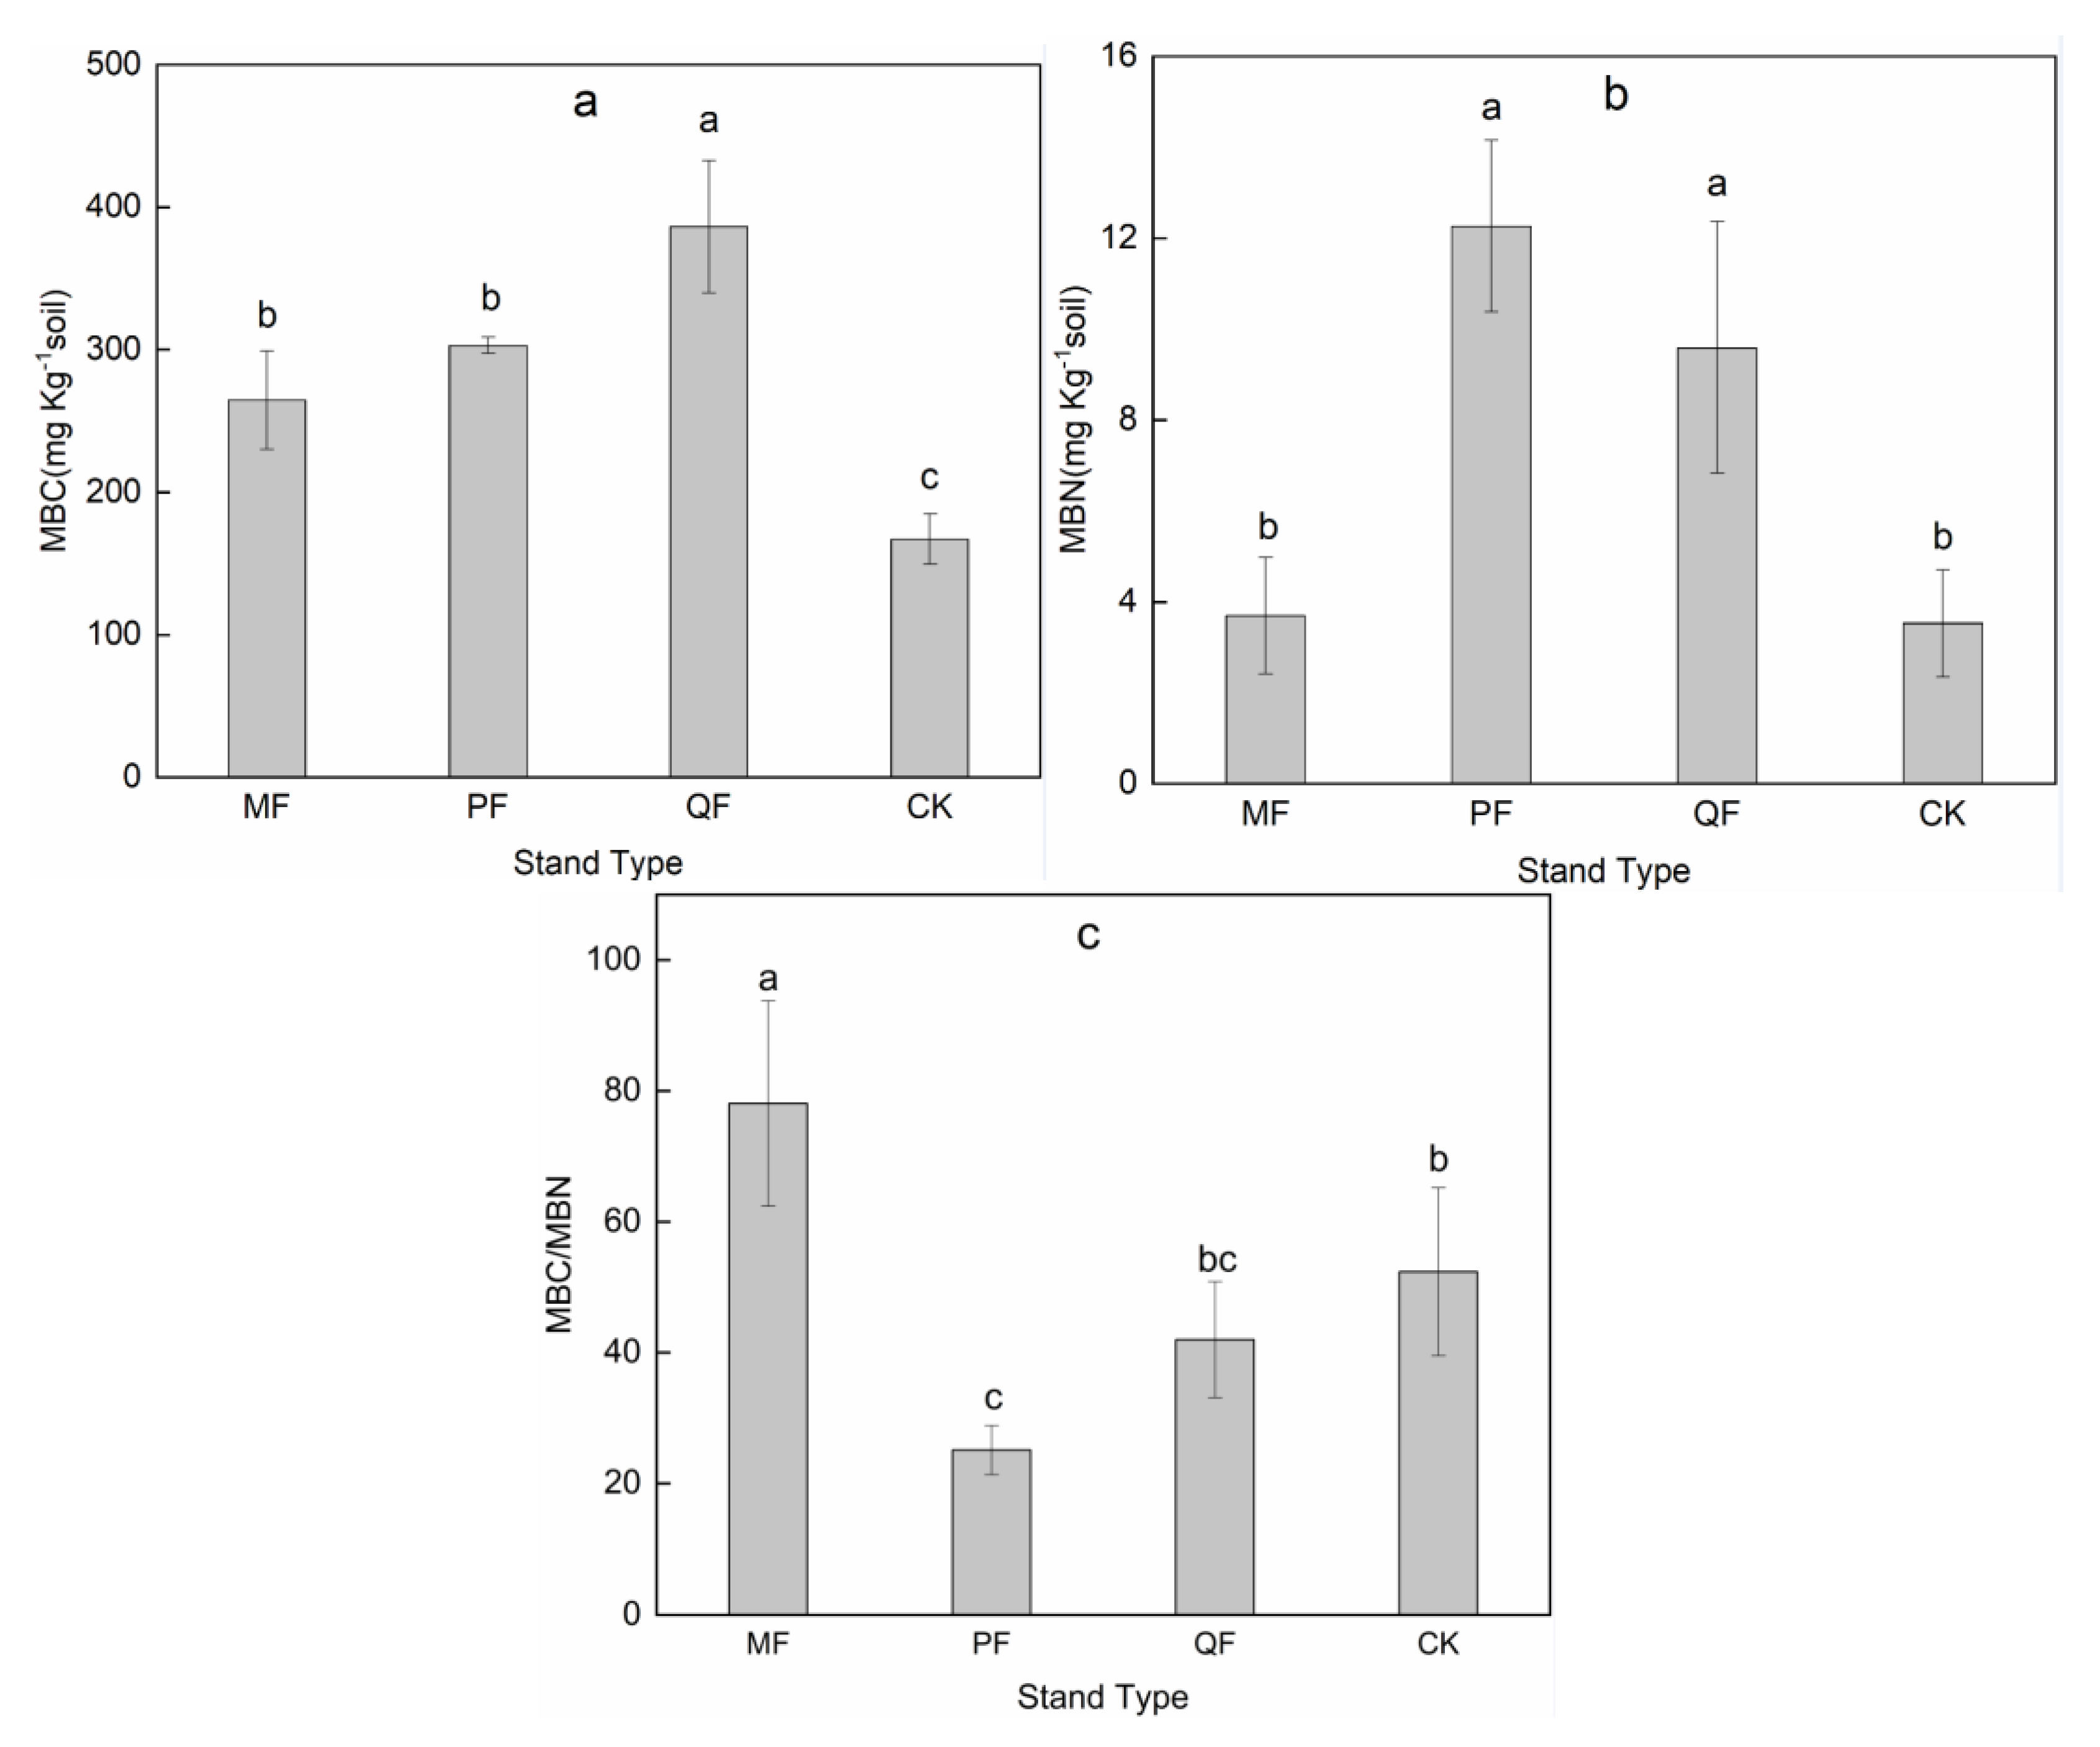
3.3. MBC, MBN and Microbial Biomass C/N Ratios

The pure forests had both higher MBC and MBN but lower microbial biomass C/N ratios (MBC/MBN) than the mixed forest and non-forest land. Compared with MF, PF, and CK, the MBC of QF was the highest and the difference was significant (p < 0.05). PF had the highest MBN and the lowest MBC/MBN, but the difference from QF was not significant (p > 0.05) (Figure 1).

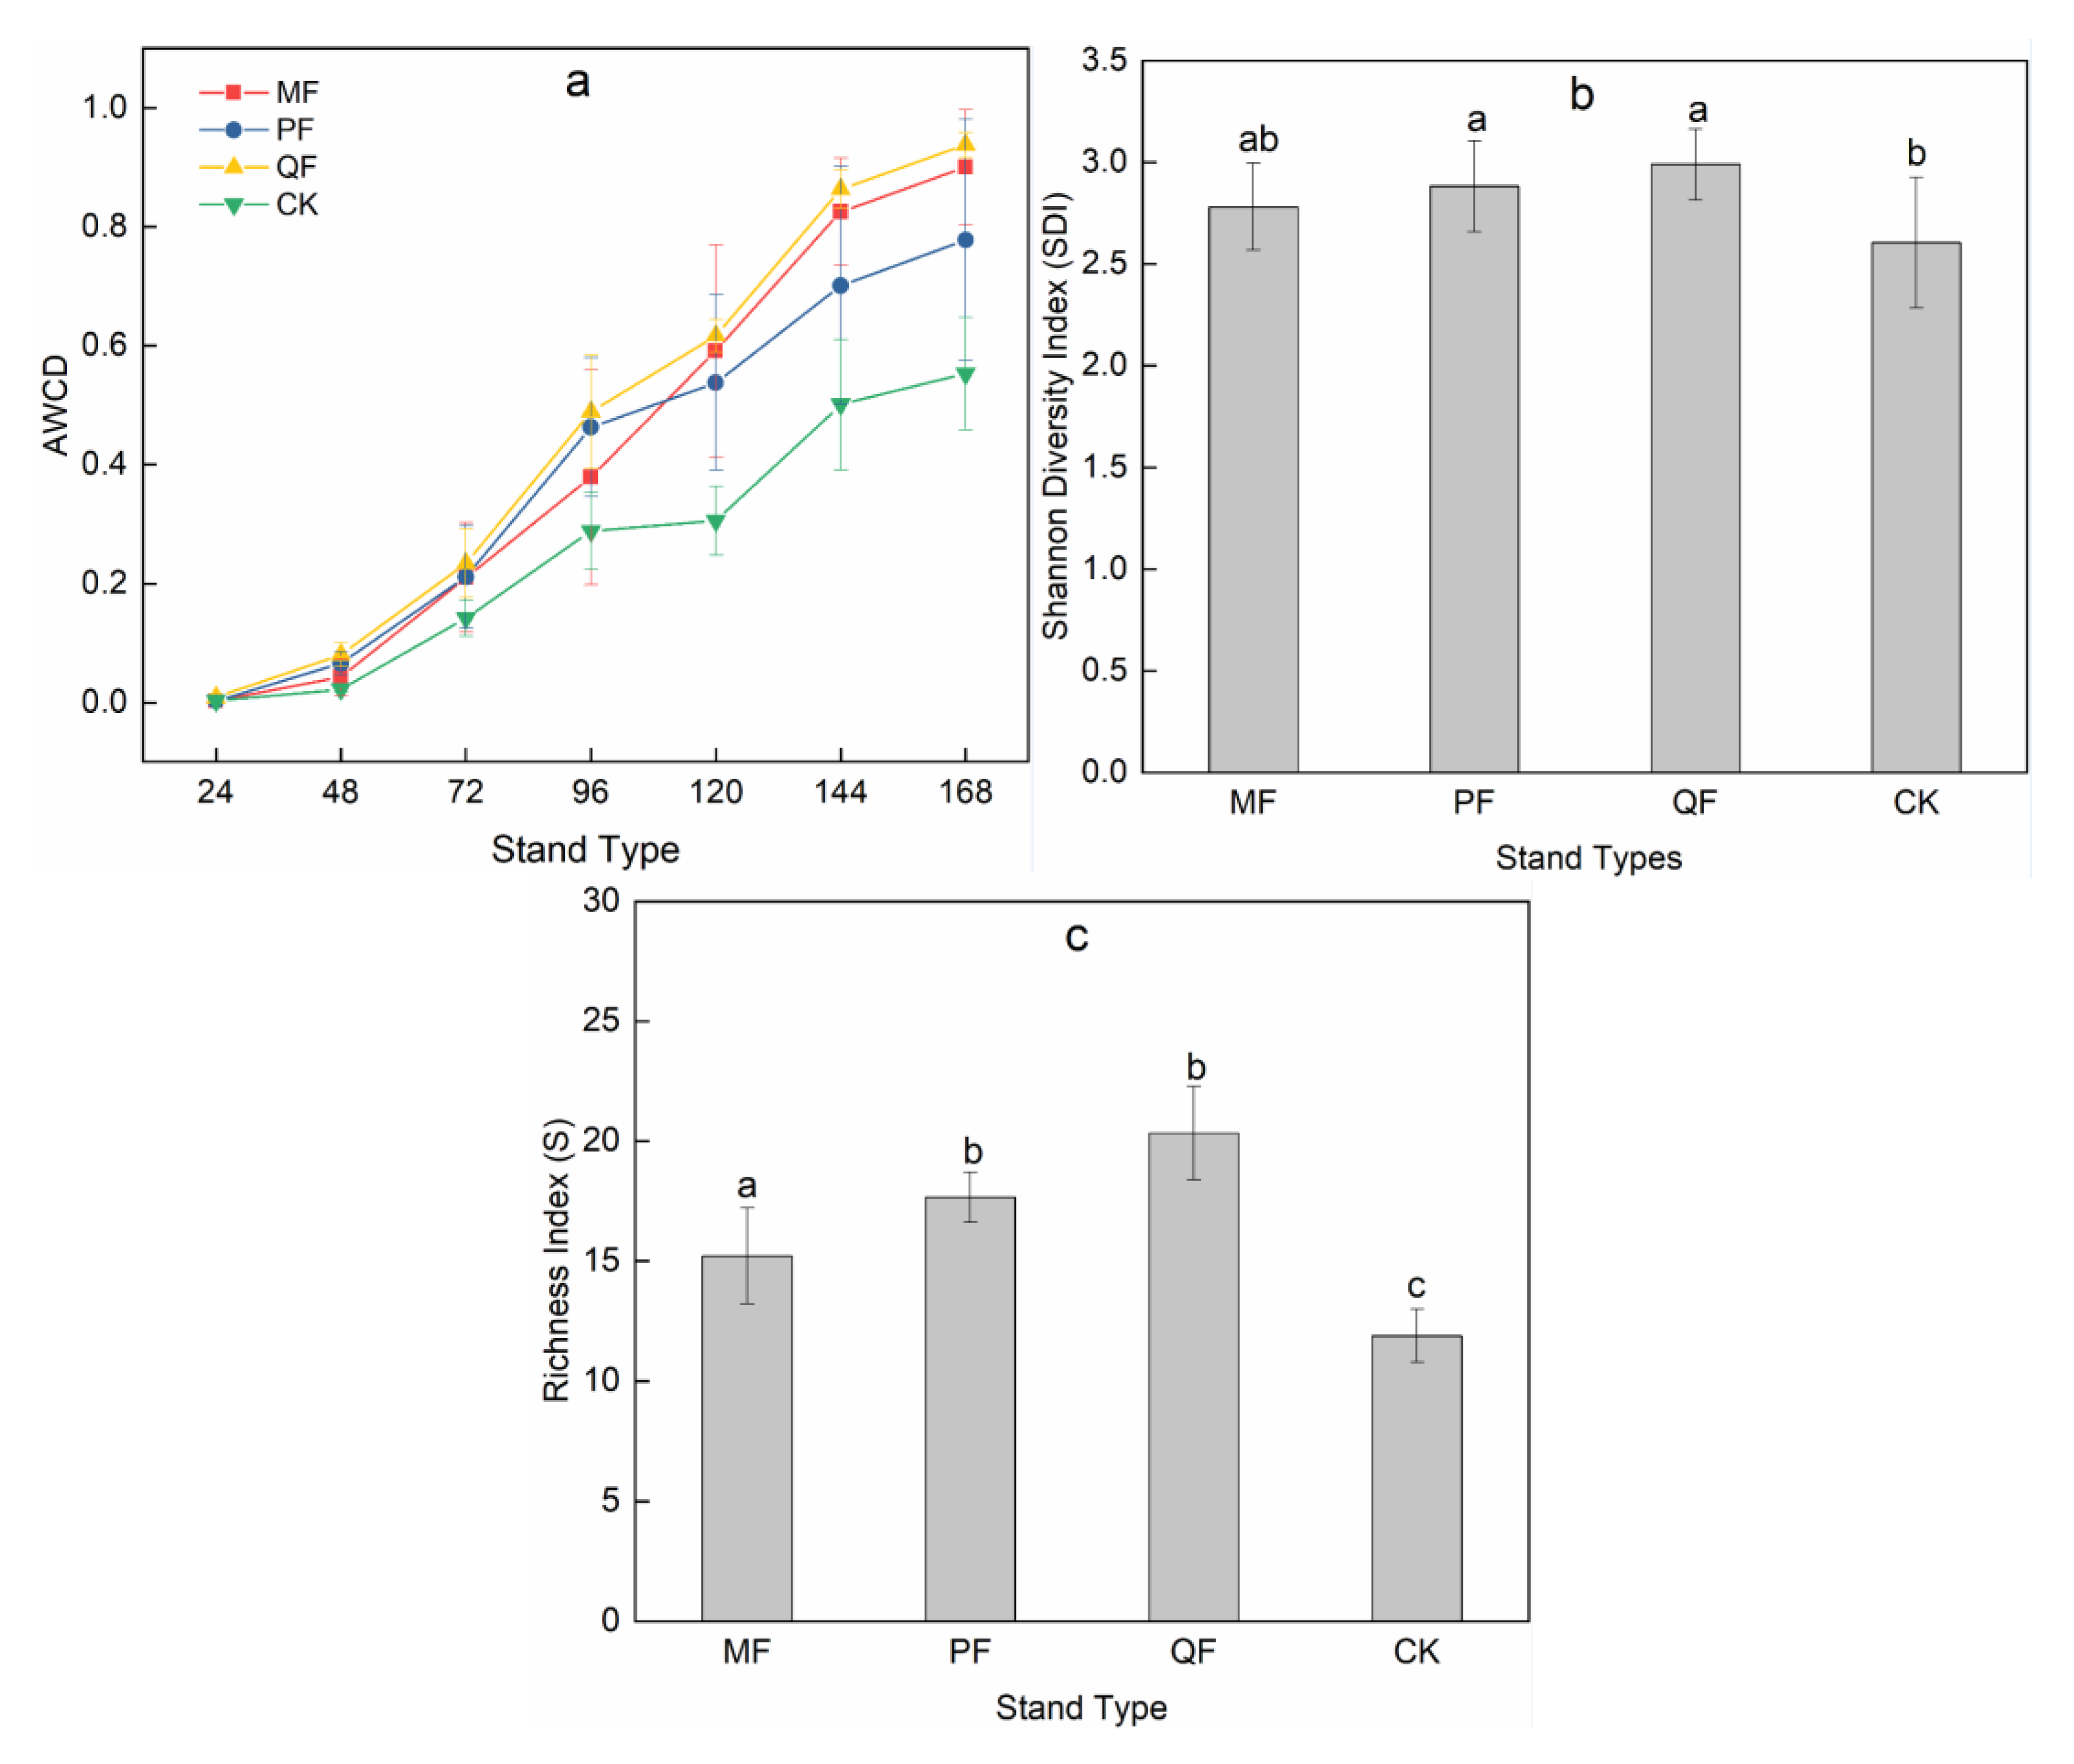
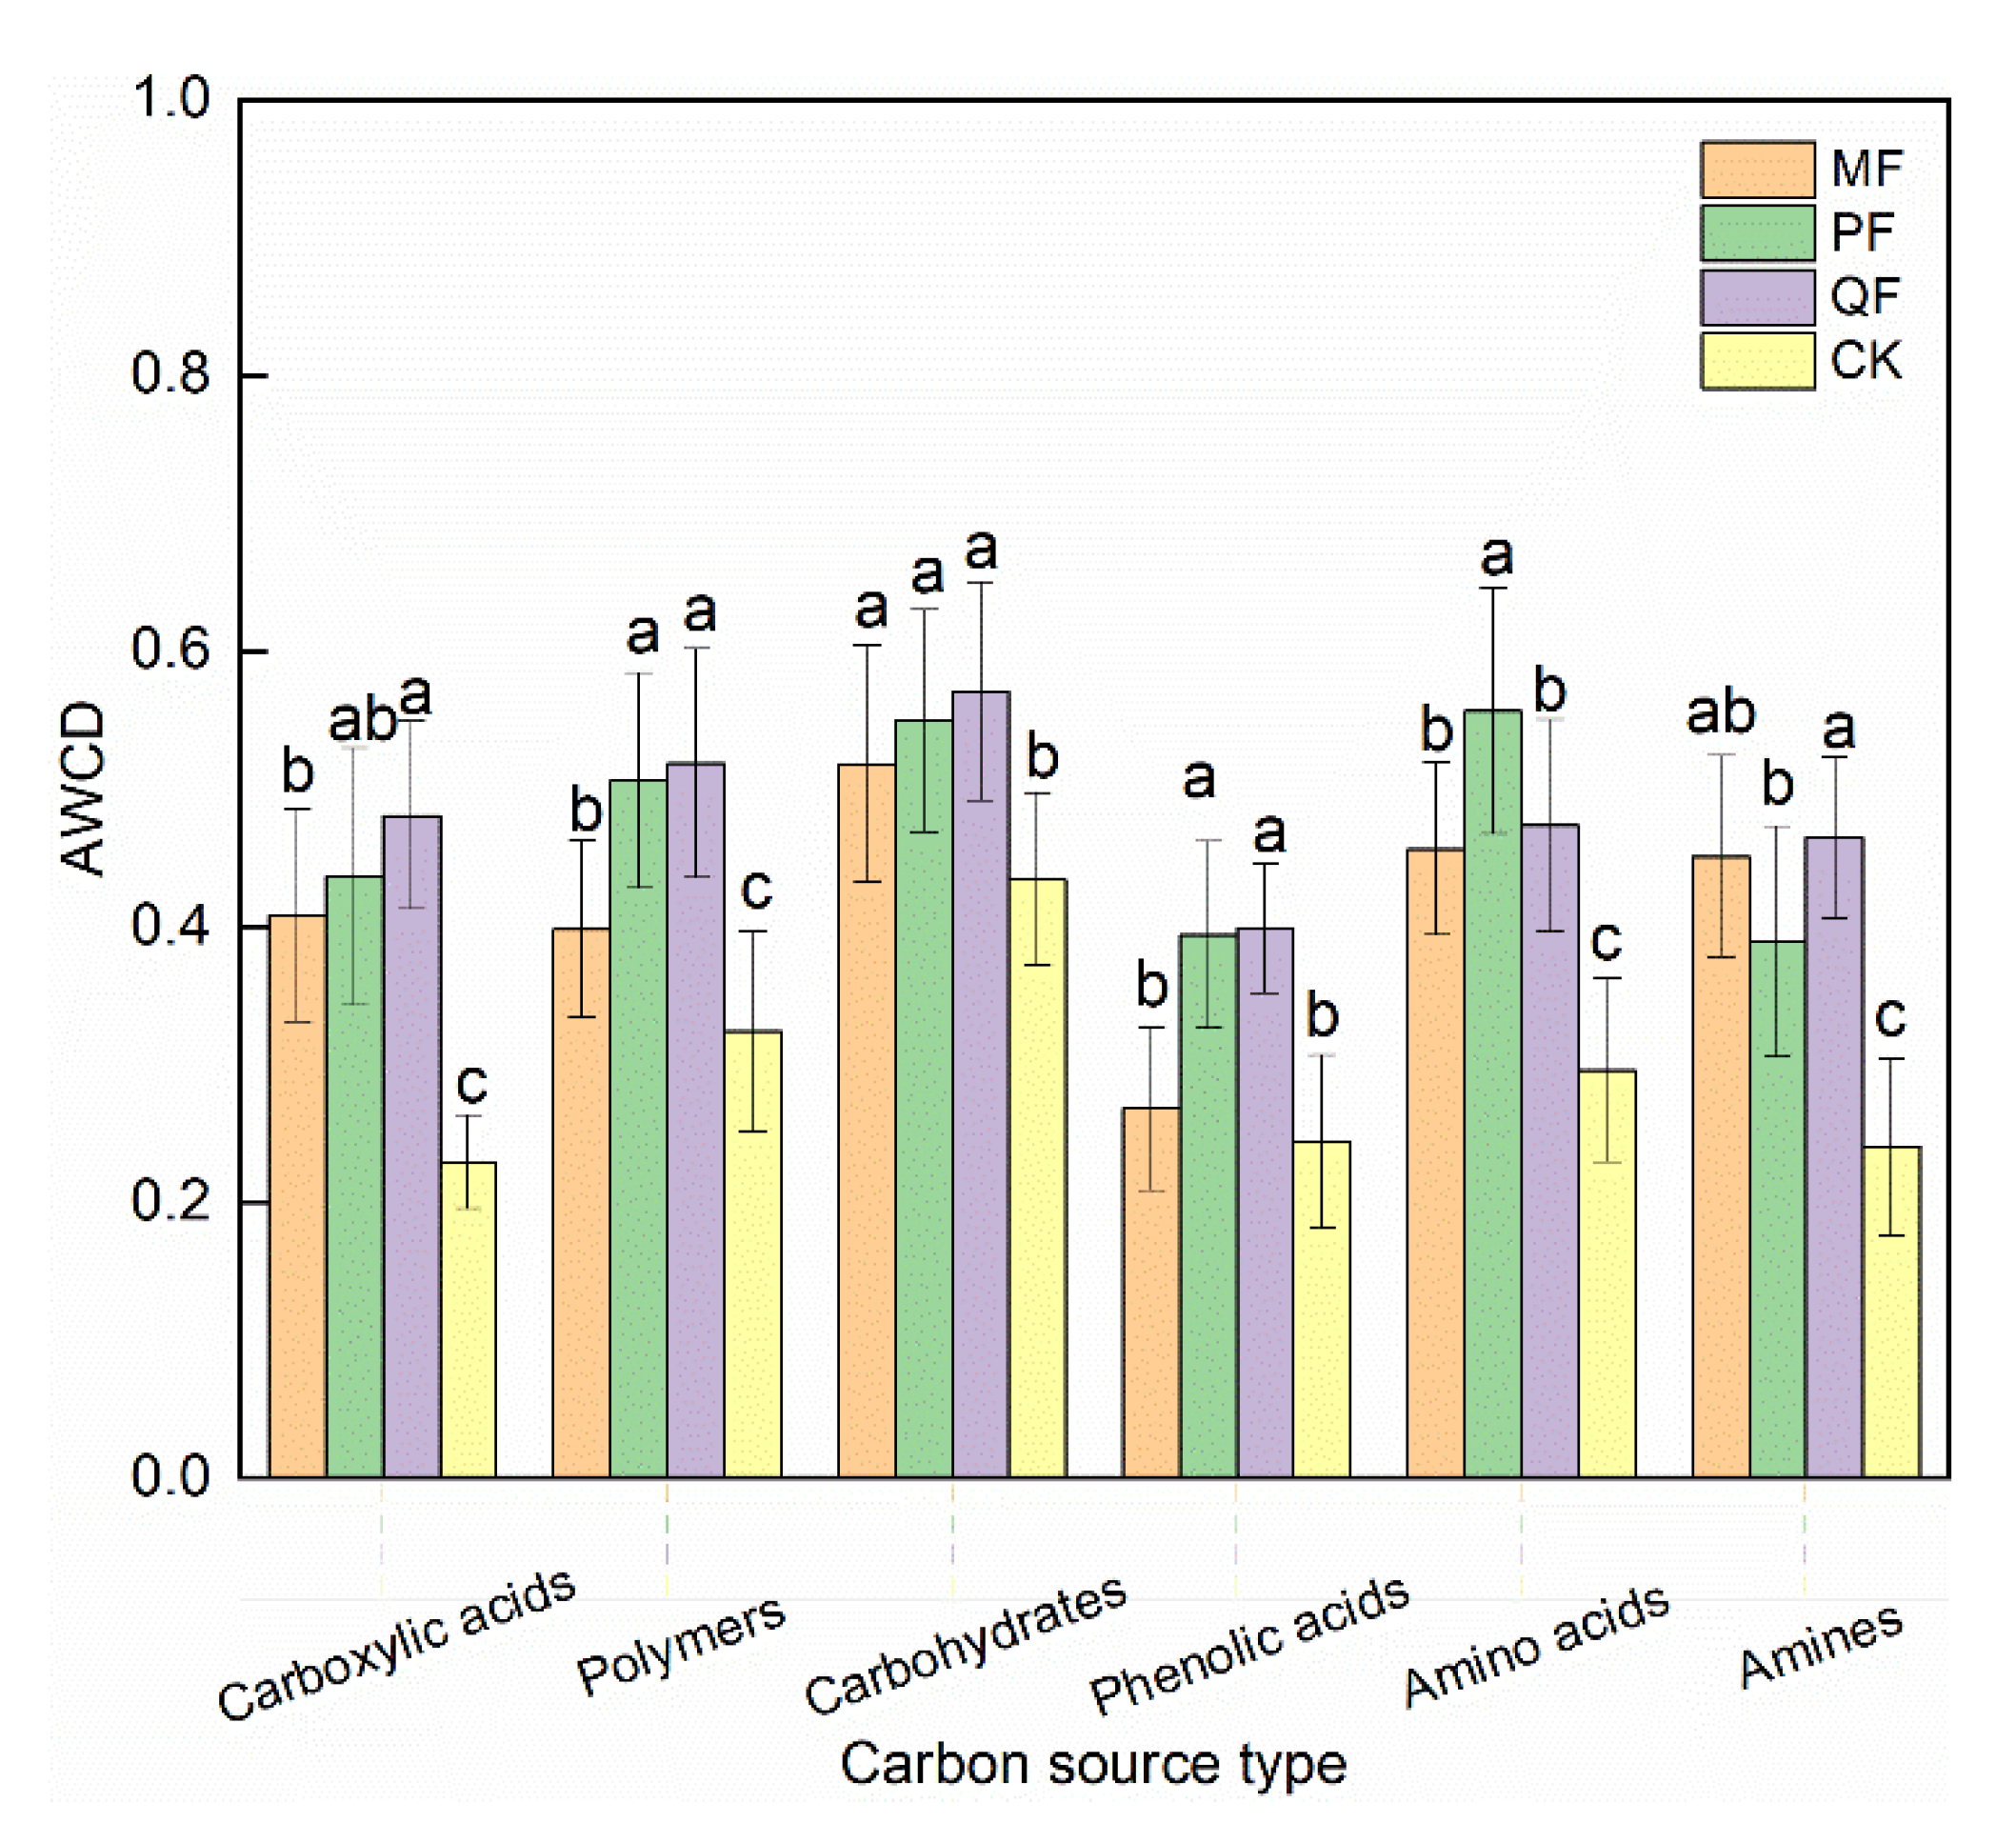
3.4. Functional Diversity of Soil Microorganisms

The AWCD dynamics of MF, PF, and QF were significantly larger than those of CK (p < 0.05), respectively. The AWCD of QF was always the largest, while CK was always the smallest, indicating that QF had the strongest metabolic activity against soil microorganisms and CK had the weakest metabolic activity. Before 96 h, PF’s AWCD was always greater than MF, but after that, PF’s AWCD was less than MF.
The SDI and S of QF and PF were significantly larger than those of CK, respectively, and the S of MF was also significantly larger than that of CK (p < 0.05). The SDI and S of QF were the largest among the three forest stands, while the SDI and S of PF were the second. The difference in SDI between the three typical forests was not significant, yet the S of PF and QF were significantly greater than MF (Figure 2).
The PCA was performed using the absorbance values of the 96 h incubation in this study. The variance contribution rates of the first principal component and the second principal component were 39.4% and 19.9%, respectively. Figure 3 shows the approximate distribution range of the three typical water-conservation forests. PF is located at the positive direction of PC1; CK is located at the negative direction of PC1; MF is located at the positive direction of PC2; and QF is located at the negative direction of PC2. The three typical water-conservation forests are distributed in three different quadrants, and there are obvious spatial differences in terms of carbon source utilization, indicating that the soil microorganisms of the three typical forests have their own unique carbon source utilization patterns.
Table 4 shows the load values of 31 carbon sources on the PC1 and PC2 axes. The carbon source with an absolute value of loading value greater than 0.6 was regarded as the main carbon source utilization type of the soil microbial community. There were 17 kinds of carbon sources that contributed greatly to PC1, including five kinds of amino acids, three kinds of carboxylic acids, three kinds of carbohydrates, three kinds of polymers, three kinds of phenolic acids, and one kind of amine. There were six kinds of carbon sources that contribute greatly to PC2, including two kinds of carbohydrate, one kind of amino acid, one kind of carboxylic acid, one kind of amine and one kind of polymer (Table 4). The above results indicate that amino acids and carbohydrates were the most important carbon sources used by the soil microbial communities.
There was a significant difference (p < 0.05) in the utilization capacity of the soil microorganisms of the different water-conservation forests for the six types of carbon sources according to the AWCD at 96 h (Figure 4). The most utilized carbon source of the soil microorganisms from the three typical water-conservation forests was carbohydrates. This was significantly different from CK (p < 0.05), but there were no significant differences among the stands (p > 0.05). In terms of the utilization of amino acid carbon sources, PF was significantly higher than MF and QF, but there was no significant difference between MF and QF (p > 0.05). QF and PF were significantly higher than MF (p < 0.05), but there were no significant differences between them (p > 0.05). For the utilization of carboxylic acid carbon sources, QF was significantly higher than MF (p < 0.05), but there were no significant differences between PF, MF, and QF (p > 0.05). Regarding the utilization of the amine carbon source, QF was significantly higher than PF (p < 0.05), but there were no significant differences between MF, PF, and QF (p > 0.05). There was no significant difference between PF and QF in terms of the utilization of the phenolic acid carbon source (p > 0.05), but there was significant difference between PF and MF (p < 0.05). The utilization of the six kinds of carbon sources in the three typical water-conservation forests was significantly higher than in CK (p < 0.05).

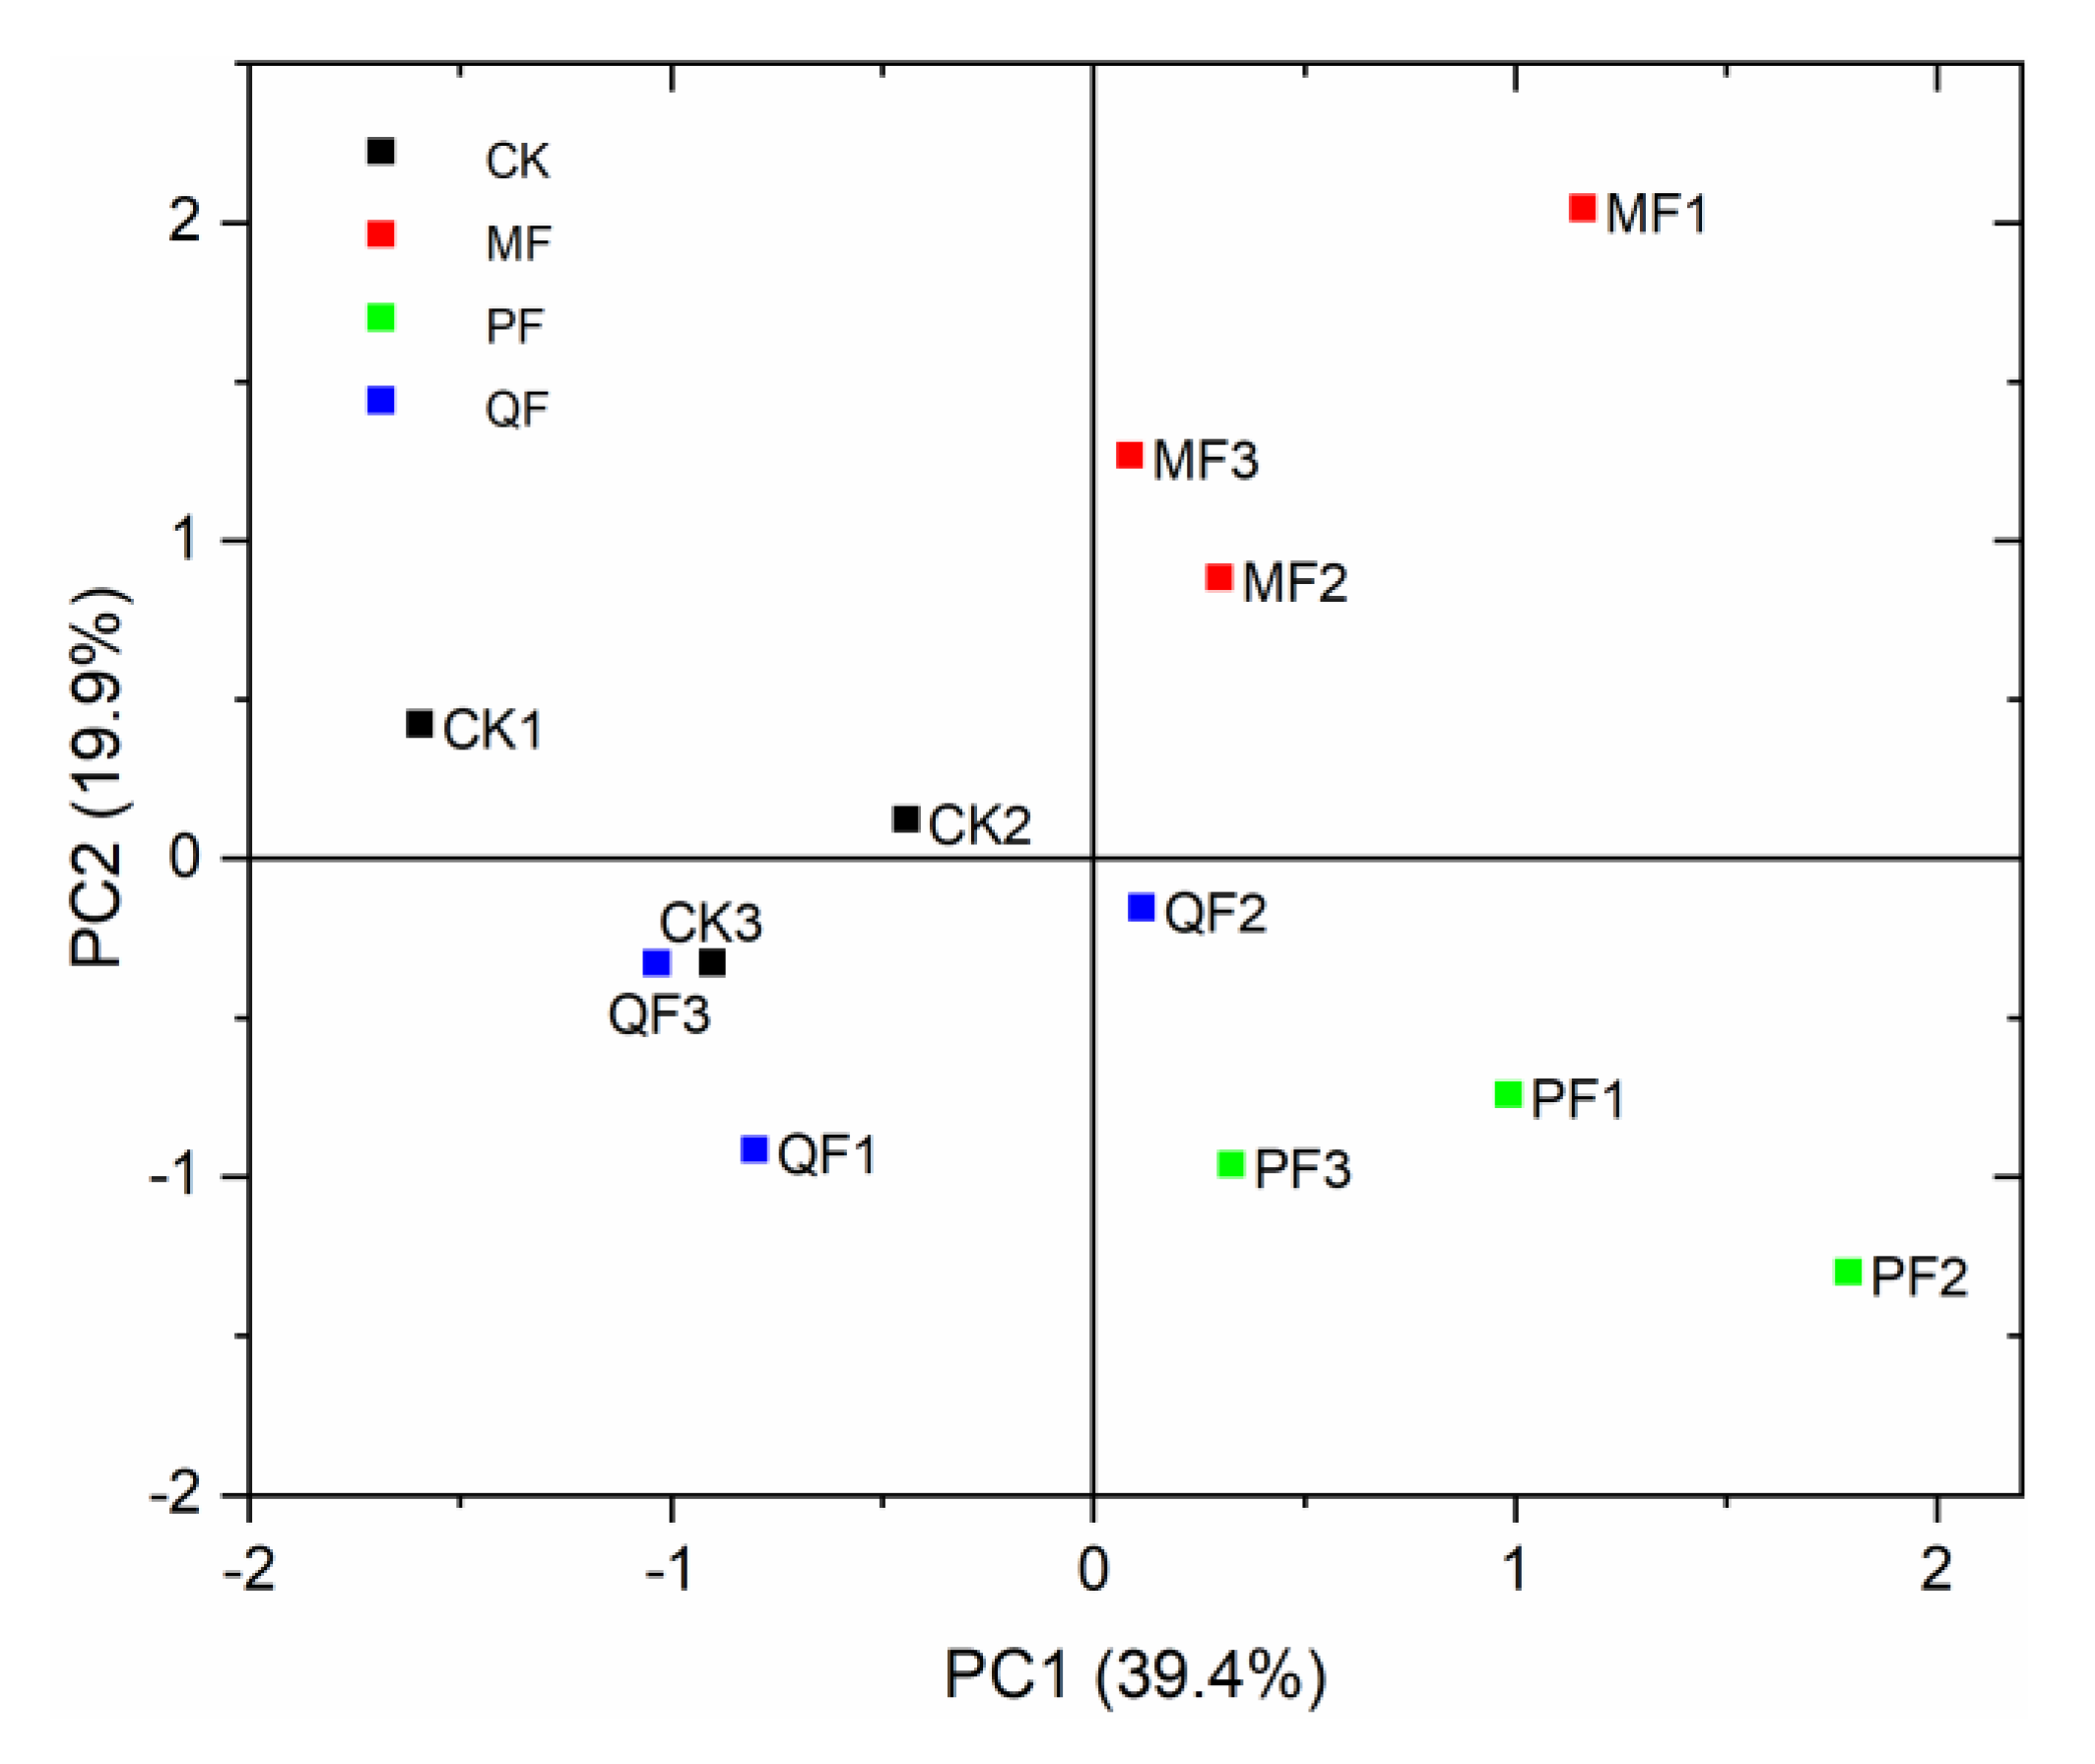
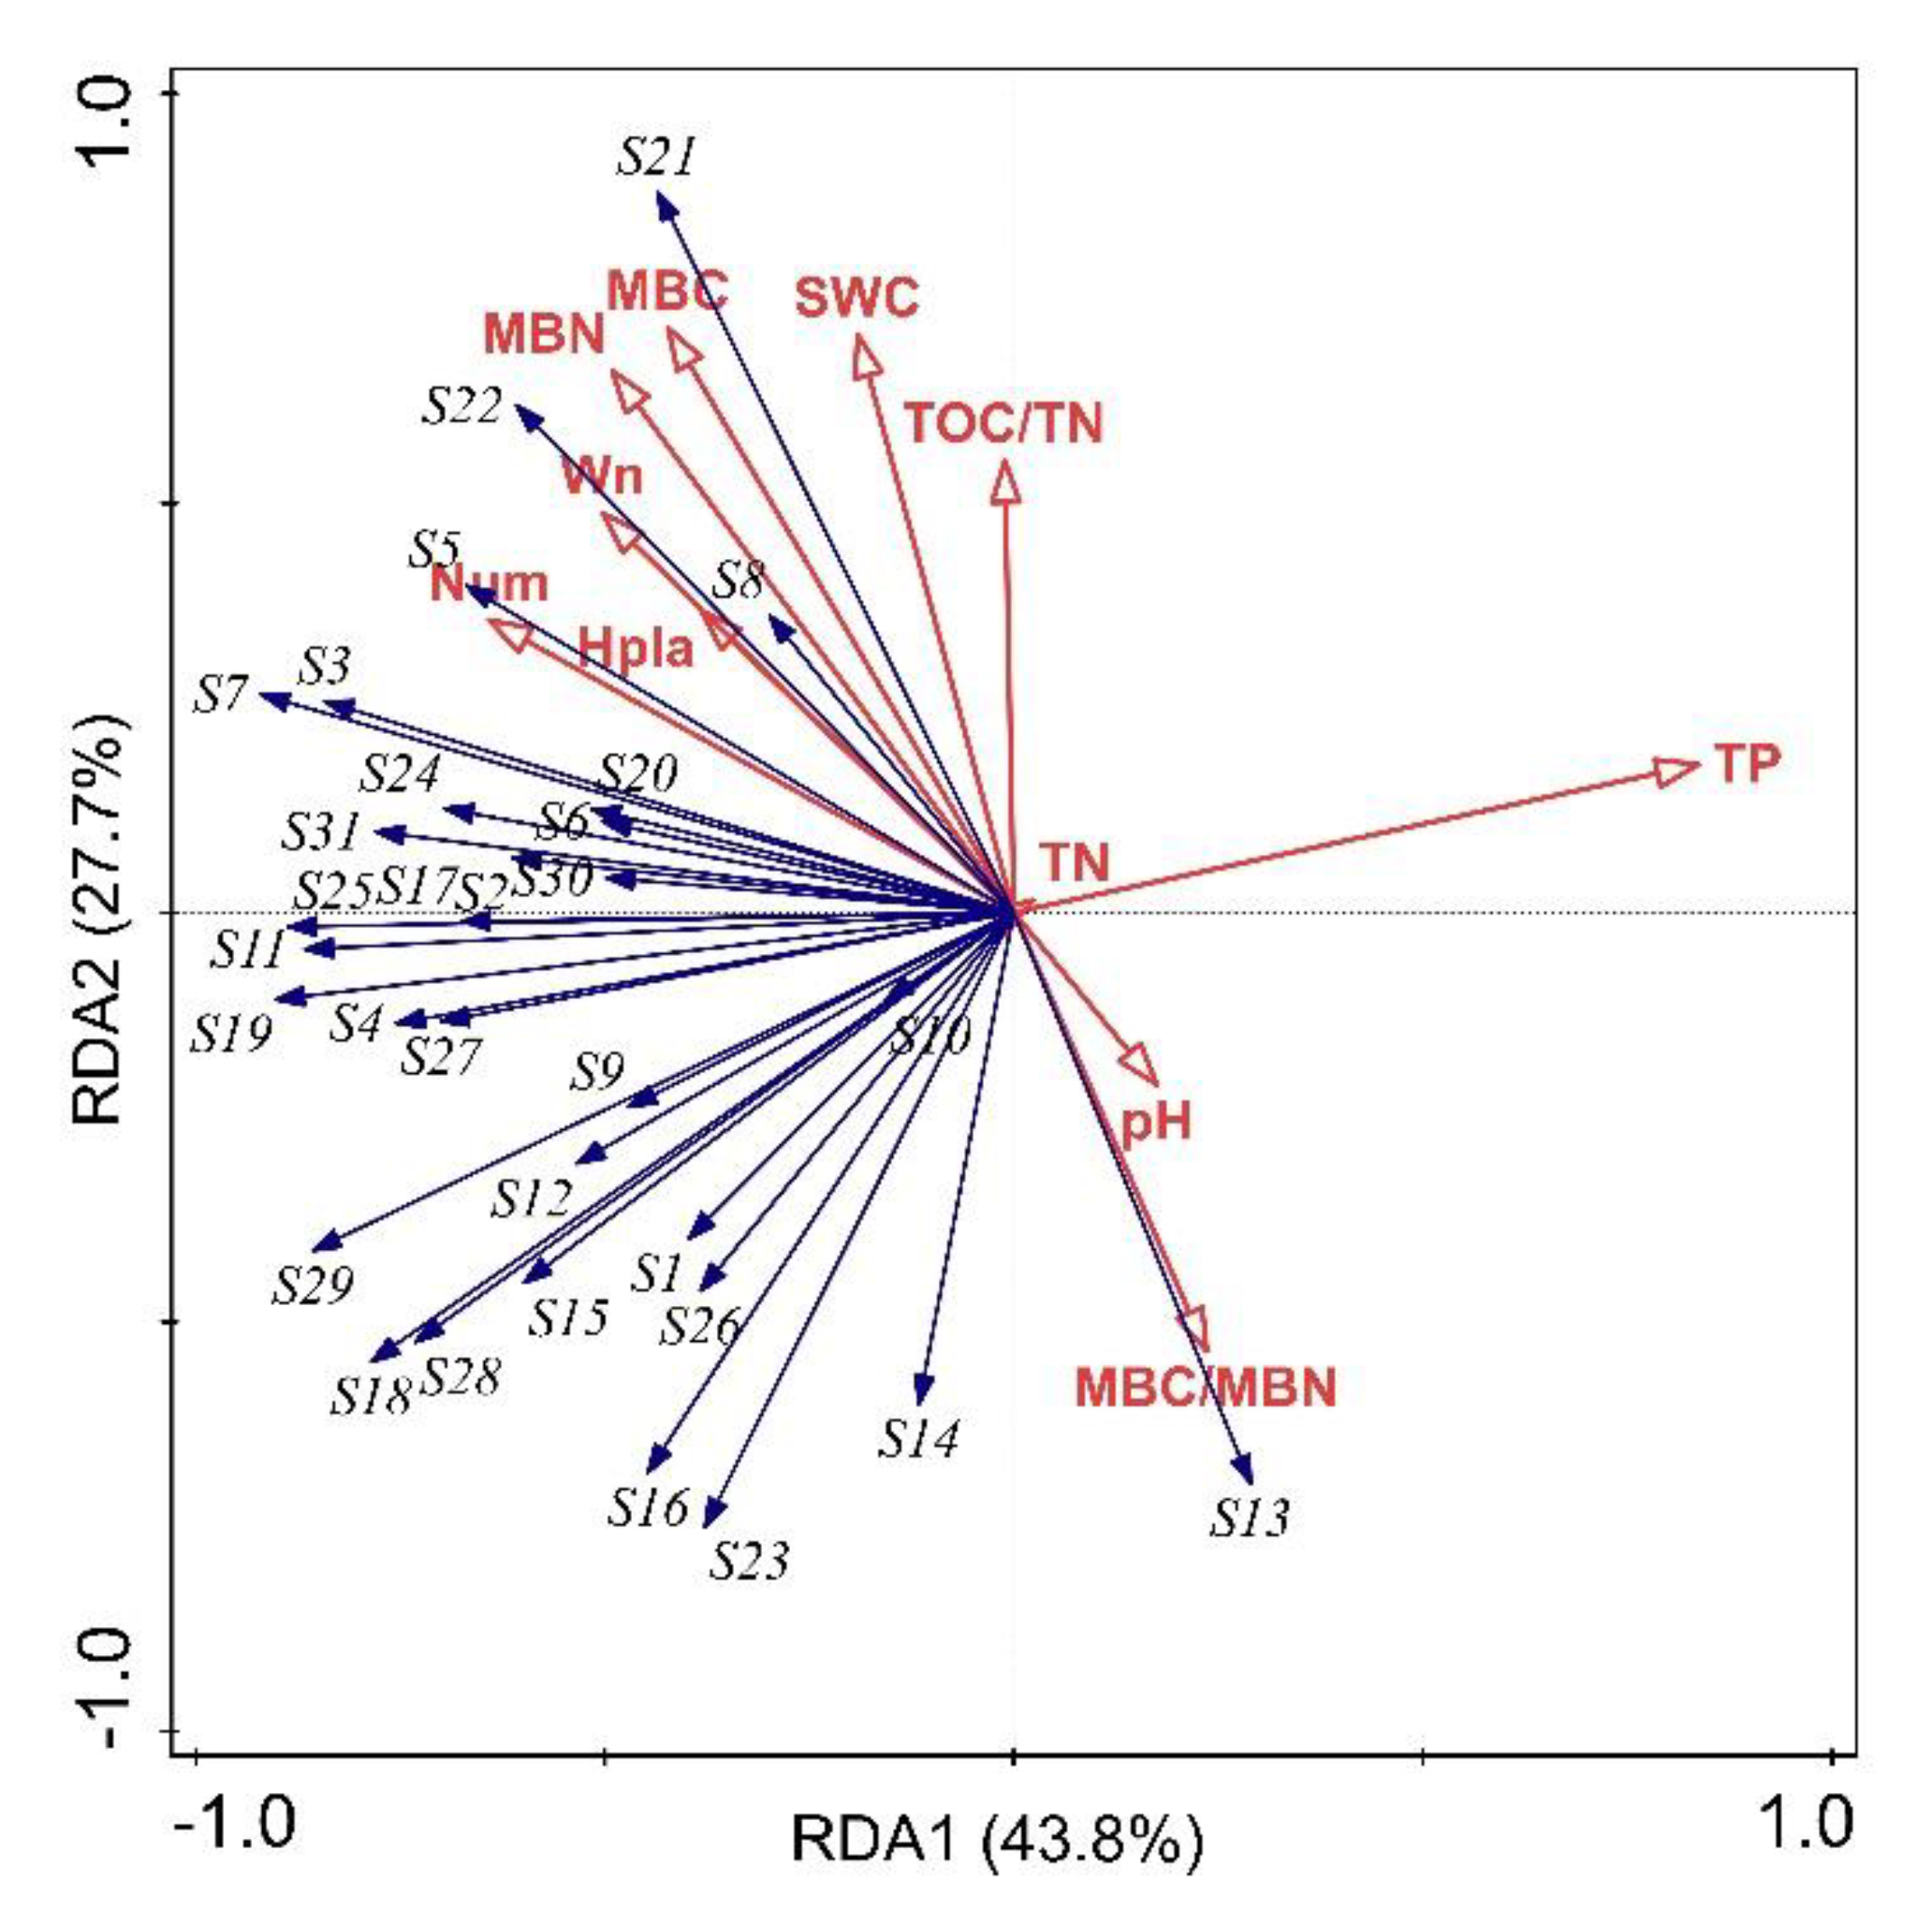
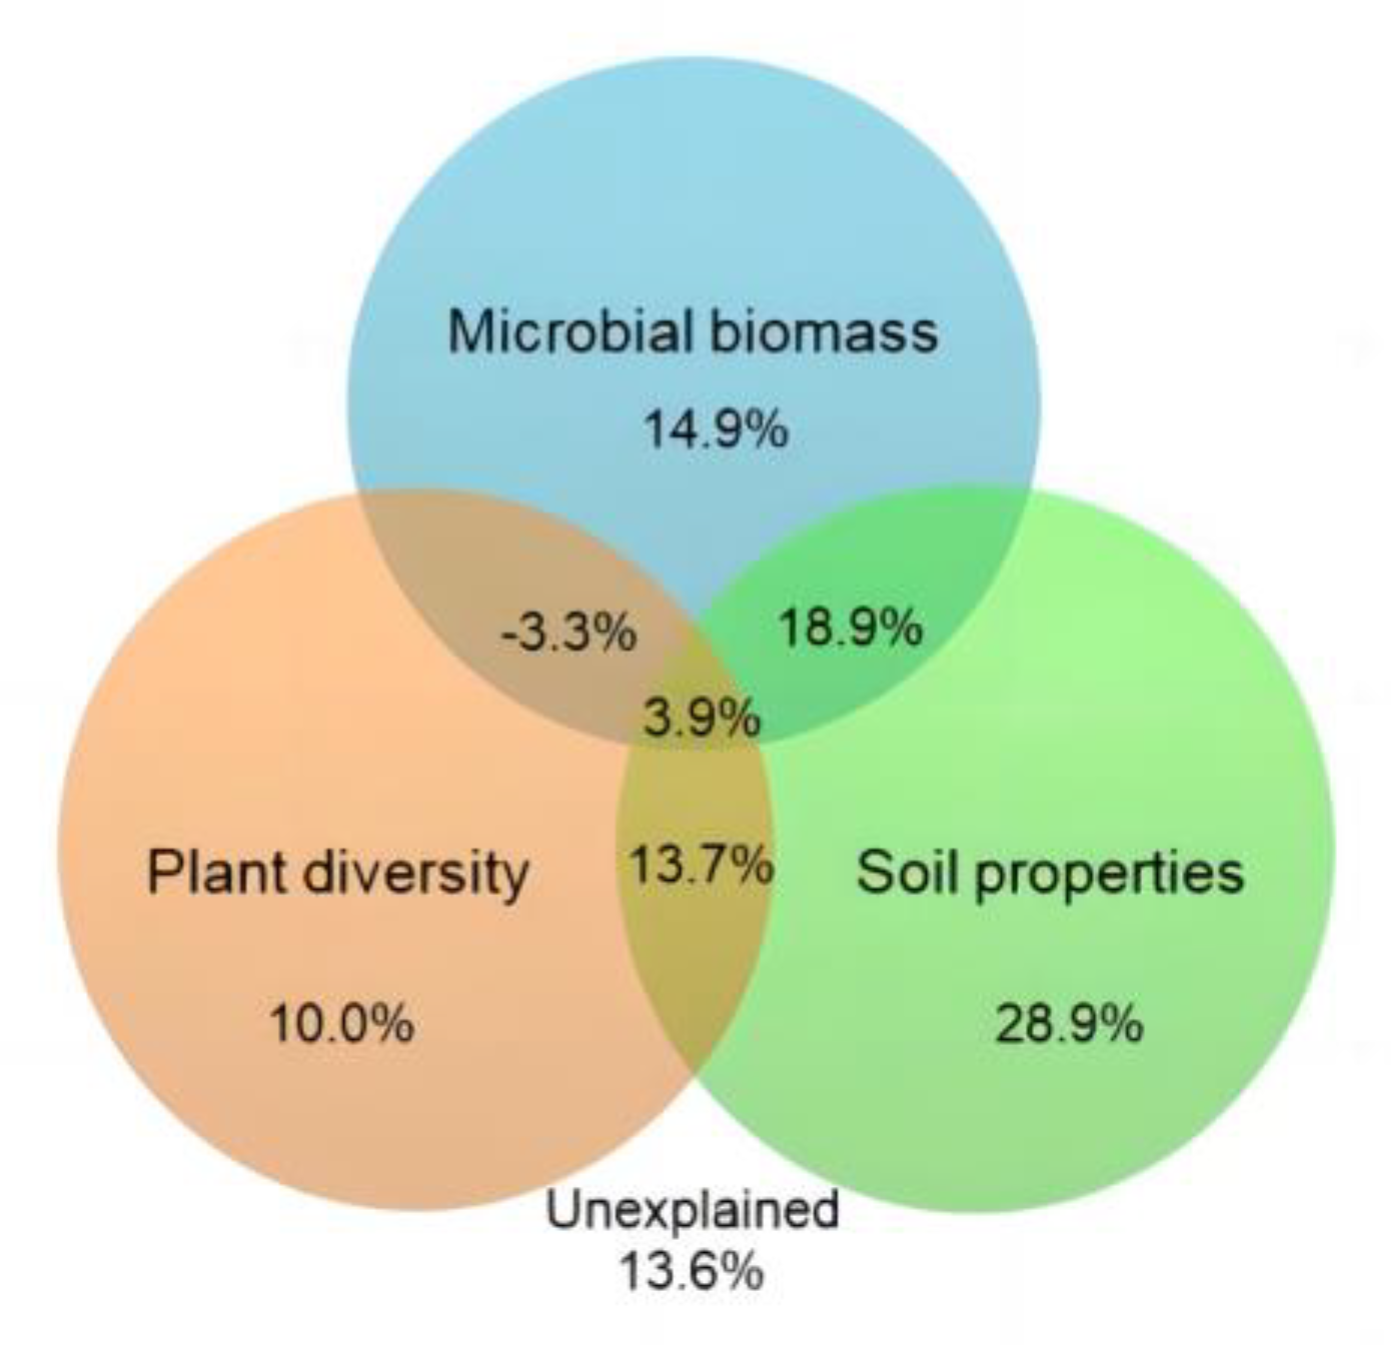
3.5. The Relationship between Soil Microbial Carbon Source Utilization and Environmental Factors

The RDA of soil microbial carbon source utilization and environmental factors showed that the first and second ranking axes explained 43.80% and 27.67% of the variation in soil microbial environmental factors, respectively. The utilization of 31 carbon sources by soil microorganisms was mainly affected by TP, MBC, TN, Num, and Wn, and the variance explained by them accounted for 75.0% of the total variance in soil microbial data. TP and MBC had the largest impact on the carbon source utilization of the soil microbial community among the five environmental factors, and their explanatory variance accounted for 53.9% of the total variance. TP was significantly negatively correlated with the utilization of S4 (α-cyclodextrin) and S27 (L-serine). MBC was significantly positively correlated with the utilization of S21 (Itaconic acid). TN was negatively correlated with the utilization of S29 (Glycyl-L-glutamic acid). Num was significantly positively correlated with the utilization of S5 (Glycogen). Wn and S22 (α-ketobutyric acid) were significantly positively correlated with the utilization of ketobutyric acid (Figure 5).
The VPA showed that three types of factors explained 86.4% of the variation, and plant (community) diversity, soil physicochemical properties and soil microbial biomass independently explained 10.0%, 28.9% and 14.9% of the variation, respectively (Figure 6). The variation explained by soil physicochemical properties was significantly higher than plant (community) diversity and soil microbial biomass, indicating that soil physicochemical properties was the most important factor affecting the carbon source utilization of the soil microbial community.

4. Discussion

4.1. Plant (Community) Diversity and Soil Physicochemical Properties

There was no significant difference in plant (community) diversity between the three typical water-conservation forests, but there was significant difference between these forests and CK. Some studies have showed that plant diversity has a positive effect on soil microbial carbon source utilization patterns, in turn having a positive impact on the activity and functional diversity of culturable bacteria in the soil [49,50,51]. This was probably because the soil bacterial community was beneficial to the growth and development of plants, and there was a mutual relationship between the two [52,53]. In this study, the Num and SDI values of CK were significantly lower than those of the three typical water-conservation forests, which led to a lower diversity of soil microbial function in CK than in MF, PF, and QF. Although the plant (community) diversity of QF was not significant compared with MF and PF, the mean values of Num and SDI were the highest in QF. A reduction in plant species richness may directly affect the activity and functionality of microorganisms [54]. Therefore, this may be one of the reasons that the functional diversity of soil microorganisms in MF and PF is lower than in QF.
Different plant species and quantities were likely to cause differences in soil physicochemical properties [55,56,57,58]. The soil of the three typical water-conservation forests was acidic, and the soil pH value of the coniferous species was higher than that of the broadleaf species, which is inconsistent with many studies [59,60,61]. One study found that the accumulation of TN would lead to serious soil acidification; this phenomenon was mainly related to the release of H+ by plant roots in the process of nitrogen fixation [62]. Nitrogen fixation increased the acidity of the soil. The TN content of PF was the lowest, and only 1/2 of MF and QF in our study. This was probably one of the reasons that the soil pH of coniferous forests was higher than that of broadleaf forests. It was found that only Dalbergia hupeana, a leguminous plant with nitrogen fixation, grew in MF and QF during the vegetation survey in our study. Agricultural soil and sandy soil with leguminous crops could lead to soil acidification and increases in soil organic matter during the nitrogen cycle [63]. This was probably another reason why the soil pH of coniferous forests is higher than that of broad-leaved forests, and it also explained why the TOC content of MF and QF was higher than that of PF and CK.

4.2. MBC, MBN, and Microbial Biomass C/N Rations

QF had the highest MBC, showing significant difference from MF, PF and CK (p < 0.05). The stand density of QF was higher than PF, and similar to MF. As a broad-leaved deciduous tree species, QF had more leaves and litter on the forest floor than the other two forests. There were fewer species in CK and a smaller quantity of shrubs and herbs; thus, the surface litter was obviously minimal compared with the other three forests, and the MBC of CK was the lowest. MBC/MBN was generally considered as an important indicator of nitrogen availability [64,65]. Our study found that the changing trend of MBC/MBN was almost in accord with the TN values of the three typical water-conservation forests, and it was speculated that this may be related to the effectiveness of TN. However, it was not excluded that this was caused by the difference in the size and activity of the main microbial communities in the soil [23].

4.3. Functional Diversity of Soil Microorganisms

It was observed that the AWCD value of the soil microorganisms in QF was higher than in the other two stands in all periods of 168 h culture in this study. This was related to the content of organic matter in soil, which was one of the carbon sources used by soil microbial communities [66]. The organic matter content of QF was the highest, but it was not significant with MF. This led to the AWCD value of QF being the highest, while there were a few differences between QF and MF. However, SDI and S were not significant. It was found that there was no difference in soil microbial functional diversity among the three typical water-conservation forests. The soil physical and chemical properties in the three stands did not show significant differences completely, which had little effect on soil microorganisms. The SDI and S of the three typical water-conservation forests were significantly higher than the non-forest land, showing that the functional diversity of soil microbial in forests was significantly higher than that of non-forest land, and indicating that forests have good ecological functions. Plant roots could release a large number of carbon sources, and the decomposition of their litter could produce organic matter and various nutrients, thus increasing the carbon source utilization of soil microorganisms and improving the metabolic activity of soil microorganisms [67]. The plant (community) diversity of the three typical water-conservation forests were significantly higher than CK, indicating that the higher the plant diversity, the higher the soil microbial functional diversity [33,35]. Some scholars studied the relationship between aboveground plants and soil microorganisms [68,69,70], founding that plant diversity had a significant impact on soil microbial biomass and community structure [37]. With increased in plant diversity, the number of plants in the soil increased, and the habitat heterogeneity of soil microorganisms also changed [38]. The metabolic potential and catabolic diversity of broad-leaved tree species are significantly higher than those of coniferous tree species [59,68,71]. The results of this study showed that there was no significant difference in the functional diversity of soil microorganisms among the three typical water-conservation forests, but the mean values of Num, H’plant, SDI, S, and MBC of QF were higher than those of MF and PF. Therefore, we consider that QF is superior to MF and PF, and is the preferred tree species in terms of effective ecological service function.
The results of the PCA showed that the plots of the three typical water-conservation forests and the non-forest land were in different quadrants, indicating that they used different carbon sources. The carbon sources mainly used by MF were carbohydrates, amino acids, and amines; the carbon sources mainly used by PF were amino acids, carbohydrates, and polymers; QF mainly used carbohydrates, polymers, and carboxylic acids; and CK mainly used carbohydrates, polymers, and amino acids. This showed that the types of carbon sources used by these four treatments differ, which indicates that different treatments could significantly affect the input of soil organic matter, leading to different types of carbon sources used by different stands, and ultimately affecting the diversity of microbial functions [72]. Carbohydrates and amino acids were the carbon sources commonly used by the four treatments. This was consistent with the loading values of the 31 carbon sources on the principal components PC1 and PC2, which found that carbohydrates and amino acids were the most important carbon source utilization types for soil microbial communities.

4.4. Relationship between Soil Microbial Carbon Source Utilization and Environmental Factors

Many studies on soil microbial ecology showed that the structure and function of soil microbial communities were closely related to specific environmental changes [73,74], and forests could affect soil microorganisms through the physical and chemical properties of soil [75]. Some studies believed that pH was the most important factor affecting the diversity of soil microbial communities [76,77], but our study did not obtain a consistent conclusion. The redundancy analysis found that the utilization of 31 carbon sources by soil microorganisms was significantly correlated with plant diversity (Num), soil chemical properties (TP, TN, Wn), and soil microbial biomass (MBC). These environmental factors explained 75.0% of the changes in the functional diversity of the soil microbial communities, indicating that the functional diversity of soil microbial communities was mainly affected by these three types of factors. Plant communities input organic carbon and nutrients into the soil in the form of litter, or affected the soil microbial community by changing soil physical and chemical properties, such as water content [78]. The amount of soil microbial biomass was also closely related to the content of organic matter in the soil and the physicochemical properties of the soil. Therefore, plant (community) diversity, soil physicochemical properties and soil microbial biomass were the key factors affecting the structure and function of microbial communities [37,79]. In this study, VPA showed that soil physicochemical properties explained 28.9% of the variation, indicating that soil nutrients were the main factor affecting the functional diversity of soil microbial communities. This was consistent with many other study results [80,81]. This was probably related to the quantity and quality of forest litter, resulting in changes in the amount of organic matter ultimately imported into the soil [82].

5. Conclusions

We explored the functional diversity of soil microorganisms and its influencing factors in the four vegetation types through the Biolog-Eco microplate culture method. The results showed that the soil microbial functional diversity of the three forest lands was significantly greater than that of the non-forest land, according to the result of AWCD, SDI and S. There was no significant difference in AWCD, SDI and S among the three typical forests, but according to the consistent order of AWCD dynamics, SDI average and S average of the three forests (QF > PF > MF), QF likely have better soil microbial functional diversity than PF and MF. The variance partitioning analysis found that plant (community) diversity, soil physical and chemical properties and soil microbial biomass were all factors that affected the functional diversity of soil microorganisms, yet soil physical and chemical properties were the most important factors. The redundancy analysis further revealed that TP, MBC, TN, Num, and Wn were the key factors affecting the functional diversity of soil microorganisms.
This study confirmed that forest ecosystem is better than non-forest land in maintaining the functional diversity of soil microbial communities. Moreover, Quercus variabilis forest seems to be a better stand type in maintaining the diversity of soil microbial functions in the study area. However, the method used in this study was implemented for culturable bacterial groups, but cannot detect non-culturable microorganisms with special functions. Therefore, the functional diversity of soil microbial communities in these forests can be further studied by combining other microbial community structure analysis methods. Additionally, this study only provides an evaluation on water-conservation forests from the perspective of microbial functional diversity. As for determining the best forest suitable for Danjiangkou reservoir area, it is also necessary to comprehensively consider various functions such as water storage, water purification, soil conservation and biodiversity protection, etc.

Author Contributions

Conceptualization, Z.Y., X.Z. and S.G.; methodology, Z.Y., X.Z. and S.G.; software, Z.Y.; validation, S.G.; formal analysis, Z.Y.; investigation, Z.Y., X.W., Q.S., X.L. and H.W.; data curation, Z.Y.; writing—original draft preparation, Z.Y.; writing—review and editing, Z.Y., X.Z. and S.G.; visualization, Z.Y.; supervision, S.G.; project administration, S.G.; funding acquisition, X.Z. All authors have read and agreed to the published version of the manuscript.

Funding

This research was funded by the National Key Reasearch and Development Project, grant number 2022YFF1303002.

Data Availability Statement

Not applicable.

Acknowledgments

We appreciate our colleagues and the farmers of Longkou Tree Farm for their assistance.

Conflicts of Interest

The authors declare no conflict of interest.

References

  1. Gao, C.; Yu, X. Review on researchs of water conservation forests. J. Beijing For. Univ. 2000, 22, 78–82. (In Chinese) [Google Scholar]
  2. Gyssels, G.; Poesen, J.; Bochet, E.; Li, Y. Impact of plant roots on the resistance of soils to erosion by water: A review. Prog. Phys. Geogr. 2005, 29, 189–217. [Google Scholar] [CrossRef] [Green Version]
  3. Bian, F.Y.; Zhong, Z.K.; Zhang, X.P.; Li, Q.L.; Huang, Z.Y. Bamboo-based agroforestry changes phytoremediation efficiency by affecting soil properties in rhizosphere and non-rhizosphere in heavy metal-polluted soil (Cd/Zn/Cu). J. Soils Sediments 2022, 1–11. [Google Scholar] [CrossRef]
  4. Kong, F.X.; Sang, W.L.; Jiang, X.; Wang, L.S. Aluminum toxicity and tolerance in plants. Acta Ecol. Sin. 2000, 20, 855–862. [Google Scholar]
  5. Li, X.B.; Xia, L.L.; Yan, X.Y. Application of membrane inlet mass spectrometry to directly quantify denitrification in flooded rice paddy soil. Biol. Fert. Soils 2014, 50, 891–900. [Google Scholar] [CrossRef]
  6. Wu, Z.B.; Liang, W.; Qiu, D.R.; Zhou, Q.H.; Cheng, S.P.; Fu, G.P.; He, F. The Correlation between the substrate enzymatic activities and purification effect of wastewater in the integrated vertical constructed wetland. Acta Ecol. Sin. 2002, 22, 1012–1017. [Google Scholar]
  7. Smith, J.L.; Paul, E.A. The significance of soil microbial biomass estimations. In Soil Biochemistry; Bollag, G.M., Stotzkey, G., Eds.; Chemical Rubber Company Press: Boca Raton, FL, USA, 1990; Volume 6, pp. 357–396. [Google Scholar]
  8. Chen, F.L.; Zheng, H.; Zhang, K.; Ouyang, Z.Y.; Lan, J.; Li, H.L.; Qian, S. Changes in soil microbial community structure and metabolic activity following conversion from native Pinus massoniana plantations to exotic Eucalyptus plantations. For. Ecol. Manag. 2013, 291, 65–72. [Google Scholar] [CrossRef]
  9. Delgado-Baquerizo, M.; Maestre, F.T.; Reich, P.V.B.; Jeffries, T.C.; Gaitan, J.J.; Encinar, D.; Berdugo, M.; Campbell, C.D.; Singh, B.K. Microbial diversity drives multifunctionality in terrestrial ecosystems. Nat. Commun. 2016, 7, 10541. [Google Scholar] [CrossRef] [Green Version]
  10. Waring, B.G.; Averill, C.; Hawkes, C.V. Differences in fungal and bacterial physiology alter soil carbon and nitrogen cycling: Insights from meta-analysis and theoretical models. Ecol. Lett. 2013, 16, 887–894. [Google Scholar] [CrossRef] [PubMed]
  11. Bauhus, J.; Khanna, P.K. The significance of microbial biomass in forest soils. In Going Underground-Ecological Studies in Forest Soils; Rastin, N., Bauhus, J., Eds.; Research Signpost: Trivandrum, India, 1999; pp. 77–110. [Google Scholar]
  12. Bucher, A.E.; Lanyon, L.E. Evaluating soil management with microbial community-level physiological profiles. Appl. Soil Ecol. 2005, 29, 59–71. [Google Scholar] [CrossRef]
  13. Rogers, B.F.; Tate, R.L. Temporal analysis of the soil microbial community along a top sequence in Pineland soils. Soil Biol. Biochem. 2001, 33, 1389–1401. [Google Scholar] [CrossRef]
  14. Liu, Q.; Pang, Z.Q.; Yang, Z.L.; Nyumah, F.; Hu, C.H.; Lin, W.X.; Yuan, Z.N. Bio-fertilizer Affects Structural Dynamics, Function, and Network Patterns of the Sugarcane Rhizospheric Microbiota. Microb. Ecol. 2022, 84, 1195–1211. [Google Scholar] [CrossRef] [PubMed]
  15. Garcia-Pausas, J.; Paterson, E. Microbial community abundance and structure are determinants of soil organic matter mineralisation in the presence of labile carbon. Soil Biol. Biochem. 2011, 43, 1705–1713. [Google Scholar] [CrossRef]
  16. Degens, B.P.; Harris, J.A. Development of a physiological approach to measuring the catabolic diversity of soil microbial communities. Soil Biol. Biochem. 1997, 29, 1309–1320. [Google Scholar] [CrossRef]
  17. Chapman, S.J.; Campbell, C.D.; Artz, R.R. Assessing CLPPs using MicroRespTM-A comparison with biolog and multi-SIR. J. Soils Sediments 2007, 7, 406–410. [Google Scholar] [CrossRef]
  18. Lu, S.B.; Guo, X.M.; Rui, Y.C.; Zhou, X.Q.; Chen, C.R.; Xu, Z.H.; Niu, D.K. Utilization of carbon sources by the soil microbial communities of different forest types in subtropical Australia. Acta Ecol. Sin. 2012, 32, 2819–2826. [Google Scholar]
  19. Selmants, P.C.; Hart, S.C.; Boyle, S.I.; Stark, J.M. Red alder (Alnus rubra) alters community-level soil microbial function in conifer forests of the Pacific Northwest, USA. Soil Biol. Biochem. 2005, 37, 1860–1868. [Google Scholar] [CrossRef]
  20. Cheng, H.; Xu, W.N.; Luo, T.; Xia, L.; Xiang, H.Y.; Ma, P.F.; Xia, D. Microbial functional diversity as affected by different engineered eco-restoration methods at Xiangjiaba hydropower station. J. Environ. Eng. 2020, 146, 04019125. [Google Scholar] [CrossRef]
  21. Wang, Y.; Ouyang, Z.Y.; Zheng, H.; Wang, X.K.; Chen, F.L.; Zeng, J. Carbon metabolism of soil microbial communities of restored forests in Southern China. J. Soils Sediments 2011, 11, 789–799. [Google Scholar] [CrossRef]
  22. Huang, X.M.; Liu, S.R.; Wang, H.; Hu, Z.D.; Li, Z.G.; You, Y.M. Changes of soil microbial biomass carbon and community composition through mixing nitrogen fixing species with Eucalyptus urophylla in subtropical China. Soil Biol. Biochem. 2014, 73, 42–48. [Google Scholar] [CrossRef]
  23. Chen, X.L.; Wang, D.; Chen, X.; Wang, J.; Diao, J.J.; Zhang, J.Y.; Guan, Q.W. Soil microbial functional diversity and biomass as affected by different thinning intensities in a Chinese fir plantation. Appl. Soil Ecol. 2015, 92, 35–44. [Google Scholar] [CrossRef]
  24. Wang, X.; Gao, S.H.; Chen, J.Q.; Yao, Z.W.; Zhang, L.; Wu, H.L.; Shu, Q.; Zhang, X.D. Response of Functional Diversity of Soil Microbial Community to Forest Cutting and Regeneration Methodology in a Chinese Fir Plantation. Forests 2022, 13, 360. [Google Scholar] [CrossRef]
  25. Wang, Y.; Zong, N.; He, N.P.; Zhang, J.J.; Tian, J.; Li, L.T. Soil microbial functional diversity patterns and drivers along an elevation gradient on Qinghai-Tibet China. Acta Ecol. Sin. 2018, 38, 9. [Google Scholar]
  26. Xie, Y.; Guo, F.Y.; Chen, L.H.; Cao, B. Effects of Elevated CO2 Concentration on Soil Microbial Functional Diversity and Carbon Source Utilization Characteristics in the Root Zone of Lycium barbarum. Sci. Silv. Sin. 2018, 57, 163–172. [Google Scholar]
  27. Babur, E.; Dindaroglu, T.; Danish, S.; Häggblom, M.M.; Ozlu, E.; Gozukara, G.; Uslu, O.S. Spatial responses of soil carbon stocks, total nitrogen, and microbial indices to post-wildfire in the Mediterranean red pine forest. J. Environ. Manag. 2022, 320, 115939. [Google Scholar] [CrossRef]
  28. Zhang, G.S.; Yu, X.B.; Li, Y.; Liu, Y.; Zhang, H.; Jia, Y.F.; Xia, S.X. Effects of Burning on Carbon Utilization of Soil Microorganisms and Plant Growth of Carex brevicuspis Communities at Lake Poyang Wetlands, China. Wetlands 2019, 39, 1–15. [Google Scholar] [CrossRef]
  29. Zhu, P.; Chen, R.S.; Song, Y.X.; Liu, G.X.; Chen, T.; Zhang, W. Effects of land cover conversion on soil properties and soil microbial activity in an alpine meadow on the Tibetan Plateau. Environ. Earth Sci. 2015, 74, 4523–4533. [Google Scholar] [CrossRef]
  30. Wei, Y.C.; Ouyang, Z.Y.; Miao, H.; Zheng, H. Exotic Pinus carbaea causes soil quality to deteriorate on former abandoned land compared to an indigenous Podocarpus plantation in the tropical forest area of southern China. J. For. Res. 2009, 14, 221–228. [Google Scholar] [CrossRef]
  31. Burton, J.; Chen, C.R.; Xu, Z.H.; Ghadiri, H. Soil microbial biomass, activity and community composition in adjacent native and plantation forests of subtropical Australia. J. Soils Sediments 2010, 10, 1267–1277. [Google Scholar] [CrossRef]
  32. Ibell, P.T.; Xu, Z.H.; Blumfield, T.J. Effects of weed control and fertilization on soil carbon and nutrient pools in an exotic pine plantation of subtropical Australia. J. Soils Sediments 2010, 10, 1027–1038. [Google Scholar] [CrossRef]
  33. Ladygina, N.; Hedlund, K. Plant species influence microbial diversity and carbon allocation in the rhizosphere. Soil Biol. Biochem. 2010, 42, 162–168. [Google Scholar] [CrossRef]
  34. Ma, L.; Guo, C.; Lu, X.; Yuan, S.; Wang, R. Soil moisture and land use are major determinants of soil microbial community composition and biomass at a regional scale in northeastern China. Biogeosciences 2015, 12, 2585–2596. [Google Scholar] [CrossRef] [Green Version]
  35. Tian, Q.Y.; Liu, N.N.; Bai, W.M.; Li, L.H.; Chen, J.Q.; Reich, P.B.; Yu, Q.; Guo, D.L.; Smith, M.D.; Knapp, A.K.; et al. A novel soil manganese mechanism drives plant species loss with increased nitrogen deposition in a temperate steppe. Ecology 2016, 97, 65–74. [Google Scholar] [CrossRef] [PubMed]
  36. Tu, B.; Domene, X.; Yao, M.J.; Li, C.N.; Zhang, S.H.; Kou, Y.P.; Wang, Y.S.; Li, X.Z. Microbial diversity in Chinese temperate steppe: Unveiling the most influential environmental drivers. FEMS Microbiol. Ecol. 2017, 93, fix031. [Google Scholar] [CrossRef] [PubMed] [Green Version]
  37. Carney, K.M.; Matson, P.A. Plant communities, soil microorganisms, and soil carbon cycling: Does altering the world belowground matter to ecosystem functioning? Ecosystems 2005, 8, 928–940. [Google Scholar] [CrossRef]
  38. Wardle, D.A.; Lavelle, P. Linkages between soil biota, plant litter quality and decomposition. In Driven by Nature: Plant Litter Quality and Decomposition; Cadisch, G., Giller, K.E., Eds.; CAB International: Oxon, UK, 1997; pp. 107–124. [Google Scholar]
  39. Ozlu, E.; Arriaga, F.J.; Bilen, S.; Gozukara, G.; Babur, E. Carbon Footprint Management by Agricultural Practices. Biology 2022, 11, 1453. [Google Scholar] [CrossRef] [PubMed]
  40. Chen, H.; Guo, S.L.; Xu, C.Y.; Singh, V.P. Historical temporal trends of hydro-climatic variables and runoff response to climate variability and their relevance in water resource management in the Hanjiang basin. J. Hydrol. 2007, 344, 171–184. [Google Scholar] [CrossRef]
  41. Zhu, Y.P.; Zhang, H.P.; Chen, L.; Zhao, J.F. Influence of the south-north water diversion project and the mitigation projects on the water quality of Han River. Sci. Total Environ. 2008, 406, 57–68. [Google Scholar] [CrossRef]
  42. Ding, X.; Cheng, C.J.; Qi, L.H.; Zhang, J.; Lei, G.; Liu, X.Q. Evaluation of water conservation capacity of Pinus massoniana plantation with different densities in Hubei water source area of Danjiangkou reservoir area. Chin. J. Ecol. 2019, 38, 2291–2301. (In Chinese) [Google Scholar]
  43. Cheng, C.J.; Zhang, J.; Lei, G.; Ding, X.; Liu, X.Q.; Qi, L.H. Interception of N and P by the buffer zone of waterfront vegetation in Danjiangkou reservoir area of Hubei. Sci. Silvae Sin. 2020, 56, 12–20. (In Chinese) [Google Scholar]
  44. Bao, S.D. Soil Agrochemical Analysis, 3rd ed.; China Agriculture Press: Beijing, China, 2000. [Google Scholar]
  45. Brookes, P.C.; Landman, A.; Pruden, G.; Jenkinson, D.S. Chloroform fumigation and the release of soil nitrogen: A rapid direct extraction method to measure microbial biomass nitrogen in soil. Soil Biol. Biochem. 1985, 17, 837–842. [Google Scholar] [CrossRef]
  46. Joergensen, R.G.; Mueller, T. The fumigation-extraction method to estimate soil microbial biomass: Calibration of the kEN value. Soil Biol. Biochem. 1996, 28, 33–37. [Google Scholar] [CrossRef]
  47. Zabinski, C.A.; Gannon, J.E. Effects of recreational impacts on soil microbial communities. Environ. Manag. 1997, 21, 233–238. [Google Scholar] [CrossRef] [PubMed]
  48. Pengthamkeerati, P.; Motavalli, P.; Kremer, R. Soil microbial activity and functional diversity changed by compaction, poultry litter and cropping in a claypan soil. Appl. Soil Ecol. 2011, 48, 71–80. [Google Scholar] [CrossRef]
  49. Geijn, S.; Veen, J. Implications of increased carbon dioxide levels for carbon input and turnover in soils. Vegetatio 1993, 104/105, 283–292. [Google Scholar] [CrossRef]
  50. Stephan, A.; Meyer, A.H.; Schmid, B. Plant diversity affects culturable soil bacteria in experimental grassland communities. J. Ecol. 2000, 22, 988–998. [Google Scholar] [CrossRef]
  51. Haack, S.K.; Garchow, H.; Klug, M.J.; Forney, L.J. Analysis of factors affecting the accuracy, reproducibility, and interpretation of microbial community carbon source utilization patterns. Appl. Environ. Microbiol. 1995, 61, 1458–1468. [Google Scholar] [CrossRef] [PubMed] [Green Version]
  52. Grayston, S.J.; Campbell, C.D. Functional biodiversity of microbial communities in the rhizospheres of hybrid larch (Larix eurolepis) and Sitka spruce (Picea sitchensis). Tree Physiol. 1996, 16, 1031–1038. [Google Scholar] [CrossRef]
  53. Kim, K.Y.; Jordan, D.; Mcdonald, G.A. Enterobacter agglomerans, phosphate solubilizing bacteria, and microbial activity in soil: Effect of carbon sources. Soil Biol. Biochem. 1998, 30, 995–1003. [Google Scholar] [CrossRef]
  54. Wardle, D.A.; Nicholson, K.S. Synergistic effects of grassland plant species on soil microbial biomass and activity: Implications for ecosystem-level effects of enriched plant diversity. Funct. Ecol. 1996, 10, 410–416. [Google Scholar] [CrossRef]
  55. Marcin, C.; Klimek, B.; Azarbad, H.; Jazwa, M. Functional diversity of soil microbial communities under Scots pine, Norway spruce, silver birch and mixed boreal forests. Pedobiologia 2015, 58, 81–88. [Google Scholar]
  56. Hansson, K.; Olsson, B.A.; Olsson, M.; Johansson, U.; Kleja, D.B. Differences in soil properties in adjacent stands of Scots pine, Norway spruce and silver birch in SW Sweden. For. Ecol. Manag. 2011, 262, 522–530. [Google Scholar] [CrossRef]
  57. Paluch, J.; Gruba, P. Inter-crown versus under-crown area: Contribution of local configuration of trees to variation in topsoil morphology, pH and moisture in Abies alba Mill. forests. Eur. J. For. Res. 2012, 131, 857–870. [Google Scholar] [CrossRef] [Green Version]
  58. Galka, B.; Labaz, B.; Bogacz, A.; Bojko, O.; Kabala, C. Conversion of Norway spruce forests will reduce organic carbon pools in the mountain soils of SW Poland. Geoderma 2014, 213, 287–295. [Google Scholar] [CrossRef]
  59. Garau, G.; Morillas, L.; Roales, J.; Castaldi, P.; Mangia, N.P.; Spano, D.; Mereu, S. Effect of monospecific and mixed Mediterranean tree plantations on soil microbial community and biochemical functioning. Appl. Soil Ecol. 2019, 140, 78–88. [Google Scholar] [CrossRef]
  60. Gruba, P.; Mulder, J. Relationship between aluminum in soils and soil water in mineral horizons of a range of acid forest soils. Soil Sci. Soc. Am. J. 2008, 72, 1150–1157. [Google Scholar] [CrossRef]
  61. Mueller, K.E.; Eissenstat, D.M.; Hobbie, S.E.; Oleksyn, J.; Jagodzinski, A.M.; Reich, P.B.; Chadwick, O.A.; Chorover, J. Tree species effects on coupled cycles ofcarbon, nitrogen, and acidity in mineral soils at a common garden experiment. Biogeochemistry 2012, 111, 601–614. [Google Scholar] [CrossRef]
  62. Bolan, N.S.; Hedley, M.J.; White, R.E. Processes of soil acidification during nitrogen cycling with emphasis on legume based pastures. Plant Soil. 1991, 134, 53–63. [Google Scholar] [CrossRef]
  63. Shrestha, P.; Gautam, R.; Ashwath, N. Effects of agronomic treatments on functional diversity of soil microbial community and microbial activity in a revegetated coal mine spoil. Geoderma 2019, 338, 40–47. [Google Scholar] [CrossRef]
  64. Devi, N.B.; Yadava, P.S. Seasonal dynamics in soil microbial biomass C, N and P in a mixed-oak forest ecosystem of Manipur, North-east India. Appl. Soil Ecol. 2006, 31, 220–227. [Google Scholar] [CrossRef]
  65. Bolat, İ. The effect of thinning on microbial biomass C, N and basal respiration in black pine forest soils in Mudurnu. Turk. Eur. J. Oper. Res. 2014, 133, 131–139. [Google Scholar] [CrossRef]
  66. Zheng, H.; Ouyang, Z.Y.; Wang, X.K.; Fang, Z.G.; Zhao, T.Q.; Miao, H. Effects of regenerating forest cover on soil microbial communities: A case study in hilly red soil region, Southern China. For. Ecol. Manag. 2005, 217, 244–254. [Google Scholar] [CrossRef]
  67. Nayyar, A.; Hamel, C.; Lafond, G.; Gossen, B.D.; Hanson, K.; Germida, J. Soil microbial quality associated with yield reduction in continuous-pea. Appl. Soil Ecol. 2009, 43, 115–121. [Google Scholar] [CrossRef]
  68. Zak, D.R.; Holmes, W.E.; White, D.C.; Peacock, A.D.; Tilman, D. Plant diversity, soil microbial communities, and ecosystem function: Are there any links? Ecology 2003, 84, 2042–2050. [Google Scholar] [CrossRef] [Green Version]
  69. Broughton, L.C.; Gross, K.L. Patterns of diversity in plant and soil microbial communities along a productivity gradient in a Michigan old-field. Oecologia 2000, 125, 420–427. [Google Scholar] [CrossRef]
  70. Maly, S.; Korthals, G.W.; Van Dijk, C.; Van der Putten, W.H.; De Boer, W. Effect of vegetation manipulation of abandoned arable land on soil microbial properties. Biol. Fertil. 2000, 31, 121–127. [Google Scholar] [CrossRef]
  71. Jiang, Y.M.; Chen, C.R.; Xu, Z.H.; Liu, Y.Q. Effects of single and mixed species forest ecosystems on diversity and function of soil microbial community in subtropical China. J. Soils Sediments 2012, 12, 228–240. [Google Scholar] [CrossRef]
  72. Song, X.C.; Wang, H.L.; Qin, W.D.; Deng, X.J.; Tian, H.D.; Tan, Y.B.; Wang, S.N.; Cao, J.Z. Effects of stand type of artificial forests on soil microbial functional diversity. Chin. J. Appl. Ecol. 2019, 30, 841–848. (In Chinese) [Google Scholar]
  73. Zhou, J.; Kang, S.; Schadt, C.D.; Garten, C.T.J. Spatial scaling of functional gene diversity across various microbial taxa. Proc. Natl. Acad. Sci. USA 2008, 105, 7768–7773. [Google Scholar] [CrossRef] [Green Version]
  74. Liang, Y.; Nostrand, J.D.; Deng, Y.; He, Z.; Wu, L.; Xu, Z.; Li, G.; Zhou, J. Functional gene diversity of soil microbial communities from five oil-contaminated fields in China. ISME J. 2011, 5, 403–413. [Google Scholar] [CrossRef] [PubMed]
  75. Menyailo, O.V.; Hungate, B.A.; Zech, W. The effect of single tree species on soil microbial activities related to C and N cycling in the Siberian artificial afforestation experiment. Plant Soil. 2002, 242, 183–196. [Google Scholar] [CrossRef]
  76. Tripahti, B.M.; Kim, M.; Singh, D.; Lee-Cruz, L.; Lai-Hoe, A.; Ainuddin, A.N.; Go, R.; Rahim, R.A.; Husni, M.H.; Chun, J.; et al. Tropical soil bacterial communities in Malaysia: pH dominates in the equatorial tropics too. Microb. Ecol. 2012, 64, 474–484. [Google Scholar] [CrossRef]
  77. Chodak, M.; Gołebiewski, M.; Morawska-Płoskonka, J.; Kuduk, K.; Niklinska, M. Diversity of microorganisms from forest soils differently polluted with heavy metals. Appl. Soil Ecol. 2013, 64, 7–14. [Google Scholar] [CrossRef]
  78. Firestone, W. Microbial Community Utilization of Recalcitrant and Simple Carbon Compounds: Impact of Oak-Woodland Plant Communities. Oecologia 2004, 138, 275–284. [Google Scholar]
  79. Drenovsky, R.E.; Vo, D.; Graham, K.J.; Scow, K.M. Soil Water Content and Organic Carbon Availability Are Major Determinants of Soil Microbial Community Composition. Microb. Ecol. 2004, 48, 424–430. [Google Scholar] [CrossRef] [PubMed]
  80. Prevost-Boure, N.C.; Maron, P.A.; Ranjard, L.; Nowak, V.; Dufrene, E.; Damesin, C.; Soudani, K.; Lata, J.C. Seasonal dynamics of the bacterial community in forest soils under different quantities of leaf litter. Appl. Soil Ecol. 2011, 47, 14–23. [Google Scholar] [CrossRef]
  81. Ushio, M.; Kitayama, K.; Balser, T.C. Tree species effects on soil enzyme activities through effects on soil physicochemical and microbial properties in a tropical montane forest on Mt. Kinabalu, Borneo. Pedobiologia 2010, 53, 227–233. [Google Scholar] [CrossRef]
  82. Myers, R.T.; Zak, D.R.; White, D.C.; Peacock, A. Landscape-level patterns of microbial community composition and substrate use in upland forest ecosystems. Soil Sci. Soc. Am. J. 2001, 65, 359–367. [Google Scholar] [CrossRef]
Figure 1. Soil MBC (microbial biomass carbon) (a), MBN (microbial biomass nitrogen) (b) and MBC/MBN (c) of three typical water-conservation forests. MF: Pinus massoniana-Quercus variabilis mixed forest; PF: Pinus massoniana forest; QF: Quercus variabilis forest; CK: non-forest land. Data are means ± standard errors, and different lower-case letters indicate significant differences among stand types (p < 0.05).
Forests 14 00067 g001
Figure 2. AWCD (average well color development) (a), Shannon diversity index (b) and community richness index (c) of soil microorganisms in three typical water-conservation forests. Data are means ± standard errors, and different lower-case letters indicate significant differences among stand types (p < 0.05). MF: Pinus massoniana-Quercus variabilis mixed forest; PF: Pinus massoniana forest; QF: Quercus variabilis forest; CK: non-forest land. Data are means ± standard errors, and different lower-case letters indicate significant differences among the treatments (p < 0.05).
Forests 14 00067 g002
Figure 3. The PCA (principal component analysis) for carbon source utilization of soil microbial communities in three typical water-conservation forests. MF represents mixed forest; PF represents Pinus massoniana forest; QF represents Quercus variabilis forest; and CK represents non-forest land. The numbers 1, 2, and 3 after the letter represent repetitions 1, 2, and 3, respectively.
Forests 14 00067 g003
Figure 4. Utilization of six types of carbon sources (carboxylic acids, polymers, carbohydrates, phenolic acids, amino acids, and amines) by soil microorganisms in three typical water-conservation forests. MF: Pinus massoniana-Quercus variabilis mixed forest; PF: Pinus massoniana forest; QF: Quercus variabilis forest; CK: non-forest land. Data are means ± standard errors, and different lower-case letters indicate significant differences among stand types (p < 0.05).
Forests 14 00067 g004
Figure 5. The redundancy analysis of the correlations between environmental factors and 31 carbon sources. pH: potential of hydrogen; SWC: soil water content; TN: total nitrogen; TP: total phosphorus; TOC: total organic carbon; MBC: microbial biomass carbon; MBN: microbial biomass nitrogen; Wn: alkali-hydro nitrogen; Num: number of plant species; H p l a n t represents Shannon diversity index of plants. S1: Pyruvic acid methyl ester; S2: Tween 40; S3: Tween 80; S4: α-cyclodextrin; S5: Glycogen; S6: D-cellobiose; S7: α-D-lactose; S8: β-methyl-D-glucoside; S9: D-xylose; S10: I-erythritol; S11: D-mannitol; S12: N-acetyl-D-glucosamine; S13: D-glucosaminiczcid; S14: α-D-glucose-1-phosphate; S15: L-α-glycerol phosphate; S16: D-galactonic acid lactone; S17: D-galacturonic acid; S18: 2-hydroxybenzoic acid; S19: 4-hydroxybenzoic acid; S20: γ-hydroxybutyric acid; S21: Itaconic acid; S22: α-ketobutyric acid; S23: D-malic acid; S24: L-arginine; S25: L-asparagine; S26: L-phenylalanine; S27: L-serine; S28: L-threonine; S29: glycyl-L-glutamic acid; S30: Phenylethylamine; S31: Putrescine.
Forests 14 00067 g005
Figure 6. The variance partitioning analysis (VPA) of environmental factors and soil microbial carbon source utilization. Plant (community) diversity includes Num and, H p l a n t ; physical and chemical properties of soil include TP, TN, TOC/TN, and SWC; soil microbial biomass includes MBC, MBN, and MBC/MBN.
Forests 14 00067 g006
Table 1. Stand characteristics of three typical water-conservation forests.
MFPFQFCK
Height (m)10.8 ± 0.812.3 ± 0.511.1 ± 0.4
DBH (m)12.4 ± 0.617.4 ± 0.19.8 ± 0.1
Stand density (tree ha−1)195813281867
Stand age (years)353535
MF: Pinus massoniana-Quercus variabilis mixed forest; PF: Pinus massoniana forest; QF: Quercus variabilis forest; CK: non-forest land; DBH: diameter at breast height. Data are means ± standard errors.
Table 2. Number of plant species (Num) and Shannon diversity index (H’plant) of three typical water-conservation forests.
MFPFQFCK
Num14.2 ± 4.5 a13.8 ± 2.6 a15.0 ± 5.0 a9.2 ± 1.7 b
H’plant1.60 ± 0.22 a1.50 ± 0.19 ab1.72 ± 0.42 a1.27 ± 0.25 b
MF: Pinus massoniana-Quercus variabilis mixed forest; PF: Pinus massoniana forest; QF: Quercus variabilis forest; CK: non-forest land; Num: number of plant species; H’plant: Shannon diversity index. Data are means ± standard errors, and different lower-case letters indicate significant differences among the treatments (p < 0.05).
Table 3. Soil physicochemical properties of three typical water-conservation forests.
Soil PropertiesUnitMFPFQFCK
pH 5.30 ± 0.22 b6.10 ± 0.45 a5.41 ± 0.11 b6.33 ± 0.14 a
SWC%13.10 ± 1.4 8b11.84 ± 0.52 b18.72 ± 1.78 a8.46 ± 2.17 c
TNg kg−10.76 ± 0.11 a0.38 ± 0.05 b0.71 ± 0.05 a0.46 ± 0.05 b
TPg kg−10.17 ± 0.03 c0.16 ± 0.01 c0.26 ± 0.02 b0.33 ± 0.01 a
TOCg kg−14.58 ± 0.69 ab3.68 ± 1.08 b6.31 ± 1.05 a3.19 ± 0.82 b
TOC/TN 6.09 ± 1.08 a9.71 ± 3.03 a8.93 ± 1.96 a7.06 ± 2.25 a
NH4+-Nmg kg−11.32 ± 0.71 a0.85 ± 0.31 a0.80 ± 0.38 a0.77 ± 0.21 a
NO3--Nmg kg−11.02 ± 0.20 b1.98 ± 0.67 a1.08 ± 0.21 b0.58 ± 0.13 b
Wnmg kg−147.33 ± 14.42 ab54.67 ± 17.33 a56.95 ± 11.95 a38.77 ± 3.61 b
MF: Pinus massoniana-Quercus variabilis mixed forest; PF: Pinus massoniana forest; QF: Quercus variabilis forest; CK: non-forest land; pH: potential of hydrogen; SWC: soil water content; TN: total nitrogen; TP: total phosphorus; TOC: total organic carbon; MBC: microbial biomass carbon; MBN: microbial biomass nitrogen; Wn: alkali-hydro nitrogen. Data are means ± standard errors, and different lower-case letters indicate significant differences among the treatments (p < 0.05).
Table 4. Loading factors of 31 carbon sources on PC1 and PC2.
Type of Carbon SourceKind of Carbon SourcePC1PC2
Amino acidsL-arginine0.614
L-asparagine0.816
L-asparagine 0.752
L-serine0.724
L-threonine 0.707
Glycyl-L-glutamic acid0.858
CarbohydratesD-cellobiose
α-D-lactose0.646−0.635
β-methyl-D-glucoside
D-xylose
i-erythritol
D-mannitol0.839
α-D-glucose-1-phosphate 0.727
D,L-α-glycerol phosphate
N-acetyl-D-glucosamine0.809
Carboxylic acidsD-glucosaminiczcid 0.777
D-galactonic acid lactone
D-galacturonic acid0.770
Pyruvic acid methyl ester0.646
γ-hydroxybutyric acid
Itaconic acid
α-ketobutyric acid
D-malic acid0.653
AminePhenylethylamine 0.624
Putrescine0.805
Polymers40 Tween 400.808
80 Tween 800.702
α-cyclodextrin0.747
Glycogen −0.745
Phenolic acids2-hydroxybenzoic acid0.808
4-hydroxybenzoic acid0.933
Disclaimer/Publisher’s Note: The statements, opinions and data contained in all publications are solely those of the individual author(s) and contributor(s) and not of MDPI and/or the editor(s). MDPI and/or the editor(s) disclaim responsibility for any injury to people or property resulting from any ideas, methods, instructions or products referred to in the content.

