
Design of a Tree Micro Drill Instrument to Improve the Accuracy of Wood Density Estimation
by
 , , ,
, , ,
Jianfeng Yao
1,2,3,
Zhenyang Wu
1,
Yili Zheng
4,
Benqiang Rao
5,*,
Zhuofan Li
2,3,6,
Yunchao Hu
1 and
Bolin Nie
1 1
College of Computer and Information Technology, Xinyang Normal University, Xinyang 464000, China
2
Henan Dabieshan National Field Observation and Research Station of Forest Ecosystem, Zhengzhou 450046, China
3
Xinyang Academy of Ecological Research, Xinyang 464000, China
4
School of Technology, Beijing Forestry University, Beijing 100083, China
5
College of Life Science, Xinyang Normal University, Xinyang 464000, China
6
College of Tourism, Xinyang Normal University, Xinyang 464000, China
*
Author to whom correspondence should be addressed.
Forests 2023, 14(10), 2071; https://0-doi-org.brum.beds.ac.uk/10.3390/f14102071
Submission received: 9 August 2023
/
Revised: 4 October 2023
/
Accepted: 10 October 2023
/
Published: 17 October 2023
(This article belongs to the Special Issue Recent Advances in Nondestructive Evaluation of Wood: In-Forest Wood Quality Assessments)
Abstract
:To improve the estimation accuracy of wood density and study the linear correlation between drill feed resistance and wood density, a new micro drill instrument prototype that can simultaneously measure the rotation resistance and feed resistance of the drill needle was designed. The test tree species included hard and soft broad-leaved trees and coniferous trees, and the absolute dry density of each wood sample was measured. The drill resistance data were tested by our newly proposed prototype and a Resistograph 650-SC, and four linear models were established to define the relation between drill resistance and the absolute dry density of the wood. The results showed that (1) the statistical indicators of each model for our proposed prototype were better than the corresponding indicators of the Resistograph 650-SC for three of the four species tested; (2) the coefficient of determination of the linear regression model between the feed resistance of our proposed prototype and the absolute dry density of wood was 0.946; and (3) the statistical indicators of the model that included rotation resistance and feed resistance were better than those of the model that only including rotation resistance. Although the proposed prototype produced a competitive level of accuracy and explicitly demonstrated that including feed resistance improved wood density measurement accuracy, the prototype should be considered a first iteration as further hardware design changes and in-forest performance assessments across wider diverse set of test species are required before a conclusive evaluation can be rendered.
1. Introduction
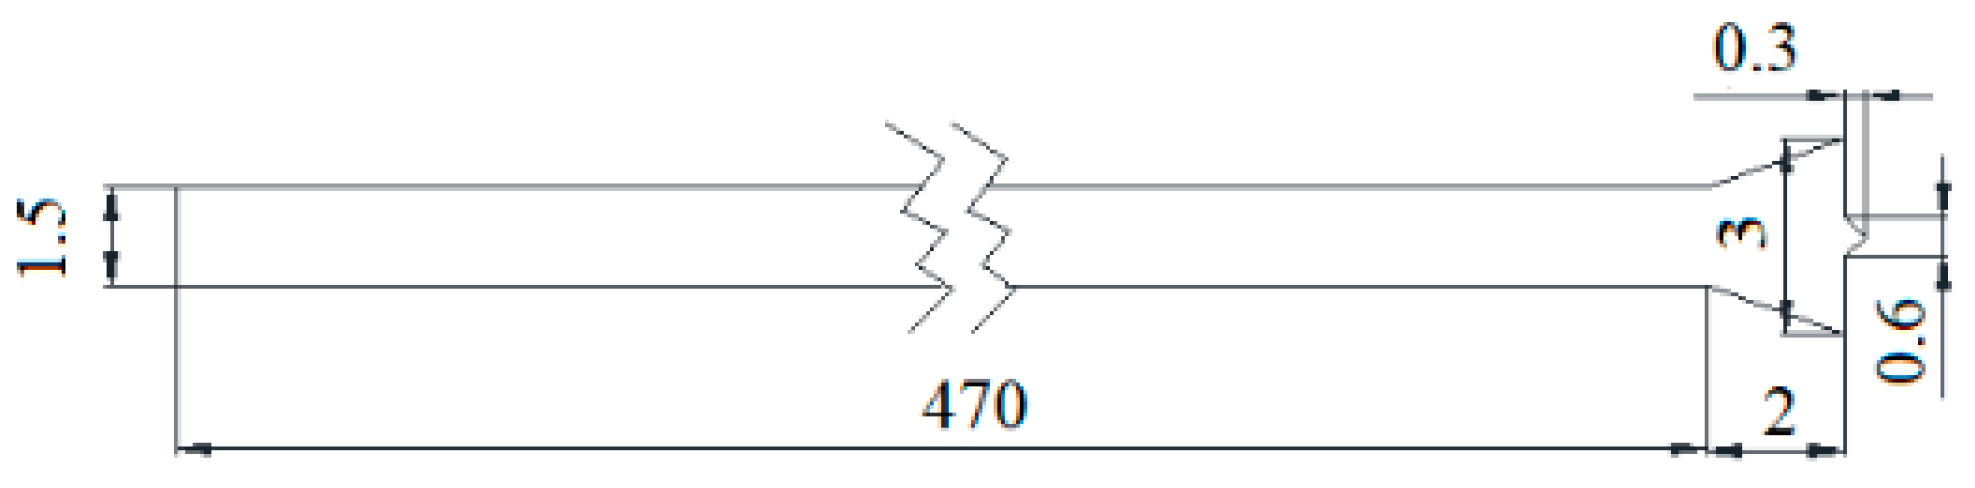
A micro drill resistance instrument is a mechanical drill system that measures the resistance profile as a rotating drill is driven into wood at a constant speed [1,2]. The first prototype of the micro drill resistance instrument was developed by Kamm and Voss in 1984, and it employed a spring-loaded recording mechanism [1]. However, these mechanically recorded profiles were considered non-reproducible and unreliable. A study conducted at Hohenheim University and the Environmental Physics Institute of Heidelberg University made a breakthrough in the drill resistance concept and found that electronic recording of the motor power consumption could achieve much more repeatable and reliable resistance profiles than recordings of the spring-loaded recording mechanism [1]. Originally, the power consumption of both motors, one for controlling the feed speed and the other for controlling the rotation speed of the drill, was measured individually while the drill was going forward and backward. Therefore, four profiles were recorded per measurement during the initial stages of design. Detailed analyses showed that the power consumption of the feed motor while pulling the drill forward and of both motors while pulling the drill backward did not provide significant additional information [1]. Therefore, drill resistance usually measured only the power consumption of the rotation motor while the drill was going forward. Thousands of tests revealed that a shaft diameter of 1.5 mm and a tip width of 3 mm (Figure 1) represented a good compromise between minimizing damage and maximizing information in the profiles [1,2,3,4].
With such breakthroughs, thousands of drilling instruments were sold worldwide. At present, several machine types of resistance drills are available from different manufacturers, such as Sibtec (DDD, DDD2000), GPA (XDG400, D400), TEREDO (1,2,3), IML (R1280/1410, M300/400/500, F300/400/500, E300/400/500, and B400), and Rinntech (R2350, R3450, R4450/S, R5450/S, R650/PR/EA/ED/SC) [1,2,3]. These instruments vary significantly in size, weight, resolution, and precision.
Considerable research has explored the use of the micro drill resistance instrument for various applications such as tree-ring analysis [2,5,6,7], tree age assessment [3,8], wood density estimation [9,10,11,12,13], tree decay detection [14], and structural timber condition assessment [15]. Rinn et al. demonstrated that Resistograph profiles of coniferous and deciduous wood can reveal density variations inside tree rings caused by earlywood and latewood. They even identified the narrow ring caused by the extremely dry summer of 1976 from the resistance profile of Norway spruce (P. abies) [2]. Szewczyk et al. measured the ages of 15 pine trees (Pinus sylvestris L.), 15 oak trees (Quercus robur L.), and 15 birch trees (Betula pendula ROTH.) using an IML-Resi E400 and an increment corer and showed that the tree ages estimated by the IML-Resi E400 were underestimated relative to those measured by the increment corer. The mean bias error values were −6.5, −2.5, and −6.0 years for pine, oak, and birch, respectively. The results showed that the IML-Resi E400 enables a quick but approximate tree age assessment [3]. Isik et al. measured the density of fourteen full subfamilies of loblolly pine (Pinus taeda L.) at four sites by an increment corer and IML-RESI B400 resistance profiles. The family mean correlation between the two measurements was 0.92. The results suggest that micro drill resistance instruments are reliable and efficient tools to assess relative wood density of living trees for selection in tree improvement programs [16]. Downes et al. tested the density of approximately 2000 eucalypts trees (mainly Eucalptus globulus, also E. nitens) in seven studies by an increment corer and IML PD400 resistance profiles. Within individual studies, the relationship between mean Resi values and core basic density was strong (R2 from 0.662 to 0.868). The results show that the IML PD400 is an accurate and rapid in-forest tool for estimating wood density in standing trees [11].
Although electronic micro drill resistance instruments have been available for over 30 years [17] and present advantages that include fast measurement speed and minimal damage to the tested object, they still cannot replace the increment corer. The main reason is that the estimation accuracy of the micro drill resistance instrument is still lower than that of the increment corer. For example, Isik et al. found that drill resistance had weak (0.29) to moderate (0.65) phenotypic correlations with density measured by an increment corer on an individual tree [16]. Guller et al. found that the ring width measured by the micro drill resistance instrument was significantly different from that measured by an increment corer [5]. At present, micro drill resistance instruments are mainly produced by the companies Rinntech and IML. Due to technical confidentiality, the detailed mechanical structure and drill resistance representation are not provided to users, which limits the development of micro drill resistance instruments. To further improve the estimation accuracy of the micro drill resistance instrument, Shouzheng Tang of the Chinese Academy of Sciences guided us to study the principle and application of the micro drill resistance instrument in 2017. Although we started relatively late, we have promoted the development and application of micro drill resistance instruments [6,7,18,19,20,21,22,23,24,25,26,27,28,29,30]. The micro drill resistance instrument we developed in the early stage used a ball screw as the transmission component [6,7,18,19,20,21,22,23,24]. Due to the weight of the ball screw, the entire instrument was relatively heavy [19]. Based on Rinn’s research results [1], we only recorded the rotation resistance of the drill. Based on our experience, the higher the density of the drilled wood, the greater the operator’s thrust on the micro drill resistance instrument. Therefore, it is necessary to further study the correlation between drill feed resistance and wood density. In this study, we developed a new tool consisting of two motors: one DC motor that controls the rotation speed of the drill needle, which is called a “rotating motor”; and another DC motor that controls the feed speed of the drill needle, which is called the “feed motor”. The rotation resistance and feed resistance of the drill were both recorded. Linear models between rotation resistance and wood density, between feed resistance and wood density, and among rotation resistance, feed resistance and wood density were established. Based on the determination coefficients and measurement accuracy of the three linear models, we investigated the correlation between drill feed resistance and wood density, and determined whether feed resistance has a significant impact on estimating wood density. To verify the feasibility of the design proposed in the article, we compared the estimation accuracy of our prototype with that of the Resistograph 650-SC.
2. Materials and Methods
2.1. Instrument
2.1.1. Our Newly Proposed—Micro Drill Resistance Instrument Prototype
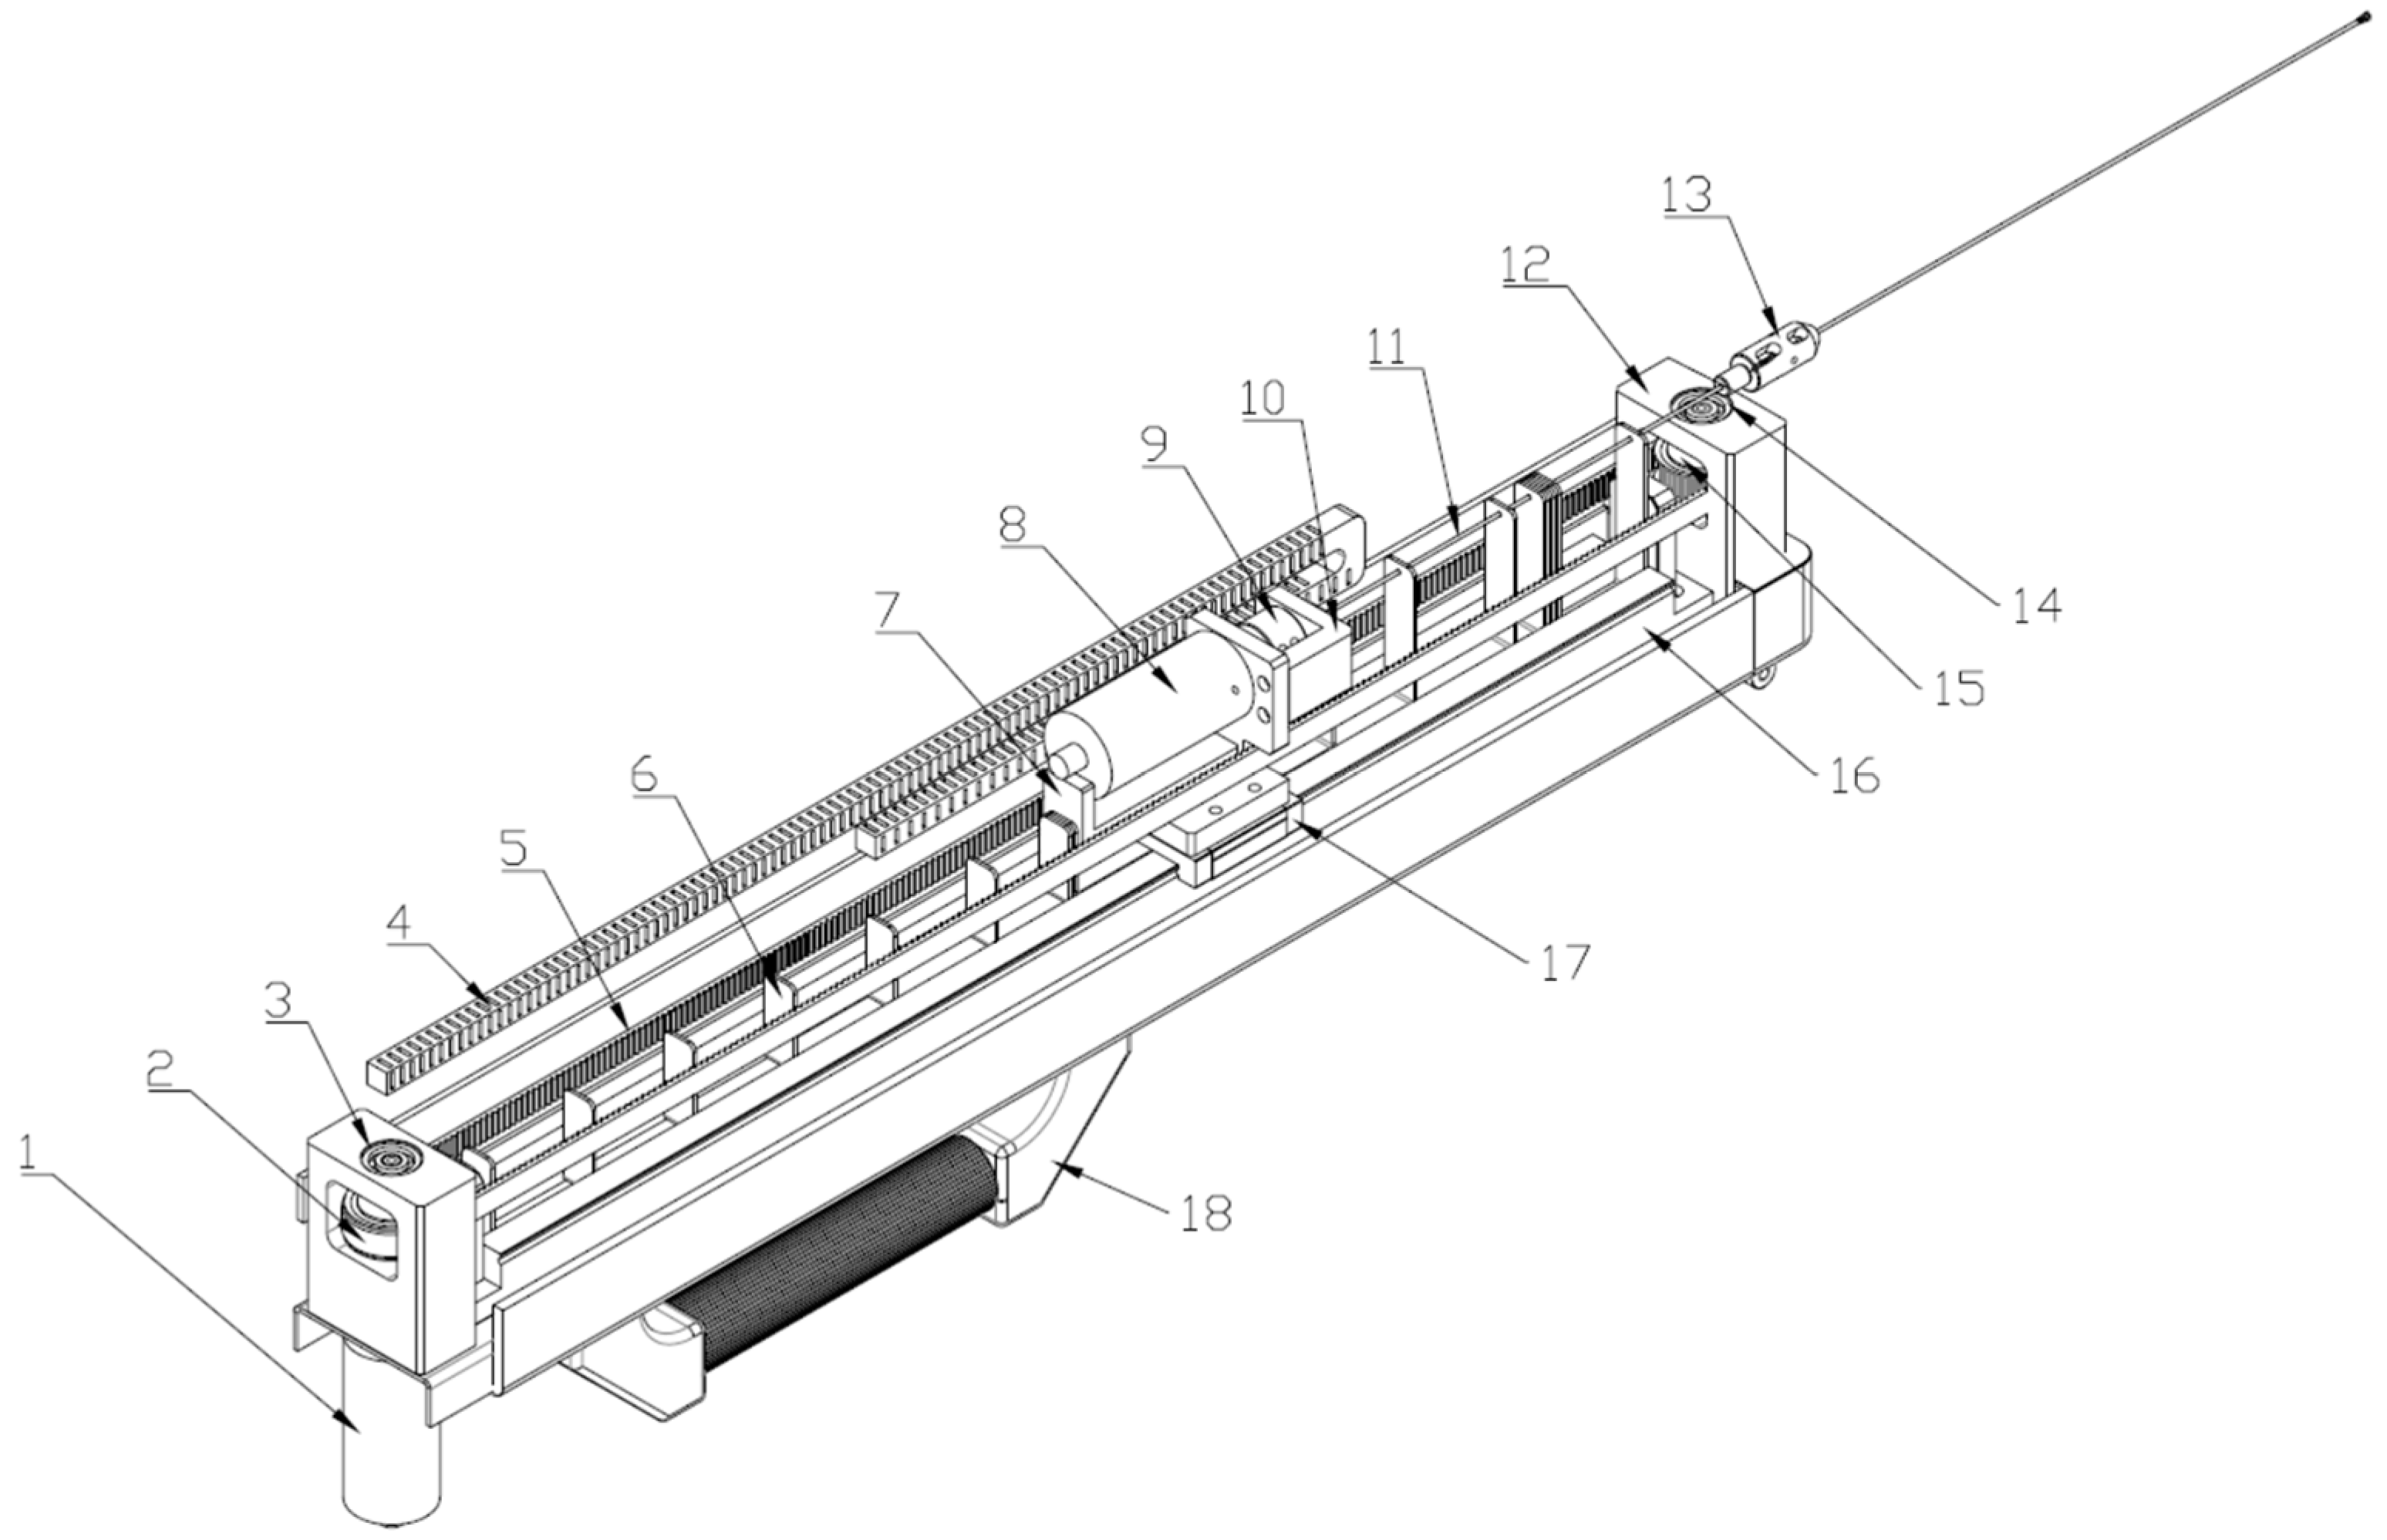
The micro drill instrument we proposed in an early stage adopted a threaded screw transmission method. Although the transmission accuracy of the threaded screw is high, the overall weight of the micro drilling instrument is very heavy due to the 4 kg weight of the threaded screw transmission system, making it inconvenient to operate [19]. To reduce the weight of the micro drill, we used the timing belt transmission mode to control the drill feed movement (Figure 2) in our prototype.
The drill needle is connected to the rotation motor shaft through the drill needle clamp. Thus, the rotation speed of the drill needle is the same as that of the rotation motor. The feed motor shaft is connected to the reduction gear shaft, and the reduction gear shaft is connected with the timing belt driving wheel shaft. The reduction gear ratio is 1:1000, that is, when the feed motor rotates every 1000 revolutions, the driving wheel of the timing belt rotates 1 revolution. The slots on the timing belt driving wheel and driven wheel mesh with the rack on the inside of the timing belt. The two ends of the timing belt are fixed on the rotation motor base, the rotation motor base is fixed on the ball slide, the ball slide is installed on the plastic slide, and the ball slide can do reciprocating linear movement on the plastic slide. When the feed motor rotates in the clockwise direction, the reduction gear drives the timing belt to rotate in the clockwise direction, thus pushing the rotation motor seat and the drill needle forward. When the feed motor rotates in the counterclockwise direction, the reduction gear drives the timing belt to rotate counterclockwise, thus pushing the rotation motor base and the drill needle to move backward.
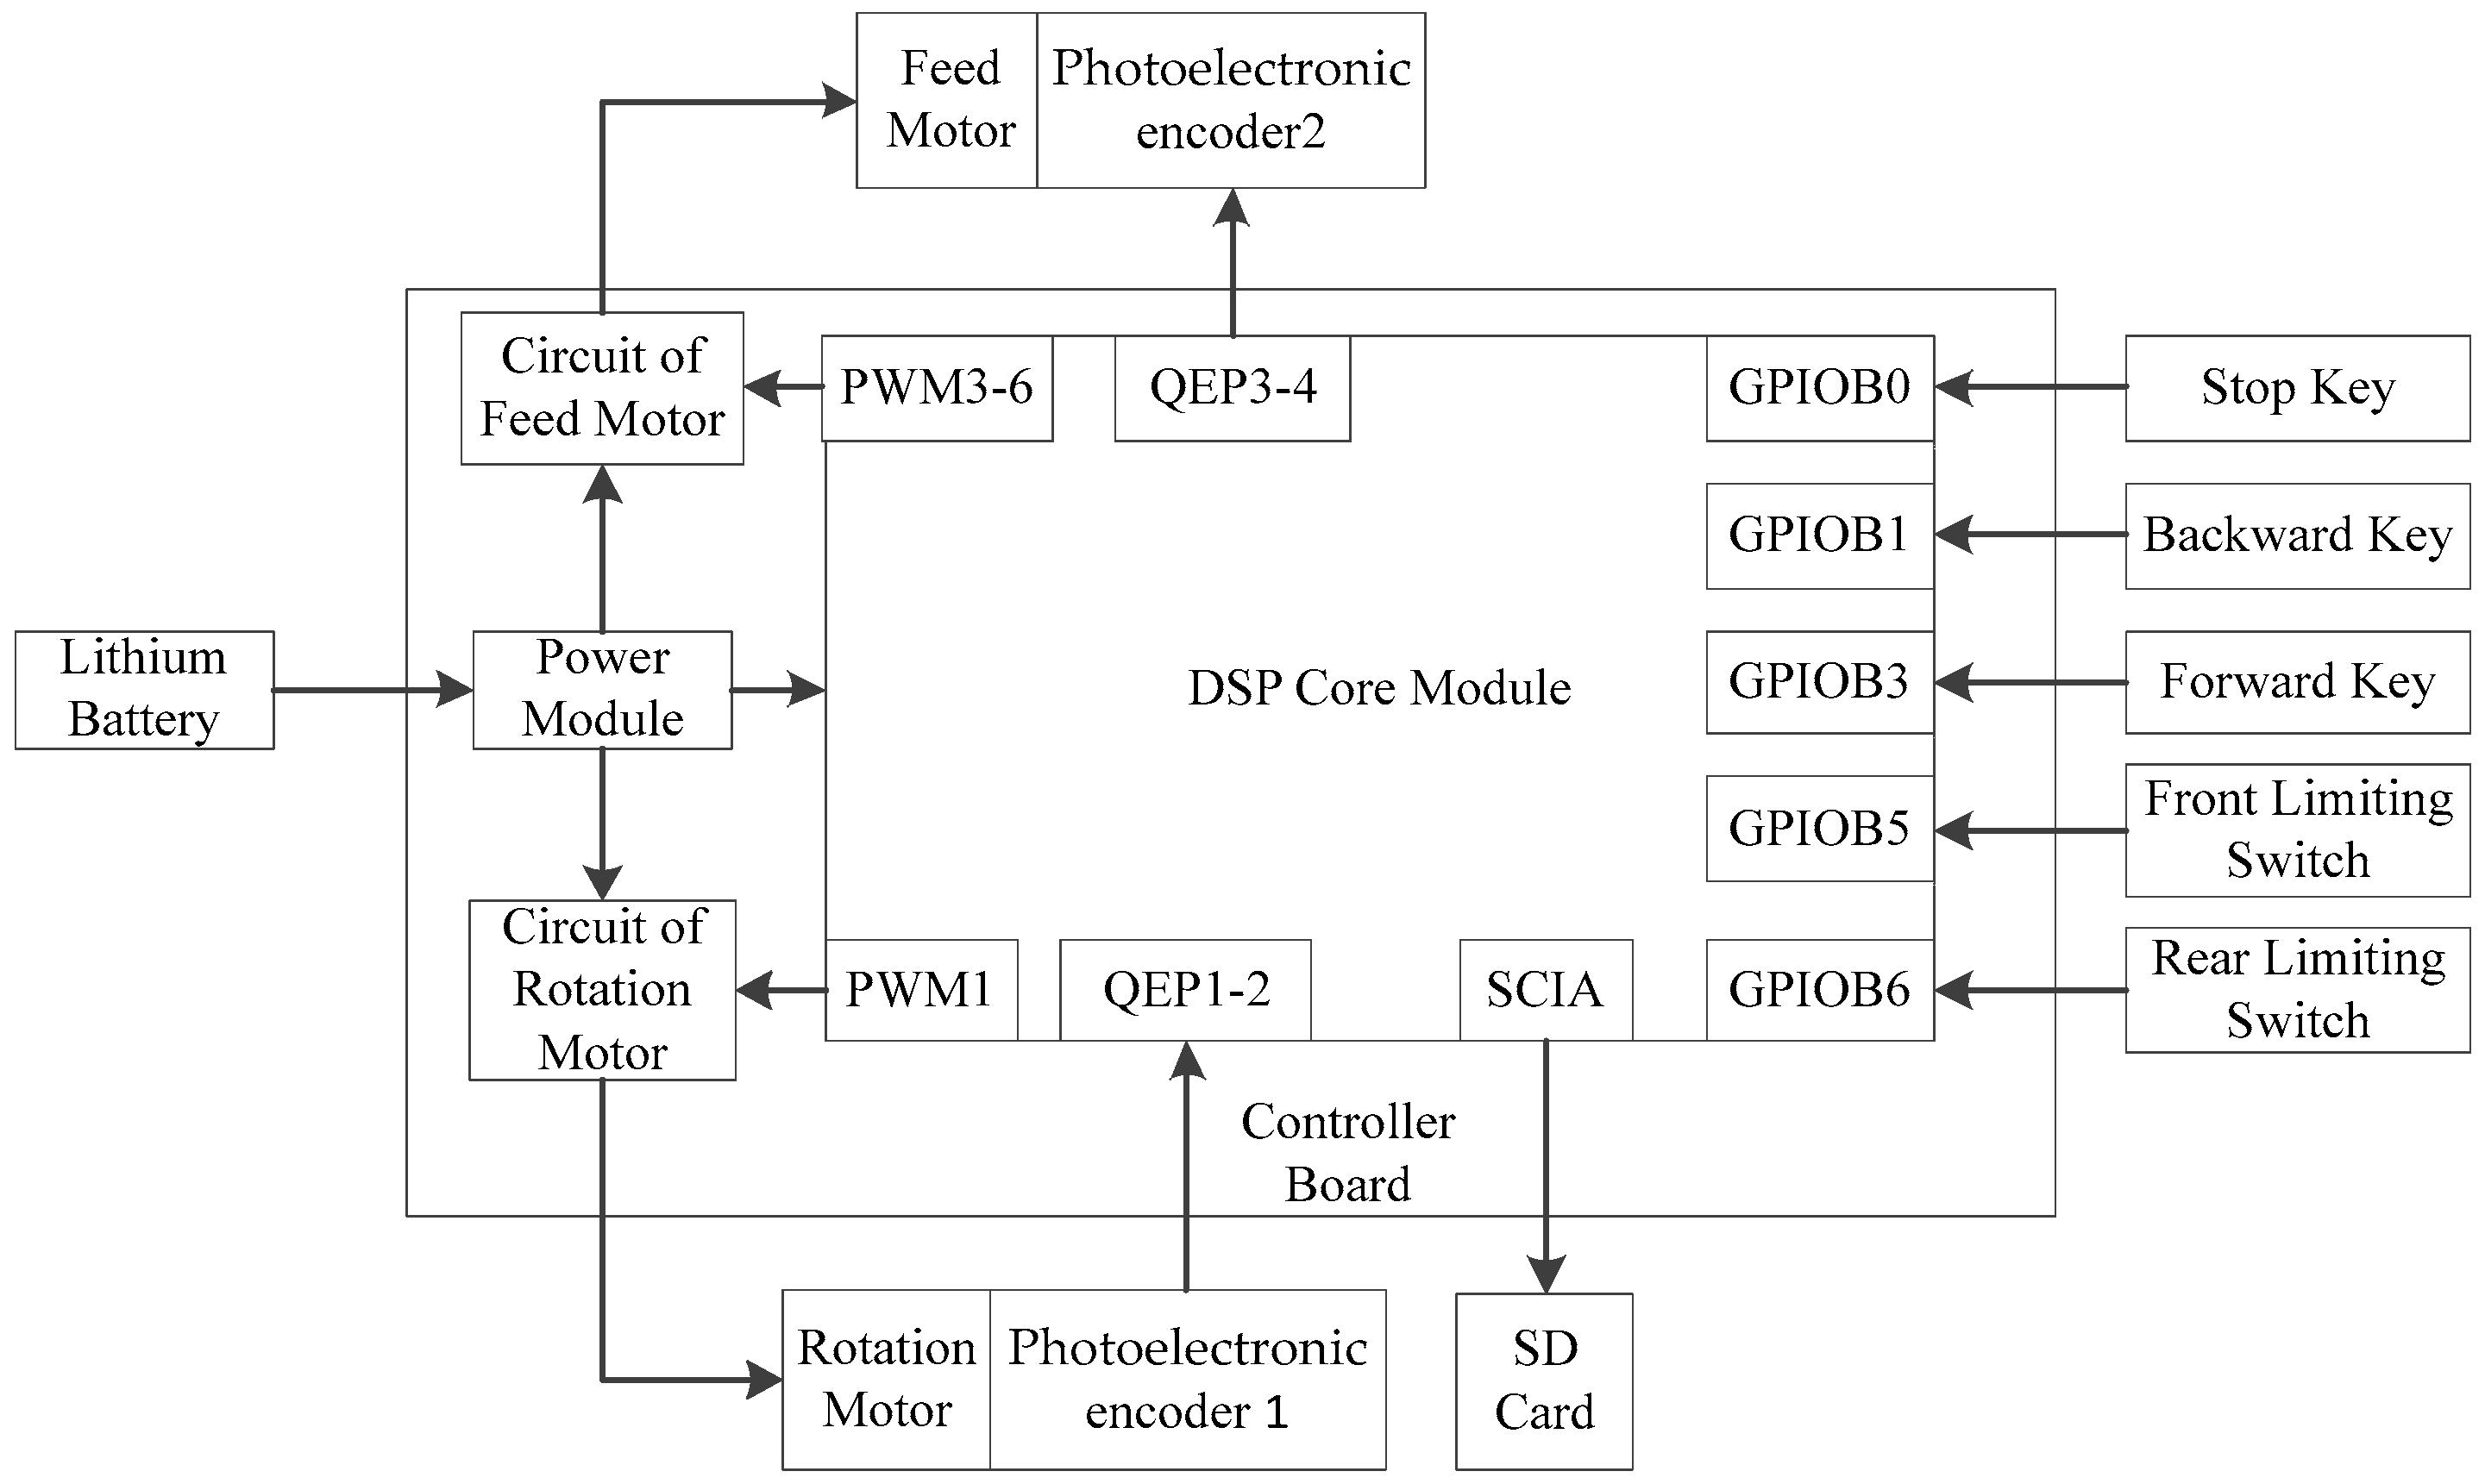
The micro drill controller is responsible for the switch control, speed control, resistance conversion, and storage. The controller hardware includes a digital signal processing (DSP) core module [31], a rotation motor control module, a feed motor control module, and a switch control module. The control system structure is shown in Figure 3.
Owing to the symmetrical shape of the drill needle, the rotation direction of the drill needle has little effect on the resistance of the drill needle. Therefore, the rotating motor does not need to control the rotation direction of the drill needle. To reduce the volume of the controller, the rotating motor is controlled by only one metal oxide semiconductor (MOS) transistor [32]. Owing to the need for forward and backward movement of the drilling needle, it is necessary to control the rotation direction of the feed motor. The feed motor driving circuit adopts an H-bridge driving circuit [33], which is composed mainly of four MOS transistors.
The speed control module of the rotation motor calculates the real-time speed of the rotation motor based on the count value N2 of timer T2. In the design, the encoder grating disk of the rotation motor has 1024 gratings. For each revolution of the rotation motor, the A and B pulse signals of optoelectrical encoder 1 send 1024 pulses to the DSP. The DSP counts both the rising and falling edges of the encoder’s two pulse signals A and B. Therefore, for every revolution of the rotation motor, the count value N2 of timer T2 is 4096. The sampling period is set to 1 ms, and the formula for calculating the rotational speed of the rotating motor is as follows:
where n1 is the real-time speed of the rotation motor, measured in r/min.
The speed control module of the rotation motor uses a proportional integral derivative (PID) control algorithm [34,35,36] to calculate the value of the duty cycle register CMPR1 based on the set speed value n0 (r/min) and real-time speed n1.
The speed control module of the feed motor calculates the real-time speed of the rotation motor based on the count value N4 of timer T4. In the design, the encoder grating disk of the feed motor has 1000 gratings. For each revolution of the rotation motor, the A and B pulse signals of the optoelectrical encoder 2 send 1000 pulses to the DSP. The DSP counts both the rising and falling edges of the encoder’s two pulse signals A and B. Therefore, for every revolution of the feed motor, the count value N4 of timer T4 is 4000. The sampling period is set to 1 ms, the formula for calculating the rotational speed of the rotating motor is as follows:
where n2 is the real-time speed of the feed motor, measured in r/min.
In this design, the reduction ratio k of the reduction gear is 1:1000, the diameter d of the driving wheel of the timing belt is 3 cm (i.e., every 1000 r of the feed motor, the driving wheel of the timing belt rotates 1 r, and the drill needle moves forward or backward 3π cm). Therefore, the formula for calculating the feed speed of the drilling needle is as follows:
where v is the real-time speed of the drill, measured in cm/min.
The speed control module of the feed motor uses the PID control algorithm to calculate the value of the duty cycle register CMPR2 or CMPR3 based on the set speed value v0 (cm/min) and real-time speed v.
When the drill needle is in a forward state, it is necessary to calculate and store the drill needle resistance value. The resistance in the rotation direction of the drilling needle is directly proportional to the control voltage of the rotation motor and inversely proportional to the speed of the rotation motor. Therefore, the resistance in the rotation direction of drilling needle can be indirectly represented by the control voltage of the rotation motor after speed correction. The calculation formula is as follows:
where f1 is the rotation resistance of the drill, measured in V; U is the power voltage, measured in V; and D1 is the PWM duty cycle of the rotation motor.
Similarly, the calculation formula for the feed resistance of the drill needle is as follows:
where f2 is the feed resistance of the drill, measured in V; and D2 is the PWM duty cycle of the feed motor.
After the conversion of drill needle resistance is completed, the serial communication interface (SCI) serial port sending function is used to send resistance f1 and f2 to the secure digital (SD) card.
After extensive tests, when n0 was set to 3500 r/min and v0 was set to 20 cm/min, our newly proposed prototype worked normally. Therefore, n0 was set to 3500 r/min and v0 was set to 20 cm/min in the study. The resistance sampling period is 1 ms; therefore, the distance between the resistance sampling points at the feed speed, i.e., the resolution, is 0.00033 cm.
2.1.2. Resistograph 650-SC
The Resistograph 650-SC is a micro drilling resistance instrument produced by Rinntech in Germany. The feed speed of the drill of Resistograph 650-SC is 60 cm/min, and the rotation speed of the drill is unknown. The distance between resistance sampling points is 0.001 cm. The Resistograph 650-SC records only the rotation resistance of the drill needle, which is expressed in “resi” [1], and the specific representation method is unknown. The instrument is powered by a lithium battery, and the power supply voltage is 32 V.
2.2. Materials
The experimental materials were six windblown fallen tree trunks sampled from a natural secondary forest on the campus of Xinyang Normal University in November 2022. They included two pine trees (Pinus massoniana), two oak trees (Quercus acutissima), one paulownia tree (Paulownias fortune), and one poplar tree (Populus tomentosa). The experimental tree species included hard broad-leaved trees, coniferous trees, and soft broad-leaved trees.
Three 0.6 m long trunks were cut from each tree at height of 1.3 m, 5.3 m, and 9.3 m. The bark of the trunks was removed, and the trucks were then cut using a saw into cubic blocks with side lengths of 3 cm. Twenty wood blocks without obvious defects were selected for each tree species at each sampling height. Therefore, 60 wood blocks were selected for each tree species, and the total number of wood blocks in the experiment was 240.
To reduce the impact of wood moisture content on drill needle resistance [30,37], the wood blocks were oven-dried to an absolute dry state before measuring the wood density and drill needle resistance. The test sample was placed in an oven at 60 °C, and dried at a constant temperature for 6 h. The oven temperature was then set to 105 °C, and the sample was dried to an absolute dry state. Then the oven was turned off and the test sample was stored in a glass dryer after the temperature dropped to room temperature. A balance with a measurement accuracy of 0.01 g was used to measure the absolute dry mass m of each sample. A vernier caliper with a measurement accuracy of 0.001 cm was used to measure the length a, width b, and height h of each sample. The formula for calculating the absolute dry density of each sample is as follows:
where ρ is the absolute dry density of each sample, measured in kg/m3.
2.3. Methods
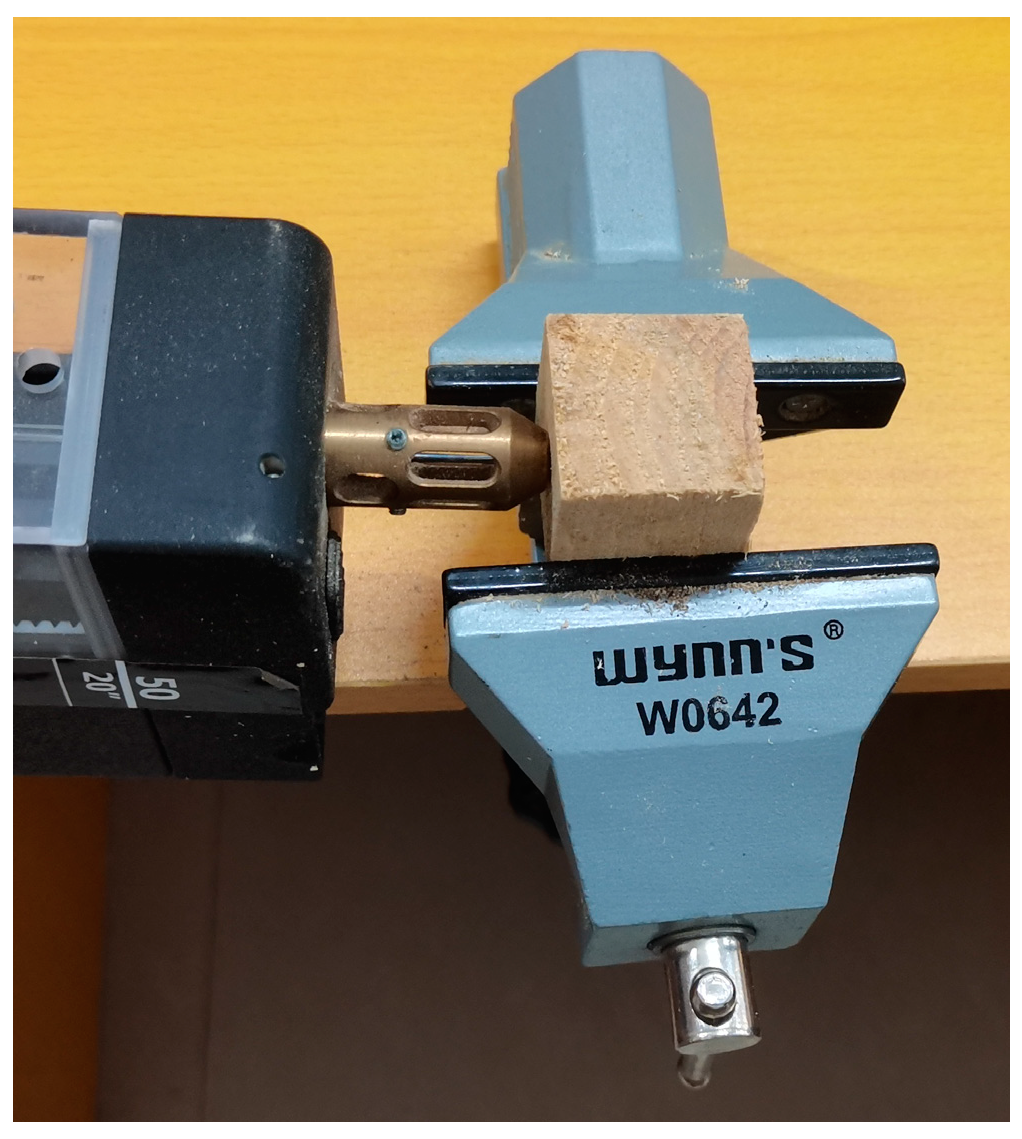
We first used a bench vise to fix the wood block, and then used our newly proposed prototype and the Resistograph 650-SC to drill into the wood blocks along the radial direction of the sample. The resistance sampling method is shown in Figure 4. In order to prevent the drill needle paths of the two instruments from overlapping, the drill needle entry points of the two instruments were approximately 1 cm apart. Finally, we used a vernier caliper to measure the length l of the drilling needle path in the wood.
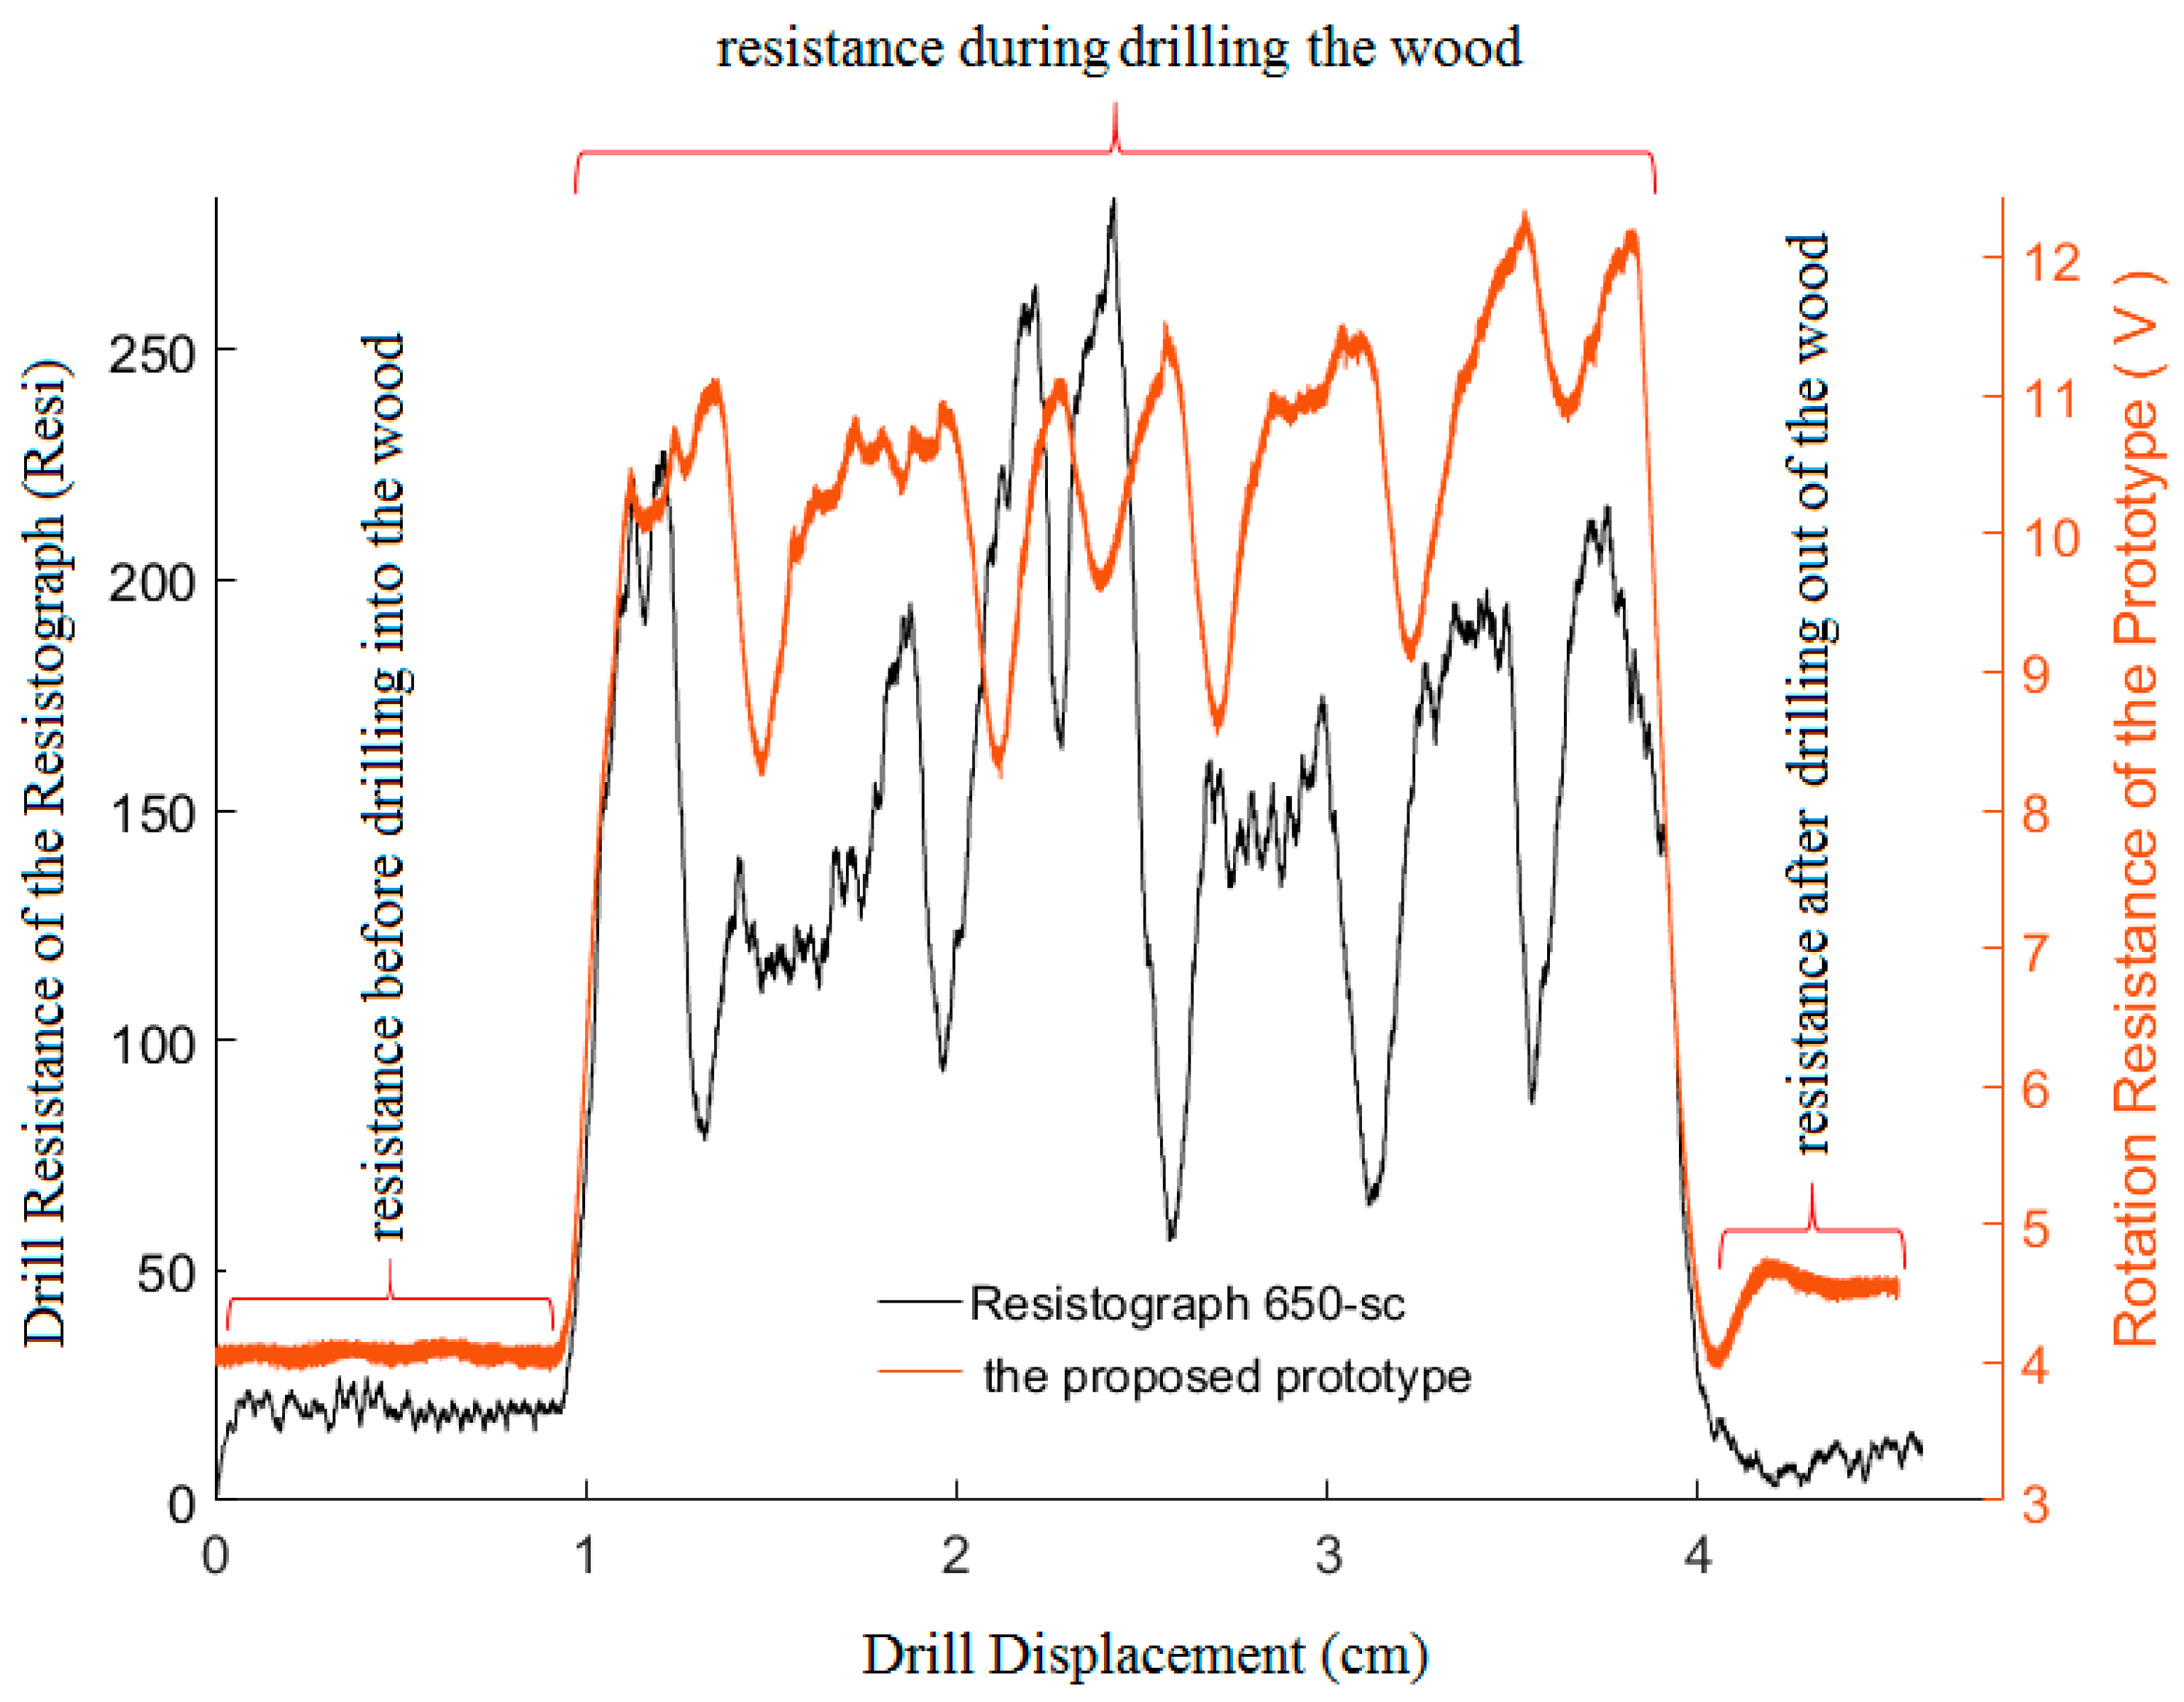
The drill needle penetrated the wood after advancing 1 cm in the drill needle socket, and the micro drilling instrument was stopped after the drill needle drilled 1–2 cm out of the wood. Figure 5 shows the drill resistance variation curve of two instruments during the entire process of drilling into wood.
For our newly proposed prototype, the average distance between adjacent resistance sampling points was 0.00033 cm. Then, based on the front unloaded displacement and length of the drill needle path inside each wooden block, the range of drill needle resistance data and number of resistance sampling points of the drill needle in each test sample were calculated. Finally, the average rotation resistance F1 and average feed resistance F2 of the drill needle in each test sample were calculated separately. For the Resistograph 650-SC, the distance between resistance sampling points was 0.001 cm, and the average resistance FR of the drill needle in each test sample was calculated using the same method.
We randomly selected two-thirds of the data from each tree species as the modeling dataset. Using the absolute dry density ρ as the dependent variable, four linear regression models between F1 and ρ, between F2 and ρ, between FR and ρ, and between F1 and F2 and ρ were established separately using R [38]. Using the remaining one-third of the data as the test dataset, the standard error σ and average accuracy ξ for each model were calculated separately as follows:
where yi is the measurement value of the absolute dry density of the i-th wood block, is the estimated density of the i-th wooden block, and n is the number of test wood blocks.
3. Results
3.1. Statistical Analysis of Wood Density and Drill Resistance
The mean, range, standard deviation, and coefficient of variation of wood density and drill resistance of each tree species are shown in Table 1.
3.2. Data Results for Four Tree Species
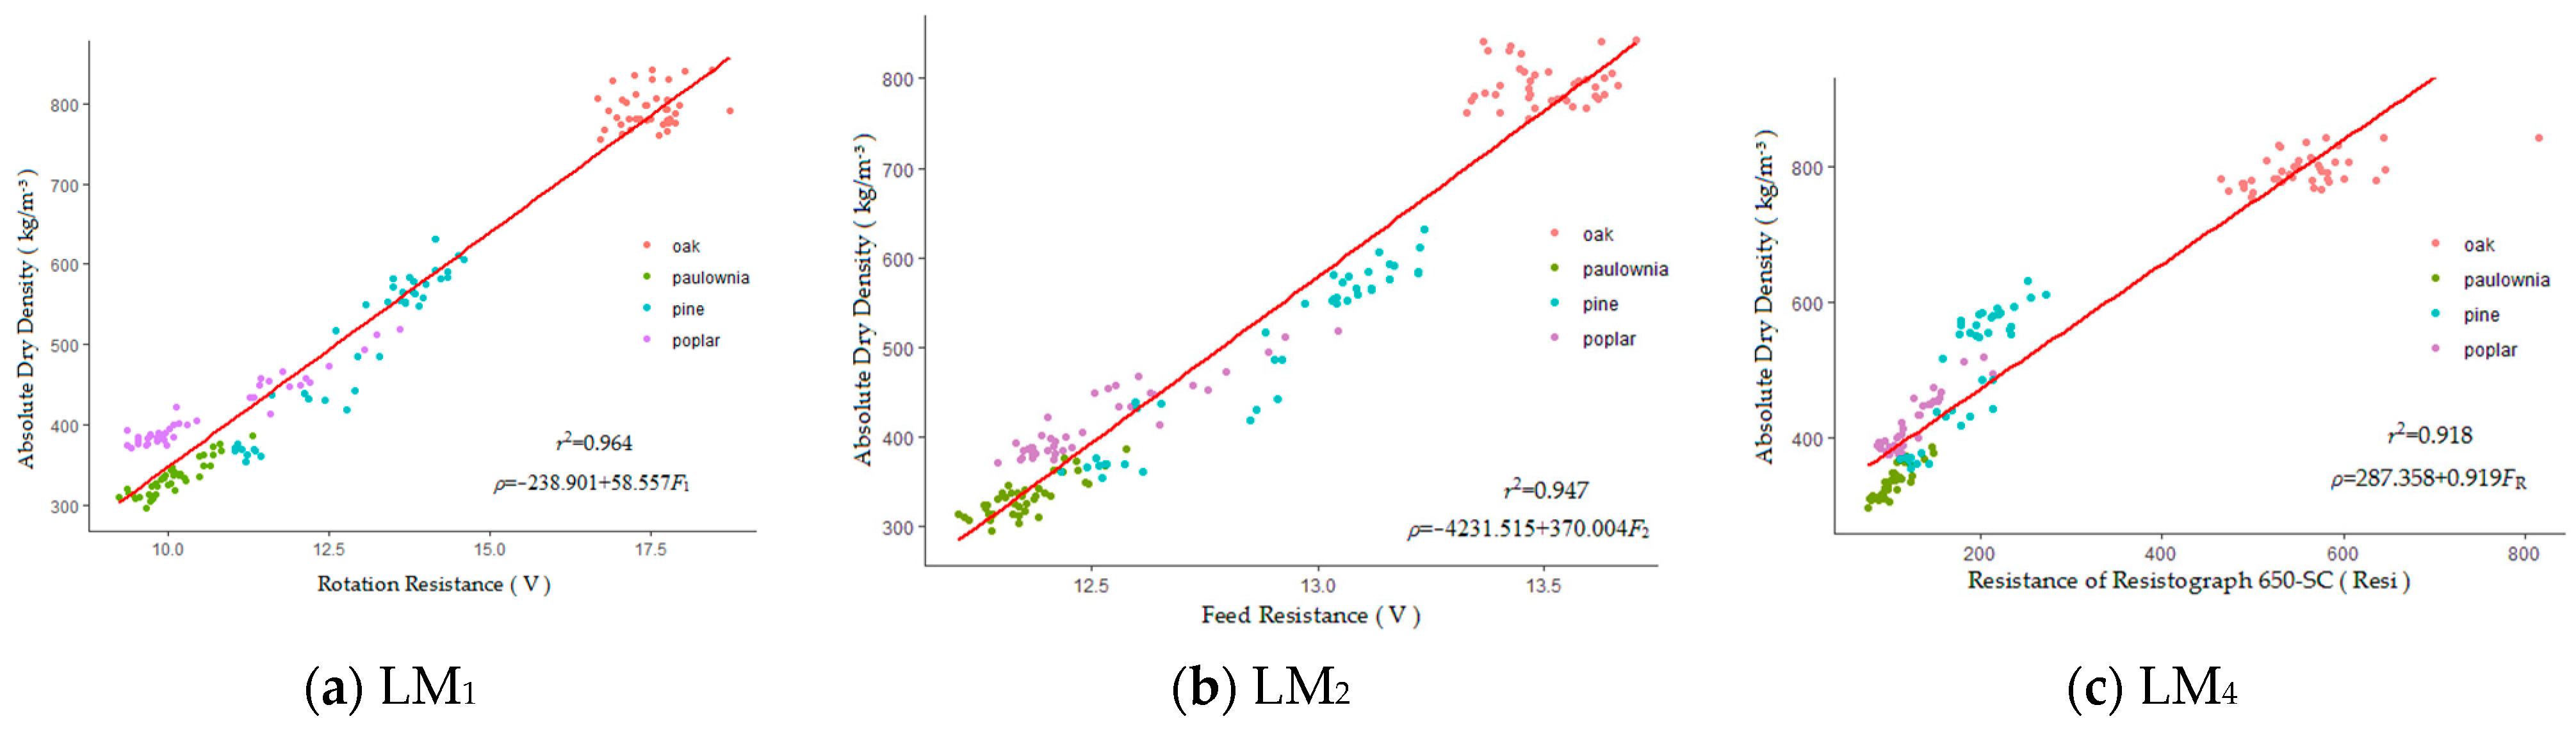
Using the modeling dataset of four tree species, linear model LM1 between F1 and ρ, linear model LM2 between F2 and ρ, linear model LM3 between F1, F2 and ρ, and linear model LM4 between FR and ρ were established separately using R. LM1, LM2, and LM4 are shown in Figure 6.
The coefficient of determination of the linear regression model LM3 between the rotation resistance F1 and feed resistance F2 of our newly proposed prototype and the absolute dry density of wood is 0.965. The parameters of linear regression model LM3 are shown in Table 2.
The testing accuracy of each model is shown in Table 3.
3.3. Data Results for Each Tree Species
3.3.1. Data Results for Paulownia Tree
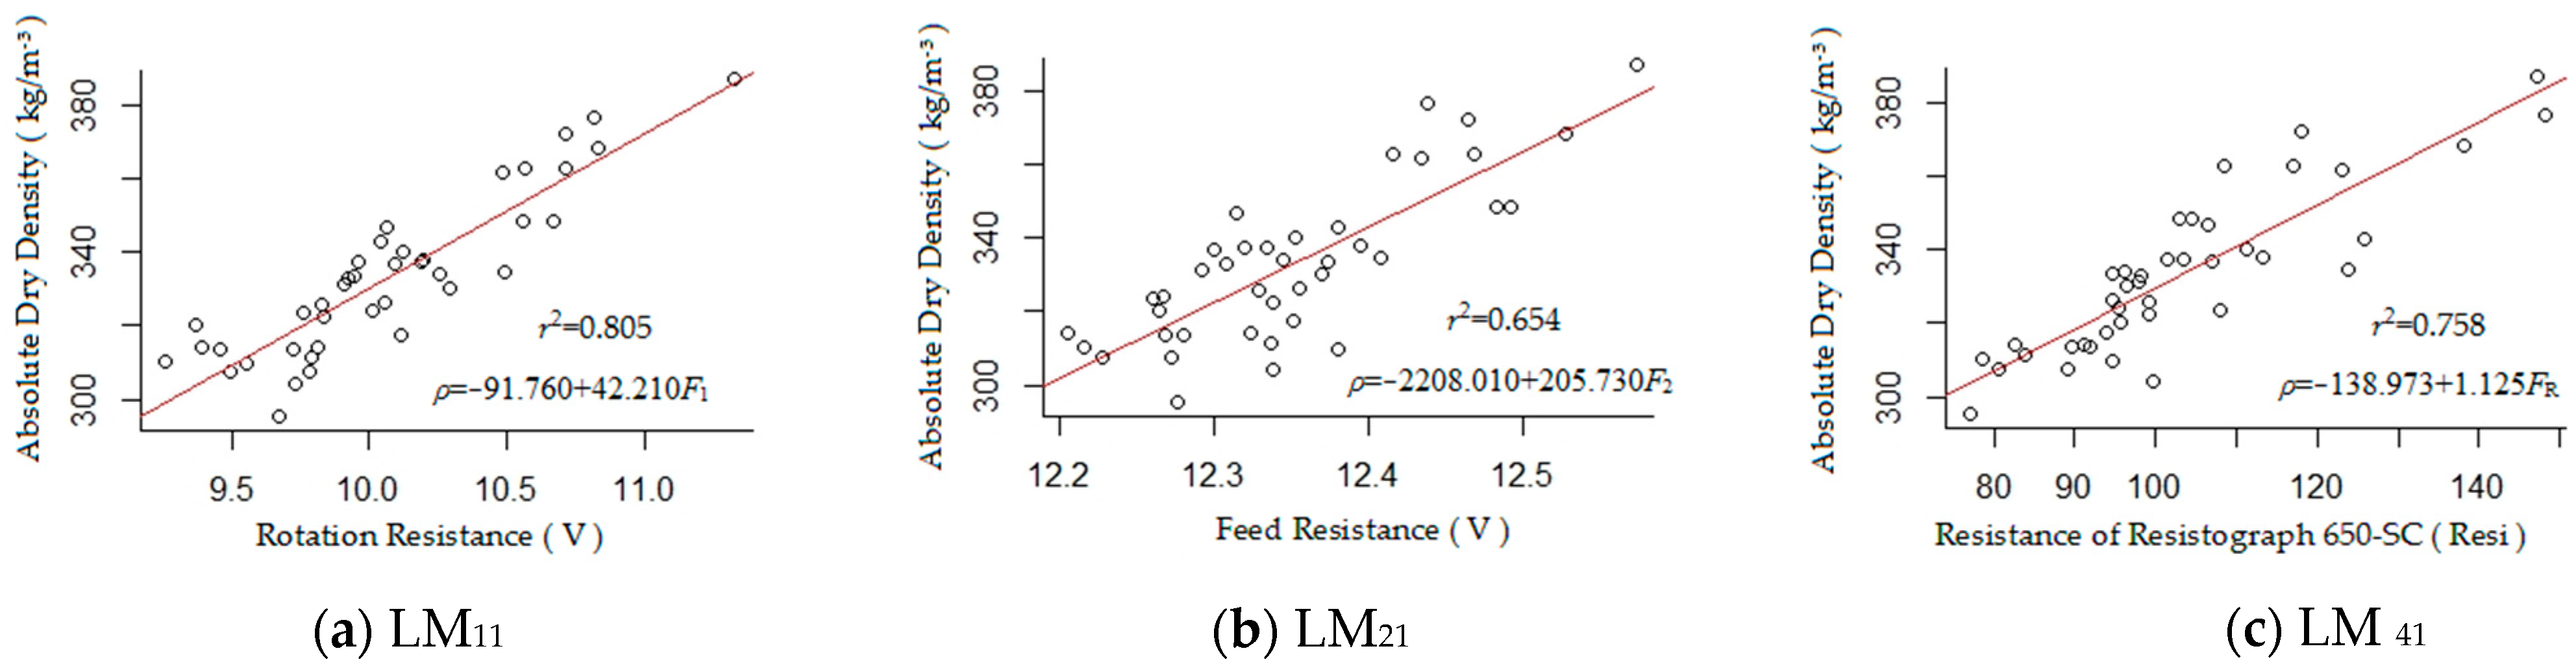
Using the modeling dataset of the paulownia tree, linear model LM11 between F1 and ρ, linear model LM21 between F2 and ρ, linear model LM31 between F1, F2 and ρ, linear model LM41 between FR and ρ were established separately using R. LM11, LM21, and LM41 are shown in Figure 7.
The coefficient of determination of the linear regression model LM31 between the rotation resistance F1 and feed resistance F2 of our newly proposed prototype and the absolute dry density of wood was 0.805. The parameters of the linear regression model LM31 are shown in Table 4.
The testing accuracy of each model is shown in Table 5.
3.3.2. Data Results for the Poplar Tree
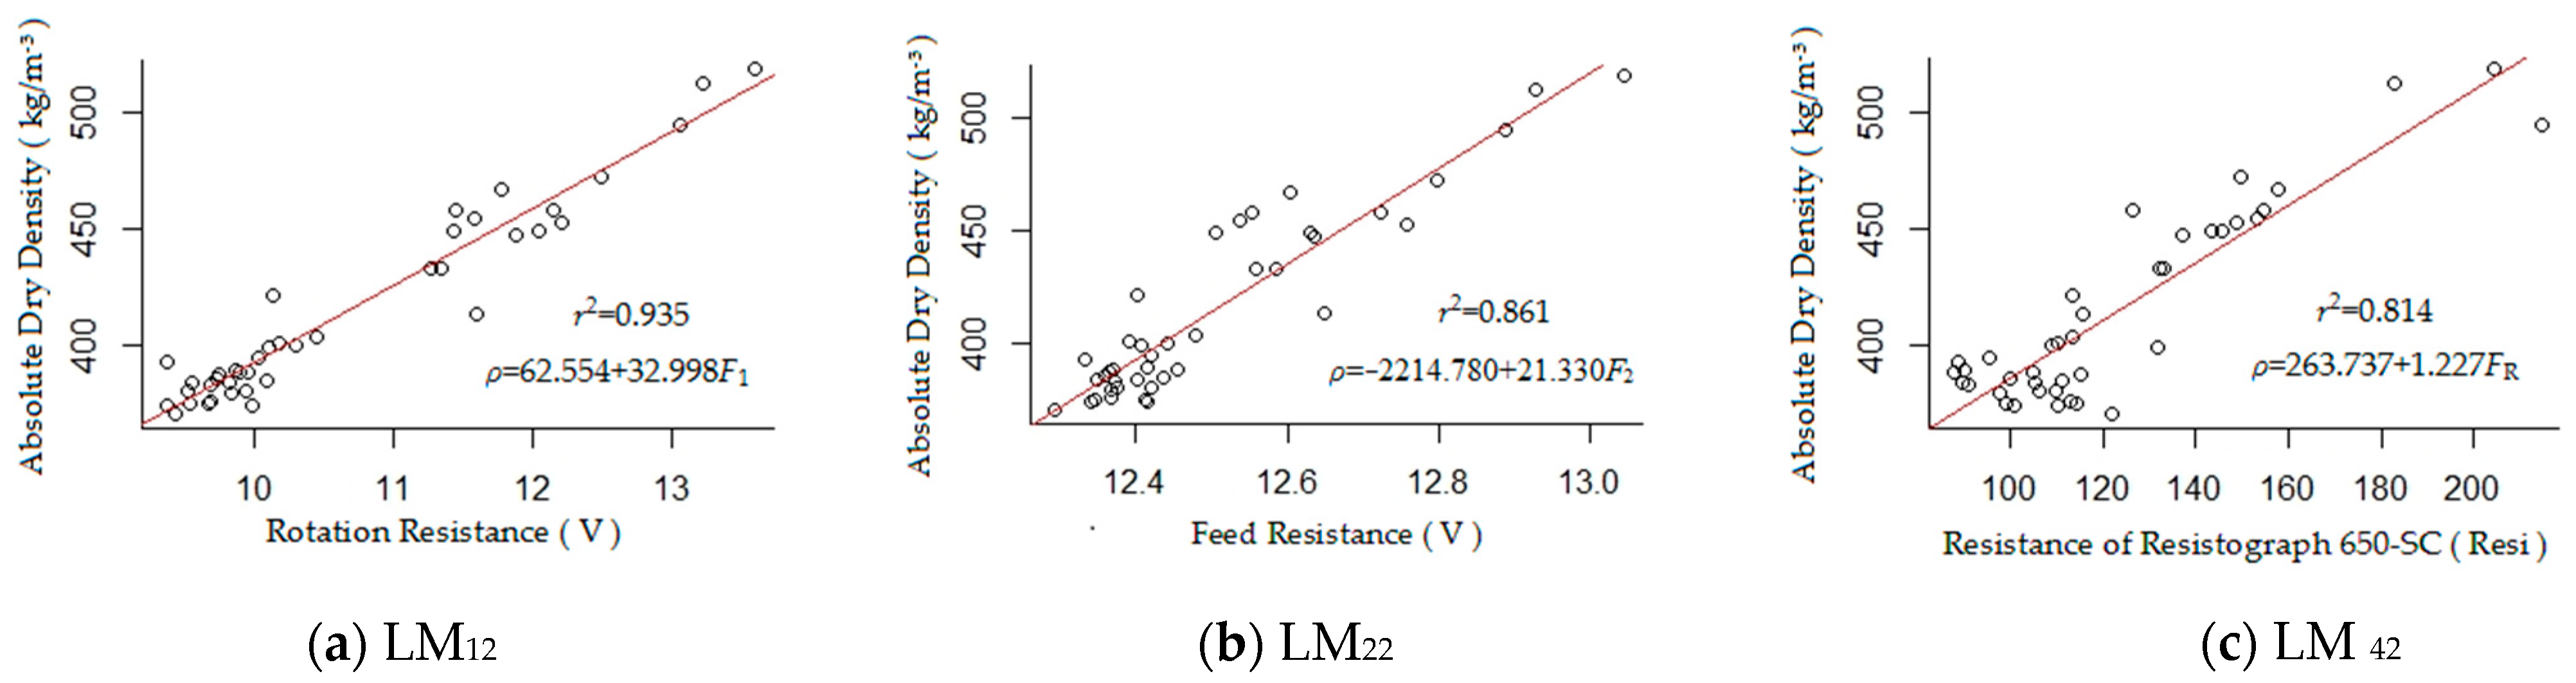
Using the modeling dataset of the poplar tree, linear model LM12 between F1 and ρ, linear model LM22 between F2 and ρ, linear model LM32 between F1, F2 and ρ, and linear model LM42 between FR and ρ were established separately using R. LM12, LM22, and LM42 are shown in Figure 8.
The coefficient of determination of the linear regression model LM32 between the rotation resistance F1 and feed resistance F2 of our newly proposed prototype and the absolute dry density of wood was 0.938. The parameters of the linear regression model LM32 are shown in Table 6.
The testing accuracy of each model is shown in Table 7.
3.3.3. Data Results of the Pine Trees
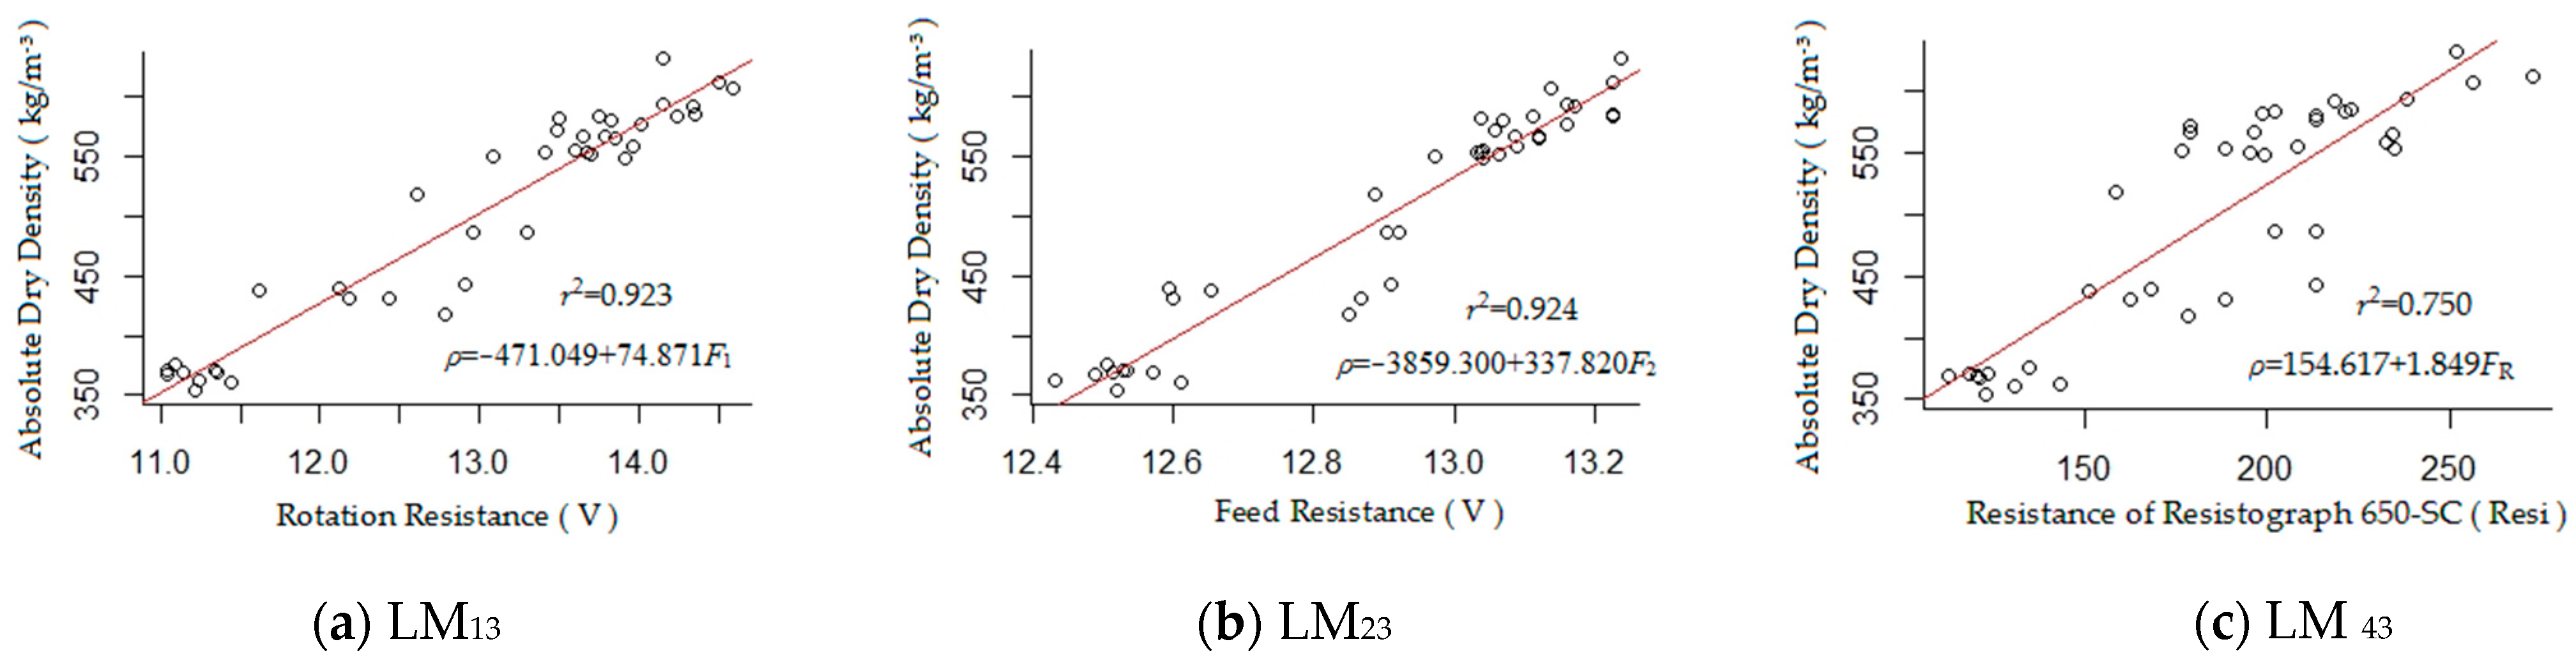
Using the modeling dataset of the pine trees, linear model LM13 between F1 and ρ, linear model LM23 between F2 and ρ, linear model LM33 between F1, F2 and ρ, and linear model LM43 between FR and ρ were established separately using R. LM13, LM23, and LM43 are shown in Figure 9.
The coefficient of determination of the linear regression model LM33 between the rotation resistance F1 and feed resistance F2 of our newly proposed prototype and the absolute dry density of wood was 0.934. The parameters of the linear regression model LM33 are shown in Table 8.
The testing accuracy of each model is shown in Table 9.
3.3.4. Data Results for the Oak Trees
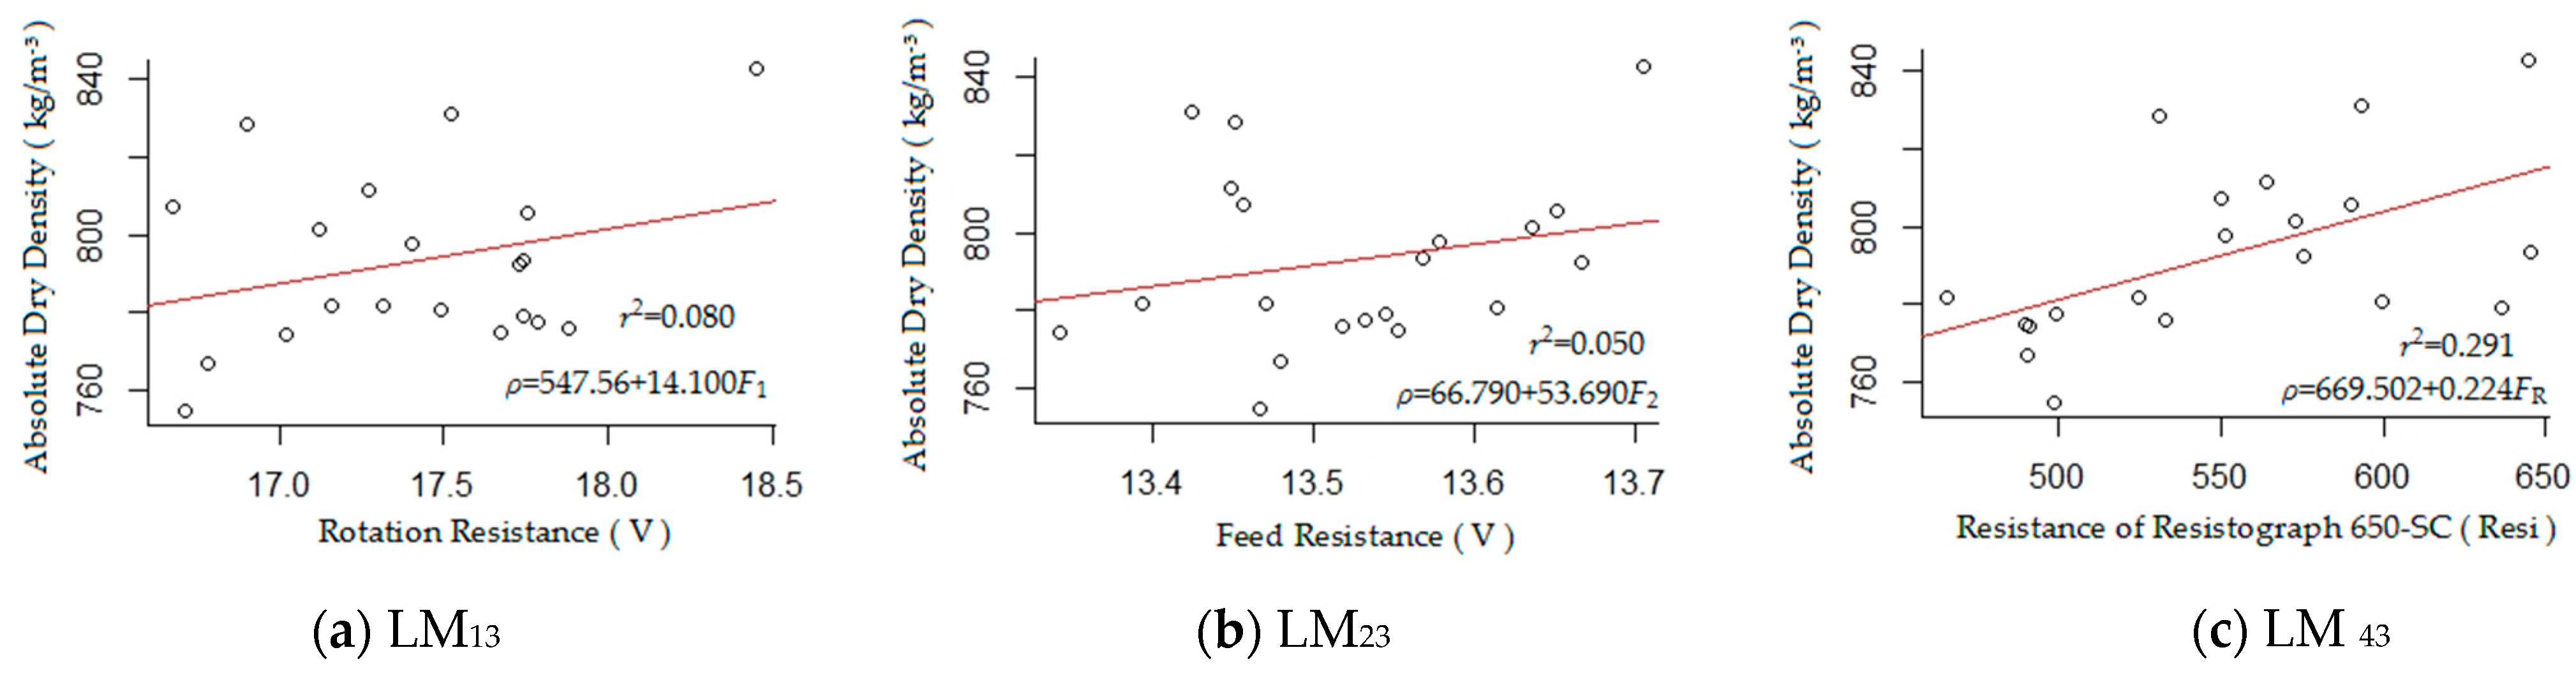
Using the modeling dataset of oak trees, linear model LM14 between F1 and ρ, linear model LM24 between F2 and ρ, linear model LM34 between F1, F2 and ρ, and linear model LM44 between FR and ρ were established separately using R. LM14, LM24, and LM44 are shown in Figure 10.
The coefficient of determination of the linear regression model LM34 between the rotation resistance F1 and feed resistance F2 of our newly proposed prototype and the absolute dry density of wood was only 0.084. The parameters of the linear regression model LM34 are shown in Table 10.
The testing accuracy of each model is shown in Table 11.
4. Discussion
Rinn et al. found that the feed resistance of the drill needle does not provide additional important information [1]. Therefore, most scholars have studied the correlation between drill needle rotation resistance and wood density [39,40]. To study the correlation between the feed resistance of drilling needles and wood density, we designed a micro drilling instrument that can simultaneously measure the rotation resistance and feed resistance of drilling needles. The data for four tree species showed that (1) the feed resistance of drill needles was positively correlated with wood density; (2) the correlation between feed resistance and wood density was lower than that between rotational resistance and wood density; and (3) the measurement accuracy of our newly proposed prototype was higher than that of the Resistograph 650-SC. The results of each tree species’ data showed that (1) among the four tree species, measurement accuracy for three tree species by our newly proposed prototype using the linear model between wood density and drill rotation resistance was higher than that of the Resistograph 650-SC; (2) among the four tree species, three tree species showed a strong correlation between the drill feed resistance and wood density; (3) among the four tree species, only one species had a significant impact on the linear model between wood density and drill feed resistance and rotation resistance.
Overall, drill feed resistance was positively correlated with wood density and had some impact on the measurement accuracy of wood density; however, the correlation between wood density and drill feed resistance was lower than that between wood density and drill rotation resistance, and the influence of drill feed resistance on the measurement accuracy of wood density was lower than that of rotational resistance. This may be for the following reasons. (1) The mechanical time constants of the two DC motors were different. The rotation motor was a DC motor produced by the MAXON company in Switzerland, and it had a time constant of only 5 ms, whereas the feed motor was a DC motor produced by the Zhengke Company in Wenzhou City, Zhejiang Province, China, with a time constant of about 30 ms. (2) The effect of wood density on the rotational resistance of drilling needles was greater than that of feed resistance. The rotation resistance needs to break the wood fibers, while the feed resistance only needs to break the connection between the wood fibers. When the coefficient of variation of wood density is small, the effect of wood density on the feed resistance of the drilling needle is very small. (3) The impact of operator thrust on the rotation resistance and feed resistance of the drill needle may be different. The operator’s thrust has a significant impact on the feed resistance of the drill needle, but it has a smaller impact on the rotational resistance. During the measurement process, due to breathing, shaking, and other reasons, the operator’s thrust on the micro drill instrument changes, resulting in changes in the feed resistance of the drill needle. In future research, the feed motor can be replaced with a MAXON motor, and a fixed bracket for the micro drill instrument can be designed to reduce the influence of human factors on the feed resistance of the drilling needle. When measuring hardwood, the drill rotation resistance and feed resistance of our newly proposed prototype were not linear correlated to the wood density, and the measurement accuracy of our newly proposed prototype with the linear model between wood density and drill rotation resistance was lower than that of the Resistograph 650-SC. In addition, the feed speed of the Resistograph 650-SC was three times that of our newly proposed prototype. These differences may have been caused by the low power of the rotation motor and feed motor of our newly proposed prototype. The power supply voltage of the Resistograph 650-SC is 32 V, whereas the power supply voltage of our newly proposed prototype is 24 V; therefore, the output torque of the two motors in the Resistograph 650-SC instrument is greater than those of the our newly proposed prototype. In future designs, high-power motors can be used to control the rotation speed and feed rate of the drill needle in our proposed prototype.
The results of the two instruments show that the correlation between the drill resistance and wood density of hardwood was lower than that of softwood. When drilling into hardwood, the resistance of the drill tip is high, and the drill shaft deforms greatly and even bends. Therefore, the friction between the drill shaft and drill needle support plate and the drilled hole in wood is relatively large. The drill resistance is no longer concentrated on the drill tip, which reduces the correlation between the drill resistance and wood density. In future research, it is necessary to further change the drill shape, improve the mechanical strength of the drill material, and study methods to remove the resistance of the drill shaft. The two instruments have high accuracy in measuring the density of oak wood, which is mainly due to the small coefficient of variation in oak wood density. When the coefficient of variation of wood density is small, even using the average wood density as the measurement result of wood density can still achieve high measurement accuracy.
From the overall results, the larger the coefficient of variation of wood density, the stronger the correlation between drilling needle resistance and wood density. When the coefficient of variation of wood density is small, the drill resistance is not correlated or only weakly correlated with the wood density. Therefore, the drill resistance cannot recognize small density differences. This may be caused by the following reasons. (1) Wood is a typically heterogeneous material, and there are some differences in local wood density. Therefore, the local wood density on the drilling path in wood cannot accurately reflect the average density of the entire wood block. (2) The drill shaft is long and thin; thus, when the drill rotates at high speed, the drill shaft will vibrate and even deform. Therefore, there is some noise signal in the drill resistance signal.
Among the four tree species, only the feed resistance of pine trees had a significant impact on the linear model between wood density and rotation resistance, and feed resistance. However, the total data processing results showed that the feed resistance had a significant impact on the linear model between wood density and rotation resistance, and feed resistance. This indicates that the drill feed resistance also contains some important information, and it is worth further research.
Due to the lack of IML micro drill resistance instruments, we are still unable to compare the measurement accuracy of our prototype with that of IML micro drill resistance instruments. In the future, we will purchase an IML micro drill resistance instrument, determine the advantages of the IML micro drill resistance instrument, further improve our prototype, and compare the advantages and disadvantages of our prototype with the IML micro drill resistance instrument. At present, the prototype is still in the laboratory testing stage and has not yet undergone live tree testing. Therefore, our designed micro drill resistance instrument still requires additional improvements until it reaches the practical application stage.
Compared to the increment corer, the micro drill resistance instrument has the advantages of faster measurement speed and less damage to trees. However, the measurement accuracy of the micro drill resistance instrument is still lower than that of the increment corer. Therefore, in some application fields, such as dendrochronology, the drill needle resistance instrument cannot replace the increment corer. Although Rinn et al. has made significant contributions to the development of micro drill resistance instruments, the micro drill resistance instrument must be further developed to improve the accuracy. We hope that additional scholars will study the working principle and application of micro drill resistance instruments to accelerate the development of micro drill resistance technology.
5. Conclusions
Data from three of the four tree species indicated that the statistical indicators of each model of the our newly proposed prototype were better than the corresponding indicators of the Resistograph 650-SC. The coefficient of determination of the linear regression model between the feed resistance of the our newly proposed prototype and the absolute dry density of wood was 0.946 for the total modeling dataset of four tree species. Therefore, the feed resistance of the drilling needle is strongly correlated with the wood density. For the total modeling dataset of the four tree species, the statistical indicators of the model that included rotation resistance and feed resistance were better than those of the model that only included rotation resistance, and it was statistically significant at the 95% confidence level. Therefore, adding feed resistance to the model between wood density and drill resistance can improve the estimation accuracy of the micro drill resistance instrument for measuring wood density. These findings show that the design scheme of the micro drilling resistance instrument proposed in the article is reasonable and produced a competitive level of accuracy when estimating wood density. However, the prototype should be considered a first iteration as further hardware design improvements (e.g., motors and power supply) and in-forest performance assessments across wider diverse set of test species, are required before a conclusive evaluation can be rendered.
Author Contributions
Conceptualization, J.Y. and B.R.; methodology, J.Y. and Z.W.; hardware, J.Y. and Y.Z.; validation, J.Y., B.R. and Y.Z.; formal analysis, Z.L.; investigation, J.Y. and Z.L.; resources, J.Y. and Z.L.; data curation, Y.H. and B.N.; writing—original draft preparation, Z.W.; writing—review and editing, J.Y. and B.R.; visualization, J.Y. and Z.L.; supervision, J.Y.; project administration, J.Y.; funding acquisition, J.Y. All authors have read and agreed to the published version of the manuscript.
Funding
This research was funded by the Natural Science Foundation of Henan Province (232300421167), Key Scientific Research Projects of Universities in Henan Province (22A220002), Xinyang Academy of Ecological Research Open Foundation (2023XYQN04), Xinyang Academy of Ecological Research Open Foundation (2023XYZD02), Natural Science Foundation of Henan Province (222300420274), Academic Degrees & Graduate Education Reform Project of Henan Province (2021SJGLX057Y), and Postgraduate Education Reform and Quality Improvement Project of Henan Province (YJS2023SZ23).
Data Availability Statement
Not applicable.
Acknowledgments
Shouzheng Tang (Chinese Academy of Forestry), provided guidance on topic selection; Xiangdong Lei (Chinese Academy of Forestry), provided the Resistograph 650-SC instrument.
Conflicts of Interest
The authors declare no conflict of interest.
References
- Rinn, F. Basics of Micro-resistance Drilling for Timber Inspection. Holztechnologie 2012, 53, 24–29. [Google Scholar]
- Rinn, F.; Schweingruber, F.-H.; Schär, E. Resistograph and X-ray Density Charts of Wood. Comparative Evaluation of Drill Resistance Profiles and X-ray Density Charts of Different Wood Species. Holzforschung 1996, 50, 303–311. [Google Scholar] [CrossRef]
- Szewczyk, G.; Wasik, R.; Leszczyński, K.; Podlaski, R. Age Estimation of Different Tree Species Using a Special Kind of an Electrically Recording Resistance Drill. Urban For. Urban Green. 2018, 34, 249–253. [Google Scholar] [CrossRef]
- Rinn, F. Practical Application of Micro-resistance Drilling for Timber Inspection. Holztechnologie 2013, 54, 32–38. [Google Scholar]
- Guller, B.; Guller, A.; Kazaz, G. Is Resistograph an Appropriate Tool for the Annual Ring Measurement of Pinnus Brutia? In Proceedings of the NDE for Safety/Defektoskopie 2012, 42nd International Conference, Seč, Czech Republic, 30 October–1 November 2012; pp. 89–94. [Google Scholar]
- Hu, X.; Zheng, Y.; Liang, H.; Zhao, Y. Design and Test of a Microdestructive Tree-ring Measurement System. Sensors 2020, 20, 3253. [Google Scholar] [CrossRef]
- Hu, X.; Zheng, Y.; Xing, D.; Sun, Q. Research on Tree Ring Micro-Destructive Detection Technology Based on Digital Micro-Drilling Resistance Method. Forests 2022, 13, 1139. [Google Scholar] [CrossRef]
- Oh, J.; Seo, J.; Kim, B. Determinate the Number of Growth Rings Using Resistograph with Tree-ring Chronology to Investigate Ages of Big Old Trees. J. Korean Wood Sci. Technol. 2019, 47, 700–708. [Google Scholar] [CrossRef]
- Downes, G.M.; Nyakuengama, J.G.; Evans, R.; Northway, R.; Blakemore, P.; Dickson, R.L.; Lausberg, M. Relationship between. Wood Density, Microfibril Angle and Stiffness in Thinned and Fertilized Pinus Radiata. IAWA J. 2002, 23, 253–265. [Google Scholar] [CrossRef]
- Nickolas, H.; Williams, D.; Downes, G.; Harrison, P.A.; Vaillancourt, R.E.; Potts, B.M. Application of Resistance Drilling to Genetic Studies of Growth, Wood Basic Density and Bark Thickness in Eucalyptus globulus. Aust. For. 2020, 83, 172–179. [Google Scholar] [CrossRef]
- Downes, G.M.; Lausberg, M.; Potts, B.M.; Pilbeam, D.L.; Bird, M.; Bradshaw, B. Application of the Iml Resistograph to the Infield Assessment of Basic Density in Plantation Eucalypts. Aust. For. 2018, 81, 177–185. [Google Scholar] [CrossRef]
- Wang, X. Recent Advances in Nondestructive Evaluation of Wood. In-Forest Wood Quality Assessments. Forests 2021, 12, 949. [Google Scholar] [CrossRef]
- Gao, S.; Wang, X.; Wiemann, M.C.; Brashaw, B.K.; Ross, R.J. A critical analysis of methods for rapid and nondestructive determination of wood density in standing trees. Ann. For. Sci. 2017, 74, 77. [Google Scholar] [CrossRef]
- Johnstone, D.M.; Ades, P.K.; Moore, G.M.; Smith, I.W. Predicting Wood Decay in Eucalypts Using an Expert System and the IML-Resistograph Drill. Arboric. Urban For. 2007, 33, 76–82. [Google Scholar] [CrossRef]
- Schimleck, L.; Dahlen, J.; Apiolaza, L.A.; Downes, G.; Emms, G.; Evans, R.; Moore, J.; Pâques, L.; Van den Bulcke, J.; Wang, X. Non-Destructive Evaluation Techniques and What They Tell Us about Wood Property Variation. Forests 2019, 10, 728. [Google Scholar] [CrossRef]
- Isik, F.; Li, B. Rapid Assessment of Wood Density of Live Trees Using the Resistograph for Selection in Tree Improvement Programs. Can. For. Res. 2003, 33, 2426–2435. [Google Scholar] [CrossRef]
- Rinn, F. Device for Material Testing, Especially Wood Inspection by Drill Resistance Measurements. German Patent 4122494B4, 16 September 1993. [Google Scholar]
- Chen, X. Design of Needle Measurement System for Tree Annual Ring. Master’s Thesis, Beijing Forestry University, Beijing, China, 2019. [Google Scholar]
- Yao, J. Research on Principle and Realization of Tree Ring Measuring Instrument Based on Micro Drill Resistance Method. Ph.D. Thesis, Chinese Academy of Forestry, Beijing, China, 2020. [Google Scholar]
- Yao, J.; Zhao, Y.; Lu, J.; Zheng, Y.; Gao, R.; Tang, S. Annual-ring Measurement Method Based on Adaptive Filtering Algorithm. Trans. Chin. Soc. Agric. Mach. 2020, 51, 216–222. [Google Scholar]
- Yao, J.; Lu, J.; Zheng, Y.; Wang, X.; Zhao, Y.; Chen, X.; Lei, G.; Tang, S. DC Motor Speed Control of Annual-ring Measuring Instrument Based on Variable Universe Fuzzy Control Algorithm. Trans. Chin. Soc. Agric. Eng. 2019, 35, 57–63. [Google Scholar]
- Yao, J.; Zhao, Y.; Fu, L.; Song, X.; Lu, J.; Li, S. Tree-rings Measurement Method Based on Micro Drill Resistance. Trans. Chin. Soc. Agric. Mach. 2022, 53, 52–59. [Google Scholar]
- Yao, J.; Zhao, Y.; Zhang, H.; Song, X.; Lei, X.; Tang, S. Drill Resistance Expression Method of Tree Micro Drill Instrument. Trans. Chin. Soc. Agric. Mach. 2021, 52, 271–277, 286. [Google Scholar]
- Yao, J.; Fu, L.; Song, X.; Wang, X.; Zhao, Y.; Zheng, Y.; Ye, Q.; Zhai, S. Feasibility Study on Measuring Density of Earlywood and Latewood by Micro Drill Resistance Method. J. For. Eng. 2022, 7, 66–73. [Google Scholar]
- Yao, J.; Guo, X.; Fu, L.; Wang, X.; Lei, X.; Lu, J.; Zheng, Y.; Song, X. Indirect measurement of wood density by micro drill resistance method. Sci. Silvae Sin. 2022, 58, 138–147. [Google Scholar]
- Pan, H.; Lu, J.; Lei, X.; Guo, X.; Yao, J.; Tang, S. Tree Age Estimation Based on Resistograph Stationary Kalman Filter. Sci. Silvae Sin. 2021, 57, 14–23. [Google Scholar]
- Pan, H.; Lu, J.; Guo, X.; Tang, S.; Gao, R.; Xu, J. Feasibility Analysis of Tree Age Estimation Algorithm Using Resistograph Based on Peak-valley Analysis. For. Res. 2020, 33, 48–54. [Google Scholar]
- Yao, J.; Lei, X.; Wang, X.; Fu, L.; Zheng, Y.; Guo, X.; Duan, G.; Song, X. Effect of Moisture Content on Drill Resistance of Micro Drill Resistance Instrument. J. Cent. South Univ. For. Technol. 2022, 42, 137–147. [Google Scholar]
- Yao, J.; Lu, J.; Fu, L. Micro Drill Resistance Instrument Measurements at Different Feed Speeds: Novel Conversion Algorithm for Enhanced Accuracy. J. Nondestruct. Eval. 2023, 42, 56. [Google Scholar] [CrossRef]
- Yao, J.; Lu, J.; Ding, X. Investigating the Resistance Expression Method of Wood Resistance Drill Instruments. For. Prod. J. 2023, 73, 231–238. [Google Scholar] [CrossRef]
- Zhang, Q.; Pei, W. DSP Processer-in-the-Loop Tests Based on Automatic Code Generation. Inventions 2022, 7, 12. [Google Scholar] [CrossRef]
- Toh, E.H.; Wang, G.H.; Lo, G.Q.; Chan, L.; Samudra, G.; Yeo, Y.C. Performance Enhancement of N-channel Impact-ionization Metal-oxide-semiconductor Transistor by Strain Engineering. Appl. Phys. Lett. 2007, 90, 023505. [Google Scholar] [CrossRef]
- Chen, H.-C. An H-bridge driver using gate bias for DC motor control. In Proceedings of the 2013 IEEE International Symposiumon Consumer Electronics (ISCE), Hsinschu, Taiwan, 3–6 June 2013; pp. 265–266. [Google Scholar]
- Hernández-Alvarado, R.; García-Valdovinos, L.G.; Salgado-Jiménez, T.; Gómez-Espinosa, A.; Fonseca-Navarro, F. Neural Network-Based Self-Tuning PID Control for Underwater Vehicles. Sensors 2016, 16, 1429. [Google Scholar] [CrossRef]
- Zhu, R.; Wu, H. Dc Motor Speed Control System Based on Incremental pid Algorithm. Instrum. Tech. Sens. 2017, 7, 121–126. [Google Scholar]
- Wang, J.; Li, M.; Jiang, W.; Huang, Y.; Lin, R. A Design of FPGA-Based Neural Network PID Controller for Motion Control System. Sensors 2022, 22, 889. [Google Scholar] [CrossRef] [PubMed]
- Sharapov, E.; Chernov, V.; Toropov, A.; Smirnova, E. The Impact of Moisture Content on Accuracy of Wood Properties Evaluation by Drilling Resistance Measurement Method. Lesn. Zhurnal 2016, 2, 7–18. [Google Scholar]
- Allaire, J.J.; Xie, Y.; McPherson, J.; Luraschi, J.; Ushey, K.; Atkins, A.; Wickham, H.; Cheng, J.; Chang, W.; Iannone, R. Rmarkdown: Dynamic Documents for R.; R Package Version 2. 2022. Available online: https://cran.r-project.org/package=rmarkdown (accessed on 18 April 2022).
- Fundova, I.; Funda, T.; Wu, H.X. Non-Destructive Wood Density Assessment of Scots Pine (Pinus sylvestris L.) Using Resistograph and Pilodyn. PLoS ONE 2018, 13, e0204518. [Google Scholar] [CrossRef] [PubMed]
- Isaac-Renton, M.; Stoehr, M.; Statland, C.B.; Woods, J. Tree Breeding and Silviculture: Douglas-fir Volume Gains with Minimal Wood Quality Loss under Variable Planting Densities. For. Eco. Manag. 2020, 465, 118094. [Google Scholar] [CrossRef]
Figure 1.
Geometry of the drill. The width of the tip is twice the diameter of the drill shaft; therefore, the drill resistance is mainly concentrated on the tip.
Figure 1.
Geometry of the drill. The width of the tip is twice the diameter of the drill shaft; therefore, the drill resistance is mainly concentrated on the tip.

Figure 2.
Figure of the timing belt transmission. The labels are as follows: 1: feed motor; 2: timing belt driving wheel; 3: driving wheel shaft; 4: cable slot; 5: timing belt; 6: drill needle support plate; 7: backward push element; 8: rotation motor; 9: drill needle clamp; 10: forward push element; 11: drill needle; 12: fixing seat of timing belt wheel; 13: drill needle socket; 14: driven wheel shaft; 15: driven timing belt pulley; 16: plastic slide rail; 17: ball slider; and 18: handle.

Figure 3.
Diagram of the control system.

Figure 4.
Image of wood resistance sampling by micro drill resistance instrument.

Figure 5.
Resistance variation curve of the drill needle during the entire process of drilling into a paulownia wood block. At the beginning and end of the resistance curve, the drill needle is in an empty state. Only the middle part of the resistance curve shows that the drill needle is drilling the wood.

Figure 6.
Analysis of the modeling datasets of the four tree species reveals that the correlations are stronger between the absolute dry density and rotation resistance (a) and feed resistance (b) of our newly proposed prototype compared with those of the Resistograph 650-SC (c).
Figure 6.
Analysis of the modeling datasets of the four tree species reveals that the correlations are stronger between the absolute dry density and rotation resistance (a) and feed resistance (b) of our newly proposed prototype compared with those of the Resistograph 650-SC (c).

Figure 7.
Analysis of the modeling dataset for the paulownia tree showed that the correlation between the absolute dry density and the rotation resistance of our newly proposed prototype (a) was stronger than that of the Resistograph 650-SC (c), although the correlation between the absolute dry density and the feed resistance of our newly proposed prototype (b) was weaker than that of the Resistograph 650-SC (c).

Figure 8.
Analysis of the modeling dataset of the poplar tree showed that the correlation was stronger between the absolute dry density and rotation resistance (a) and feed resistance (b) of our newly proposed prototype compared with those of the Resistograph 650-SC (c).
Figure 8.
Analysis of the modeling dataset of the poplar tree showed that the correlation was stronger between the absolute dry density and rotation resistance (a) and feed resistance (b) of our newly proposed prototype compared with those of the Resistograph 650-SC (c).

Figure 9.
Analysis of the modeling dataset for pine trees showed that the correlations were stronger between the absolute dry density and rotation resistance (a) and feed resistance (b) of the proposed prototype compared with those of the Resistograph 650-SC (c).
Figure 9.
Analysis of the modeling dataset for pine trees showed that the correlations were stronger between the absolute dry density and rotation resistance (a) and feed resistance (b) of the proposed prototype compared with those of the Resistograph 650-SC (c).

Figure 10.
Analysis of the modeling dataset for oak trees showed that the correlation was weaker between the absolute dry density and rotation resistance (a) and feed resistance (b) of the proposed prototype compared with those of the Resistograph 650-SC (c).
Figure 10.
Analysis of the modeling dataset for oak trees showed that the correlation was weaker between the absolute dry density and rotation resistance (a) and feed resistance (b) of the proposed prototype compared with those of the Resistograph 650-SC (c).


Table 1.
Statistical analysis of wood density and drill resistance of two drill resistance instruments. Among the four tree species, the variation coefficient of oak wood density was the smallest, while the variation coefficient of pine wood density was the largest.
Table 1.
Statistical analysis of wood density and drill resistance of two drill resistance instruments. Among the four tree species, the variation coefficient of oak wood density was the smallest, while the variation coefficient of pine wood density was the largest.
| Species | Wood Density | Drill Resistance of the Resistograph | Rotation Resistance of the Proposed Prototype | Feed Resistance of the Proposed Prototype | ||||||||
|---|---|---|---|---|---|---|---|---|---|---|---|---|
| Mean/ (kg∙m−3) | Standard Deviation/ (kg∙m−3) | Coefficient of Variation (%) | Mean (Resi) | Standard Deviation (Resi) | Coefficient of Variation (%) | Mean (V) | Standard Deviation (V) | Coefficient of Variation (%) | Mean (V) | Standard Deviation (V) | Coefficient of Variation (%) | |
| Paulownia | 334.554 | 25.238 | 7.544 | 104.279 | 17.771 | 17.041 | 10.072 | 0.473 | 4.700 | 12.866 | 0.103 | 0.803 |
| Poplar | 414.295 | 48.208 | 11.636 | 121.682 | 27.040 | 22.221 | 10.696 | 1.092 | 10.211 | 13.022 | 0.192 | 1.475 |
| Pine | 504.221 | 93.140 | 18.472 | 193.279 | 40.910 | 21.166 | 13.104 | 1.118 | 8.535 | 13.512 | 0.267 | 1.988 |
| Oak | 855.095 | 27.765 | 3.247 | 552.391 | 68.691 | 12.435 | 17.415 | 0.447 | 2.567 | 14.077 | 0.114 | 0.809 |
| Total | 527.041 | 206.343 | 39.151 | 242.908 | 186.812 | 76.907 | 12.822 | 3.005 | 23.439 | 13.369 | 0.507 | 3.794 |
Table 2.
In linear regression model LM3, the p-value of F2 is 0.047, which indicates that F2 is statistically significant at the 95% confidence level.
Table 2.
In linear regression model LM3, the p-value of F2 is 0.047, which indicates that F2 is statistically significant at the 95% confidence level.
| Parameter | Estimate | Standard Error | t-Value | p-Value |
|---|---|---|---|---|
| intercept | −972.663 | 357.248 | −2.249 | 0.009 |
| F1 | 48.091 | 5.311 | 9.054 | <0.001 |
| F2 | 67.704 | 33.869 | 1.999 | 0.047 |
Table 3.
Test indicators for each model of our newly proposed prototype are better than the corresponding indicators of the Resistograph 650-SC. The test indicators of model LM3, which includes rotational resistance and feed resistance, are better than those of model LM1, which includes only rotational resistance.
| Instrument | Model | Standard Error (kg/m−3) | Average Accuracy (%) |
|---|---|---|---|
| Proposed prototype | LM1 | 32.289 | 94.916 |
| LM2 | 43.021 | 93.869 | |
| LM3 | 31.780 | 94.971 | |
| Resistograph 650-SC | LM4 | 61.917 | 90.702 |
Table 4.
In the linear regression model LM31, the p-value of F2 is 0.917, which indicates that F2 is not statistically significant at the 95% confidence level.
Table 4.
In the linear regression model LM31, the p-value of F2 is 0.917, which indicates that F2 is not statistically significant at the 95% confidence level.
| Parameter | Estimate | Standard Error | t-Value | p-Value |
|---|---|---|---|---|
| intercept | −138.973 | 448.855 | −0.310 | 0.759 |
| F1 | 41.473 | 7.748 | 5.352 | <0.001 |
| F2 | 4.420 | 41.900 | 0.105 | 0.917 |
Table 5.
Test indicators of models LM11 and LM31 are better than the corresponding indicators of model LM41, but the test indicators of models LM21 are worse than the corresponding indicators of model LM41.
Table 5.
Test indicators of models LM11 and LM31 are better than the corresponding indicators of model LM41, but the test indicators of models LM21 are worse than the corresponding indicators of model LM41.
| Instrument | Model | Standard Error (kg/m−3) | Average Accuracy (%) |
|---|---|---|---|
| Proposed prototype | LM11 | 14.545 | 97.023 |
| LM21 | 17.241 | 96.292 | |
| LM31 | 14.508 | 97.030 | |
| Resistograph 650-SC | LM41 | 16.970 | 96.464 |
Table 6.
In linear regression model LM32, the p-value of F2 was 0.269, which indicates that F2 is not statistically significant at the 95% confidence level.
Table 6.
In linear regression model LM32, the p-value of F2 was 0.269, which indicates that F2 is not statistically significant at the 95% confidence level.
| Parameter | Estimate | Standard Error | t-Value | p-Value |
|---|---|---|---|---|
| intercept | 539.395 | 425.052 | 1.269 | 0.212 |
| F1 | 39.365 | 5.843 | 6.737 | <0.001 |
| F2 | −43.576 | 38.819 | −1.123 | 0.269 |
Table 7.
Test indicators of models LM12, LM22, and LM32 are better than the corresponding indicators of model LM42.
Table 7.
Test indicators of models LM12, LM22, and LM32 are better than the corresponding indicators of model LM42.
| Instrument | Model | Standard Error (kg/m−3) | Average Accuracy (%) |
|---|---|---|---|
| Proposed prototype | LM12 | 14.564 | 97.209 |
| LM22 | 17.316 | 96.820 | |
| LM32 | 14.429 | 97.285 | |
| Resistograph 650-SC | LM42 | 17.615 | 96.781 |
Table 8.
In linear regression model LM33, the p-value of F2 is 0.021, which indicates that F2 is statistically significant at the 95% confidence level.
Table 8.
In linear regression model LM33, the p-value of F2 is 0.021, which indicates that F2 is statistically significant at the 95% confidence level.
| Parameter | Estimate | Standard Error | t-Value | p-Value |
|---|---|---|---|---|
| intercept | −2234.460 | 729.330 | −3.064 | 0.004 |
| F1 | 36.950 | 16.000 | 2.309 | 0.027 |
| F2 | 174.760 | 72.150 | 2.422 | 0.021 |
Table 9.
Test indicators of models LM13, LM23, and LM33 are better than the corresponding indicators of model LM43.
Table 9.
Test indicators of models LM13, LM23, and LM33 are better than the corresponding indicators of model LM43.
| Instrument | Model | Standard Error (kg/m−3) | Average Accuracy (%) |
|---|---|---|---|
| Proposed prototype | LM13 | 47.621 | 94.008 |
| LM23 | 47.603 | 94.069 | |
| LM33 | 47.541 | 94.433 | |
| Resistograph 650-SC | LM43 | 56.410 | 91.180 |
Table 10.
In linear regression model LM34, the p-value of F2 is 0.693, which indicates that F2 is not statistically significant at the 95% confidence level.
Table 10.
In linear regression model LM34, the p-value of F2 is 0.693, which indicates that F2 is not statistically significant at the 95% confidence level.
| Parameter | Estimate | Standard Error | t-Value | p-Value |
|---|---|---|---|---|
| intercept | 802.160 | 531.560 | 1.509 | 0.140 |
| F1 | 13.370 | 10.230 | 1.306 | 0.200 |
| F2 | −17.920 | 45.050 | −0.398 | 0.693 |
Table 11.
Test indicators of models LM14, LM24, and LM34 are worse than the corresponding indicators of model LM44, and the test indicators of models LM34 are worse than the corresponding indicators of model LM14.
Table 11.
Test indicators of models LM14, LM24, and LM34 are worse than the corresponding indicators of model LM44, and the test indicators of models LM34 are worse than the corresponding indicators of model LM14.
| Instrument | Model | Standard Error (kg/m−3) | Average Accuracy (%) |
|---|---|---|---|
| Proposed prototype | LM14 | 20.890 | 97.862 |
| LM24 | 23.679 | 97.593 | |
| LM34 | 20.978 | 97.822 | |
| Resistograph 650-SC | LM44 | 15.662 | 98.459 |
Disclaimer/Publisher’s Note: The statements, opinions and data contained in all publications are solely those of the individual author(s) and contributor(s) and not of MDPI and/or the editor(s). MDPI and/or the editor(s) disclaim responsibility for any injury to people or property resulting from any ideas, methods, instructions or products referred to in the content. |
© 2023 by the authors. Licensee MDPI, Basel, Switzerland. This article is an open access article distributed under the terms and conditions of the Creative Commons Attribution (CC BY) license (https://creativecommons.org/licenses/by/4.0/).
Share and Cite
MDPI and ACS Style
Yao, J.; Wu, Z.; Zheng, Y.; Rao, B.; Li, Z.; Hu, Y.; Nie, B. Design of a Tree Micro Drill Instrument to Improve the Accuracy of Wood Density Estimation. Forests 2023, 14, 2071. https://0-doi-org.brum.beds.ac.uk/10.3390/f14102071
AMA Style
Yao J, Wu Z, Zheng Y, Rao B, Li Z, Hu Y, Nie B. Design of a Tree Micro Drill Instrument to Improve the Accuracy of Wood Density Estimation. Forests. 2023; 14(10):2071. https://0-doi-org.brum.beds.ac.uk/10.3390/f14102071
Chicago/Turabian StyleYao, Jianfeng, Zhenyang Wu, Yili Zheng, Benqiang Rao, Zhuofan Li, Yunchao Hu, and Bolin Nie. 2023. "Design of a Tree Micro Drill Instrument to Improve the Accuracy of Wood Density Estimation" Forests 14, no. 10: 2071. https://0-doi-org.brum.beds.ac.uk/10.3390/f14102071
Note that from the first issue of 2016, this journal uses article numbers instead of page numbers. See further details here.