Article

Comparison of the Biomass and Dendrometric Parameters of Norway Spruce with Its Different Representations in Young Stands at Lower Altitudes in the Czech Republic

Department of Silviculture, Faculty of Forestry and Wood Technology, Mendel University in Brno, Zemědělská 3, 613 00 Brno, Czech Republic
*
Author to whom correspondence should be addressed.
Submission received: 22 December 2022 / Revised: 14 January 2023 / Accepted: 16 January 2023 / Published: 18 January 2023
(This article belongs to the Special Issue Effects of Environmental Changes on Forest Growth and Stability)

Abstract

:
In forestry, it is still common to plant the seedlings of and cultivate Norway spruce (Picea abies L. Karst) at lower altitudes; however, the climatic change that has been occurring increases evaporative demands in these areas. As a result, the spruce evidently suffers from drought, withers and loses its power to grow, thus, influencing stem thickness and tree-height growth, as well as biomass production. Therefore, the growth and biomass production of young (5-, 15- and 25-year-old) Norway spruce stands at these altitudes (i.e., from 200 to 500 m a.s.l.) was surveyed, as a case study, across the Training Forest Enterprise “Masaryk Forest” Křtiny. There, 48 stands with a varied representation of spruce (i.e., up to 30%, 31%–60%, 61%–90% and over 91%) were analyzed. In each stand, 12 trees were sampled across all social status classes (i.e., sub-dominant, co-dominant and dominant) in detail. Basic dendrometric parameters (such as the total tree height, height of the crown base and stem diameter at breast height) and the amount of the above-ground tree organ biomass (i.e., stem, branches and needles) were investigated. Based on the trends found in the biomass production here and climate change predictions, we recommend that Norway spruce be cultivated only in zones from an altitude of ca 400 m a.s.l., with an annual precipitation of 700 mm and an average annual temperature of 7 °C, and its percentage representation in the stand be no more than 30%.

1. Introduction

Norway spruce (Picea abies L. Karst) belongs to the most common species in European forests [1]. It has quite a broad ecological valence and production ability, but it grows and regenerates best and is less predisposed to abiotic and biotic malfunctions when growing in areas close to its optimal ecological conditions, represented by cold and wet climate, i.e., with rather lower air temperatures and a higher amount of precipitation, as well as air humidity [2]. Nebe [3] and Schmidt-Vogt [4] describe optimal precipitation as being varied from 490 to 580 mm during the vegetation period for spruce in Central Europe with a continental climate. For the optimal growth of spruce, the annual average temperature should be around 6 °C [3]. Therefore, through interspecific competition, spruce found its optimum conditions for growth in upper sub-mountain, mountain and supra-mountain zones with a sufficient amount of precipitation. Together, they make up the 8th Forest Vegetation Zone (FVZ) in the Czech Republic (CZ) [5]. Quitt [6] describes the 8th FVZ as having an annual average temperature of around 3.5 °C, a precipitation in the vegetation period between 600 and 700 mm and an annual amount of precipitation between 1000 and 1200 mm. According to Plíva [7], spruce has an ecological optimum from the 5th FVZ or, to be precise, from an altitude of 550 to 900 m a.s.l., where the annual amount of precipitation reaches 700 mm, which is about 350 to 400 mm in the vegetation period [8]. During the last two centuries, spruce has been planted out of its ecological optimum into the 2nd and 3rd FVZ (i.e., where the altitude varies from 200 to 400 m a.s.l.) [4,9] or even lower—into the 1st FVZ [10]. There, annual average temperatures vary within a range of 6.5–8.5 °C and the total annual precipitation does not exceed 700 mm [7].
Nowadays, the percentage representation of spruce at lower altitudes (i.e., from the 2nd to the 4th FVZ, up to approx. 500 m a.s.l.) must be considered in connection with the current and predicted climatic changes, especially in the context of a more frequent occurrence of prolonged drought during the vegetation period. These changes might lead to a higher spruce mortality and to a lower spruce volume and biomass production in areas where its natural conditions are on the edge of its ecological optimum [11], especially from the point of view of water sufficiency. However, elevated CO2 concentration in the atmosphere leads to higher stomatal closure and an enhanced root-to-shoot ratio [12]; thus, increasing chances of survival during periods of drought, these should not be as intensive and long lasting as they were predicted to be and have been present since 2015 in Europe [13]. The lack of water and the increasing temperatures cause greater sensitivity of the spruce stands to the biotic and abiotic disturbances, such as tree insects (frequently: Ips typographus Linnaeus, Ips duplicatus C.R. Sahlberg), fungal diseases (Armillaria ostoyae (Romagnesi, Herink) and wind storms [14]. The hypothesis of permanent spruce production in mixed stands is based on the theory of ecological niche, which suggests, among other things, that the stratification of foliage and tree roots in mixed stands has a different distribution in time and space to that in monoculture stands [15,16,17]. The diversity in the distribution of the above-ground and below-ground organs makes the competition for light, nutrients and water among individual trees in the area less tough [18,19]. The interspecies interactions in mixed stands can reduce the effect of soil moisture deficit. Rothe and Binkley [20] describe that the spruce roots occupy a shallow depth of soil and, therefore, for example, the beech roots grow deeper in the beech–spruce stands than in beech monocultures. The deeper growing root system of beech can support the shallow growing root system of spruce by a hydraulic lift, which provides a supply of water, especially during the summer [21]. As beech crowns have lower leaf area density compared to that of spruce, they increase precipitation through fall. Moreover, beech crown architecture with soft bark works like a funnel that significantly increases stem flow. In the case of birch, its root system can help by watering the shallow rooting system of spruce directly via birch–spruce root grafting [22]. Therefore, many authors, such as Hartig [23], Cotta [24] or, currently, Edgar and Burk [25], MacPherson et al. [26], Pretzsch et al. [27], Vilà et al. [28] and Grossman et al. [29], document that there is a higher production inside mixed stands than in monoculture stands.
This study, therefore, focuses on the growth and biomass production of Norway spruce at lower altitudes with its different percentage representation in young stands at the Training Forest Enterprise “Masaryk Forest” Křtiny (TFE). The aim is to assess whether it is suitable to grow Norway spruce in the lower FVZs and, if yes, then what percentage representation of the stand it should occupy.

2. Materials and Methods

2.1. Location of the Study

The stands that were chosen for this research are situated at TFE (49°17′48.9″N; 16°44′30.2″E). Here, the annual average temperature is 7.5 °C and precipitation is 610 mm [30]. According to Köppen [31], TFE is located in the warm summer subtype (also Hemiboreal climate) of Humid continental climate. The soil in these stands is cambisol. These stands were established through artificial regeneration from seeds that, by law, were taken from the Bohemian-Moravian Highlands and areas more easterly (namely: Drahanská vrchovina, Českomoravské mezihoří, Předhoří Českomoravské vrchoviny and Českomoravská vrchovina). The stands consisted of Norway spruce and European beech (i.e., the target tree species), linden, hornbeam, oak, maple and fir (i.e., associated species whose sum was no more than 10%).

2.2. Selection of Stands

Stands were selected according to:
  • The age of the stand: 5, 15 or 25 years;
  • The FVZ location: the 2nd, 3rd or 4th FVZ (Table 1);
  • The percentage representation (admix class): up to 30%, 31%–60%, 61%–90% or over 91%, where each stand had to remain in the same class the entire time.
Combining these three criteria, we determined a total of 48 stands. The five-year-old and twenty-five-year-old stands had only one repetition and the fifteen-year-old stands had two repetitions. We, therefore, measured twelve 5-year-old, twelve 25-year-old and twenty-four 15-year-old stands.

2.3. Selection of Trees

The stem diameter at breast height (DBH) of all spruce trees in each stand was measured first. Based on DBH class-distribution histograms, 12 representative trees were chosen from each stand, where there were four trees in each of the following social classes: sub-dominant, co-dominant and dominant layer.

2.4. Measurements

We measured the DBH on all representative trees, slowly felled and carefully laid them so as not to damage the branches. We then measured their total heights (Hs) and the heights of the crown bases (CHs). The branches of the tree crown were cut and inserted into marked paper bags. The stem was cut into ca one-meter-long logs and each log was marked. Next, all the parts of the tree (i.e., the branches and the stems) were dried inside a dryer at a temperature of 105 °C until they reached a constant weight (after approximately 48 h). The needles were removed and each part (i.e., the stem, branch and its needles) was weighed separately, whereby we determined the stem biomass (SB), branch biomass (BB), needle biomass (NB) and the sum of these weights gave us the total above-ground biomass (TAGB) of each tree. The allometric relationships were calculated from the TAGB, SB, BB and NB results for each stand, where the variable in the allometric relationship was DBH. Then, we estimated all biomass components for each tree in the stand according to the DBH, which was measured at the outset of the experiment. Finally, we made a mutual comparison of the averages of all these values.

2.5. Data Analysis

Raw data were processed in Microsoft Excel (Redmond, WA, USA). Statistical data were processed in TIBCO Statistica™ (Tulsa, OK, USA) with a reliability interval of 95%. The Shapiro–Wilk test was employed to find out the data dispersion normality and homogeneity. The main effects (FVZ and admix class) and their interactions were processed with the help of the ANOVA test. The Fisher LSD test was used following the ANOVA analysis to identify the differences between the main effects and their interactions.

3. Results

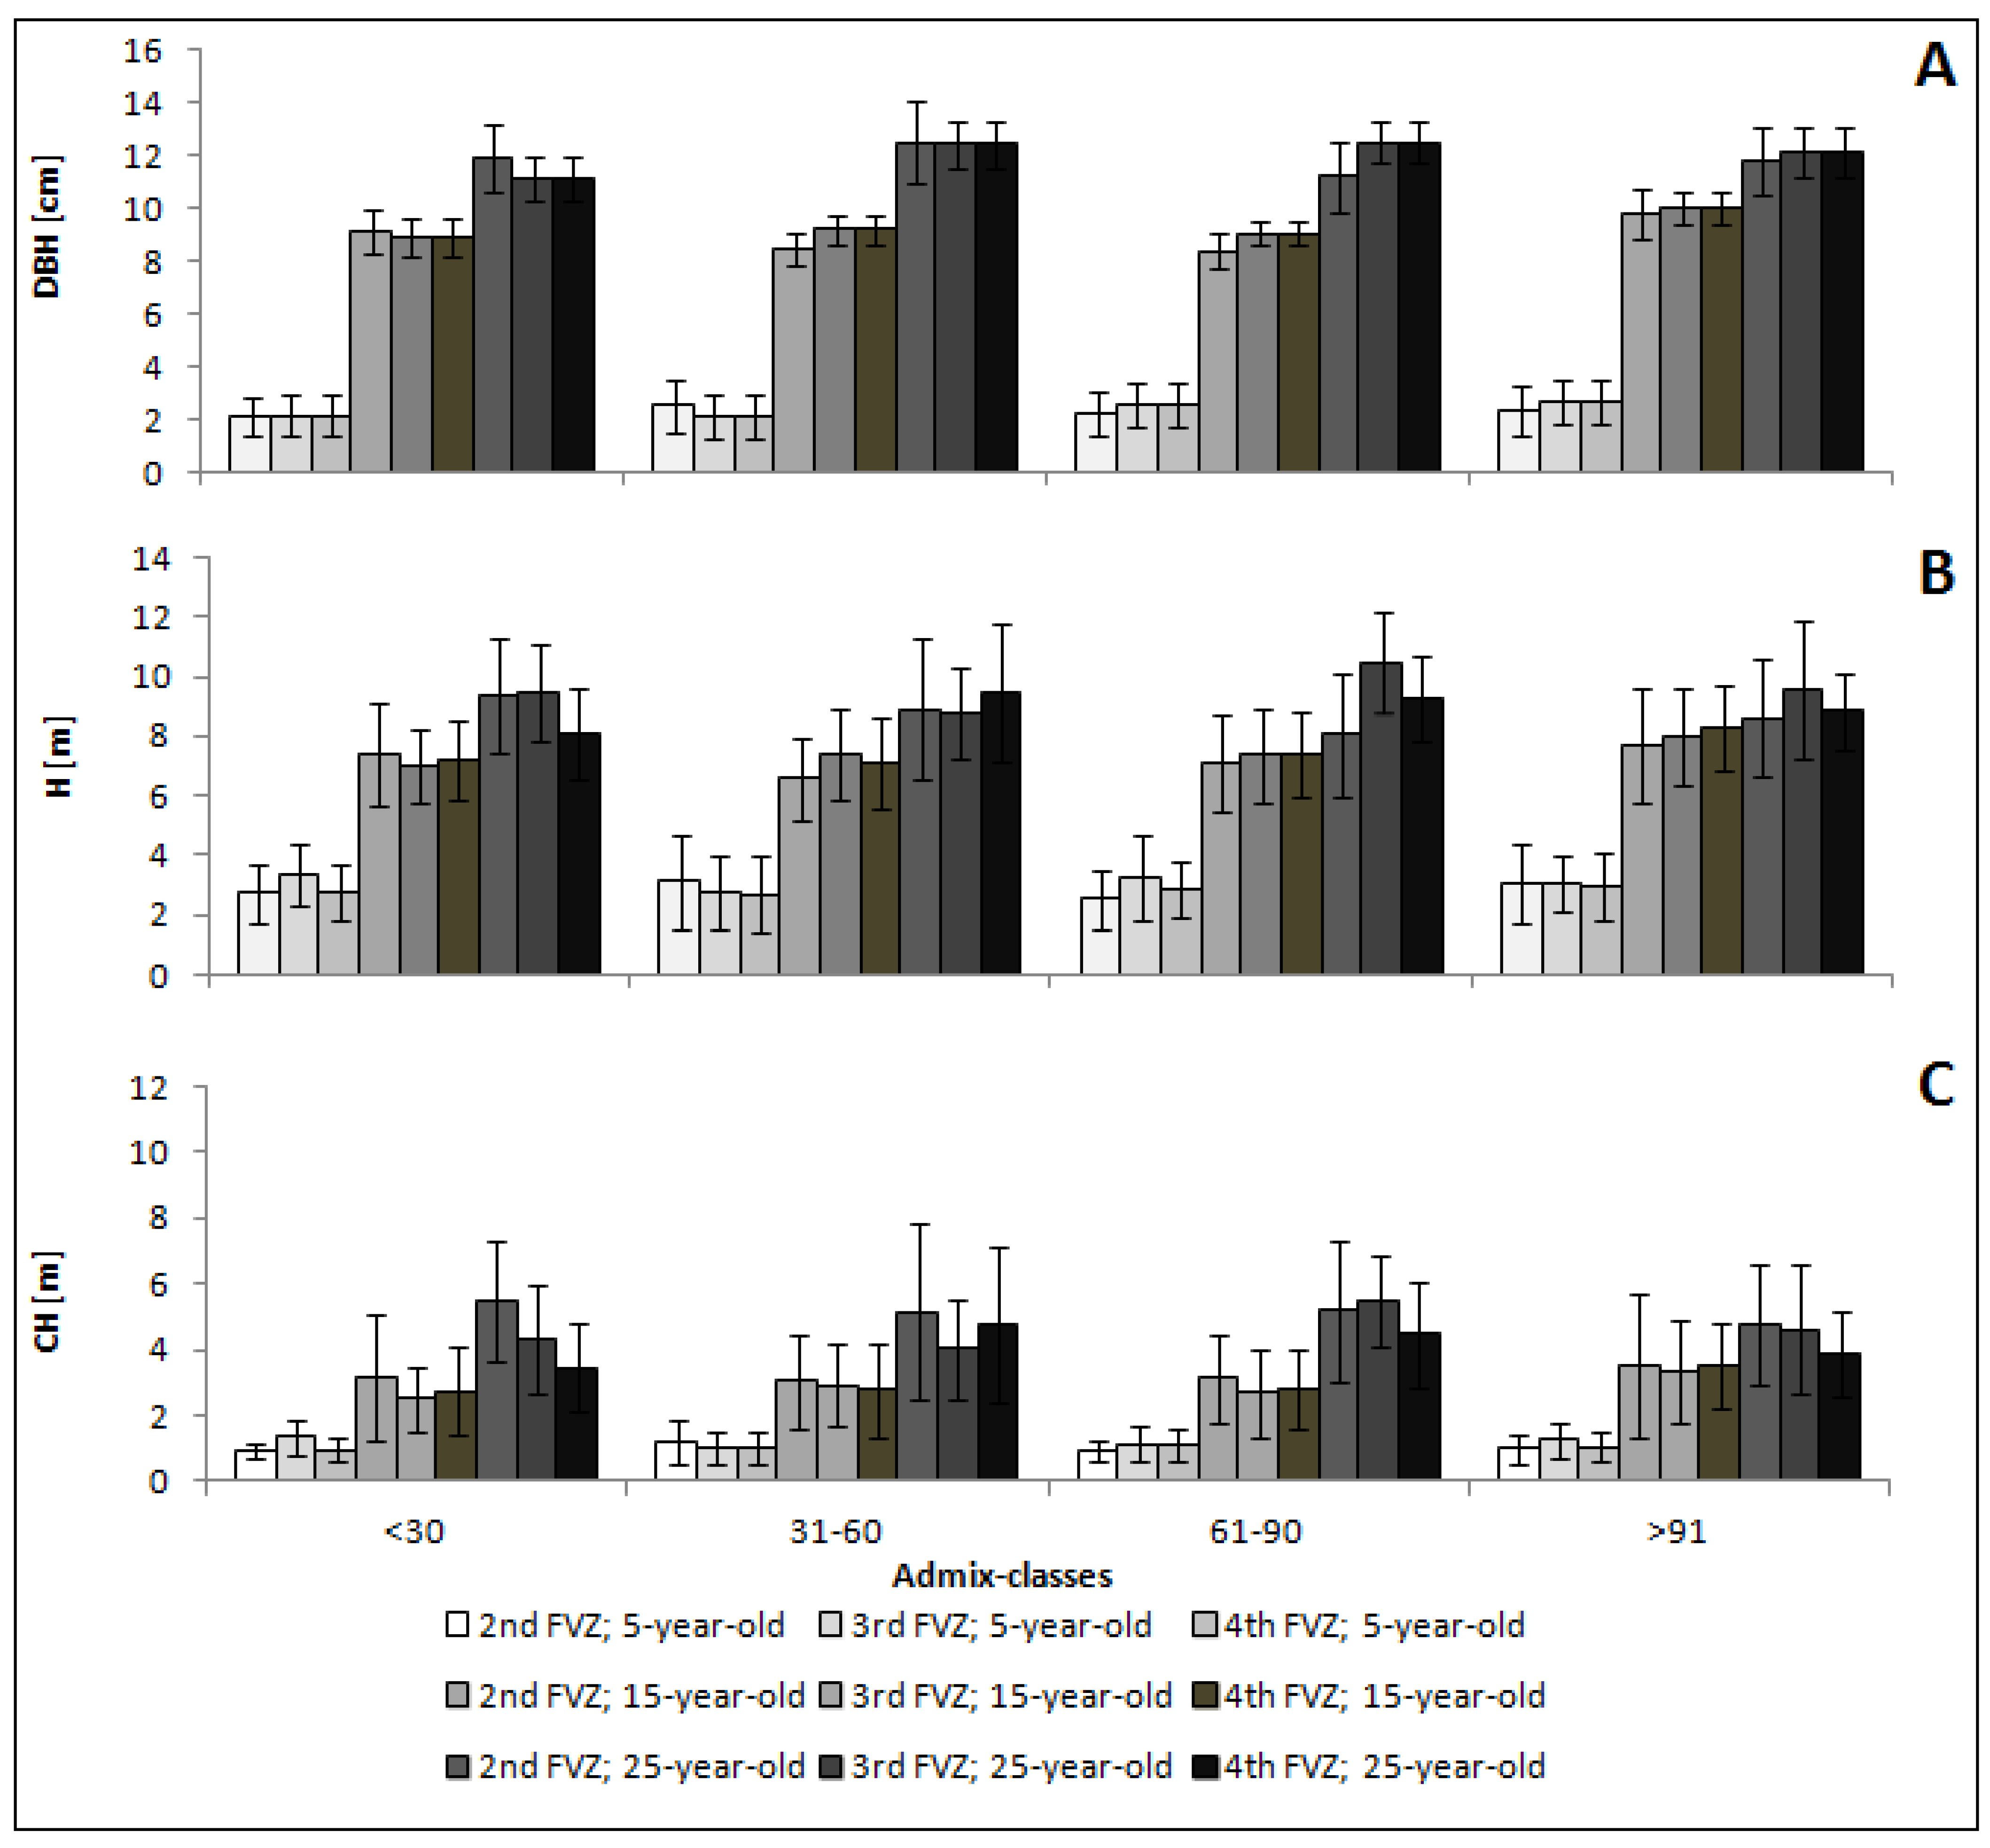
3.1. Basic Dendrometric Parameters

From the collected data, it is not possible to see a clear trend across all the dendrometric parameters. There were insignificant differences in the DBH across all the FVZs and admix classes; the DBH differences were no greater than approx. 1.5 cm (Figure 1). No statistically significant differences were found in the tree heights and the heights of the crown base among the admix classes (Figure 1).

3.2. Biomass

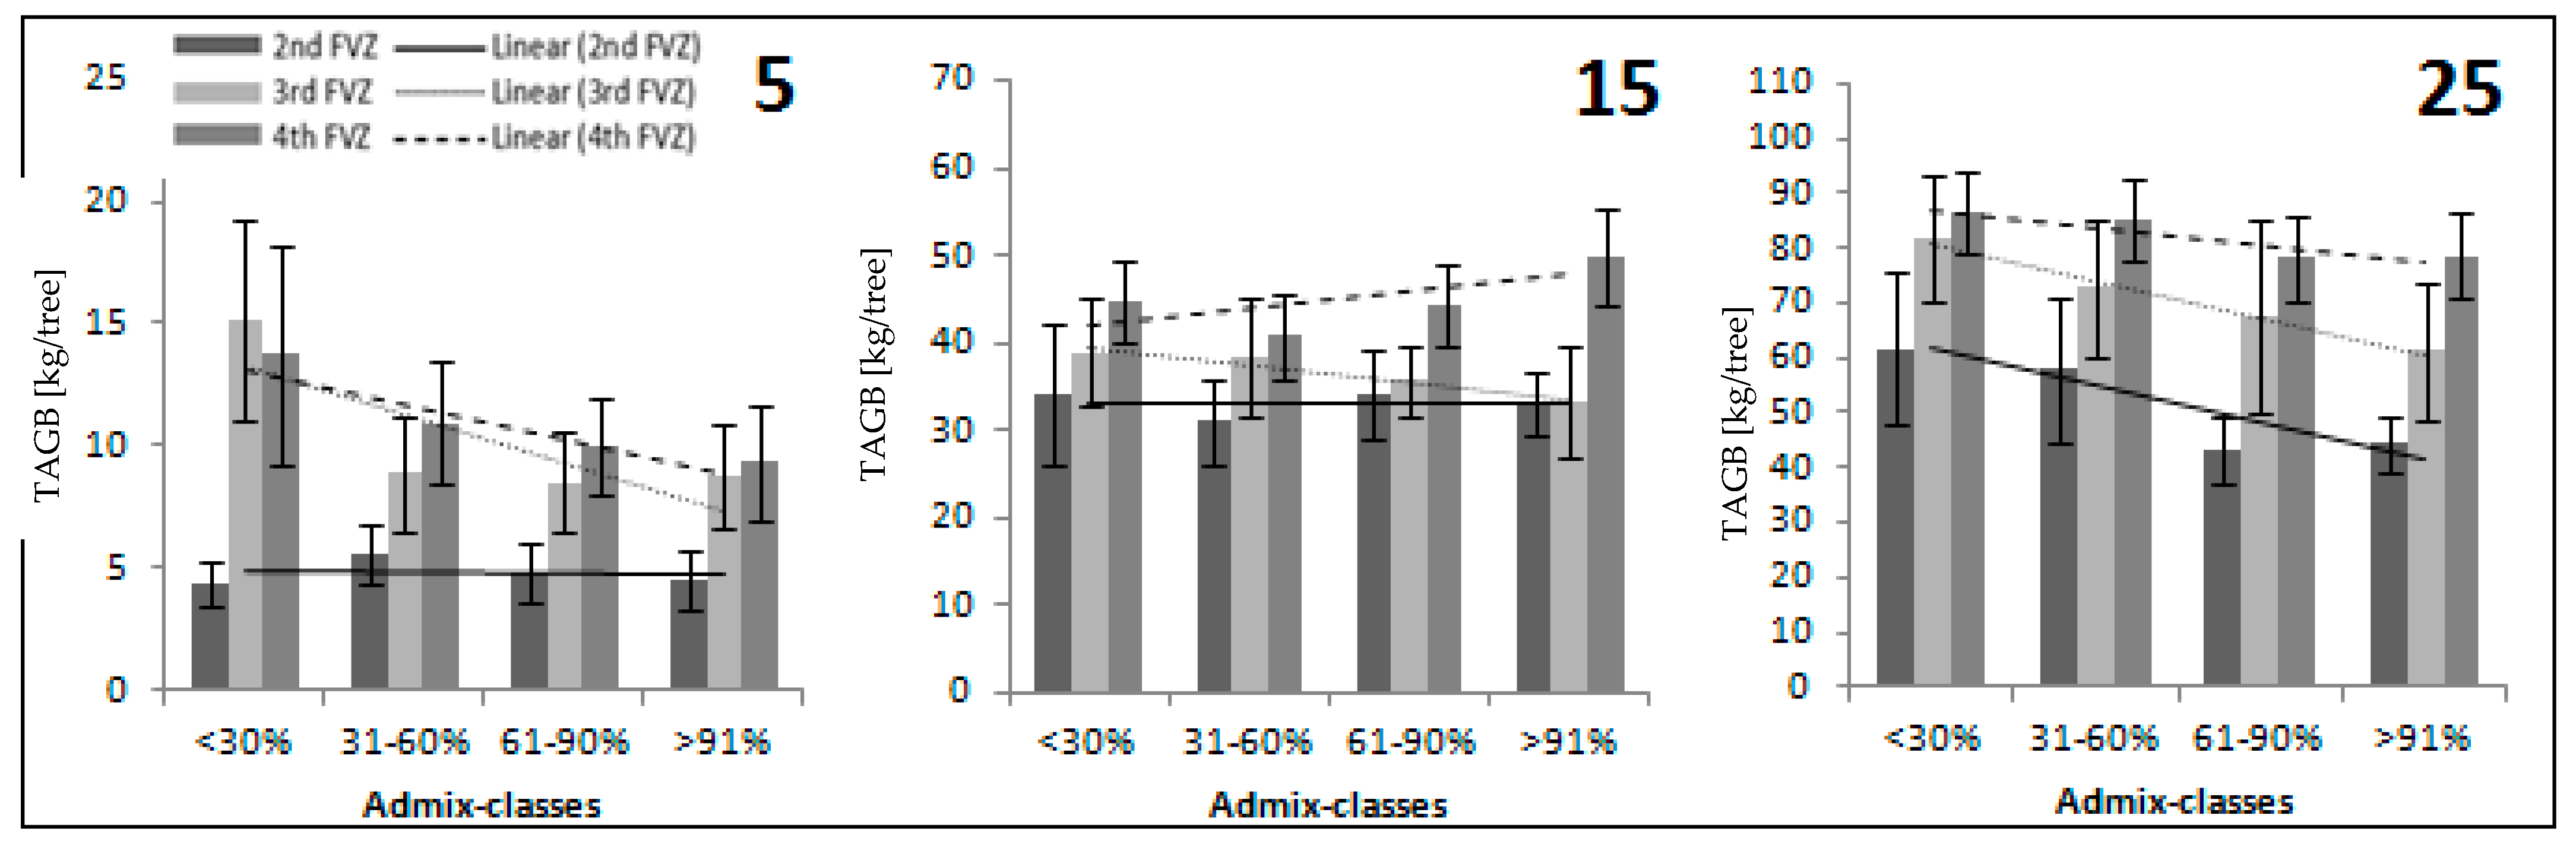
3.2.1. Total Above-Ground Biomass
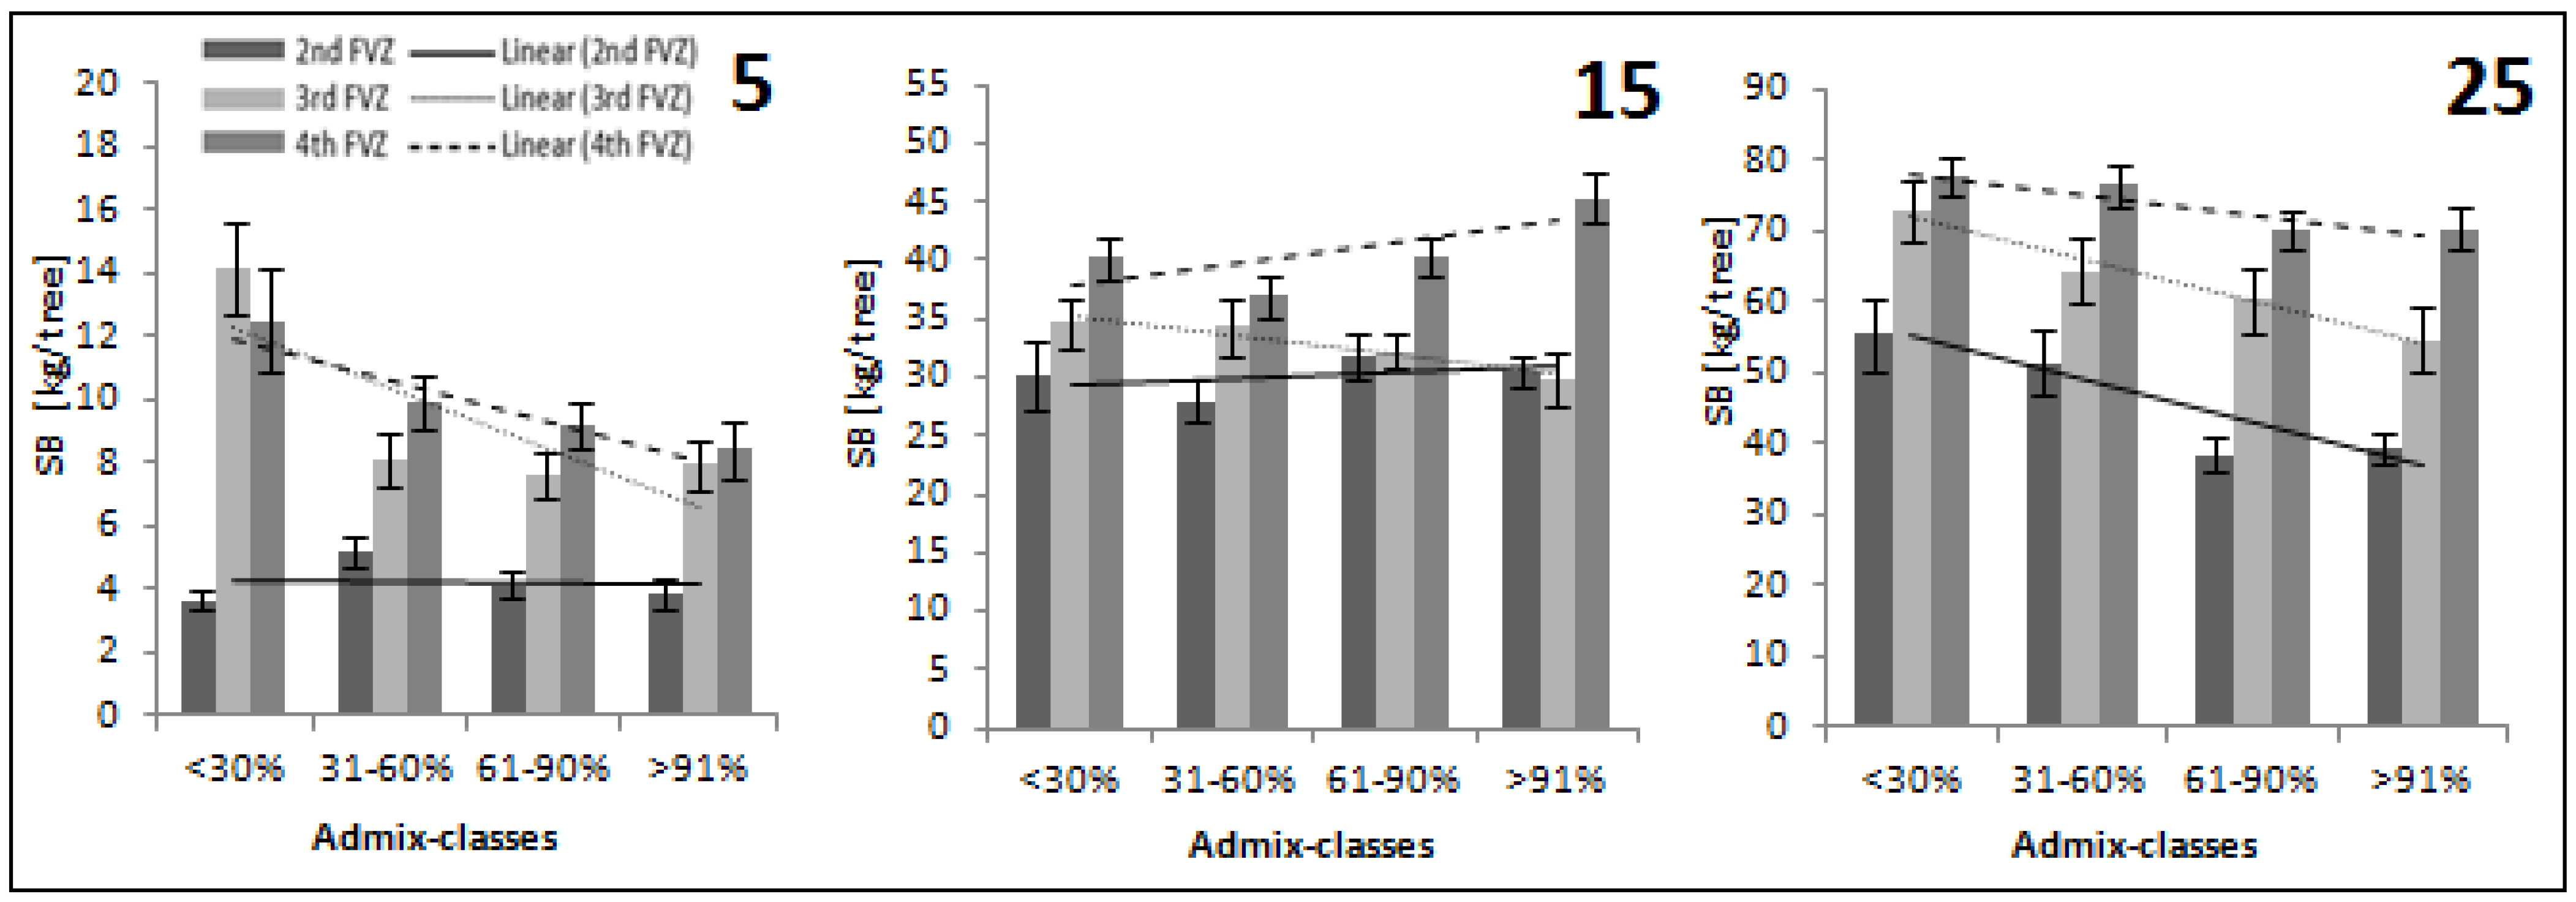
The TAGB of spruce showed statistically significant differences mainly between the 2nd FVZ and the 4th FVZ (Figure 2; Table 2 and Table A1). In the 15-year-old stands, there was a difference only between the admix class with over 61% of spruce in the stand among all FVZs, where the amount of the total above-ground biomass was greater in the 4th FVZ than in the other FVZs. In the 5-year-old and the 25-year-old stands, the differences in biomass were obvious between the 2nd and 4th FVZ in all admix classes and there was always significantly less biomass in the 2nd FVZ.

3.2.2. Stem Biomass

In the 5-year-old stands, the amount of SB was different in all the admix classes between the 2nd FVZ and the other FVZs (Figure 3; Table 2 and Table A2), where there was always the least amount of biomass in the 2nd FVZ. Further, there were differences between the up-to-30% and the other admix classes within the 3rd FVZ and between the up-to-30% and the over-61% admix classes in the 4th FVZ. In these last two FVZs, there was more stem biomass in the up-to-30% admix class than in the others.
In the 15-year-old stands, the amount of SB was greater in the 4th FVZ than in the other FVZs in most admix classes (Figure 3; Table 2 and Table A2).
In the 25-year-old stands, the differences between the 4th FVZ and the other FZVs (Figure 3; Table 2 and Table A2) were obvious, as in the 15-year-old stands. Moreover, there were significant differences between the 2nd and 3rd FVZ across all admix classes, where the amount of biomass was always greater in the 3rd FVZ.

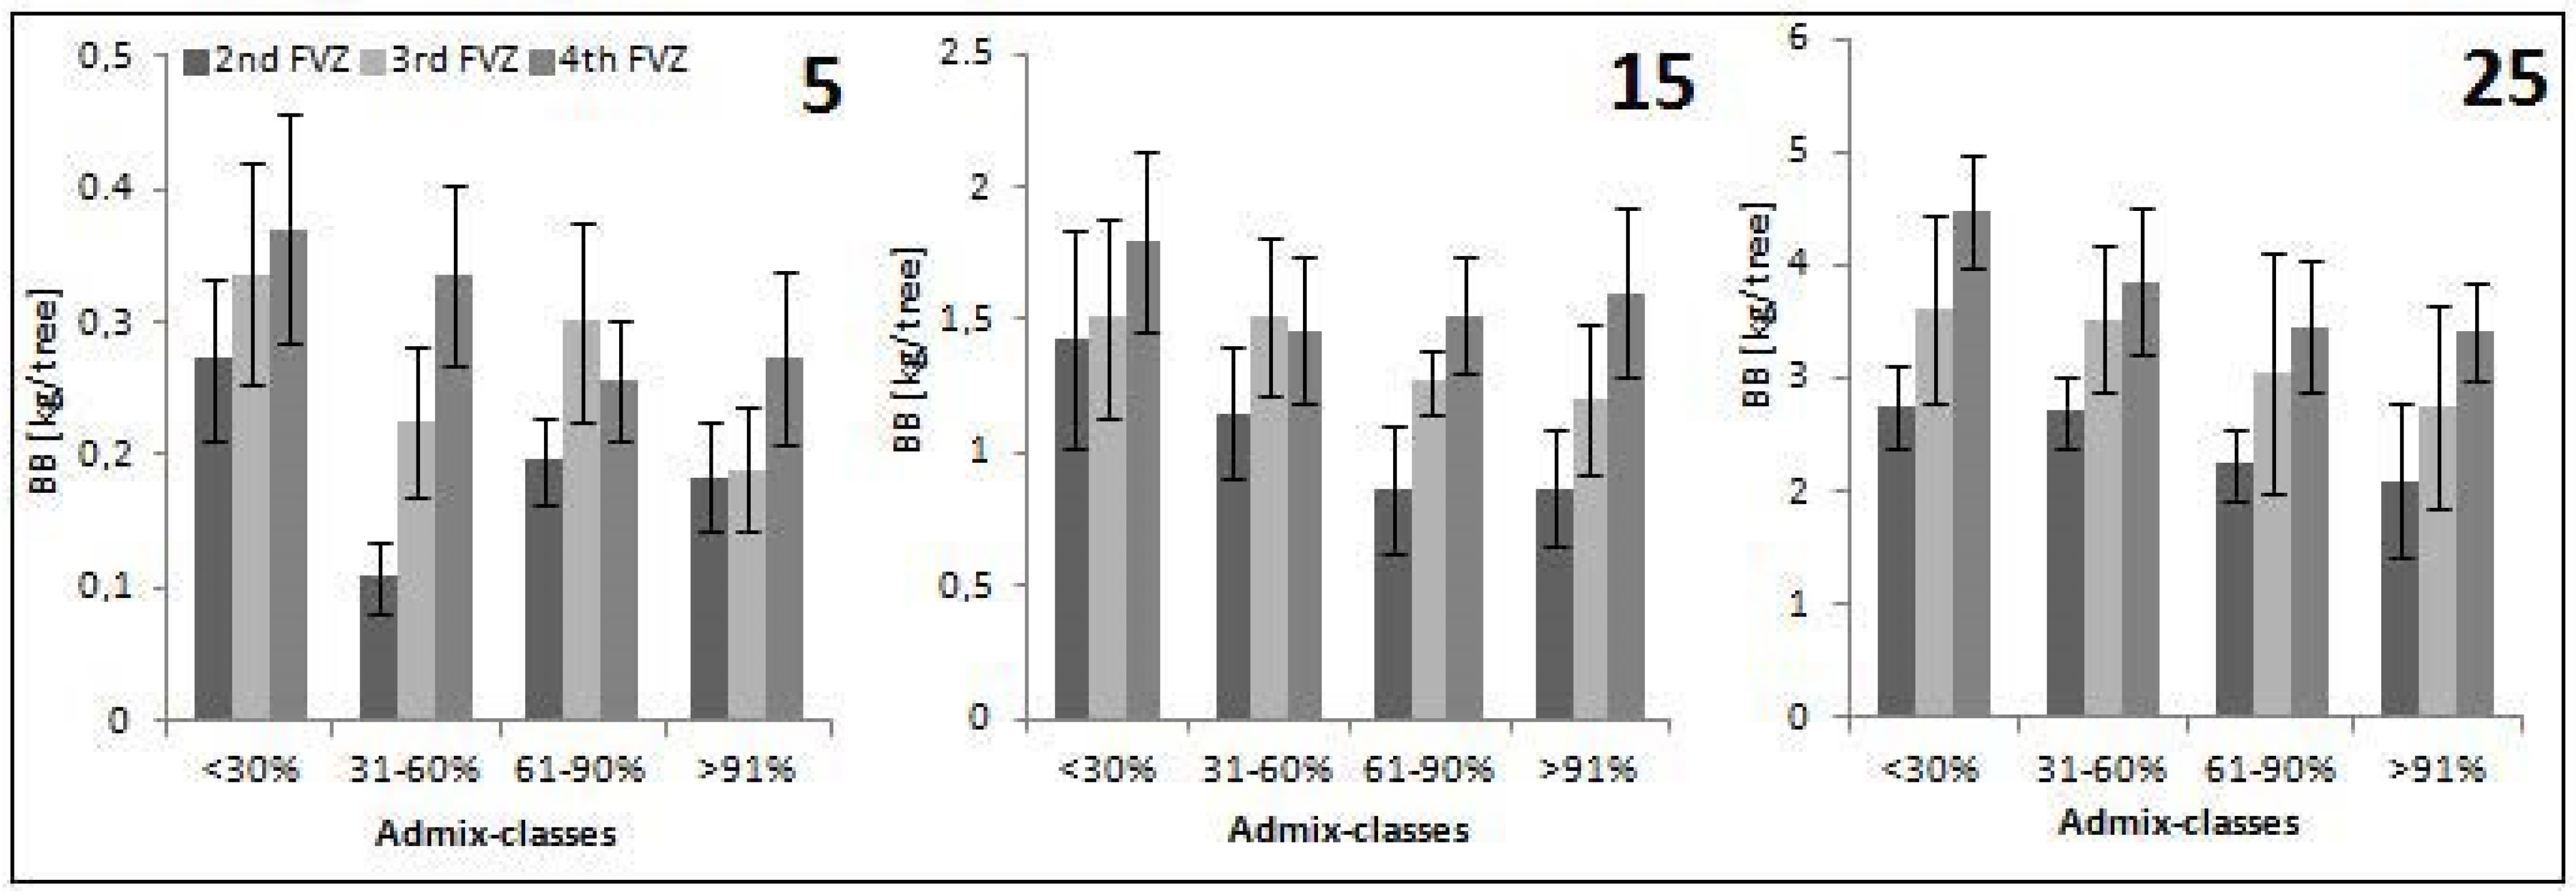
3.2.3. Branch Biomass

In the 5-year-old stands (Figure 4; Table A3), the crucial statistically significant differences in the amount of BB were found in the up-to-30% admix class, where there was the greatest amount of biomass in the 2nd FVZ. In the 15-year-old stands (Figure 4; Table A3), the differences were significant in the admix classes that were over 61% between the 2nd and 4th FVZ, where the higher amount of biomass was in the 4th FVZ. In the 25-year-old stands (Figure 4; Table A3), significantly less BB was found in the 2nd FVZ, compared to the 4th FVZ, across all admix classes.

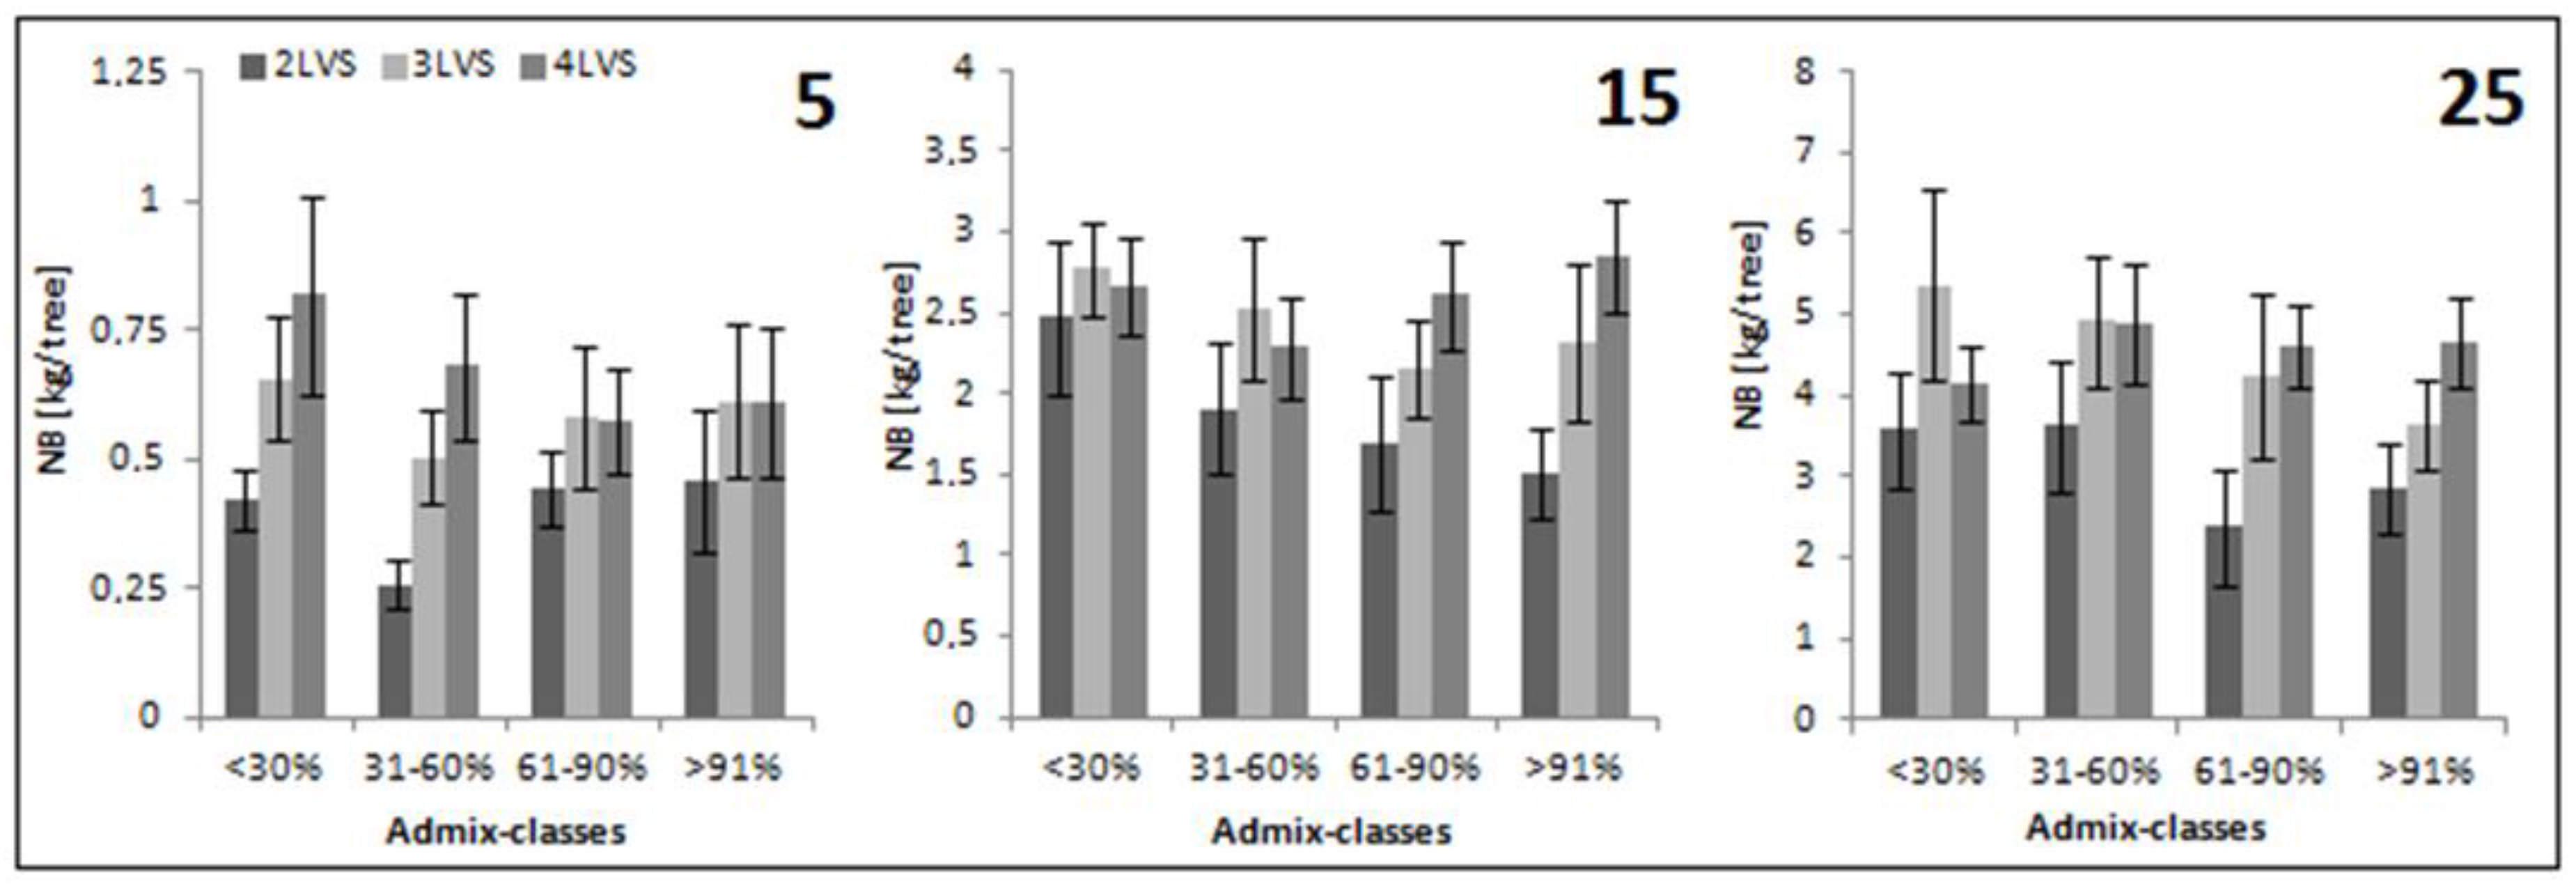
3.2.4. Needle Biomass

In the 5-year-old stands, there was a statistically significantly lower amount of NB in the up-to-60% admix classes in the 2nd FVZ than in the other FVZs (Figure 5; Table A4). In the 15-year-old (Figure 5; Table A4) and the 25-year-old (Figure 5; Table A4) stands, there was significantly less biomass in the over-61% admix classes in the 2nd FVZ, compared to the 4th FVZ.

4. Discussion

In mixed stands, the interactions among trees and tree species may cause mutual competition or support [27]; moreover, it is very hard to distinguish between the competition among individual trees and species [33]. This work endeavors to determine the basic dendrometric parameters as well as the above-ground biomass of different plant organs in young stands at lower altitudes.
In the case of artificial regeneration, plants often suffer a planting or re-planting shock, which leads to growth stagnation [34,35,36,37]. Lamhamedi et al. [38] and Spinnler et al. [39] conclude that this shock usually lasts for one to two vegetation periods. Goisser et al. [40] propose that, during the first few years after planting, the trees are not suitable for the study of the growth of the above-ground part because misleading results may be encountered. Physiological functions, such as transpiration and photosynthesis, are also negatively affected after the tree has been planted [34,35]. Moreover, slight deformation in the root systems during manipulation and their insufficient contact with the soil after planting may limit water and nutrition intake [35,36,37]. All these factors may reduce the assimilatory tissue surface area, as well as the supply of carbon [41], which may result in slower growth, stagnation or even death of the plant. Moreover, it seems that assimilates are reallocated to the below-ground part for recovery of the root system, preferably after planting.
This is the reason why the youngest stands that were investigated were five years old. It was assumed that there would not be a noticeable effect caused by the above-mentioned shock and differences in the dendrometric parameters and biomass. This was confirmed, as there was no statistically significant difference in the tree height, the height of the crown base and the DBH. However, this could also have been the result of the need of the plants to adjust to the new growth conditions in the habitats and/or the reaction time of each plant to the replanting, which leads to high variability in the data that were obtained.
The total above-ground biomass differed mainly between the 2nd FVZ and the other FVZs, disregarding the percentage representation of spruce (i.e., admix class) in the stand and the age of the stand. Slodičák and Novák [42] recommend that the first interventions be carried out when a spruce stand reaches a height ranging from 2 to 5 m. Therefore, the 15-year-old stands, with an average height of 8 m, have undergone their first thinning intervention. These stands are, therefore, much more homogenized in structure, compared to the 5- and 25-year-old stands, where the most noticeable differences were found. According to Nebe [3] and Schmidt-Vogt [4], increasing air temperature stimulates spruce growth (especially late wood production), which can result in a greater amount of spruce biomass in lower FVZs. However, Koch [43] states that growth and the increment in biomass also depend on the amount of precipitation, which can be limited, especially at lower altitudes (FVZs). However, Quitt [6] claims that the amount of precipitation is almost similar within all FVZs in the vegetation period, though the amount of annual precipitation is about 100 to 150 mm less in the 2nd FVZ, compared to the 4th FVZ, and around 100 mm less compared to the 3rd FVZ [32]. It is possible to say that there is a greater accumulation of water in the soil in winter at higher altitudes. At the beginning of the vegetation period, the plants growing in higher FVZs use the accumulated water in the soil after the thaw, which helps them to grow faster than those in lower FVZs, especially in spring (early wood production is stimulated). The differences in the growth of spruce, due to sufficient and insufficient water, are also described by Modrzyński and Eriksson [44], who state that sufficient water supports the growth of spruce. Tesař and Souček [8] conclude that, for good growth, spruce needs at least 700 mm of precipitation annually.
The stem contains the largest proportion of the above-ground biomass, and this proportion increases rapidly with tree age. The stem biomass decreases with an increasing percentage admixture of spruce in the stand and, also, with decreasing altitudes of FVZ.
The needle biomass was also significantly different—only between the 2nd FVZ and the others in the stands with admix classes up to 60% in the 5-year-old stands and in stands with admix classes over 61% in the 15-year-old and the 25-year-old stands. The amount of the needle biomass corresponds to its health status [45]; therefore, the lesser the biomass in the assimilation apparatus, the poorer the health of the tree and the lower the potential production.
In the 15-year-old stands, the amount of the needle and branch biomass differed only between the 2nd and 4th FVZs in the stands where there was more than 61% of spruce. The sporadic differences (in the biomass and in the dendrometric parameters) could have been influenced by thinning interventions in previous years. This is indicated by the standard deviations in the stem thicknesses and the tree heights in all FVZs and admix classes, which are smaller than those in the 5-year-old stands. The very heavy thinning interventions are carried out when there is mutual overlapping of the crowns in the stand [42]. During these interventions, the wrong-shaped trees and declining and overtopped trees that grow to small dimensions are removed [46]. It can, therefore, be concluded that the thinning interventions moved the stem thickness and tree-height structure of the stands towards their higher homogeneity. After the thinning intervention, the crowns of the trees are temporarily released and the trees gain greater access to light. In addition, the trees that remain will receive more water and nutrients because the removal of the trees will reduce competition in the root zone. The growth or biomass production is invested firstly into the crown (i.e., the leaves and then branches), then into the root system and then into the thickness and height of the stem or its volume [47,48].
The structure of the 25-year-old stands was more differentiated among FVZs and admixture proportions of spruce in the stands than those in younger stands. There were more obvious trends in the branch, stem and total above-ground biomass. On the other hand, the stem thicknesses, heights of crown bases and tree heights increased unsteadily without statistically significant differences. With the increasing age of the stand, the following trends were more visible:
  • The higher the percentage of spruce representation in the stand, the less total above-ground biomass there was;
  • The higher the FVZ (i.e., the altitude of the stand) in which the stand was located, the less total above-ground biomass there was.
For this reason, the differences between the 2nd and 4th FVZ in the total above-ground biomass were significant, especially in the stands with spruce representation over 61%. In the stem and branch biomass, the differences between the 2nd and 4th FVZ were evident across all admix classes. In the 2nd FVZ, the higher air temperatures, together with the lower precipitations, can cause drying in the uppermost layer of soil, which can result in the death of fine roots [49] and a consequent reduction in the uptake of water and nutrients by the plants [50,51]. The amount of precipitation during the vegetation period in the 4th FVZ is similar to that in the 2nd [6], but there is more precipitation during autumn and winter [32]. As a result, structural carbohydrate reserves in trees, which are necessary for the initial phase of the formation of annual rings, are consumed less in the 4th than in the 2nd FVZ [52,53]. Mixed stands with Norway spruce take up more of the above- and below-ground space [17], which helps spruce to use supplementary resources, such as water and nutrients, from deeper soil layers [27,54] through hydraulic lift [55]. We can say that the higher the percentage of spruce in the stand, the greater its inter-specific competition [17], which decreases the availability of nutrients and water for each plant. This may be due to the fact that the roots occupy the same layer of soil, which reduces their ability to grow and allocate carbon to the total above-ground biomass and biomass of the individual parts.

5. Conclusions

Our case study that focused on the dendrometric parameters and biomass production of spruce growing in young stands at lower altitudes with different percentage representations shows that:
  • Although the differences in dendrometric parameters, such as the DBH, total height and height of crown base, were not statistically insignificant and negligible in the 5-, 15- and 25-year-old stands, the greatest (and also statistically significant) differences appeared in the total above-ground and stem biomass.
  • In all FVZs, the greater the percentage representation of spruce in the stand, the less biomass the mean spruce had, regardless of stand age.
  • The mean spruce tree had less biomass in all measured components in the 2nd FVZ than that in the other FVZs, regardless of the percentage representation of spruce in the stand.
  • There was less biomass in all components of spruce growing in the 3rd FVZ than of that growing in the 4th FVZ, whereas with increasing percentage representation of spruce, the differences in the amount of the biomass increased.
On the basis of the trends found in biomass production in the presented case study at the Training Forest Enterprise “Masaryk Forest” Křtiny, and climate change, which influences the potential growing conditions of tree species for the near future [56], we recommend that Norway spruce should be cultivated only in the 4th FVZ (ca from an altitude of 400 m a.s.l. with an annual precipitation of 700 mm and an average annual temperature of 7 °C) and its percentage representation in the stand should be no more than 30%.

Author Contributions

K.N.—main idea, methodology, work coordination, measurement, software, validation, formal analysis, writing—original draft preparation, writing—revision, writing—editing, project administration, funding acquisition. J.K.—methodology, measurement, writing—original draft preparation, writing—revision, writing—editing. M.K.—writing—revision, writing—editing. R.P.—modification of methodology, supervision, funding acquisition. All authors have read and agreed to the published version of the manuscript.

Funding

This work was funded by H2020-EU.4.b. WIDESPREAD-05-2020—Twinning; Grant agreement ID 952314 “Adaption strategies in forestry under global climate change impact (ASFORCLIC)”, by the Internal Grant Agency (IGA) of the Faculty of Forestry and Wood Technology, Mendel University in Brno (project no. LDF_VP_2016045 “Comparison of diameter increment, biomass and surface of foliage, branch, stem in young mixed stands with different proportions of Norway spruce in lower forest vegetation zones”) and by the Internal Grant Agency (IGA) of the Faculty of Forestry and Wood Technology, Mendel University in Brno (project no. LDF_VP_2021010 “The effect of the size of the inventory area on the accuracy of the evaluation of the forest structure in the conversion to the structural rich forests in the conditions of TFE Masaryk’s Forest Křtiny”).

Data Availability Statement

The data are available upon request from [email protected].

Acknowledgments

The authors thank P. Skočdopolová and J. Hobl for English language revision.

Conflicts of Interest

The authors declare no conflict of interest.

Index of Notations and Abbreviations

admix classpercentage representation of spruce
BBbranch biomass
CHheights of the crown bases
CZCzech Republic
DBHstem diameter at breast height
FVZforest vegetation zone
Htotal height
NBneedle biomass
SBstem biomass
TAGBtotal above-ground biomass
TFETraining Forest Enterprise “Masaryk Forest” Křtiny

Appendix A

Table A1. Percentage differences and statistically significant values among the total above-ground biomass (TAGB) of 5-year-old, 15-year-old and 25-year-old stands. The percentages indicate how much less biomass the spruce growing in the FVZ with the admix class named in the row has, compared to that of spruce growing in the FVZ with the admix class named in the column (e.g., in 5-year-old stands, the amount of the TAGB of spruce growing in 2nd FVZ and with up to 30% of spruce in stand was 71% lower than of spruce growing in 3rd FVZ and with up to 30% in stand). The stars are intended to flag levels of significance. If a p-value is less than 0.05 and greater than 0.01, it is flagged with one star (*); if a p-value is less than 0.01 and greater than 0.001, it is flagged with two stars (**); if a p-value is less than 0.001, it is flagged with three stars (***).
5-Year-Old Stands
FVZ3rd FVZ4th FVZ4th FVZ4th FVZ4th FVZ
FVZAdmix classUp to 30%Up to 30%31%–60%61%–90%Over 91%
2nd FVZUp to 30%71% ***68% ***
2nd FVZ31%–60% 49% ***
2nd FVZ61%–90% 52% ***
2nd FVZOver 91% 51% ***
15-year-old stands
FVZ4th FVZ
FVZAdmix classOver 91%
2nd FVZOver 91%34% **
3rd FVZOver 91%33% **
25-year-old stands
FVZ4th FVZ4th FVZ4th FVZ4th FVZ
FVZAdmix classUp to 30%31%–60%61%–90%Over 91%
2nd FVZUp to 30%29% *
2nd FVZ31%–60% 32% **
2nd FVZ61%–90% 45% **
2nd FVZOver 91% 44% ***
Table A2. Percentage differences and statistically significant values among the stem biomass (SB) of 5-year-old, 15-year-old and 25-year-old stands. The percentages indicate how much less biomass the spruce growing in the FVZ with the admix class named in the row has, compared to that of spruce growing in the FVZ with the admix class named in the column (e.g., in 5-year-old stands, the amount of the SB of spruce growing in 2nd FVZ and with up to 30% of spruce in stand was 74% lower than of spruce growing in 3rd FVZ and with up to 30% in stand). The stars are intended to flag levels of significance. If a p-value is less than 0.05 and greater than 0.01, it is flagged with one star (*); if a p-value is less than 0.01 and greater than 0.001, it is flagged with two stars (**); if a p-value is less than 0.001, it is flagged with three stars (***).
5-Year-Old Stands
FVZ3rd FVZ3rd FVZ3rd FVZ3rd FVZ4th FVZ4th FVZ4th FVZ4th FVZ
FVZAdmix classUp to 30%31%–60%61%–90%Over 91%Up to 30%31%–60%61%–90%Over 91%
2nd FVZUp to 30%74% *** 71% ***
2nd FVZ31%–60% 36% *** 48% ***
2nd FVZ61%–90% 46% *** 55% ***
2nd FVZOver 91% 52% *** 54% ***
3rd FVZ31%–60%43% ***
3rd FVZ61%–90%46% ***
3rd FVZOver 91%44% ***
4th FVZ31%–60% 20% *
4th FVZ61%–90% 27% *
4th FVZOver 91% 33% *
15-year-old stands
FVZ3rd FVZ3rd FVZ3rd FVZ3rd FVZ4th FVZ4th FVZ4th FVZ4th FVZ
FVZAdmix classUp to 30%31%–60%61%–90%Over 91%Up to 30%31%–60%61%–90%Over 91%
2nd FVZUp to 30% 25% ***
2nd FVZ31%–60% 19% * 25% ***
2nd FVZ61%–90% 21% ***
2nd FVZOver 91% 33% ***
3rd FVZ61%–90% 20% ***
3rd FVZOver 91% 34% ***
25-year-old stands
FVZ2nd FVZ2nd FVZ3rd FVZ3rd FVZ3rd FVZ3rd FVZ4th FVZ4th FVZ4th FVZ4th FVZ
FVZAdmix classUp to 30%31%–60%Up to 30%31%–60%61%–90%Over 91%Up to 30%31%–60%61%–90%Over 91%
2nd FVZUp to 30% 24% *** 29% ***
2nd FVZ31%–60% 20% ** 33% ***
2nd FVZ61%–90%31% ***29% *** 36% *** 45% ***
2nd FVZOver 91%25% ***24% *** 28% *** 44% ***
3rd FVZ31%–60% 12% * 16% **
3rd FVZ61%–90% 17% * 14% *
3rd FVZOver 91% 25% ** 22% ***
4th FVZ61%–90% 10% *
4th FVZOver 91% 9% *
Table A3. Percentage differences and statistically significant values among the branch biomass (BB) of 5-year-old, 15-year-old and 25-year-old stands. The percentages indicate how much less biomass the spruce growing in the FVZ with the admix class named in the row has, compared to that of spruce growing in the FVZ with the admix class named in the column (e.g., in 5-year-old stands, the amount of the BB of spruce growing in 2nd FVZ and with 31%–60% of spruce in stand was 60% lower than of spruce growing in 2nd FVZ and with up to 30% in stand). The stars are intended to flag levels of significance. If a p-value is less than 0.05 and greater than 0.01, it is flagged with one star (*); if a p-value is less than 0.01 and greater than 0.001, it is flagged with two stars (**); if a p-value is less than 0.001, it is flagged with three stars (***).
5-Year-Old Stands
FVZ2nd FVZ3rd FVZ4th FVZ
FVZAdmix classUp to 30%31%–60%31%–60%
2nd FVZ31%–60%60% ***52% ***68% ***
2nd FVZ61%–90%28% **
2nd FVZOver 91%33% *
15-year-old stands
FVZ4th FVZ4th FVZ
FVZAdmix class61%–90%Over 91%
2nd FVZ61%–90%43% **
2nd FVZOver 91% 46% **
25-year-old stands
FVZ4th FVZ4th FVZ4th FVZ4th FVZ
FVZAdmix classUp to 30%31%–60%61%–90%Over 91%
2nd FVZUp to 30%38% **
2nd FVZ31%–60% 30% *
2nd FVZ61%–90% 35% **
2nd FVZOver 91% 38% *
Table A4. Percentage differences and statistically significant values among the needle biomass (NB) of 5-year-old, 15-year-old and 25-year-old stands. The percentages indicate how much less biomass the spruce growing in the FVZ with the admix class named in the row has, compared to that of spruce growing in the FVZ with the admix class named in the column (e.g., in 5-year-old stands, the amount of the NB of spruce growing in 2nd FVZ and with up to 30% of spruce in stand was 36% lower than of spruce growing in 3rd FVZ and with up to 30% in stand). The stars are intended to flag levels of significance. If a p-value is less than 0.05 and greater than 0.01; if a p-value is less than 0.01 and greater than 0.001, it is flagged with two stars (**); if a p-value is less than 0.001, it is flagged with three stars (***).
5-Year-Old Stands
FVZ2nd FVZ2nd FVZ2nd FVZ3rd FVZ3rd FVZ4th FVZ4th FVZ
FVZAdmix classUp to 30%61%–90%Over 91%Up to 30%31%–60%Up to 30%31%–60%
2nd FVZUp to 30% 36% ** 48% ***
2nd FVZ31%–60%39% **42% ***44% *** 49% *** 62% ***
15-year-old stands
FVZ4th FVZ4th FVZ
FVZAdmix class61%–90%Over 91%
2nd FVZ61%–90%35% **
2nd FVZOver 91% 47% ***
25-year-old stands
FVZ4th FVZ4th FVZ
FVZAdmix class61%–90%Over 91%
2nd FVZ61%–90%49% ***
2nd FVZOver 91% 39% ***

References

  1. EUFORGEN. Picea Abies. Norway Spruce. Available online: www.euforgen.org/species/picea-abies/ (accessed on 10 May 2021).
  2. Ellenberg, H.; Leuschner, C. Vegetation Mitteleuropas mit den Alpen in Ökologischer Sicht [Vegetation of Central Europe with the Alps from an Ecological Point of View]; Ulmer: Stuttgart, Germany, 1978; p. 1357. (In German) [Google Scholar]
  3. Nebe, W. Über Beziehungen zwischen Klima und Wachstum der Fichte (Picea abies) in ihrem europäischen Verbreitungsgebiet [About relationships between climate and growth of the spruce (Picea abies) in its European range]. Archiv für Forstwesen 1968, 17, 1219–1238. (In German) [Google Scholar]
  4. Schmidt-Vogt, H. Die Fichte—Ein Handbuch in Zwei Bänden, Band I. Taxonomie, Verbreitung, Morphologie, Ökologie, Waldgesellschaften [A Manual in Two Volumes, Volume I Taxonomy, Distribution, Morphology, Ecology, Forest Societies]; Paul Parey: Hamburg, Germany, 1977; p. 647. (In German) [Google Scholar]
  5. Ellenberg, H. (Ed.) Vegetation Ecology of Central Europe; Cambridge University Press: Cambridge, UK, 2009; p. 756. [Google Scholar]
  6. Quitt, E. Klimatické oblasti Československa [Climatic Regions of Czechoslovakia]; Academia: Praha, Czech Republic, 1971; p. 73. (In Czech) [Google Scholar]
  7. Plíva, K. Trvale Udržitelné Obhospodařování Lesů Podle Souborů Lesních Typů [Sustainable Forest Management According to Sets of Forest Types]; Ústav Pro Hospodářskou Úpravu Lesů: Brandýs nad Labem, Czech Republic, 2000; p. 34. (In Czech) [Google Scholar]
  8. Souček, J.; Tesař, V. Metodika Přestavby Smrkových Monokultur na Stanovištích Přirozených Smíšených Porostů [Gudlines on Norway Spruce Stand Transformation on Sites Naturally Dominated by Mixed Forest Stands]; Výzkumný Ústav Lesního Hospodářství a Myslivosti, v.v.i.: Jíloviště-Strnady, Czech Republic, 2008; p. 37. (In Czech) [Google Scholar]
  9. Spiecker, H. Silvicultural management in maintaining biodiversity and resistance of forests in Europe—Temperate zone. J. Environ. Manag. 2003, 67, 55–65. [Google Scholar] [CrossRef]
  10. Modrzyński, J. Outline of Ecology. In Biology and Ecology of Norway Spruce; Tjoelker, M.G., Boratyński, A., Bugała, W., Eds.; Springer: Dordrecht, Germany, 2007; pp. 195–253. [Google Scholar]
  11. Babst, F.; Poulter, B.; Trouet, V.; Tan, K.; Neuwirth, B.; Wilson, R.; Carrer, M.; Grabner, M.; Tegel, W.; Levanič, T.; et al. Site- and species-specific responses of forest growth to climate across the European continent. Glob. Ecol. Biogeogr. 2013, 22, 706–717. [Google Scholar] [CrossRef]
  12. Urban, O.; Pokorný, R. Tree growth under the impact of elevated CO2 concentration and some practical assessments. An. Inst. Cercet. Amenaj. Silv. 2003, 46, 93–98. [Google Scholar]
  13. Bose, A.K.; Scherrer, D.; Camarero, J.J.; Ziche, D.; Babst, F.; Bigler, C.; Bolte, A.; Dorado-Liñán, I.; Etzold, S.; Fonti, P.; et al. Climate sensitivity and drought seasonality determine post-drought growth recovery of Quercus petraea and Quercus robur in Europe. Sci. Total Environ. 2021, 784, 147222. [Google Scholar] [CrossRef]
  14. Primicia, I.; Camarero, J.J.; Janda, P.; Čada, V.; Morrissey, R.C.; Trotsiuk, V.; Bače, R.; Teodosiu, M.; Svoboda, M. Age, competition, disturbance and elevation effects on tree and stand growth response of primary Picea abies forest to climate. For. Ecol. Manag. 2015, 354, 77–86. [Google Scholar] [CrossRef]
  15. Lindén, M. Increment and Yield in Mixed Stands with Norway Spruce in Southern Sweden. Doctoral Thesis, Sveriges lantbruksuniv, Alnarp, Sweden, 2003. [Google Scholar]
  16. Hooper, D.U.; Chapin III, F.S.; Ewel, J.J.; Hector, A.; Inchausti, P.; Lavorel, S.; Lawton, J.H.; Lodge, D.M.; Loreau, M.; Naeem, S.; et al. Effects of biodiversity on ecosystem functioning: A consensus of current knowledge. Ecol. Monogr. 2005, 75, 3–35. [Google Scholar] [CrossRef]
  17. Kelty, M.J. The role of species mixtures in plantation forestry. For. Ecol. Manag. 2006, 233, 195–204. [Google Scholar] [CrossRef]
  18. Tilman, D. The ecological consequences of changes in biodiversity: A search for general principles. Ecology 1999, 80, 1455–1474. [Google Scholar] [CrossRef]
  19. Brooker, R.W.; Maestre, F.T.; Callaway, R.M.; Lortie, C.L.; Cavieres, L.A.; Kunstler, G.; Liancourt, P.; Tielbörger, K.; Travis, J.M.J.; Anthelme, F.; et al. Facilitation in plant communities: The past, the present, and the future. J. Ecol. 2008, 96, 18–34. [Google Scholar] [CrossRef] [Green Version]
  20. Rothe, A.; Binkley, D. Nutritional interactions in mixed species forests: A synthesis. Can. J. For. Res. 2001, 31, 1855–1870. [Google Scholar] [CrossRef]
  21. Šach, F.; Černohous, V. Hydraulic lift by beech to Spruce: Potentially important ecosystem process for Spruce stand silviculture in connection with climatic change of warming. Zprávy Lesn. Výzkumu 2015, 60, 53–63. [Google Scholar]
  22. Mauer, O. Rhizologie Lesních Dřevin. Učební Text [Rhizology of Forest Trees. Learning Text]; Mendelova Univerzita v Brně: Brno, Czech Republic, 2013; p. 260. [Google Scholar]
  23. Hartig, G.L. Anweisung zur Holzzucht für Förster [Wood Growing Instruction for Foresters]; Akademischen Buchhandlung: Marburg, Germany, 1808; p. 233. (In German) [Google Scholar]
  24. von Cotta, H. Anweisung zum Waldbau [Instructions for Forest Management]; Arnoldische Buchhandlung: Dresden, Leipzig, Germany, 1828; p. 396. (In German) [Google Scholar]
  25. Edgar, C.B.; Burk, T.E. Productivity of aspen forests in northeastern Minnesota, USA; as related to stand composition and canopy structure. Can. J. For. Res. 2001, 31, 1019–1029. [Google Scholar] [CrossRef]
  26. MacPherson, D.M.; Lieffers, V.J.; Blenis, P.V. Productivity of aspen stands with and without a Spruce understory in Alberta’s boreal mixedwood forests. For. Chron. 2001, 77, 351–356. [Google Scholar] [CrossRef] [Green Version]
  27. Pretzsch, H.; Block, J.; Dieler, J.; Hoang Dong, P.; Kohnle, U.; Nagel, J.; Spellmann, H.; Zingg, A. Comparison between the productivity of pure and mixed stands of Norway Spruce and European beech along an ecological gradient. Ann. For. Sci. 2010, 67, 712. [Google Scholar] [CrossRef] [Green Version]
  28. Vilà, M.; Carrillo-Gavilán, A.; Vayreda, J.; Bugmann, H.; Fridman, J.; Grodzki, W.; Haase, J.; Kunstler, G.; Schelhaas, M.; Trasobares, A. Disentangling biodiversity and climatic determinants of wood production. PLoS ONE 2013, 8, e53530. [Google Scholar] [CrossRef] [Green Version]
  29. Grossman, J.J.; Vanhellemont, M.; Barsoum, N.; Bauhus, J.; Bruelheide, H.; Castagneyrol, B.; Cavender-Bares, J.; Eisenhauer, N.; Ferlian, O.; Gravel, D.; et al. Synthesis and future research directions linking tree diversity to growth, survival, and damage in a global network of tree diversity experiments. Environ. Exp. Bot. 2018, 152, 68–89. [Google Scholar] [CrossRef]
  30. Mašínová, T.; Bahnmann, B.D.; Větrovský, T.; Toměovský, M.; Merunková, K.; Baldrian, P. Drivers of yeast community composition in the litter and soil of a temperate forest. FEMS Microbiol. Ecol. 2017, 93, fiw223. [Google Scholar] [CrossRef]
  31. Köppen, W. Das geographische System der Klimate. In Handbuch der Klimatologie; Köppen, W., Gieger, G., Eds.; Verlag von Gebrüder Borntraeger: Berlin, Germany, 1936. [Google Scholar]
  32. Buček, A.; Lacina, J. Geobiocenologie II [Geobiocoenology II]; MZLU: Brno, Czech Republic, 1999; p. 245. (In Czech) [Google Scholar]
  33. Callaway, R.M.; Walker, L.R. Competition and facilitation: A synthetic approach to interactions in plant communities. Ecology 1997, 78, 1958–1965. [Google Scholar] [CrossRef]
  34. Hallman, E.; Hari, P.; Rasanen, P.K.; Smolander, H. Effect of planting shock on the transpiration, photosynthesis and height increment of scots pine seedlings. Acta For. Fenn. 1978, 161, 1–25. [Google Scholar] [CrossRef] [Green Version]
  35. Coutts, M.P. Control of Water Loss by Actively Growing Sitka Spruce Seedlings after Transplanting. J. Exp. Bot. 1980, 31, 1587–1597. [Google Scholar] [CrossRef]
  36. Burdett, A.N. Physiological processes in plantation establishment and the development of specifications for forest planting stock. Can. J. For. Res. 1990, 20, 415–427. [Google Scholar] [CrossRef]
  37. Grossnickle, S.C. Importance of root growth in overcoming planting stress. New For. 2005, 30, 273–294. [Google Scholar] [CrossRef]
  38. Lamhamedi, M.S.; Bernier, P.Y.; Hébert, C.; Jobidon, R. Physiological and growth responses of three sizes of containerized Picea mariana seedlings outplanted with and without vegetation control. For. Ecol. Manag. 1998, 110, 13–23. [Google Scholar] [CrossRef]
  39. Spinnler, D.; Egli, P.; Körner, C. Four-year growth dynamics of Beech-Spruce model ecosystems under CO2 enrichment on two different forest soils. Trees 2002, 16, 423–436. [Google Scholar] [CrossRef] [Green Version]
  40. Goisser, M.; Zang, U.; Matzner, E.; Borken, W.; Häberle, K.H.; Matyssek, R. Growth of juvenile beech (Fagus sylvatica L.) upon transplant into a wind-opened Spruce stand of heterogeneous light and water conditions. For. Ecol. Manag. 2013, 310, 110–119. [Google Scholar] [CrossRef]
  41. Struve, D.K.; Joly, R.J. Transplanted red oak seedlings mediate transplant shock by reducing leaf surface area and altering carbon allocation. Can. J. For. Res. 1992, 22, 1441–1448. [Google Scholar] [CrossRef]
  42. Slodičák, M.; Novák, J. Výchova Lesních Porostů Hlavních Hospodářských Dřevin [Thinning of Forest Stands of the Main Farm Trees]; Výzkumný ústav Lesního Hospodářství a Myslivosti v.v.i.: Jíloviště-Strnady, Czech Republic, 2007; p. 25. (In Czech) [Google Scholar]
  43. Koch, H.G. Der Holzzuwachs der Waldbäume in verschiedenen Hähenlagen Thuringens in Abhängichkeit von Neiderschlag und Temperatur [The Wood Growth of the Forest Trees in Different Heights of Thuringia as a Function of Envy and Temperature]. Arch. Forstwes. 1958, 7, 27–49. [Google Scholar]
  44. Modrzyński, J.; Eriksson, G. Response of Picea abies populations from elevational transects in the Polish Sudety and Carpathian mountains to simulated drought stress. For. Ecol. Manag. 2002, 165, 105–116. [Google Scholar] [CrossRef]
  45. Pokorný, R.; Stojnić, S. Leaf area index of Norway spruce stands in relation to age and defoliation. Beskydy 2012, 5, 173–180. [Google Scholar] [CrossRef] [Green Version]
  46. Konšel, J. Stručný Nástin Tvorby a Pěstění Lesů v Biologickém Ponětí [A Brief Outline of the Creation and Cultivation of Forests in Biological Terms]; Matice Lesnická: Písek, Czech Republic, 1931; p. 552. (In Czech) [Google Scholar]
  47. Pretzsch, H. Modellierung der kronenkonkurrenz von fichte und buche in rein-und mischbeständen [Modeling of the crown competition of spruce and beech in pure and mixed stands]. Allg. Forst-Und Jagdztg. 1992, 163, 203–213. (In German) [Google Scholar]
  48. Juodvalkis, A.; Kairiukstis, L.; Vasiliauskas, R. Effects of thinning on growth of six tree species in north-temperate forests of Lithuania. Eur. J. For. Res. 2005, 124, 187–192. [Google Scholar] [CrossRef]
  49. Leuschner, C.; Hertel, D.; Schmid, I.; Koch, O.; Muhs, A.; Hölscher, D. Stand fine root biomass and fine root morphology in old-growth beech forests as a function of precipitation and soil fertility. Plant Soil 2004, 258, 43–56. [Google Scholar] [CrossRef]
  50. Bolte, A.; Villanueva, I. Interspecific competition impacts on the morphology and distribution of fine roots in European beech (Fagus sylvatica L.) and Norway Spruce (Picea abies (L.) Karst.). Eur. J. For. Res. 2006, 125, 15–26. [Google Scholar] [CrossRef]
  51. Brunner, I.; Herzog, C.; Dawes, M.A.; Arend, M.; Sperisen, C. How tree roots respond to drought. Front. Plant Sci. 2015, 6, 547. [Google Scholar] [CrossRef] [PubMed]
  52. Rybníček, M.; Čermák, P.; Žid, T.; Kolář, T. Radial Growth and Health Condition of Norway Spruce (Picea Abies (L.) Karst.) Stands in Relation to Climate (Silesian Beskids, Czech Republic). Geochronometria 2010, 36, 9–16. [Google Scholar] [CrossRef] [Green Version]
  53. van der Maaten, E. Climate sensitivity of radial growth in European beech (Fagus sylvatica L.) at different aspects in southwestern Germany. Trees Struct. Funct. 2012, 26, 777–788. [Google Scholar] [CrossRef] [Green Version]
  54. Haggar, J.P.; Ewel, J.J. Establishment, resource acquisition, and early productivity as determined by biomass allocation patterns of three tropical tree species. For. Sci. 1995, 41, 689–708. [Google Scholar]
  55. Richards, J.M.; Caldwell, M.M. Hydraulic lift: Substantial nocturnal water transport between soil layers by Artemisia tridentata roots. Oecologia 1987, 73, 486–489. [Google Scholar] [CrossRef]
  56. Walentowski, H.; Falk, W.; Mette, T.; Kuny, J.; Bräuning, A.; Meinardus, C.; Zang, C.; Sutcliffe, L.M.E.; Leuscher, C. Assessing future suitability of tree species under climate change by multiple methods: A case study in southern Germany. Ann. For. Res. 2017, 60, 101–126. [Google Scholar] [CrossRef]
Figure 1. The mean DBH, height (H) and height of crown base (CH) of spruce according to ages of stands (5-, 15- and 25-year-old stand), forest vegetation zones (2nd, 3rd and 4th zone) and percentage representation of spruce in stand (admix classes <30%, 31%–60%, 61%–90% and >91%). (A)—DBH of spruce; (B)—height of spruce; (C)—height of crown base of spruce. Whiskers denote standard deviations.
Forests 14 00185 g001
Figure 2. The mean total above-ground biomass (TAGB) of spruce according to ages of stands (5-, 15- and 25-year-old stand), forest vegetation zones (2nd, 3rd and 4th zone) and percentage representation of spruce in stand (admix classes <30%, 31%–60%, 61%–90% and >91%) with linear regression curves. 5-TAGB of spruce in 5-year-old stands; 15-TAGB of spruce in 15-year-old stands; 25-TAGB of spruce in 25-year-old stands. Whiskers denote standard deviations. Values of linear regression curves are described in Table 2.
Forests 14 00185 g002
Figure 3. The mean stem biomass (SB) of spruce according to ages of stands (5-, 15- and 25-year-old stand), forest vegetation zones (2nd, 3rd and 4th zone) and percentage representation of spruce in stand (admix classes <30%, 31%–60%, 61%–90% and >91%) with linear regression curves. 5-SB of spruce in 5-year-old stands; 15-SB of spruce in 15-year-old stands; 25-SB of spruce in 25-year-old stands. Whiskers denote standard deviations. Values of linear regression curves are described in Table 2.
Forests 14 00185 g003
Figure 4. The mean branch biomass (BB) of spruce according to ages of stands (5-, 15- and 25-year-old stand), forest vegetation zones (2nd, 3rd and 4th zone) and percentage representation of spruce in stand (admix classes <30%, 31%–60%, 61%–90% and >91%). 5-BB of spruce in 5-year-old stands; 15-BB of spruce in 15-year-old stands; 25-BB of spruce in 25-year-old stands. Whiskers denote standard deviations.
Forests 14 00185 g004
Figure 5. The mean needle biomass (NB) of spruce according to ages of stands (5-, 15- and 25-year-old stand), forest vegetation zones (2nd, 3rd and 4th zone) and percentage representation of spruce in stand (admix classes <30%, 31%–60%, 61%–90% and >91%). 5-NB of spruce in 5-year-old stands; 15-NB of spruce in 15-year-old stands; 25-NB of spruce in 25-year-old stands. Whiskers denote standard deviations.
Forests 14 00185 g005
Table 1. Characteristics of the chosen FVZ.
Characteristic2nd FVZ3rd FVZ4th FVZ
Average annual temperature (°C; [32])87.57
Precipitation in vegetation period (mm; [6])350–400350–450350–450
Annual precipitation (mm; [32])550–600600–650700
Altitude range (m a.s.l.; [32])200–400300–500400–700
Table 2. The values of the total above-ground and stem biomass regression curves. The form of the equation is y = ax + b.
5-Year-Old Stand15-Year-Old Stand25-Year-Old Stand
Linear
Coefficient
a
Absolute Term
b
R2Linear
Coefficient
a
Absolute Term
b
R2Linear
Coefficient
a
Absolute Term
b
R2
Total above-ground biomass
2nd FVZ−0.04434.91330.01140.006633.0510.00003−6.69768.4590.8406
3rd FVZ−1.955815.2070.6115−1.944441.4090.945−0.6762587.7550.987
4th FVZ−1.415814.5310.89641.921540.1150.438−3.040889.6750.8357
Stem biomass
2nd FVZ−0.0574.35880.01170.513428.8110.1732−6.118761.4560.8531
3rd FVZ−1.913914.2520.6199−1.654336.8710.9168−5.868977.750.9772
4th FVZ−1.305313.2770.89671.884336.0160.4901−2.813780.7210.8442
Disclaimer/Publisher’s Note: The statements, opinions and data contained in all publications are solely those of the individual author(s) and contributor(s) and not of MDPI and/or the editor(s). MDPI and/or the editor(s) disclaim responsibility for any injury to people or property resulting from any ideas, methods, instructions or products referred to in the content.

