
Allometric Growth of Common Urban Tree Species in Qingdao City of Eastern China

1
Faculty of Forestry, Qingdao Agricultural University, Qingdao 266109, China
2
Shanghai Key Lab for Urban Ecological Processes and Eco-Restoration, Shanghai 200241, China
3
College of Natural Resources, University of Wisconsin Stevens Point, 800 Reserve Street, Stevens Point, WI 54481, USA
*
Author to whom correspondence should be addressed.
†
These authors contributed equally to this work.
Forests 2023, 14(3), 472; https://0-doi-org.brum.beds.ac.uk/10.3390/f14030472
Submission received: 20 January 2023
/
Revised: 20 February 2023
/
Accepted: 24 February 2023
/
Published: 26 February 2023
(This article belongs to the Special Issue Urban Forestry Measurements)
Abstract
:Allometric growth equations help to describe the correlation between the variables of tree biological characteristics (e.g., diameter and height, diameter and canopy width) and estimate tree dynamics at a given tree dimension. Allometric models of common tree species within urban forests are also important to relate ecosystem services to common urban tree measurements such as stem diameter. In this study, allometric growth models were developed for common tree species used for urban greening on the streets of seven municipal districts in Qingdao city of eastern China. A sampling survey was constructed on an urban–rural gradient to obtain the data of tree diameter, crown width, height to live crown base, and tree height. From these measurements, the crown volume and crown projection area of tree species were calculated. The allometric relationship between two variables was established using quantile regression models (95%, 50%, and 5%) to explore its correlation and the influence of tree species characteristics on urban tree allometry. Our results showed that the correlation of allometric growth of different tree species varied largely due to their own characteristics, and the allometric growth of the same tree species was significantly different as well under the fitting of different quantiles. We found that the relationship between crown width and diameter was stronger than that between tree height and diameter. Moreover, the allometric relationship between crown projection area–diameter and crown width–diameter showed similar fitting. The allometric relationship analysis provide theoretical models and a way to use common field data to support urban forestry management and for the subsequent evaluation and prediction of tree functions and ecosystem services.
1. Introduction
Urban forestry and greening provide an important way to counter the impacts of accelerated urbanization and increased human population upon natural resources and ecosystem services [1]. Ecosystem services promote human life, safety, health, and other aspects of well-being and resilience to natural events [1,2,3]. Urban trees are an important vegetative part of urban forests and can be used to estimate urban ecosystem services through allometric relationships [4,5]. A considerable amount of research has explored the relationship between tree size and the services and disservices that urban trees bring to cities [6,7]. On the one hand, urban trees provide ecosystem service functions and benefits for cities, such as mitigating microclimate [4,8], improving air and soil quality [9], reducing noise [10,11], and beautifying the urban environment [7,12]. On the other hand, urban trees also bring liabilities such as debris (e.g., fallen leaves and branches, production of allergic substances) [13,14] and potential property damage and human injury from fallen trees and branches [15]. Reasonable and effective urban forestry planning and management can help promote ecosystem services and reduce the harm caused by urban trees [16,17].
The studies of tree growth and tree biological characteristics are of great significance to urban forestry management [17]. Tree size and growth provide a scientific basis for urban foresters to select, locate, maintain, and manage tree growth. In the field of forestry, allometric growth equations are often used to assess changes in tree growth and have a long history. Huxley and Teissier [18] proposed using an allometric growth equation, and it has become common to use linear regression to analyze data variables today [19]. More recently in the past few decades, many researchers have used allometric growth equations to explore the tree growth and relationship between tree biometric variables, providing scientific information for managing tree stands [20,21,22].
In recent years, urban foresters have begun to recognize the importance of using urban tree allometric growth models to select suitable tree species for their sites [23]. In addition, these models are used to predict the economic benefits of trees [24,25], quantify ecosystem services of urban trees [1,26], and model economic and ecosystem effects of insect and disease impacts on urban forests [27,28]. However, compared with the research on rural trees, there is relatively less research with urban trees. Thus, urban tree models have used trees from rural forests and other locations to model tree growth. The allometric growth relationship between urban and rural areas [29] and different cities [26,30,31] will produce different results due to tree species types and regional tree differences [31]. Urban tree growth can interestingly be either promoted by less competition of open grown trees [27] or negatively affected by soil restrictions from compaction or water availability [32]. Accordingly, the existing allometric growth equation of rural trees cannot adequately represent the allometric growth equation of trees in urban areas. Developing allometric growth models for trees in urban locations is crucial for urban tree planning and management and quantifying the ecosystem services provided by urban forests.
A building knowledge of urban-tree-specific allometric growth equations has occurred in recent times to better manage urban trees [33]. For example, a Korean study [34] quantified urban tree biomass and carbon stocks for five common urban greening tree species based on allometric equations of their diameter and height. That study and others show that the development of allometric equations can vary by location [35,36,37]. Site conditions within cities determine to some extent the certainty of quantifying the above-ground volume of trees [38]. Investigations on the allometric growth relationship of urban trees also vary by climate [31,38,39]. These studies collectively establish allometric growth models of biological characteristic variables such as tree diameter, crown width, and crown volume, along with the growth of trees, which are predicted, and the ecosystem services brought by urban trees are quantified [36]. Although researchers have made a great many efforts for the development of urban trees and allometric models, additional studies for the allometric relationship of trees in urban locales are needed to account for change and differences due to phenology, habitat, post-management, and maintenance. However, research on tree allometric growth relationship data in specific urban areas is still very limited. Therefore, it is necessary to fully understand the allometric relationship of trees growing under different conditions and establish independent allometric growth equations for each region to provide more accurate information for urban forestry workers [38].
Based on direct measurement data of urban street trees along an urban–rural gradient in Qingdao city, eastern of China, we aim to answer the following question: what is the difference in the allometric relationships in the urban tree species and what does the difference imply for biology of urban tree species? Accordingly, this study aims to develop predictive models to relate tree dimensions by tree diameter. First, we measured tree diameter, tree height, and crown width of common urban greening tree species. Then we developed allometric relationships between tree diameter and crown width, tree height, crown projection area, and crown volume of tree species by quantile regression models. A set of allometric growth models based on the growth of common urban greening trees was established to predict the growth dynamics of trees and provide data to support urban tree managers to quantify tree ecosystem services. This study quantified the urban tree allometry in the coastal region of northern China. There has been no relevant research on this region before, which opens up a new direction for the study of urban forests in northern coastal region to a certain extent. The application is to guide selecting suitable tree species for different regions based on the tree allometric growth model and to provide a scientific basis for planning, construction, and management of urban forests.
2. Materials and Methods
2.1. Site Description
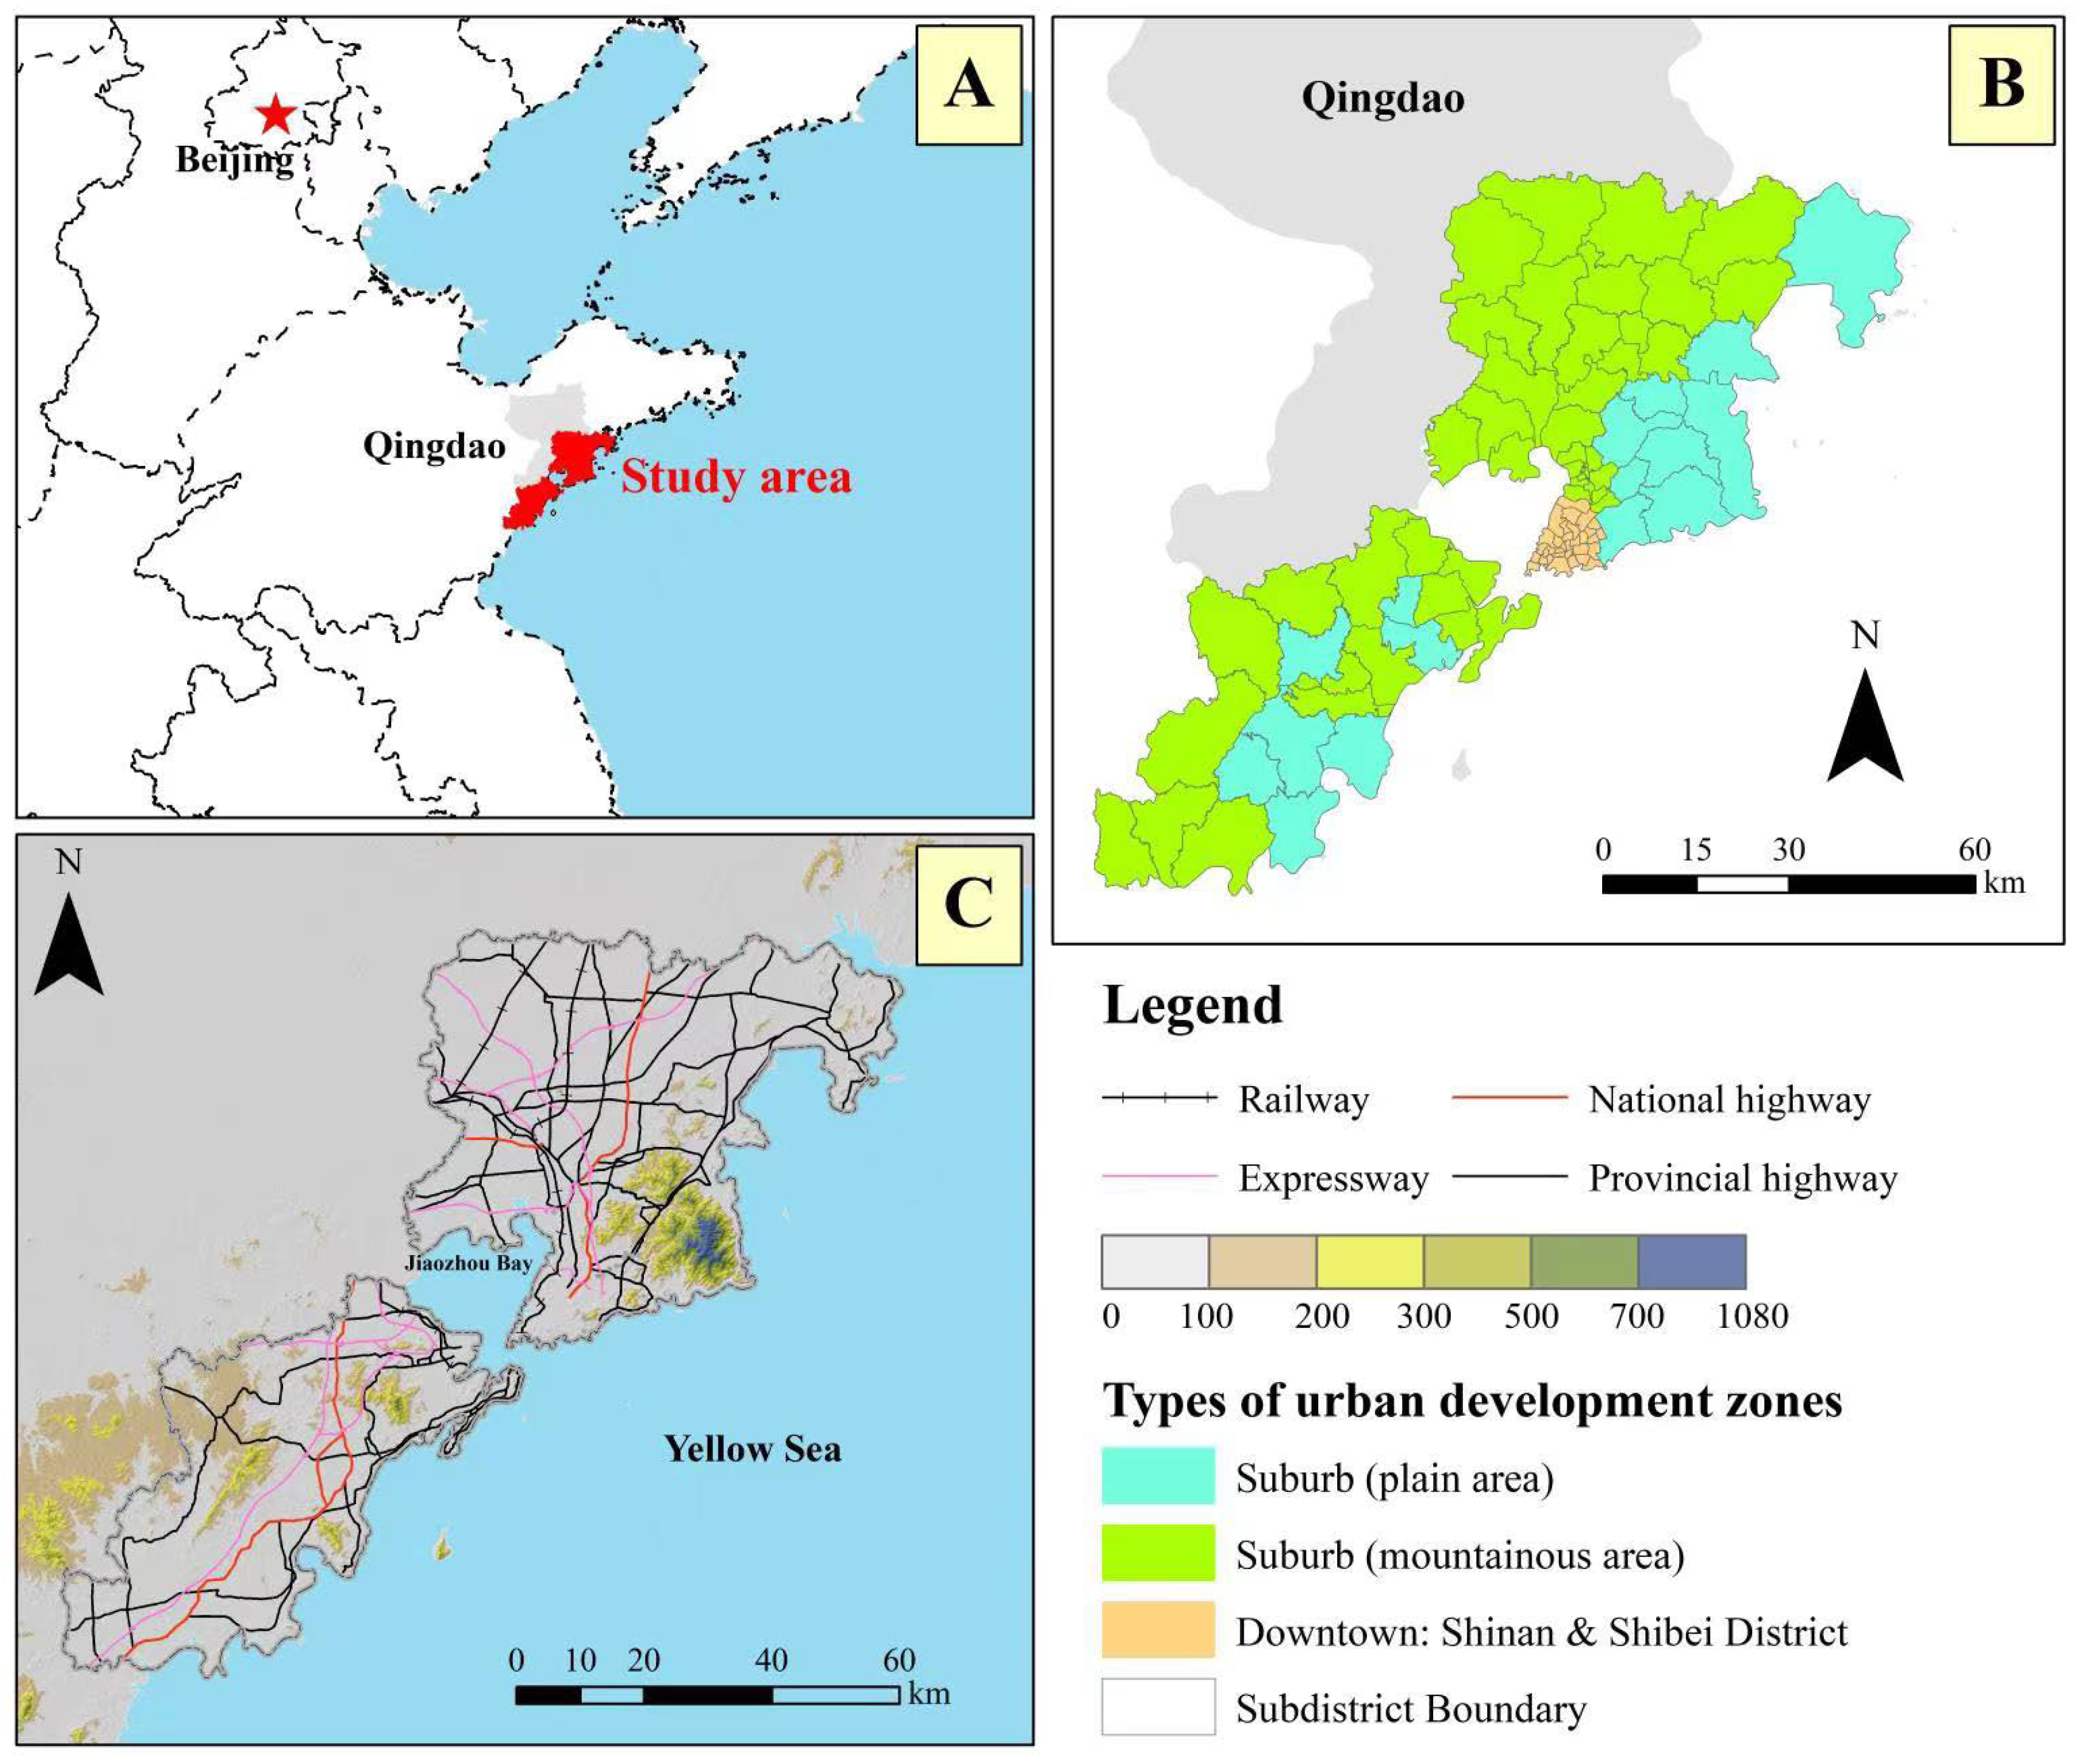
The study site in Qingdao, in the eastern region of China (119°30′ E–121°00′ E, 35°35′ N–37°09′ N), is adjacent to the Jiaozhou Bay, near the Yellow Sea and southeast of Shandong Peninsula. The total land area is 249 km2 and with 10.2 million people in 2021 (2021 Qingdao statistical yearbook). The marine environment in the area is humid with four distinct seasons and a temperate monsoon climate. The vegetation growing season is from March to September with a mean annual temperature of 12.6 °C with a cold winter (an average temperature in December–February of 0.9 °C) and a mild summer (an average temperature in June–August of 23.3 °C) [40]. The mean annual rainfall is approximately 662.1 mm, of which approximately 90% falls in the summer (http://www.weather.com.cn/; http://www.data.ac.cn/, accessed on 20 March 2020).
2.2. Data Collection
Preliminary investigation occurred to determine the most common street tree species (n > 45 per species) to include in the study. Sampling was carried out in seven districts (Shinan, Shibei, Laoshan, Licang, Chengyang, Jimo, Huangdao) of Qingdao from July 2021 to May 2022 (Figure 1). A total of 5648 individual trees from 15 tree species: Ailanthus altissima, Cedrus deodara, Cercis chinensis, Firmiana simplex, Fraxinus chinensis, Ginkgo biloba, Koelreuteria paniculata, Metasequoia glyptostroboides, Pinus thunbergii, Platanus × acerifolia, Populus spp., Prunus cerasus, Robinia pseudoacacia, Salix matsudana, and Styphnolobium japonicum, were sampled (Table 1). Measurement parameters included tree diameter at breast height (DBH, at 1.3 m), crown width (CW), tree height (H), and height to live crown base (HCB). The tree crown length (CL), crown volume (CV), and crown projection area (CPA) were mathematically calculated and described later.
Tree measurements occurred along an established urban–rural gradient zone transect: starting and progressing from a high-density urban area (downtown), medium-density urban area, low-density urban area (suburbs), and non-urban area (rural) locations (Figure 1). Sample locations were set up along four cardinal directions (east, west, south and north) centered on the city center. Along this direction, a sampling point with a length of 100 m along a road was established per 1000 to 2000 m distance depending on buildings, green belts, lakes and rivers, etc., on the start of the next sample length. The field data collection was conducted along 143 roads in the seven districts. Urban trees in an open grown state were selected for study. Trees were visually excluded for growth limitations from interspecific tree competition (e.g., planting density) and artificial canopy management such as with clearance pruning. Trees that were significantly disturbed, such as from pests and diseases and a declining canopy, were also excluded.
Tree diameter was measured using a diameter tape to a 1 mm precision. Crown width measurement used the vertical sighting method [41], and the mean distance along an east–west and north–south direction was to a 1 cm precision. Tree height was measured directly by a tower ruler for small trees and taller tree species exceeding the tool height were measured by a laser altimeter (Nikon Forestry Pro II, Nikon, Tokyo, Japan) ranging instrument. Crown length (CL) was determined from subtraction of height to live crown base (HCB) from tree height in Equation (1).
where CL is the vertical length from base to top of living crown (m), H is the total height of each tree (m), HCB is height to live crown base (m) from the ground.
Values of crown projection area (CPA, Equation (2)) and crown volume (CV, Equation (3)) were obtained according to the formula from previous studies [21,36]. Crown projection area represents the area occupied underneath by an individual tree, and the crown volume represents the growing space occupied. From the measured data, CPA and CV were calculated as:
where CPA is the crown projection area (m2); CR is the crown radius (m), obtained by the crown width divided by 2; and CV is the crown volume (m3).
2.3. Tree Allometric Growth Model
This study used the relative growth equation first proposed by Huxley et al. [18] to analyze and explore the relative relationship between DBH and CW, H and CV. This follows that the growth rate of different organs in the organism is a certain proportion [18]. For trees, the individual DBH is also proportional to the growth of crown size (e.g., H and CW). The allometric growth hypothesis x and y quantify the tree size. The relationship between the growth change in trees x and y is:
The complete natural logarithm is expressed as:
where dx and dy are the growth of tree size x and y, respectively; represents the intercept of allometric growth, α is the allometric growth exponent (α = 1 means that x and y grow at the same rate), b is a constant.
All analyses were performed in R version 4.2.2 (https://cran.r-project.org/). Before fitting and analyzing the tree species, we used common allometric growth models: linear regression model, polynomial regression model, logarithmic model, exponential model, and quantile regression (the rq () function) of the quantreg package [42] to fit and test the 15 urban tree species.
Quantile regression allows the regression model to be fitted to any expected conditional quantile of the distribution of the dependent variable [43], and this method was used to analyze the allometric growth of CW, H, and DBH of urban trees following the allometric growth equation developed by earlier researchers [21,44]. Since our data were relatively dispersed, we were interested in determining the upper and lower boundary with different crown shapes rather than quantifying the conditional central tendency of the tree allometry by ordinary least squares (OLS) regression. Furthermore, the quantile regression is more robust against outliers [21]. The 95%-quantile was fitted to represent the upper boundary, i.e., open grown trees with a very broad crown, and the 50%-quantile (the median) and the 5%-quantile was fitted to incorporate average and suppressed trees. The model validations of residuals against measured data are shown in Appendix A (Figure A1 and Figure A2).
The allometric growth of DBH and crown dimensions (e.g., CW and H) used:
DBH, H, and CW are as explained above, is the allometric growth intercept, and α is the allometric growth exponent.
The allometric growth parameters H, CW, DBH estimated the direct change in tree growth. Based on Equations (1)–(3), the allometric growth model of CPA and CV is established as follows:
3. Results
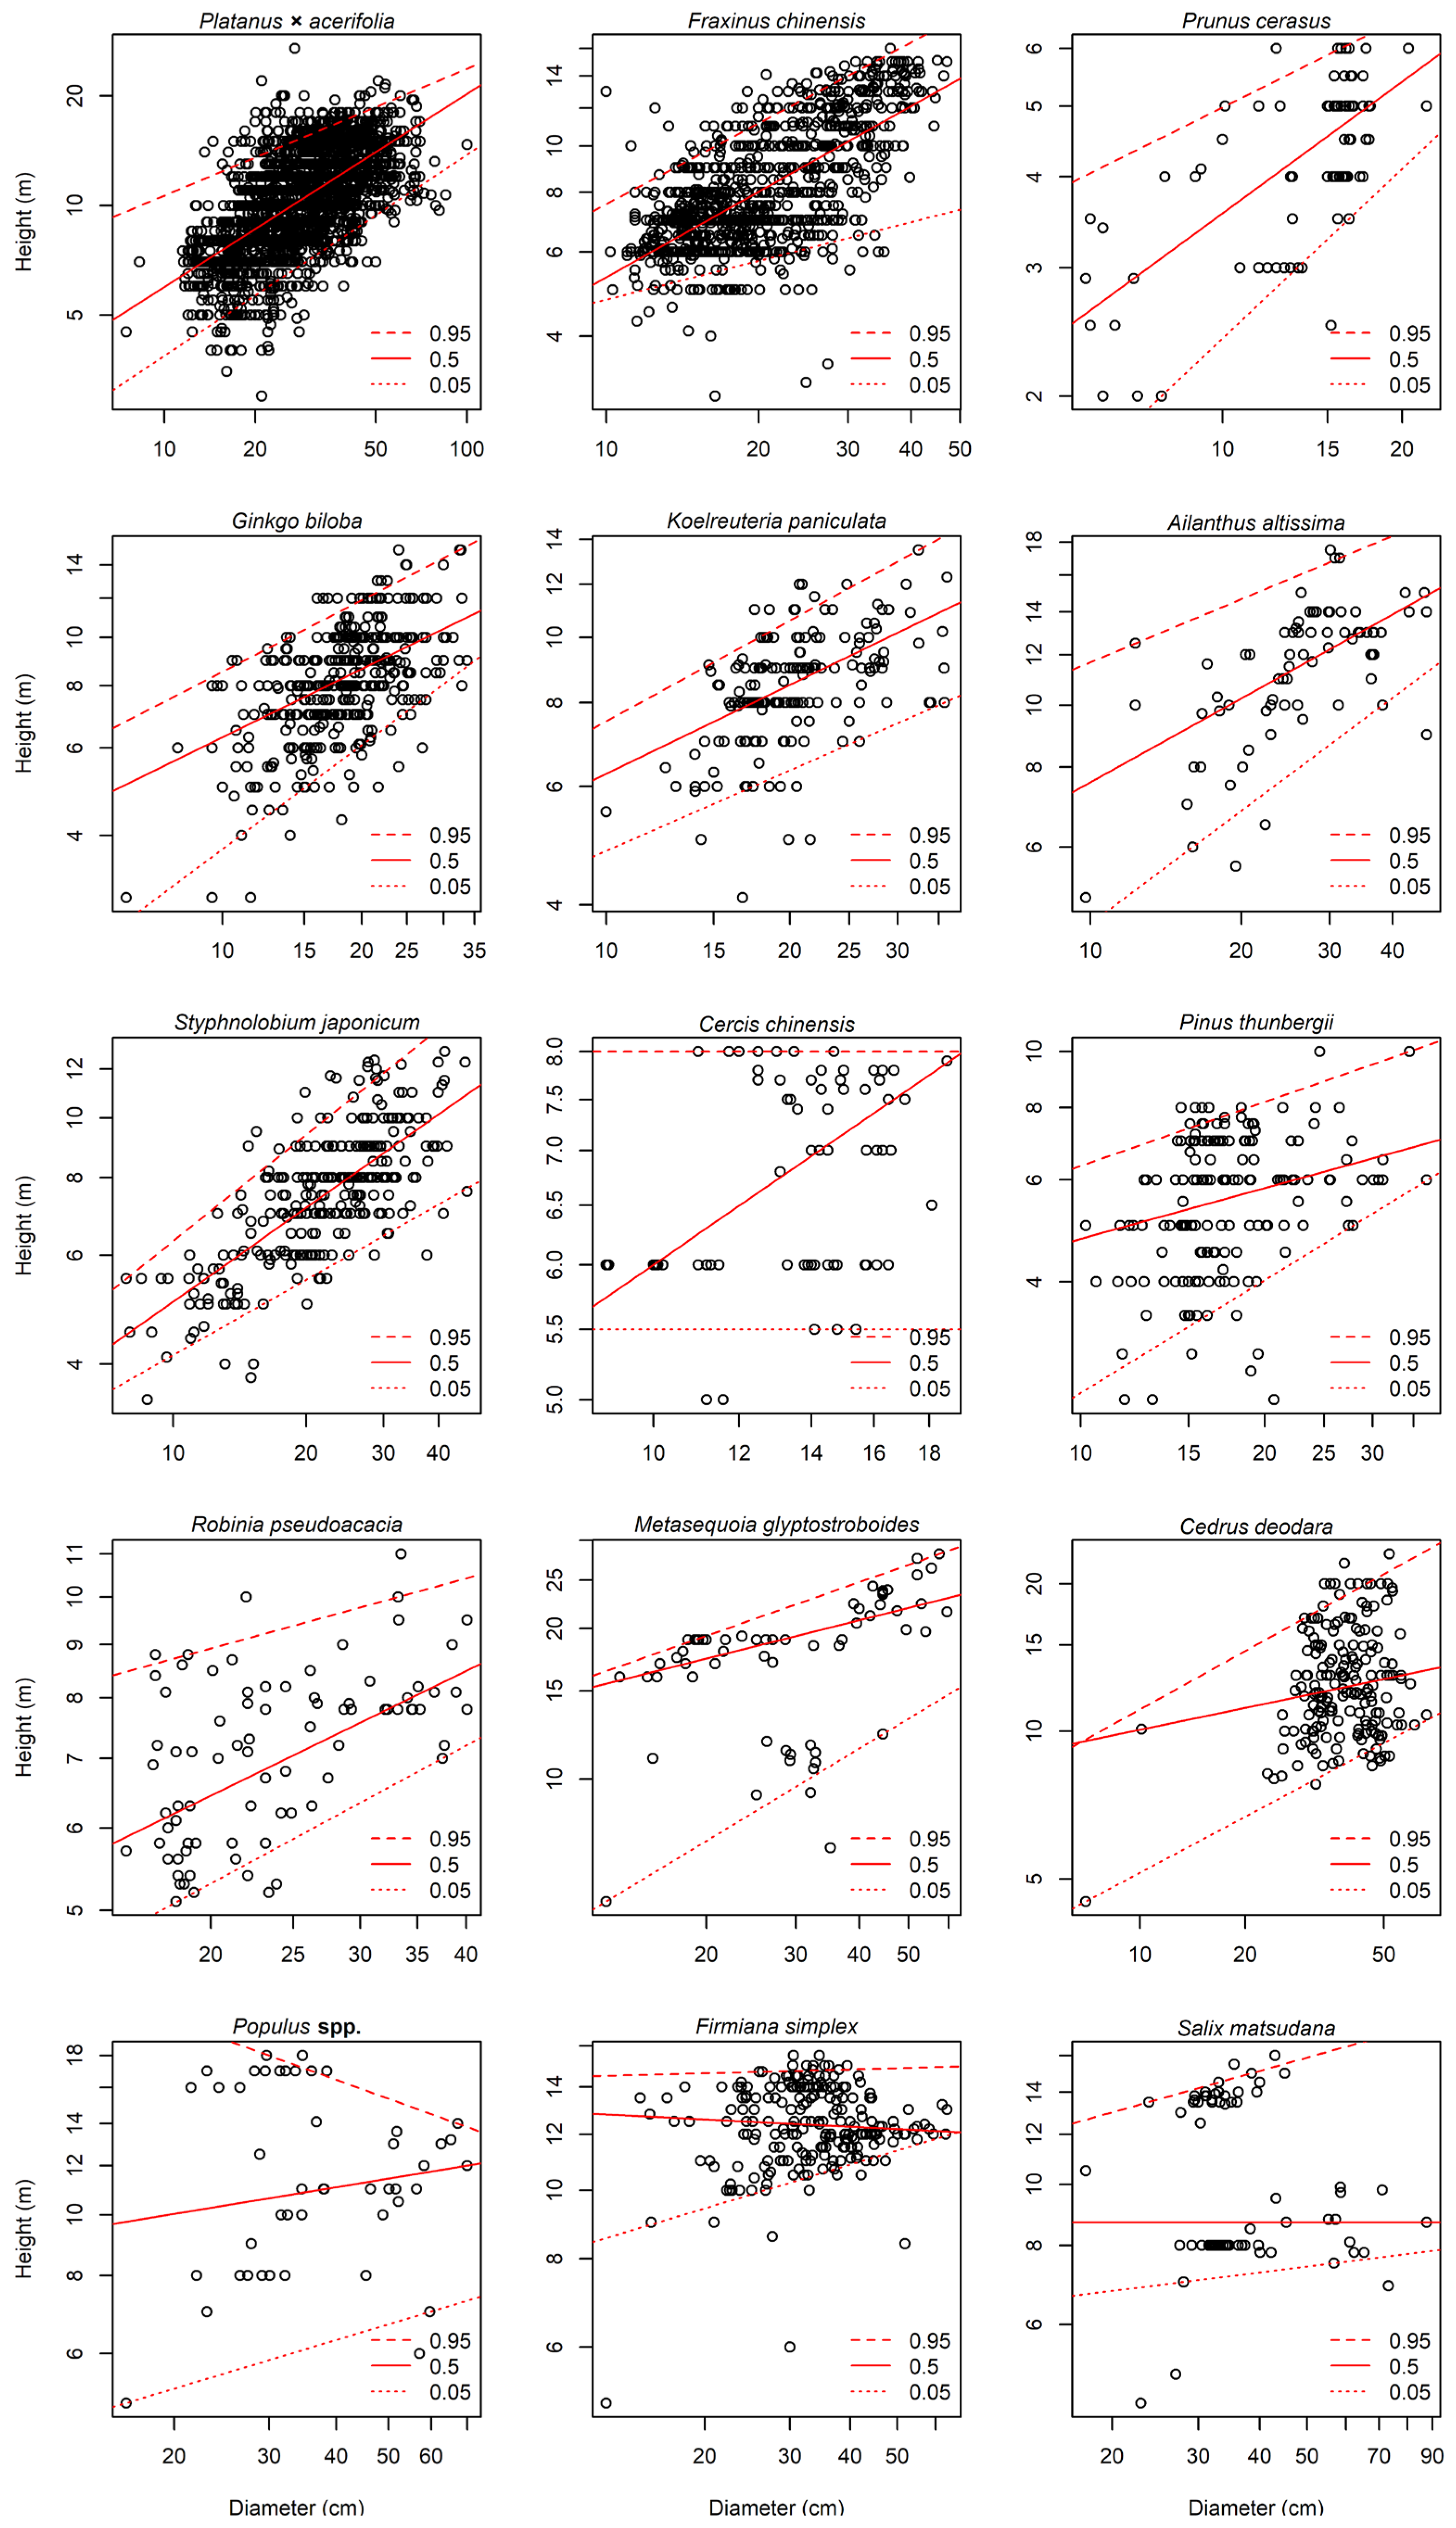
Tree DBH ranged from 5.9 to more than 80 cm, H was from 2 to over 20 m, and CW was from 0.5 to 27.7 m (Table 1). Significant models were found for the allometric growth relationship between H (Figure 2), CW (Figure 3), CPA (Figure 4), and CV (Figure 5) based on DBH. The results are as follows.
3.1. Allometric Growth Model of DBH and Tree Height
It can be seen from Figure 2 and Table 2 that there were significant differences in the height range of the different tree species. Similarly, significant differences were observed in the quantile regression fitting of the 15 tree species, which varied within a certain range. The fitting of height to DBH generally exhibited a reasonably positive correlation, i.e., height grew with increasing DBH. Interestingly, the fitting of Populus spp. at the 95% quantile and that of F. simplex at the 50% quantile showed a downward trend, indicating that their fitting was negatively correlated and height decreased with increasing DBH. The height–diameter fitting of C. chinensis, F. simplex, and S. matsudana was a straight line parallel to the x-axis, showing irrelevant results. An observation was that pruning in urban tree management affected tree height.
Table 2 lists the 95% quantile tree height-DBH fitting results for all 15 tree species. The 95% quantile regression model represents the height of trees under unconstrained conditions to a certain extent. For the 15 tree species surveyed, the fitted coefficient for a 95% quantile regression ranged from 0.2 to 1.7. The allometric exponent α was always different from zero on a significance level of p < 0.05 and fluctuated in the range of 0.1 to 0.6. Except for C. chinensis, its allometric growth exponent α value was 0.000 and p value was 1.000, indicating that the tree height did not change with the change in DBH, and there was no correlation between the two variables. Tree height-DBH relationships in P. cerasus, A. altissima, P. thunbergii, F. simplex, and S. matsudana were insignificant, and the less significant they were, the smaller the value for the allometric growth exponent. This reflects that tree height had little effect on the change of DBH.
3.2. Allometric Growth Model of DBH and Crown Width
Allometric relationships between crown width and DBH by quantile (95%, 50%, 5%) differed among the 15 tree species (Figure 3, Table 3). Similar to the tree height-DBH models, the crown width and DBH fitting of most tree species showed a positive correlation, i.e., the crown width increased with the increasing DBH. However, there were also tree species whose crown width and DBH fitting appeared to be uncorrelated. For example, the 95% quantile regression of P. cerasus and the 50% quantile regression of S. matsudana were fitted as a straight line parallel to the x-axis, indicating that there was no correlation between crown width and DBH. In Figure 3, the crown width and DBH growth exponent of different tree species had obvious differences, such as the slope of P. × acerifolia and M. glyptostroboides. The allometric growth exponent of the same tree species at different quantiles were also significantly different, such as with R. pseudoacacia, M. glyptostroboides, and Populus. spp.
Table 3 shows the fitting results for 15 tree species in the 95% quantile regression, with significance varying by species for the crown width and DBH models. The coefficient value varied between −2 and 1. For their allometric growth exponent, no significant relationship was found for P. cerasus, M. glyptostroboides, Populus. spp., and C. deodara. Tree species with significant relationships showed a positive correlation ranging from approximately 0.3 to 2.5. Growth rate exponent was greatest in C. chinensis. The allometric growth exponent of crown width and DBH of most tree species conformed to the allometric growth exponent α = 2/3 under ideal growth. Examples of this relationship included P. × acerifolia, F. chinensis, and G. biloba. The non-significant relationship of crown width with DBH in C. deodara was likely related to the growth characteristics and pruning of this species. The allometric growth exponent of C. chinensis was greatest at 2.5117.
3.3. Allometric Relationships of Crown Projection Area and Crown Volume
We used Equations (9) and (10) to plot the regression scatter plot of the crown projection area (Figure 4), crown volume (Figure 5) with DBH at the quantiles of 95%, 50%, 5% of 15 tree species, respectively. Crown projection area and crown volume had a strong relationship with crown width and tree height, which was similar to the allometric growth relationship between DBH and tree height or crown width. Compared with Figure 3 and Figure 4, the quantile regression fitting trend of crown volume and crown projection area with DBH appeared consistent. Crown volume was calculated from tree height and crown width, and its fitting is affected by the two variables. Table 4 and Table 5 are the fitting results of crown projection area and crown volume with DBH at 95% quantile, respectively. From the perspective of significance, the significance of the crown volume of 15 tree species was more than that of the crown projection area. Except for P. cerasus and C. deodara, all other species displayed a significant difference (p < 0.05) for crown volume and DBH allometric growth rate exponent relationship. The significance of crown projection area and DBH at 95% quantile was consistent with that of crown width and DBH at 95% quantile for nine tree species.
4. Discussion
4.1. Allometric Models
Urban trees are important providers of urban ecosystem services [1,2,45]. In rural and urban forests, tree crown size is extensively studied because it is closely related to DBH and tree growth and useful to estimate the ecosystem service benefits of trees [39]. Tree diameter, tree height, and crown width are common characteristic variables in forestry research. By measuring DBH, tree height, and crown width and establishing the allometric growth equation between them, this can further be developed to predict the crown projection area, crown volume, and tree biomass by DBH [30,38,46]. This is a prerequisite for accurately estimating the ecological and economic benefits of trees [34,38]. This study used quantile regression to explore the allometric growth relationship between DBH and crown width, tree height, and other biological characteristic variables of 15 common urban greening tree species in Qingdao. A set of allometric growth relationship models between DBH and tree height, crown width, crown projection area, and crown volume were established.
Tree height and crown width are key elements of urban forestry management [30,47]. Establishing an allometric growth model of two variables and diameter further improves urban forestry development. Crown projection area and crown volume are components of crown size, and their model relationship to DBH is of great significance for quantifying the ecological value of trees (e.g., shading, filtering particulate matter, carbon sequestration, etc.) and growing space management [21,48,49].
The research study fills the gap related to allometric growth of urban trees in Qingdao, even the coastal region of northern China. The results provide a basis for urban forest management and establishing a foundation for the subsequent quantitative research of urban tree ecosystem services. Results could be tested and potentially applied in other regions with similar climates. However, extrapolation to other locations ideally includes validation as differences may occur [31].
4.2. Comparison of Allometric Growth of Different Tree Species
The results of this study and related research in recent years [21,30,50] are consistent with species differences in allometric growth models among tree species (Figure 2, Figure 3, Figure 4 and Figure 5). In this study, tree characteristics were influenced by urban management. There was also a knowledge gap in the space required for tree growth, which was mainly reflected in the significant difference in the maximum crown width of different tree species in the open grown state (Table 1). Substantial differences may exist in the crown size of the same tree species under different growth conditions, such as open grown and a denser forest stand growth [21,30]. However, our current research did not compare these two different growth states related to competition.
The allometric exponent α indicates that the species-specific difference leads to the exponential difference in the dynamics of crown size with the change in diameter. In principle, the crown size increases with the increase in diameter, but there was a case in our research contrary to this. The allometric relationship of Populus. spp. between tree height–diameter at 95% quantile shows a downward trend. The allometric growth exponent is −0.3111, that is, for every 1 cm increase in diameter, the tree height decreases by 0.3 cm. This could be explained by trees being pollarded to reduce or keep the height artificially low during the development of urban trees. The allometric growth results of crown width to DBH results for 15 tree species, the fitted curve of P. cerasus. at 95% quantile, and S. matsudana at 50% quantile showed a straight line parallel to the x-axis, which indicated that there was no correlation between their crown width and DBH, and their crown width did not change with diameter. We consider that there are multiple reasons for these results. First, a small sample size of some tree species may have affected the results. Thus, additional increased tree sample size is important. Second, urban forest management practices could have influenced tree dimensions. For some urban street tree species, urban managers regularly prune trees to maintain their overall aesthetics and functionality [51,52].
This research takes into account the prediction of crown size under a given diameter, and does not take into account the correlation between the time dimension–tree age and crown size. The changes in biological characteristic variables of trees at different ages are dissimilar, and the changes in these characteristic variables are directly related to the crown size [53]. For example, the projected area of the tree canopy determines the shade intensity of the tree, which decreases with age [54]. In 2015, a study [36] redefined the growth of trees in the urban environment and studied the canopy structure of trees and their ecosystem services at different ages.
The general allometric theory [55] assumes that the ideal allometric growth exponent α of a tree is 2/3, thus, when the diameter increases by 1 cm, the tree height should theoretically increase by 0.67 m, which is the same for the allometric relationships of crown width, crown projection, and crown volume with diameter. However, whether urban or rural trees, the value of coefficient a and allometric growth exponent α will change due to the characteristics of trees [56], competition between adjacent tree species [56], habitat [36], and age [33]. Since this is the first study on urban trees in this locale, the allometric growth relationship of urban trees in adjacent coastal cities of Qingdao, northern China did not exist. Thus, we compared the research of Pretzsch et al. [21]. Our results for R. pseudoacacia show that crown width and DBH allometric growth exponent at 95% quantile is 0.7357, compared to a 0.5822 value from Pretzsch et al. [21] based on the global crown measurement data set. Based on 22 common urban trees, Pretzsch et al. [21] explored the allometric correlation between crown radius and diameter under open growth and quantified the crown size under a specific diameter of species. Our research is similar to it at a certain level. Our allometric relationship between crown projection area and DBH is consistent with the allometric correlation between crown width and DBH. When calculating the crown projection area and crown volume, we did not take into account the influence of tree crown shape in the results, as shown in Pretzsch et al. [21], but used a unified formula (Equations (2) and (3)), resulting in consistent results. However, Franceschi et al. [57] pointed out and explored the importance of crown shapes in quantifying crown size and estimated crown volume and ecosystem services such as shade area and cooling potential using different crown shape formulas. Previously, Purves et al. [58] also indicated a correlation between the canopy structure of tree allometric models.
The previous research has shown the importance of studying the allometric growth relationship of tree species in specific urban areas [34]. Establishing the allometric growth equation of trees in specific urban areas is important for selecting tree species and planting locations, determining planting growing space needs [59], and predicting ecosystem service functions [30,33,36,60]. The allometric relationships of urban tree species could be applied to other coastal regions in northern China.
4.3. Factors Affecting Allometric Growth Relationship
The allometric relationship of urban tree species is affected by multi-aspect factors. A few studies integrated climate, soil and other influencing factors into the allometric model, indicating the importance of climate, water, soil clay content, and other factors on the allometric growth relationship of urban tree species [61,62]. In our study, we only considered the allometric growth correlation of tree characteristic variables such as DBH, crown width, and tree height and did not take the influence of soil, climate, and management into consideration when running the allometric models. On the one hand, most of the urban street trees grow to a certain extent in the nursery and then are transplanted to the streets. There are differences in the growth conditions before and after, and there is no uniqueness. On the other hand, other studies showed that the effects of soil, climate, and slight pruning on the allometry of urban trees were greatly limited in local areas [63].
The biological characteristics of trees are important factors for the difference in allometric relationship among 15 tree species. In the study, it was found that the allometric exponent of the coniferous tree species C. deodara and P. thunbergii was significantly smaller than those of broadleaved tree species such as P. × acerifolia, F. chinensis, and S. japonicum in the 50% quantile, that is, the average state. This could be due to the biological characteristics of the slow growth of coniferous trees compared to broadleaved trees. In addition, strong-light and shade-intolerant tree species such as M. glyptostroboides and P. × acerifolia grow taller than slightly shade-tolerant tree species such as C. chinensis and F. chinensis in order to compete for more sunlight during growth.
The physiological and ecological indexes of different tree species are also very different. This is often determined by the environment and growth state suitable for tree growth. We listed three physiological and ecological indicators [64] of broad-leaved species P. × acerifolia and G. biloba and coniferous species P. thunbergii and C. deodara (Table 6).
Male G. biloba is one of the key street tree species planted in Qingdao in recent years. It creates a golden landscape for the city in late autumn, which is unattainable for conifers. It can be seen from Table 6 that G. biloba is relatively weak in shade and waterlogging resistance. In general, it is rarely planted in high-rise buildings to prevent blocking light from hindering the growth of G. biloba. Due to the growth law of trees, the growth rate is slow in the early stage. At present, most of the G. biloba tree species information we collected is in the early stage of growth, and the DBH is mostly between 15–25. It is also a broad-leaved tree. P. × acerifolia has strong shade tolerance, drought tolerance and waterlogging tolerance. It is an excellent street tree species. Compared with G. biloba, it grows faster, and the values of DBH, tree height, and crown width are also larger. Coniferous tree species are usually not used for the selection of urban street tree species. On the one hand, due to their own intolerance to pruning, they have poor tillering ability. On the other hand, most coniferous trees have weaker branch expansion ability than broad-leaved trees, that is, small crown width and poor shading. P. thunbergii is often used as a street tree species in Qingdao urban area, because P. thunbergii itself has acid-resistant soil and can grow in the Qingdao beach area.
This study showed that the coefficients of the allometric growth equation are equivalent to those in recent studies, but the results of individual tree species have obvious deviations [21,30,34]. Compared with the allometric growth of urban trees in other regions, we found that the growth of the same tree species in different environments also showed different allometric relationships, for instance the range of values with allometric growth exponents of trees varies greatly, which also confirms viewpoints in recent studies. The allometric growth exponent of trees under ideal growth in one location cannot widely represent different tree species in different regions under different growing conditions [21,26,63]. Collecting the information of tree characteristic variables in each region, establishing an independent allometric growth model, and exploring the growth changes in urban trees in this region could be a challenge for the urban forest managers and scientists.
5. Conclusions
We analyzed the allometric relationship between diameter with crown width, tree height, crown projection area, and crown volume of 15 common urban greening tree species in Qingdao, eastern China. Through the analysis of the fitting results, we found that the relationship between crown width and diameter was stronger than that between tree height and diameter, and the allometric relationship between different tree species was also largely different. In addition, we did not consider the influence of crown shape on the allometric relationship and the allometric relationship between crown projection area–diameter and crown width–diameter showed similar fitting.
Our research, in the first place, to a certain extent, provides a new direction for the study of urban forest development in Qingdao and even the other coastal regions of northern China. These data can be a source for quantifying economic and ecological benefits. In this study, the tree height and crown width of trees of all ages are visually displayed, which provides information support for urban managers to select tree species and estimate the demand for tree growing space.
Author Contributions
Conceptualization, H.L. and J.Z.; methodology, J.Y., H.L. and M.Z.; software, J.Y., M.Z. and H.L.; validation, H.L.; formal analysis, M.Z. and H.L.; investigation, J.Y., M.Z. and H.L.; data curation, H.L.; writing—original draft, M.Z.; writing—review & editing, J.Y., H.L., J.Z. and R.J.H.; supervision, H.L.; project administration, H.L.; funding acquisition, H.L. All authors have read and agreed to the published version of the manuscript.
Funding
This research was funded by financially supported by National Natural Science Foundation of China (No. 31800374), Natural Science Foundation of Shandong Province (No. ZR2019BC083), Shanghai Key Lab for Urban Ecological Processes and Eco-Restoration (No. SHUES2020A08), Qingdao Science and Technology Plan (23-2-8-cspz-11-nsh), the Research Foundation for Advanced Talents, Qingdao Agricultural University (No. 1118029), and the Shandong Forestry Science and Technology Innovation Project (2019LY004).
Data Availability Statement
Not applicable.
Acknowledgments
We thank several students from Qingdao Agricultural University and staff from Qingdao Nursery Stock Association for data collection and compiling. The manuscript also benefited from the constructive comments and suggestions by three anonymous reviewers.
Conflicts of Interest
The authors declare no conflict of interest.
Appendix A
Figure A1.
Residuals (in m) from existing 95% quantile height–diameter models for 15 tree species.

Figure A2.
Residuals (in m) from existing 95% quantile crown width-diameter models for 15 tree species.
Figure A2.
Residuals (in m) from existing 95% quantile crown width-diameter models for 15 tree species.

References
- Gómez-Baggethun, E.; Barton, D.N. Classifying and Valuing Ecosystem Services for Urban Planning. Ecol. Econ. 2013, 86, 235–245. [Google Scholar] [CrossRef]
- Elmqvist, T.; Setälä, H.; Handel, S.; Van Der Ploeg, S.; Aronson, J.; Blignaut, J.N.; Gomez-Baggethun, E.; Nowak, D.; Kronenberg, J.; De Groot, R. Benefits of Restoring Ecosystem Services in Urban Areas. Curr. Opin. Environ. Sustain. 2015, 14, 101–108. [Google Scholar] [CrossRef] [Green Version]
- Esperon-Rodriguez, M.; Rymer, P.D.; Power, S.A.; Barton, D.N.; Cariñanos, P.; Dobbs, C.; Eleuterio, A.A.; Escobedo, F.J.; Hauer, R.; Hermy, M.; et al. Assessing Climate Risk to Support Urban Forests in a Changing Climate. Plants People Planet 2022, 4, 201–213. [Google Scholar] [CrossRef]
- Jim, C.Y.; Chen, W.Y. Ecosystem Services and Valuation of Urban Forests in China. Cities 2009, 26, 187–194. [Google Scholar] [CrossRef]
- Wang, X.; Yao, J.; Yu, S.; Miao, C.; Chen, W.; He, X. Street Trees in a Chinese Forest City: Structure, Benefits and Costs. Sustainability 2018, 10, 674. [Google Scholar] [CrossRef] [Green Version]
- Escobedo, F.J.; Kroeger, T.; Wagner, J.E. Urban Forests and Pollution Mitigation: Analyzing Ecosystem Services and Disservices. Environ. Pollut. 2011, 159, 2078–2087. [Google Scholar] [CrossRef]
- Roy, S.; Byrne, J.; Pickering, C. A Systematic Quantitative Review of Urban Tree Benefits, Costs, and Assessment Methods across Cities in Different Climatic Zones. Urban For. Urban Green. 2012, 11, 351–363. [Google Scholar] [CrossRef] [Green Version]
- Hardin, P.J.; Jensen, R.R. The Effect of Urban Leaf Area on Summertime Urban Surface Kinetic Temperatures: A Terre Haute Case Study. Urban For. Urban Green. 2007, 6, 63–72. [Google Scholar] [CrossRef]
- Escobedo, F.J.; Wagner, J.E.; Nowak, D.J.; De la Maza, C.L.; Rodriguez, M.; Crane, D.E. Analyzing the Cost Effectiveness of Santiago, Chile’s Policy of Using Urban Forests to Improve Air Quality. J. Environ. Manag. 2008, 86, 148–157. [Google Scholar] [CrossRef]
- Chaparro, L.; Terradas, J. Ecological Services of Urban Forest in Barcelona; Institut Municipal de Parcs i Jardins Ajuntament de Barcelona, Àrea de Medi Ambient: Bellaterra, Spain, 2009. [Google Scholar]
- Fang, C.-F.; Ling, D.-L. Investigation of the Noise Reduction Provided by Tree Belts. Landsc. Urban Plan. 2003, 63, 187–195. [Google Scholar] [CrossRef]
- Ma, B.; Hauer, R.J.; Xu, C.; Li, W. Visualizing Evaluation Model of Human Perceptions and Characteristic Indicators of Landscape Visual Quality in Urban Green Spaces by Using Nomograms. Urban For. Urban Green. 2021, 65, 127314. [Google Scholar] [CrossRef]
- Bosch-Cano, F.; Bernard, N.; Sudre, B.; Gillet, F.; Thibaudon, M.; Richard, H.; Badot, P.-M.; Ruffaldi, P. Human Exposure to Allergenic Pollens: A Comparison between Urban and Rural Areas. Environ. Res. 2011, 111, 619–625. [Google Scholar] [CrossRef] [Green Version]
- Calfapietra, C.; Fares, S.; Manes, F.; Morani, A.; Sgrigna, G.; Loreto, F. Role of Biogenic Volatile Organic Compounds (BVOC) Emitted by Urban Trees on Ozone Concentration in Cities: A Review. Environ. Pollut. 2013, 183, 71–80. [Google Scholar] [CrossRef]
- Klein, R.W.; Koeser, A.K.; Hauer, R.J.; Hansen, G.; Escobedo, F.J. Risk Assessment and Risk Perception of Trees: A Review of Literature Relating to Arboriculture and Urban Forestry. Arboric. Urban For. 2019, 45, 26–38. [Google Scholar] [CrossRef]
- Nowak, D.J. Institutionalizing Urban Forestry as a “Biotechnology” to Improve Environmental Quality. Urban For. Urban Green. 2006, 5, 93–100. [Google Scholar] [CrossRef]
- Vogt, J.; Fischer, B.C.; Hauer, R.J. Urban Forestry and Arboriculture as Interdisciplinary Environmental Science: Importance and Incorporation of Other Disciplines. J. Environ. Stud. Sci. 2016, 6, 371–386. [Google Scholar] [CrossRef]
- Huxley, J.S.; Teissier, G. Terminology of Relative Growth. Nature 1936, 137, 780–781. [Google Scholar] [CrossRef]
- Pretzsch, H.; Dieler, J. Evidence of Variant Intra-and Interspecific Scaling of Tree Crown Structure and Relevance for Allometric Theory. Oecologia 2012, 169, 637–649. [Google Scholar] [CrossRef] [Green Version]
- Fu, L.; Sharma, R.P.; Hao, K.; Tang, S. A Generalized Interregional Nonlinear Mixed-Effects Crown Width Model for Prince Rupprecht Larch in Northern China. For. Ecol. Manag. 2017, 389, 364–373. [Google Scholar] [CrossRef]
- Pretzsch, H.; Biber, P.; Uhl, E.; Dahlhausen, J.; Rötzer, T.; Caldentey, J.; Koike, T.; Van Con, T.; Chavanne, A.; Seifert, T.; et al. Crown Size and Growing Space Requirement of Common Tree Species in Urban Centres, Parks, and Forests. Urban For. Urban Green. 2015, 14, 466–479. [Google Scholar] [CrossRef] [Green Version]
- Pretzsch, H.; Matthew, C.; Dieler, J. Allometry of Tree Crown Structure. Relevance for Space Occupation at the Individual Plant Level and for Self-Thinning at the Stand Level. In Growth and Defence in Plants; Springer: Berlin/Heidelberg, Germany, 2012; pp. 287–310. [Google Scholar]
- Randrup, T.; McPherson, E.; Costello, L. A Review of Tree Root Conflicts with Sidewalks, Curbs, and Roads. Urban Ecosyst. 2001, 5, 209–225. [Google Scholar] [CrossRef]
- Harrison, P.A.; Dunford, R.; Barton, D.N.; Kelemen, E.; Martín-López, B.; Norton, L.; Termansen, M.; Saarikoski, H.; Hendriks, K.; Gómez-Baggethun, E.; et al. Selecting Methods for Ecosystem Service Assessment: A Decision Tree Approach. Ecosyst. Serv. 2018, 29, 481–498. [Google Scholar] [CrossRef] [Green Version]
- Tyrväinen, L. Economic Valuation of Urban Forest Benefits in Finland. J. Environ. Manag. 2001, 62, 75–92. [Google Scholar] [CrossRef] [PubMed]
- Berland, A. Urban Tree Growth Models for Two Nearby Cities Show Notable Differences. Urban Ecosyst. 2020, 23, 1253–1261. [Google Scholar] [CrossRef]
- Hauer, R.J.; Hanou, I.S.; Sivyer, D. Planning for Active Management of Future Invasive Pests Affecting Urban Forests: The Ecological and Economic Effects of Varying Dutch Elm Disease Management Practices for Street Trees in Milwaukee, WI USA. Urban Ecosyst. 2020, 23, 1005–1022. [Google Scholar] [CrossRef]
- Vannatta, A.; Hauer, R.; Schuettpelz, N. Economic Analysis of Emerald Ash Borer (Coleoptera: Buprestidae) Management Options. J. Econ. Éntomol. 2012, 105, 196–206. [Google Scholar] [CrossRef]
- Pretzsch, H.; Biber, P.; Uhl, E.; Dahlhausen, J.; Schütze, G.; Perkins, D.; Rötzer, T.; Caldentey, J.; Koike, T.; van Con, T.; et al. Climate Change Accelerates Growth of Urban Trees in Metropolises Worldwide. Sci. Rep. 2017, 7, 1–10. [Google Scholar] [CrossRef] [Green Version]
- Monteiro, M.V.; Doick, K.J.; Handley, P. Allometric Relationships for Urban Trees in Great Britain. Urban For. Urban Green. 2016, 19, 223–236. [Google Scholar] [CrossRef]
- Timilsina, N.; Beck, J.L.; Eames, M.S.; Hauer, R.; Werner, L. A Comparison of Local and General Models of Leaf Area and Biomass of Urban Trees in USA. Urban For. Urban Green. 2017, 24, 157–163. [Google Scholar] [CrossRef] [Green Version]
- Day, S.D.; Eric Wiseman, P.; Dickinson, S.B.; Roger Harris, J. Tree Root Ecology in the Urban Environment and Implications for a Sustainable Rhizosphere. Arboric. Urban For. 2010, 36, 193. [Google Scholar] [CrossRef]
- Troxel, B.; Piana, M.; Ashton, M.S.; Murphy-Dunning, C. Relationships between Bole and Crown Size for Young Urban Trees in the Northeastern USA. Urban For. Urban Green. 2013, 12, 144–153. [Google Scholar] [CrossRef]
- Yoon, T.K.; Park, C.-W.; Lee, S.J.; Ko, S.; Kim, K.N.; Son, Y.; Lee, K.H.; Oh, S.; Lee, W.-K.; Son, Y. Allometric Equations for Estimating the Aboveground Volume of Five Common Urban Street Tree Species in Daegu, Korea. Urban For. Urban Green. 2013, 12, 344–349. [Google Scholar] [CrossRef]
- McHale, M.; Burke, I.; Lefsky, M.; Peper, P.; McPherson, E. Urban Forest Biomass Estimates: Is It Important to Use Allometric Relationships Developed Specifically for Urban Trees? Urban Ecosyst. 2009, 12, 95–113. [Google Scholar] [CrossRef]
- Moser, A.; Rötzer, T.; Pauleit, S.; Pretzsch, H. Structure and Ecosystem Services of Small-Leaved Lime (Tilia cordata Mill.) and Black Locust (Robinia pseudoacacia L.) in Urban Environments. Urban For. Urban Green. 2015, 14, 1110–1121. [Google Scholar] [CrossRef]
- Zang, H.; Lei, X.; Zeng, W. Height-Diameter Equations for Larch Plantations in Northern and Northeastern China: A Comparison of the Mixed-Effects, Quantile Regression and Generalized Additive Models. For. Int. J. For. Res. 2016, 89, 434–445. [Google Scholar] [CrossRef] [Green Version]
- McPherson, E.G.; van Doorn, N.S.; Peper, P.J. Urban Tree Database and Allometric Equations; General Technical Report PSW-GTR-253; US Department of Agriculture, Forest Service, Pacific Southwest Research Station: Albany, CA, USA, 2016; 86p.
- Shoda, T.; Imanishi, J.; Shibata, S. Growth Characteristics and Growth Equations of the Diameter at Breast Height Using Tree Ring Measurements of Street Trees in Kyoto City, Japan. Urban For. Urban Green. 2020, 49, 126627. [Google Scholar] [CrossRef]
- Yang, J.; Li, X.; Li, S.; Liang, H.; Lu, H. The Woody Plant Diversity and Landscape Pattern of Fine-Resolution Urban Forest along a Distance Gradient from Points of Interest in Qingdao. Ecol. Indic. 2021, 122, 107326. [Google Scholar] [CrossRef]
- Preuhsler, T. Ertragskundliche Merkmale Oberbayerischer Bergmischwald-Verjüngungsbestände Auf Kalkalpinen Standorten Im Forstamt Kreuth. Forstwiss. Centralblatt 1981, 100, 313–345. [Google Scholar] [CrossRef]
- Koenker, R.; Portnoy, S.; Ng, P.T.; Melly, B.; Zeileis, A.; Grosjean, P.; Saad, Y.; Chernozhukov, V.; Fernandez-Val, I. Quantreg: Quantile Regression. In R Package; Version 5.05; R Foundation for Statistical Computing: Vienna, Austria, 2013; Available online: http://CRAN.R-project.org/package=quantreg (accessed on 22 July 2022).
- Koenker, R.; Hallock, K.F. Quantile Regression. J. Econ. Perspect. 2001, 15, 143–156. [Google Scholar] [CrossRef]
- Rust, S. Analysis of Regional Variation of Height Growth and Slenderness in Populations of Six Urban Tree Species Using a Quantile Regression Approach. Urban For. Urban Green. 2014, 13, 336–343. [Google Scholar] [CrossRef]
- Vogt, J.; Hauer, R.J.; Fischer, B.C. The Costs of Maintaining and Not Maintaining the Urban Forest: A Review of the Urban Forestry and Arboriculture Literature. Arboric. Urban For. 2015, 41, 293–323. [Google Scholar] [CrossRef]
- Peper, P.J.; McPherson, E.G.; Mori, S.M. Equations for Predicting Diameter, Height, Crown Width, and Leaf Area of San Joaquin Valley Street Trees. Arboric. Urban For. 2001, 27, 306–317. [Google Scholar] [CrossRef]
- Zheng, J.; Zang, H.; Yin, S.; Sun, N.; Zhu, P.; Han, Y.; Kang, H.; Liu, C. Modeling Height-Diameter Relationship for Artificial Monoculture Metasequoia Glyptostroboides in Sub-Tropic Coastal Megacity Shanghai, China. Urban For. Urban Green. 2018, 34, 226–232. [Google Scholar] [CrossRef]
- Foli, E.; Alder, D.; Miller, H.; Swaine, M. Modelling Growing Space Requirements for Some Tropical Forest Tree Species. For. Ecol. Manag. 2003, 173, 79–88. [Google Scholar] [CrossRef]
- Schmucker, J.; Uhl, E.; Steckel, M.; Pretzsch, H. Crown Allometry and Growing Space Requirements of Four Rare Domestic Tree Species Compared to Oak and Beech: Implications for Adaptive Forest Management. Eur. J. For. Res. 2022, 141, 587–604. [Google Scholar] [CrossRef]
- Zhang, W.-P.; Zhao, L.; Larjavaara, M.; Morris, E.C.; Sterck, F.J.; Wang, G.-X. Height-Diameter Allometric Relationships for Seedlings and Trees across China. Acta Oecologica 2020, 108, 103621. [Google Scholar] [CrossRef]
- Devisscher, T.; Ordóñez-Barona, C.; Dobbs, C.; Baptista, M.D.; Navarro, N.M.; Aguilar, L.A.O.; Perez, J.F.C.; Mancebo, Y.R.; Escobedo, F.J. Urban Forest Management and Governance in Latin America and the Caribbean: A Baseline Study of Stakeholder Views. Urban For. Urban Green. 2022, 67, 127441. [Google Scholar] [CrossRef]
- John Barker, E.; Andy Kenney, W. Urban Forest Management in Small Ontario Municipalities. For. Chron. 2012, 88, 118–123. [Google Scholar] [CrossRef]
- Stoffberg, G.; Van Rooyen, M.; Van der Linde, M.; Groeneveld, H. Predicting the Growth in Tree Height and Crown Size of Three Street Tree Species in the City of Tshwane, South Africa. Urban For. Urban Green. 2008, 7, 259–264. [Google Scholar] [CrossRef]
- Chreptun, C. Kronenstruktureigenschaften von Linden Und Robinien in München: Anwendungen Des Terrestrischen Laserscannings. PhD Thesis, Technische Universität München, München, Germany, 2015. [Google Scholar]
- West, G.B.; Enquist, B.J.; Brown, J.H. A General Quantitative Theory of Forest Structure and Dynamics. Proc. Natl. Acad. Sci. USA 2009, 106, 7040–7045. [Google Scholar] [CrossRef] [Green Version]
- Forrester, D.I.; Benneter, A.; Bouriaud, O.; Bauhus, J. Diversity and Competition Influence Tree Allometric Relationships–Developing Functions for Mixed-Species Forests. J. Ecol. 2017, 105, 761–774. [Google Scholar] [CrossRef] [Green Version]
- Franceschi, E.; Moser-Reischl, A.; Rahman, M.A.; Pauleit, S.; Pretzsch, H.; Rötzer, T. Crown Shapes of Urban Trees-Their Dependences on Tree Species, Tree Age and Local Environment, and Effects on Ecosystem Services. Forests 2022, 13, 748. [Google Scholar] [CrossRef]
- Purves, D.W.; Lichstein, J.W.; Pacala, S.W. Crown Plasticity and Competition for Canopy Space: A New Spatially Implicit Model Parameterized for 250 North American Tree Species. PLoS ONE 2007, 2, e870. [Google Scholar] [CrossRef] [PubMed]
- Sanders, J.; Grabosky, J.; Cowie, P. Establishing Maximum Size Expectations for Urban Trees with Regard to Designed Space. Arboric. Urban For. 2013, 39, 68–73. [Google Scholar] [CrossRef]
- Bolund, P.; Hunhammar, S. Ecosystem Services in Urban Areas. Ecol. Econ. 1999, 29, 293–301. [Google Scholar] [CrossRef]
- Cysneiros, V.C.; de Souza, F.C.; Gaui, T.D.; Pelissari, A.L.; Orso, G.A.; Machado, S.D.A.; de Carvalho, D.C.; Silveira-Filho, T.B. Integrating Climate, Soil and Stand Structure into Allometric Models: An Approach of Site-Effects on Tree Allometry in Atlantic Forest. Ecol. Indic. 2021, 127, 107794. [Google Scholar] [CrossRef]
- Sharma, R.P.; Vacek, Z.; Vacek, S. Individual Tree Crown Width Models for Norway Spruce and European Beech in Czech Republic. For. Ecol. Manag. 2016, 366, 208–220. [Google Scholar] [CrossRef]
- Coombes, A.; Martin, J.; Slater, D. Defining the Allometry of Stem and Crown Diameter of Urban Trees. Urban For. Urban Green. 2019, 44, 126421. [Google Scholar] [CrossRef]
- Niinemets, Ü.; Valladares, F. Tolerance to Shade, Drought, and Waterlogging of Temperate Northern Hemisphere Trees and Shrubs. Ecol. Monogr. 2006, 76, 521–547. [Google Scholar] [CrossRef]
Figure 1.
The location (A); three types of urban development zones (B); and the terrain. as well as main road (C), of the study area.
Figure 1.
The location (A); three types of urban development zones (B); and the terrain. as well as main road (C), of the study area.

Figure 2.
Quantile regression results (95%, 50%, and 5% quantiles) for the allometric relationship between tree diameter (DBH at 1.3 m) and tree height H ln (H) = a + α × ln (DBH) for 15 tree species.
Figure 2.
Quantile regression results (95%, 50%, and 5% quantiles) for the allometric relationship between tree diameter (DBH at 1.3 m) and tree height H ln (H) = a + α × ln (DBH) for 15 tree species.

Figure 3.
Quantile regression results (95%, 50%, and 5% quantiles) for the allometric relationship between tree diameter (DBH at 1.3 m) and crown width (CW) by the equation ln (CW) = a + α × ln (DBH) for 15 tree species.
Figure 3.
Quantile regression results (95%, 50%, and 5% quantiles) for the allometric relationship between tree diameter (DBH at 1.3 m) and crown width (CW) by the equation ln (CW) = a + α × ln (DBH) for 15 tree species.

Figure 4.
Quantile regression results (95%, 50%, and 5% quantiles) for the allometric relationship between diameter at breast height (DBH) and crown projection area (CPA) by the equation ln (CPA) = a + α × ln (DBH) for 15 tree species.
Figure 4.
Quantile regression results (95%, 50%, and 5% quantiles) for the allometric relationship between diameter at breast height (DBH) and crown projection area (CPA) by the equation ln (CPA) = a + α × ln (DBH) for 15 tree species.

Figure 5.
Quantile regression results (95%, 50%, and 5% quantiles) for the allometric relationship between diameter at breast height (DBH) and crown volume (CV) by the equation ln (CV) = a + α × ln (DBH) for 15 tree species.
Figure 5.
Quantile regression results (95%, 50%, and 5% quantiles) for the allometric relationship between diameter at breast height (DBH) and crown volume (CV) by the equation ln (CV) = a + α × ln (DBH) for 15 tree species.


Table 1.
Data Variables Collected for Common Greening Tree Species in Qingdao.
| Species | n | Tree DBH (cm) | Tree Height (m) | Crown Width (m) | |||||||||
|---|---|---|---|---|---|---|---|---|---|---|---|---|---|
| Min | Max | Mean | Sd | Min | Max | Mean | Sd | Min | Max | Mean | Sd | ||
| Platanus × acerifolia | 2630 | 7.5 | 100.4 | 30.2 | 11.4 | 3.0 | 27.0 | 10.8 | 3.2 | 0.5 | 21.3 | 7.6 | 3.0 |
| Fraxinus chinensis | 1057 | 10.0 | 47.1 | 21.0 | 7.2 | 3.0 | 16.0 | 8.3 | 2.5 | 1.0 | 14.1 | 6.0 | 2.3 |
| Prunus cerasus | 85 | 5.9 | 22.0 | 14.2 | 3.5 | 2.0 | 6.0 | 4.4 | 1.1 | 0.5 | 6.0 | 2.9 | 0.9 |
| Ginkgo biloba | 418 | 6.2 | 33.8 | 18.4 | 4.6 | 3.0 | 15.0 | 8.4 | 2.0 | 1.0 | 9.2 | 3.7 | 1.5 |
| Koelreuteria paniculata | 179 | 10.0 | 36.1 | 20.7 | 5.0 | 4.1 | 13.5 | 8.5 | 1.6 | 2.0 | 9.8 | 5.2 | 1.7 |
| Ailanthus altissima | 73 | 9.8 | 46.8 | 27.4 | 8.3 | 5.0 | 17.5 | 11.7 | 2.6 | 2.5 | 10.5 | 6.6 | 1.8 |
| Styphnolobium japonicum | 287 | 7.8 | 46.4 | 23.4 | 7.6 | 3.5 | 12.8 | 7.7 | 1.9 | 1.5 | 13.5 | 6.7 | 1.9 |
| Cercis chinensis | 85 | 9.0 | 18.7 | 13.3 | 2.5 | 5.0 | 8.0 | 6.7 | 0.9 | 1.0 | 7.6 | 4.3 | 1.7 |
| Pinus thunbergii | 163 | 10.2 | 36.8 | 17.9 | 4.7 | 2.5 | 10.0 | 5.7 | 1.5 | 1.5 | 7.0 | 4.3 | 1.0 |
| Robinia pseudoacacia | 83 | 15.9 | 40.1 | 24.8 | 6.8 | 5.1 | 11.0 | 7.2 | 1.3 | 3.2 | 8.0 | 4.5 | 1.2 |
| Metasequoia glyptostroboides | 64 | 12.7 | 59.5 | 31.7 | 12.6 | 5.7 | 18.2 | 17.9 | 4.9 | 1.5 | 6.5 | 4.0 | 1.3 |
| Cedrus deodara | 184 | 7.0 | 66.3 | 39.5 | 9.0 | 4.5 | 23.0 | 12.9 | 3.3 | 3.2 | 27.7 | 8.6 | 2.7 |
| Populus spp. | 46 | 16.3 | 70.0 | 38.9 | 13.9 | 5.0 | 18.0 | 12.1 | 3.7 | 2.0 | 13.0 | 7.7 | 2.5 |
| Firmiana simplex | 221 | 12.5 | 63.4 | 34.4 | 9.3 | 5.0 | 15.5 | 12.4 | 1.6 | 3.0 | 14.8 | 8.4 | 2.3 |
| Salix matsudana | 73 | 17.7 | 87.6 | 38.2 | 12.5 | 4.5 | 16.0 | 10.3 | 3.0 | 3.0 | 10.3 | 6.5 | 1.9 |
n = sample size, DBH = diameter in breast height (1.3 m).
Table 2.
Quantile regression results for the tree height and stem diameter (DBH) allometry (95%−quantile).
Table 2.
Quantile regression results for the tree height and stem diameter (DBH) allometry (95%−quantile).
| Species | a | Std. Err. (a) | t (a) | p (a) | α | Std. Err. (α) | t (α) | p (α) |
|---|---|---|---|---|---|---|---|---|
| Platanus × acerifolia | 0.6782 | 0.0252 | 26.9184 | 0.0000 | 0.3485 | 0.0152 | 22.9473 | 0.0000 |
| Fraxinus chinensis | 0.3157 | 0.0467 | 6.7553 | 0.0000 | 0.5624 | 0.0336 | 16.7310 | 0.0000 |
| Prunus cerasus | 0.2898 | 0.3288 | 0.8813 | 0.3807 | 0.4075 | 0.2744 | 1.4848 | 0.1414 |
| Ginkgo biloba | 0.4534 | 0.0757 | 5.9876 | 0.0000 | 0.4780 | 0.0604 | 7.9115 | 0.0000 |
| Koelreuteria paniculata | 0.3761 | 0.1709 | 2.2012 | 0.0290 | 0.4990 | 0.1324 | 3.7678 | 0.0002 |
| Ailanthus altissima | 0.7393 | 0.3579 | 2.0656 | 0.0425 | 0.3280 | 0.2646 | 1.2310 | 0.2191 |
| Styphnolobium japonicum | 0.2312 | 0.1355 | 1.707 | 0.0889 | 0.5696 | 0.0965 | 5.9060 | 0.0000 |
| Cercis chinensis | 0.9031 | 0.0329 | 27.4725 | 0.0000 | 0.0000 | 0.0288 | 0.0000 | 1.0000 |
| Pinus thunbergii | 0.4335 | 0.1393 | 3.1125 | 0.0022 | 0.3684 | 0.1149 | 3.2077 | 0.0016 |
| Robinia pseudoacacia | 0.6588 | 0.1965 | 3.3536 | 0.0012 | 0.2242 | 0.1452 | 1.54404 | 0.1265 |
| Metasequoia glyptostroboides | 0.8228 | 0.0569 | 14.4566 | 0.0000 | 0.3566 | 0.0441 | 8.0891 | 0.0000 |
| Cedrus deodara | 0.6504 | 0.2020 | 3.2195 | 0.0015 | 0.3943 | 0.1265 | 3.1161 | 0.0021 |
| Populus spp. | 1.7146 | 0.0995 | 17.2282 | 0.0000 | −0.3111 | 0.0567 | −5.4874 | 0.0000 |
| Firmiana simplex | 1.1410 | 0.0390 | 29.2232 | 0.0000 | 0.0186 | 0.0256 | 0.7249 | 0.4693 |
| Salix matsudana | 0.8294 | 0.2680 | 3.0949 | 0.0028 | 0.2187 | 0.1771 | 1.2346 | 0.2211 |
Parameter estimates for growth intercept (a) and growth exponent (α); standard errors (std. err.); t-value (t); and significance level (p).
Table 3.
Quantile regression results for the crown width-stem diameter allometry (95%−quantile).
| Species | a | Std. Err. (a) | t (a) | p (a) | α | Std. Err. (α) | t (α) | p (α) |
|---|---|---|---|---|---|---|---|---|
| Platanus × acerifolia | 0.0922 | 0.0256 | 3.5993 | 0.0003 | 0.6588 | 0.0140 | 46.9119 | 0.0000 |
| Fraxinus chinensis | −0.0204 | 0.0495 | −0.4117 | 0.6806 | 0.7253 | 0.0312 | 23.2426 | 0.0000 |
| Prunus cerasus | 0.6532 | 0.1558 | 4.1931 | 0.0001 | 0.0000 | 0.1424 | 0.0000 | 1.0000 |
| Ginkgo biloba | −0.1733 | 0.1763 | −0.9832 | 0.3261 | 0.7300 | 0.1362 | 5.3613 | 0.0000 |
| Koelreuteria paniculata | 0.0884 | 0.2146 | 0.4117 | 0.6811 | 0.5908 | 0.1618 | 3.6513 | 0.0003 |
| Ailanthus altissima | 0.5570 | 0.2564 | 2.1728 | 0.0331 | 0.2838 | 0.1669 | 1.7001 | 0.0935 |
| Styphnolobium japonicum | 0.1396 | 0.0616 | 2.2674 | 0.0241 | 0.5875 | 0.0486 | 12.0870 | 0.0000 |
| Cercis chinensis | −2.1006 | 0.1965 | −10.6923 | 0.0000 | 2.5117 | 0.1772 | 14.1786 | 0.0000 |
| Pinus thunbergii | 0.2942 | 0.0837 | 3.5140 | 0.0006 | 0.3632 | 0.0621 | 5.8534 | 0.0000 |
| Robinia pseudoacacia | −0.2550 | 0.1623 | −1.5708 | 0.1201 | 0.7357 | 0.1124 | 6.5477 | 0.0000 |
| Metasequoia glyptostroboides | 0.5476 | 0.2014 | 2.7187 | 0.0085 | 0.1445 | 0.1258 | 1.1488 | 0.2550 |
| Cedrus deodara | 1.0899 | 0.4167 | 2.6155 | 0.0097 | 0.0104 | 0.2593 | 0.0401 | 0.9681 |
| Populus spp. | 0.3172 | 0.5334 | 0.5947 | 0.5551 | 0.4618 | 0.3089 | 1.4951 | 0.1420 |
| Firmiana simplex | −0.0755 | 0.0667 | −1.1328 | 0.2586 | 0.7274 | 0.0480 | 15.1501 | 0.0000 |
| Salix matsudana | 0.5894 | 0.2315 | 2.5457 | 0.0131 | 0.2523 | 0.1355 | 1.8617 | 0.0668 |
Parameter estimates for growth intercept (a) and growth exponent (α); standard errors (std. err.); t-value (t); and significance level (p).
Table 4.
Quantile regression results for the crown projection area and stem diameter (DBH at 1.3 m) allometry (95%-quantile).
Table 4.
Quantile regression results for the crown projection area and stem diameter (DBH at 1.3 m) allometry (95%-quantile).
| Species | a | Std. Err. (a) | t (a) | p (a) | α | Std. Err. (α) | t (α) | p (α) |
|---|---|---|---|---|---|---|---|---|
| Platanus × acerifolia | 0.0794 | 0.0512 | 1.5508 | 0.1211 | 1.3175 | 0.0281 | 46.9086 | 0.0000 |
| Fraxinus chinensis | −0.1457 | 0.0991 | −1.4705 | 0.1417 | 1.4506 | 0.06241 | 23.2425 | 0.0000 |
| Prunus cerasus | 1.2015 | 0.3116 | 3.8564 | 0.0002 | 0.0000 | 0.2849 | 0.0000 | 1.0000 |
| Ginkgo biloba | −0.4516 | 0.3526 | −1.2807 | 0.2010 | 1.4601 | 0.2723 | 5.3613 | 0.0000 |
| Koelreuteria paniculata | 0.0718 | 0.4292 | 0.1673 | 0.8673 | 1.1816 | 0.3236 | 3.6513 | 0.0003 |
| Ailanthus altissima | 1.0091 | 0.5127 | 1.9681 | 0.0530 | 0.5676 | 0.3338 | 1.7001 | 0.0935 |
| Styphnolobium japonicum | 0.1743 | 0.1232 | 1.4156 | 0.1580 | 1.1750 | 0.0972 | 12.0870 | 0.0000 |
| Cercis chinensis | −4.3061 | 0.3929 | −10.9593 | 0.0000 | 5.0234 | 0.3543 | 14.1786 | 0.0000 |
| Pinus thunbergii | 0.4834 | 0.1674 | 2.8874 | 0.0044 | 0.7265 | 0.1241 | 5.8534 | 0.0000 |
| Robinia pseudoacacia | −0.6149 | 0.3247 | −1.8940 | 0.0618 | 1.4715 | 0.2247 | 6.5477 | 0.0000 |
| Metasequoia glyptostroboides | 0.9903 | 0.4028 | 2.4583 | 0.0168 | 0.2889 | 0.2515 | 1.1488 | 0.2550 |
| Cedrus deodara | 2.0749 | 0.8335 | 2.4896 | 0.0137 | 0.0208 | 0.5186 | 0.0401 | 0.9681 |
| Populus spp. | 0.5295 | 1.0668 | 0.4964 | 0.6221 | 0.9236 | 0.6178 | 1.4951 | 0.1420 |
| Firmiana simplex | −0.2559 | 0.1333 | −1.9198 | 0.0562 | 1.4547 | 0.0960 | 15.1501 | 0.0000 |
| Salix matsudana | 1.0739 | 0.4631 | 2.3191 | 0.0233 | 0.5046 | 0.2710 | 1.8617 | 0.0668 |
Parameter estimates for growth intercept (a) and growth exponent (α); standard errors (std. err.), t-value (t); and significance level (p).
Table 5.
Quantile regression results for the crown volume and stem diameter (DBH at 1.3 m) allometry (95%-quantile).
Table 5.
Quantile regression results for the crown volume and stem diameter (DBH at 1.3 m) allometry (95%-quantile).
| Species | a | Std. Err. (a) | t (a) | p (a) | α | Std. Err. (α) | t (α) | p (α) |
|---|---|---|---|---|---|---|---|---|
| Platanus × acerifolia | 0.4342 | 0.1349 | 3.2196 | 0.0013 | 1.7755 | 0.0834 | 21.2980 | 0.0000 |
| Fraxinus chinensis | −0.5079 | 0.2019 | −2.5152 | 0.0120 | 2.3664 | 0.1372 | 17.2487 | 0.0000 |
| Prunus cerasus | 1.0937 | 0.5769 | 1.8958 | 0.0615 | 0.6477 | 0.4929 | 1.3141 | 0.1925 |
| Ginkgo biloba | −0.6534 | 0.3223 | −2.0272 | 0.0433 | 2.2636 | 0.2384 | 9.4956 | 0.0000 |
| Koelreuteria paniculata | −0.4227 | 0.4498 | −0.9397 | 0.3486 | 2.1490 | 0.3157 | 6.8064 | 0.0000 |
| Ailanthus altissima | 1.5308 | 0.4448 | 3.4416 | 0.0010 | 0.8810 | 0.2793 | 3.1545 | 0.0024 |
| Styphnolobium japonicum | 0.2802 | 0.1951 | 1.4363 | 0.1520 | 1.6605 | 0.1218 | 13.6326 | 0.0000 |
| Cercis chinensis | −3.4541 | 0.6360 | −5.4313 | 0.0000 | 4.9176 | 0.5434 | 9.0502 | 0.0000 |
| Pinus thunbergii | 0.2878 | 0.2320 | 1.2405 | 0.2166 | 1.3851 | 0.1709 | 8.1035 | 0.0000 |
| Robinia pseudoacacia | −1.0522 | 0.5781 | −1.8200 | 0.0725 | 2.2688 | 0.4225 | 5.3698 | 0.0000 |
| Metasequoia glyptostroboides | 1.1750 | 0.2344 | 5.0120 | 0.0000 | 0.9454 | 0.1416 | 6.6779 | 0.0000 |
| Cedrus deodara | 2.6802 | 1.0283 | 2.6064 | 0.0099 | 0.3385 | 0.6155 | 0.5499 | 0.5831 |
| Populus spp. | 1.5983 | 0.2577 | 6.2031 | 0.0000 | 0.8401 | 0.1493 | 5.6266 | 0.0000 |
| Firmiana simplex | 0.7884 | 0.3483 | 2.2639 | 0.0246 | 1.4006 | 0.2350 | 6.0384 | 0.0000 |
| Salix matsudana | 1.9686 | 0.4972 | 3.9589 | 0.0002 | 0.6290 | 0.2888 | 2.1779 | 0.0327 |
Parameter estimates for growth intercept (a) and growth exponent (α); standard errors (std. err.), t-value (t); and significance level (p).
Table 6.
Physiological and ecological indexes of tree species (P. × acerifolia, G. biloba, P. thunbergii, C. deodara) [64].
Table 6.
Physiological and ecological indexes of tree species (P. × acerifolia, G. biloba, P. thunbergii, C. deodara) [64].
| Species | Shade Tolerance Index | Drought Tolerance Index | Waterlogging Tolerance Index |
|---|---|---|---|
| Platanus × acerifolia | 3 | 3.5 | 2 |
| Ginkgo biloba | 1.34 ± 0.33 | 3.99 ± 0.47 | 1.13 ± 0.27 |
| Pinus thunbergii | 1.35 | 4.03 ± 0.18 | 1.02 ± 0.02 |
| Cedrus deodara | 2.59 ± 0.41 | 3.85 ± 0.15 | 1.02 ± 0.02 |
Disclaimer/Publisher’s Note: The statements, opinions and data contained in all publications are solely those of the individual author(s) and contributor(s) and not of MDPI and/or the editor(s). MDPI and/or the editor(s) disclaim responsibility for any injury to people or property resulting from any ideas, methods, instructions or products referred to in the content. |
© 2023 by the authors. Licensee MDPI, Basel, Switzerland. This article is an open access article distributed under the terms and conditions of the Creative Commons Attribution (CC BY) license (https://creativecommons.org/licenses/by/4.0/).
Share and Cite
MDPI and ACS Style
Yang, J.; Zhang, M.; Zhang, J.; Lu, H.; Hauer, R.J. Allometric Growth of Common Urban Tree Species in Qingdao City of Eastern China. Forests 2023, 14, 472. https://0-doi-org.brum.beds.ac.uk/10.3390/f14030472
AMA Style
Yang J, Zhang M, Zhang J, Lu H, Hauer RJ. Allometric Growth of Common Urban Tree Species in Qingdao City of Eastern China. Forests. 2023; 14(3):472. https://0-doi-org.brum.beds.ac.uk/10.3390/f14030472
Chicago/Turabian StyleYang, Jinming, Mengfan Zhang, Jian Zhang, Huicui Lu, and Richard J. Hauer. 2023. "Allometric Growth of Common Urban Tree Species in Qingdao City of Eastern China" Forests 14, no. 3: 472. https://0-doi-org.brum.beds.ac.uk/10.3390/f14030472
Note that from the first issue of 2016, this journal uses article numbers instead of page numbers. See further details here.