Article

Identifying Nutrient Export Hotspots Using a Spatially Distributed Model in Boreal-Forested Catchments

1
School of Forest Sciences, Faculty of Science and Forestry, Joensuu Campus, University of Eastern Finland, Yliopistokatu 7, FI-80101 Joensuu, Finland
2
Natural Resources Institute Finland (Luke), Latokartanonkaari 9, FI-00790 Helsinki, Finland
3
Department of Forest Sciences, University of Helsinki, Latokartanonkaari 7, FI-00014 Helsinki, Finland
4
Natural Resources Institute Finland (Luke), Yliopistokatu 6, FI-80100 Joensuu, Finland
*
Author to whom correspondence should be addressed.
These authors contributed equally to this work.
Submission received: 5 February 2023 / Revised: 12 March 2023 / Accepted: 14 March 2023 / Published: 19 March 2023
(This article belongs to the Special Issue Forest Management, Hydrology and Biogeochemistry Modelling)

Abstract

:
The implementation of the Water Framework Directive (WFD) aimed to reduce nutrient export from catchments to water courses. Forest operations cause diffuse loading, which challenges the efficient targeting of water protection measures. We formed 100 equally probable clear-cut scenarios, to investigate how the location of the clear-cuts influenced the total nitrogen (TN) and phosphorous (TP) export on different scales. The nutrient export was calculated by using a distributed nutrient export model (NutSpaFHy). The clear-cut-induced excess TN and TP exports varied by 4.2%–5.5% and 5.0%–6.5%, respectively, between the clear-cut scenarios. We analyzed how the sub-catchment characteristics regulated the background export. The results also suggested that there was no single sub-catchment feature, which explained the variation in the TN and TP exports. There were clear differences in the background export and in the clear-cut-induced export between the sub-catchments. We also found that only 5% of the forest area could contribute up to half of the total nutrient export. Based on our results, we presented a conceptual planning framework, which applied the model results to finding areas where the nutrient export was high. Application of this information could improve the overall effectiveness of the water protection measures used in forestry.

1. Introduction

The European Union’s Water Framework Directive (WFD) forbids deterioration of the chemical and ecological status of water bodies [1]. If the status of the water body is worse than ’Good’ in the WFD classification scheme, then active measures, both in the water bodies and in their catchments, are required, to reclaim the ’Good’ status [2]. The aim of water protection is to reduce the export of nutrients and suspended solids to a level where the recovery of the water body is possible. In Finland, boreal forests cover approximately ¾ of the total land area [3], and the majority of this area is privately owned and commercially managed; therefore, forestry plays a key role in implementing the WFD obligations.
Forestry operations, such as final fellings, cause diffuse nutrient load [4,5], meaning that the elevated nutrient export emerges in large areas simultaneously. A typical clear-cut size in southern Finland is less than 2 hectares [6]. Because the rotation period from regeneration to the final felling is typically tens of decades, less than 2% of the forestry area becomes clear-cut annually [3].
The clear-cut and the following site preparation alter the water and nutrient fluxes [4,7], and induce increased nutrient leaching. The nutrient cycle in boreal forests is tight [8], and excess nutrients are efficiently taken up by trees, ground vegetation and soil microbes [9,10]; nevertheless, elevated nutrient concentrations in runoff water are observed regularly for several years after the clear-cut [4,11,12,13,14,15,16,17,18,19,20], because the removal of the tree biomass decreases interception and transpiration, raises the water table and increases the runoff [21,22]. At the same time, litter decomposition [23] and nitrification rates are accelerated [24,25], due to the increased soil temperature [26]. The nutrient supply exceeds the nutrient demand, as the uptake by trees collapses [27,28] and the remaining logging residues release nutrients [29]. Site preparation can further decrease the ground vegetation biomass, and add decomposing litter to the soil, thus increasing the release of nutrients [30].
Recent studies suggest that total nitrogen (TN) and phosphorus (TP) exports are not decreasing, either on the national scale [31,32] or on the headwater catchment scale, in Finland [5,33,34], which may jeopardize the attainment of the WFD goals [31]. The main drivers behind this increasing trend in nutrient export are likely the gradual changes in the climate, and atmospheric deposition [5]. The trend is pronounced in peatland-dominated catchments [32], which are very common in Finland, as the peatlands cover a fifth of the total forest area [3]. The peatlands contain a vast storage of organic matter, which is susceptible to enhanced biological decomposition by increased soil temperatures [35]. The effect is further amplified if the water table lowers and exposes peat to aerobic decomposition [36]. With decomposition, nutrients are released [37] to the soil solution, and can be exported further to the water bodies, thus increasing nutrient exports to water courses.
The above, together with increasing harvesting, calls for efficient methods of planning and implementing water protection measures [2,38]. Diverting water protection investments equally over the whole area or applying similar water protection methods everywhere decreases the overall cost efficiency of the water protection [39]. Thus, there is an urgent need for the development and implementation of more efficient water protection that will allow specific targeting of the water protection measures to places where the nutrient export risk is highest [40], considering the catchment characteristics regulating the export [41]. In this study, we applied a distributed nutrient model, to identify the high nutrient export risk areas, and we discuss whether the identification can be used to direct water protection measures efficiently.
The magnitude and duration of the nutrient export caused by clear-cutting depend on several location-specific factors, such as catchment topography, soil properties, site fertility, atmospheric deposition, vegetation recovery, the timing of management practices, weather conditions and distance to water courses [4,7,19,30,41,42,43,44,45]. Catchment characteristics contribute to the timing of elevated nitrogen (N) concentrations in stream water after the clear-cutting [46]. Water N concentrations can increase quickly in areas with high atmospheric deposition and/or fertile soils. By contrast, the response can be delayed and low in low-fertility and low-atmospheric deposition areas, such as Finland and central and northern Sweden [41,43,47], because the growth of boreal upland forests is nitrogen-limited [8]. Any surplus N from the atmospheric deposition, or any other source, will efficiently be retained in the stand, ground vegetation, soil and microbes; consequently, the leaching losses will remain very low [48], especially in low-fertility sites [49]. In sparsely populated areas in central and northern Finland and Sweden, the atmospheric deposition is low [50].
Statistically significant effects of clear-cutting on water quality can be difficult to separate by using a paired catchment method [4,51], because the treatment effect can become masked behind the large natural variation in the nutrient export [51]: this highlights the need to account for the processes affecting the nutrient retention along the flow paths. Based on paired catchment studies, Palviainen et al. [4] found that clear-cutting significantly increased N and phosphorus (P) exports only when the clear-cut area exceeded 30% of the total catchment area.
Blackburn et al. [45] concluded that N export to stream is driven by biogeochemical processes and hydrological routing in riparian zones, emphasizing the role of the near-stream areas as nutrient export hotspots or nutrient-retaining buffer zones. Undisturbed riparian buffer zones can considerably decrease the nutrient export [9] because, during the transport, nutrients can be retained in soil, vegetation and microbes before reaching the water body. However, if near-stream areas are disturbed, the nutrient retention may decrease and, consequently, the nutrient transport to the stream increases [45].
The specific load method [4,52] is currently used in Finland to estimate forestry-induced nutrient export to watercourses. The specific load method is based on coefficients that are determined separately for each management measure at mineral and peatland sites (kg ha−1year−1) using paired catchments experiments [4,19,51,53,54,55]. The specific load coefficients represent the average excess load caused by the management measure. The specific load method is easy to apply, but the experimental quantification of the coefficients takes years, is very expensive and the number of paired catchment studies for a management method remains small. Furthermore, the method is not responsive to changing weather conditions, location of treatments, or interconnected biogeochemical processes changing along the flow path of the water [9,40,41,56]. Therefore, it is necessary to develop and use methods that include the most important biogeochemical processes, catchment properties and the explicit locations of clear-cuts.
We used the NutSpaFHy-model [57] to estimate how the positioning of clear-cuts affected TN and TP exports in an area consisting of 33 sub-catchments in southeastern Finland. NutSpaFHy is a spatially distributed nutrient export model incorporating grid-(16 m × 16 m)-based nutrient balance calculation into a hydrological model SpaFHy [58], and including a conceptual solute transport routine to approximate N and P exports to the sub-catchment outlets [57]. The model was parameterized using up-to-date forest inventory data, which allowed for realistic positioning of potential clear-cut sites. The model results were explored, to identify nutrient export hotspots, and to consider catchment characteristics contributing to nutrient export.
By comparing the modeled nutrient exports between the sub-catchments in different clear-cut locations, we aimed to answer the following questions:
i
How much does the nutrient export vary according to the location of the clear-cuts, on catchment and sub-catchment scales, and by how much can the nutrient export be reduced by changing the locations of clear-cuts, while keeping the total clear-cut area constant?
ii
What is the importance of the background export in the total nutrient export, and what are the most influential sub-catchment characteristics regulating the background load?
iii
How can nutrient export hotspots be identified, mapped and used in the water protection planning process?
We hypothesized that the locations of clear-cuts, and catchment characteristics, have a remarkable impact on nutrient export. In a mature forest, nutrient uptake and release are in balance, and only a small fraction of these rather large nutrient fluxes can be transported to water courses. Clear-cuts change the balance, and more nutrients are at risk of transporting to the water course if the site-specific characteristics support the transport to water courses. We wanted to test this assumption, in order to understand the significance, to the responsible management of boreal forests, of identifying high nutrient export areas (i.e., hotspots).

2. Materials and Methods
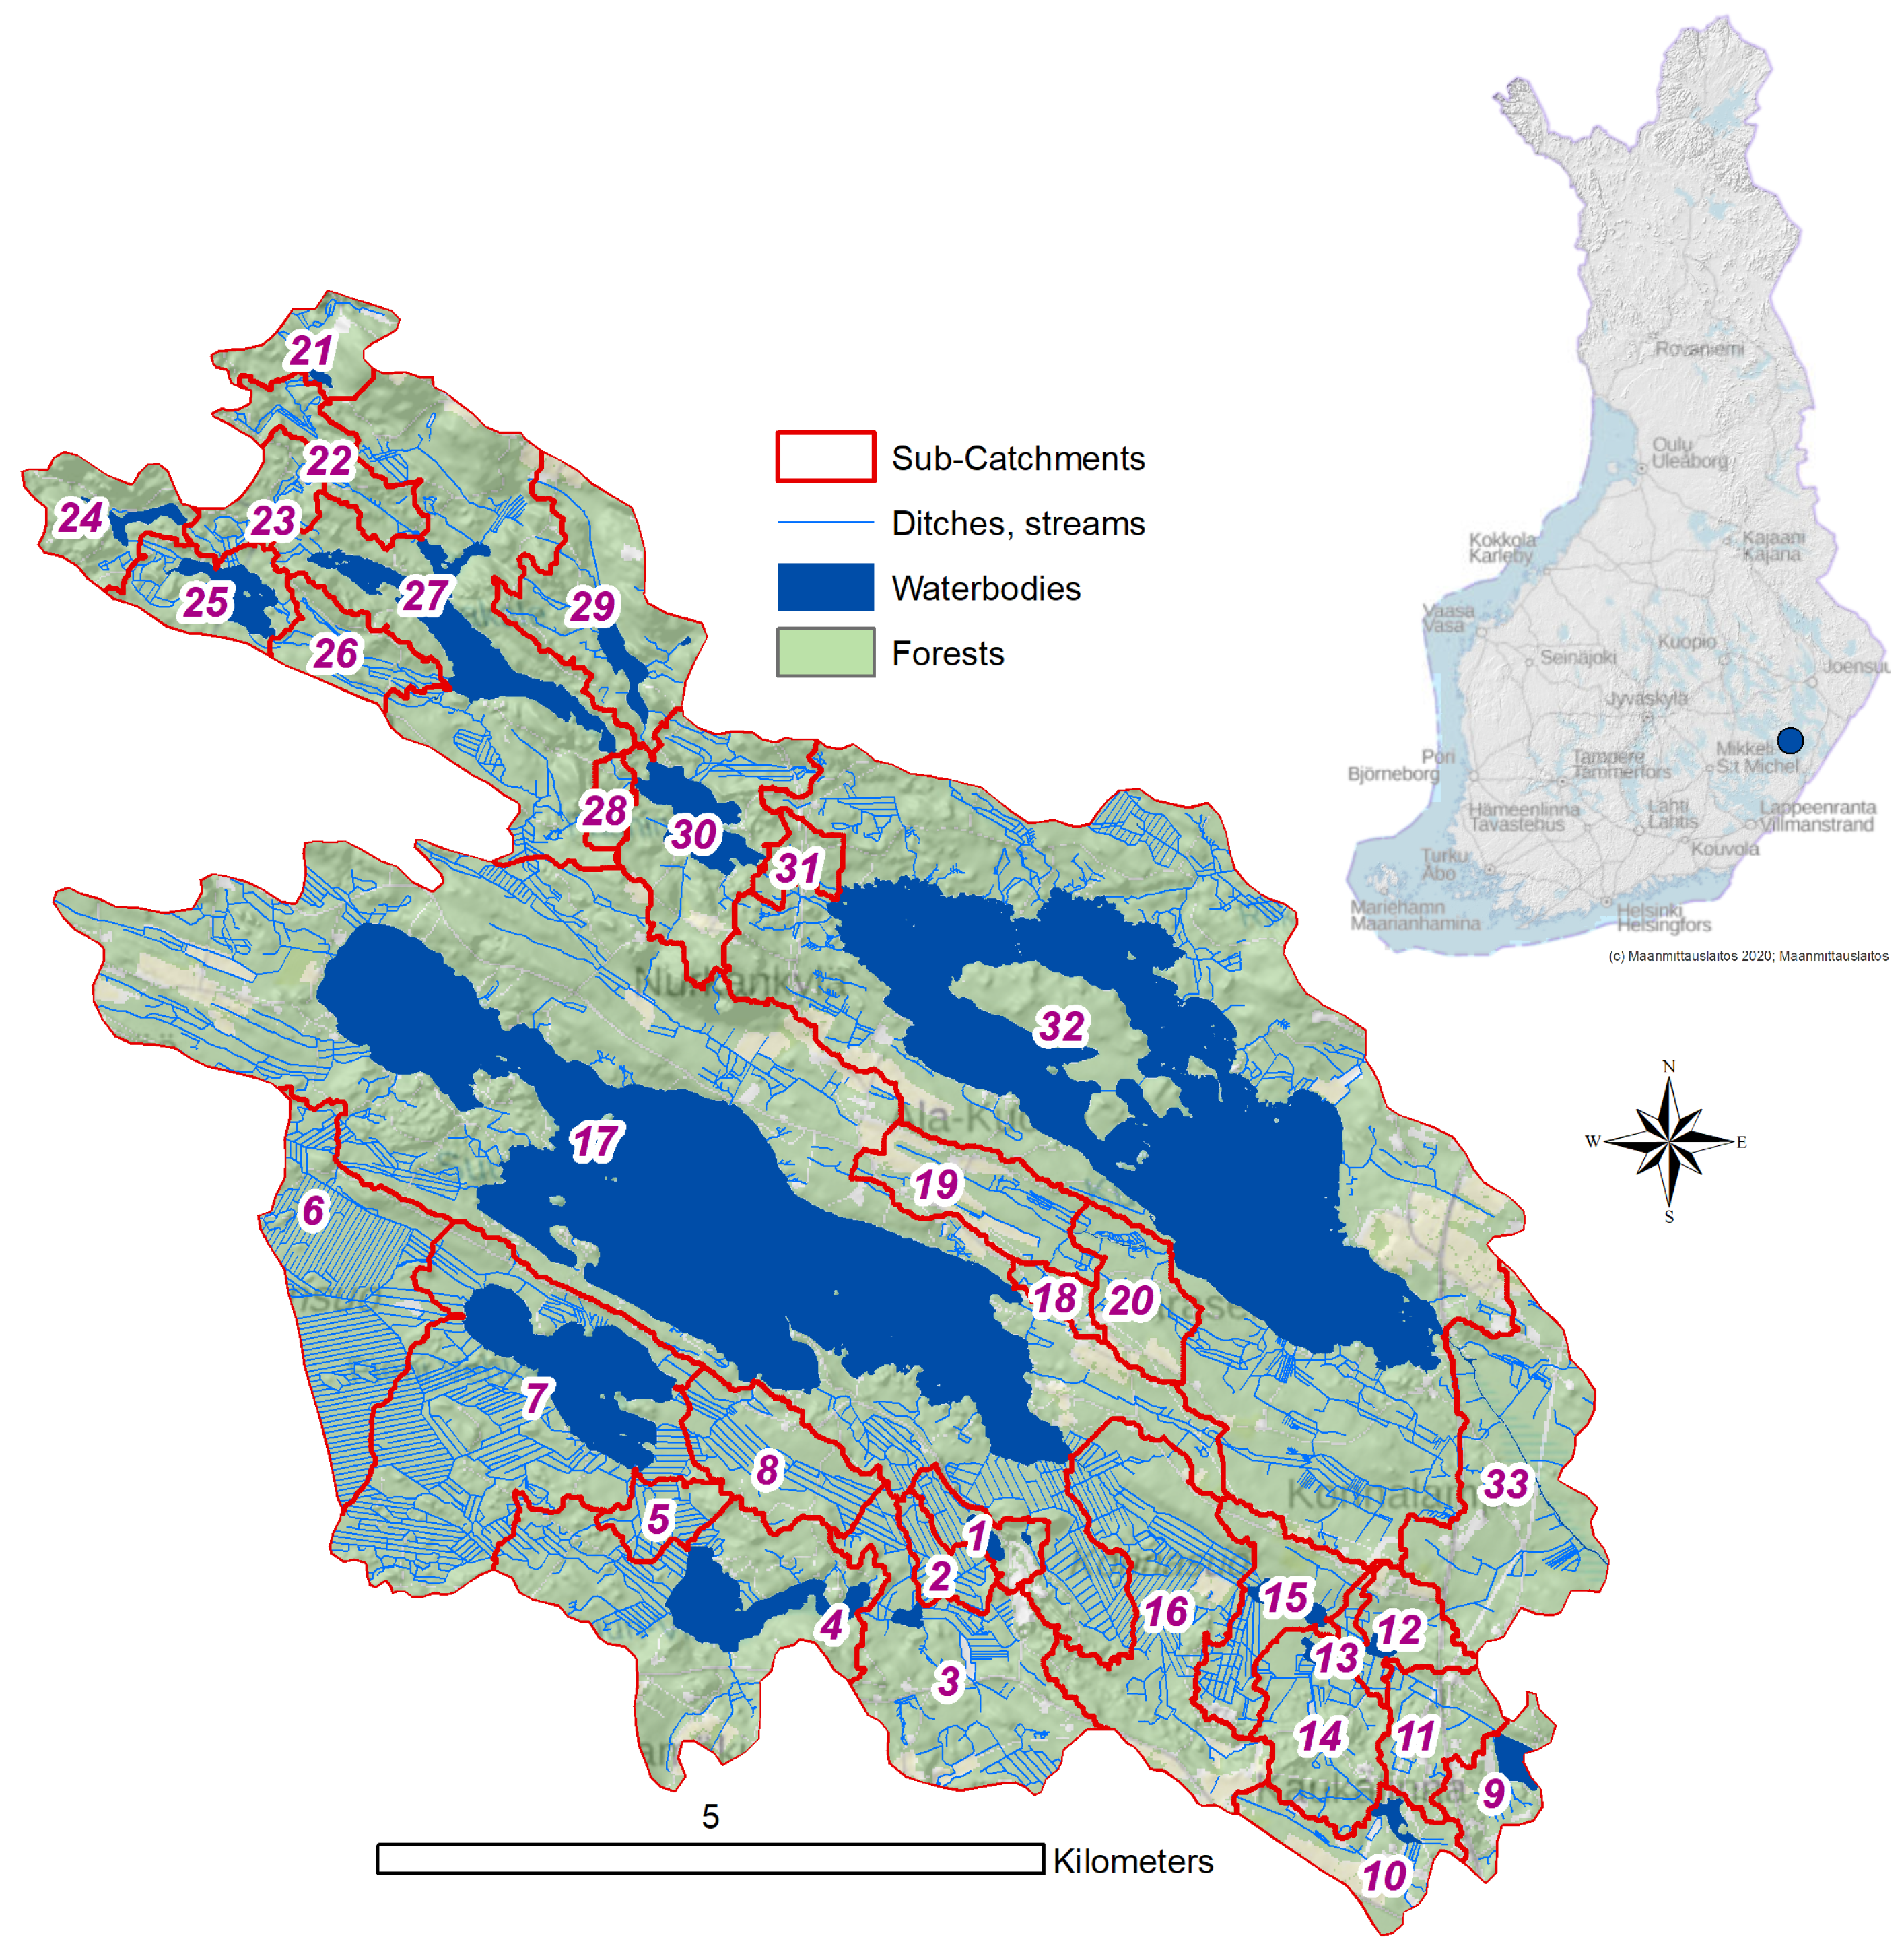
2.1. Study Area

The Vehka–Kuonanjärvi study area is a 7328 ha catchment situated in the boreal zone in southeastern Finland, South Savo region (61°59 N, 29°12 E), which drains to Lake Puruvesi. The catchment consists of 33 sub-catchments (Figure 1) whose forest areas vary between 9 and 1036 ha, the average being 158 ha. Water covers 22% of the total study area. The study area included several larger water bodies and numerous smaller water elements, which are connected by stream networks.
Forestry land covers 90% of the total land area (5723 ha). Agricultural fields cover 6% of the total land area: these were not included in the nutrient export modeling. Roads, lots and other constructed areas (4% of the study area) were also omitted from the simulations.
The dominant tree species are Scots pine (Pinus sylvestris L.) and Norway spruce (Picea abies Karsten), mixed with deciduous species, downy and silver birch (Betula pubescens Ehrh. and P. pendula Roth) together with European aspen (Populus tremula L.). Due to a long tradition of even-aged forestry, the forests consist of compartments (stands), where the age and stand structure are rather homogeneous within the compartment, but may vary between the compartments.
Peatlands cover 26% of the total forest area. The majority of the peatland forests (85%) were drained for the first time between 1950 and 1980. As a result of drainage, originally sparsely wooded fens or open bogs changed to productive forests, with growth and biomass comparable to upland forests. Only 2% of the forest area is classified as non-productive land (volume growth < 1 m3 ha−1 year−1), typically located in non-drained or infertile peatlands [37]. The site fertility class (sfc, Finnish classification [59]) reflects wood production potential and soil nutrient content and, thus, the risk of nutrient export after clear-cutting. Sfc varies in the study area from highly productive (sfc 1) herb-rich mineral and similar eutrofic peatlands to non-productive barren mineral soils, alluvial lands or non-productive Spaghnum fuscum-dominated oligotrofic peatlands (sfc 6), as shown in Figure 2.

2.2. NutSpaFHy Model

First, a daily time step was used to calculate the hydrological fluxes and storages, which were further aggregated to support the calculation of nutrient balance and export by monthly time step [57]. The change in the local nutrient storage was calculated individually for each of the 16 m × 16 m grid cells of the forest land. The nutrient balance calculation included organic matter decomposition, atmospheric deposition and nutrient uptake by trees and ground vegetation. The excess nutrients from each grid cell were transported to the catchment outlet, using a conceptual model, which accounted for nutrient retention and delay as a function of the distance to the nearest water body (for a detailed process description, see [57]).
We used the parameterization introduced in [57], where N immobilization parameters were based on the site type and site fertility class, the mineral and peat soil distribution, the total tree volume and the coniferous tree volume in the sub-catchment. The P immobilization parameters were based on the averages calculated from the calibrated parameters in [57]. The effect of the clear-cut on the local nutrient storage was performed by updating tree age, volume, height, leaf area and ground vegetation biomass, as described in [57]. The simulation period extended from 2002 to 2012, and the first year was used to initialize the hydrology and nutrient storage calculation, and was therefore excluded from the analysis of the simulation results.
Catchments typically contain very different sites, in terms of nutrient export generation. In sites located on mineral soils, the N load in water percolating under the rooting zone can be very small (0.1…0.2 kg ha−1 year−1 [48]). On the other hand, N export to water courses can be 10 times higher in pristine peatlands [20]. Because a catchment is a mosaic of different sites, temporal and spatial variation in hydrological and biogeochemical processes introduce uncertainty to any estimation of forest management effects on nutrient load, as shown by Laurén et al. [51]. Therefore, studying treatment effects using a process-based model is a particularly suitable approach, because the harvesting scenario can be changed while keeping all other parameters and input variables unchanged. Consequently, the differences between the harvested and unharvested scenarios reflect the direct and indirect treatment effects, and there is no risk that the background export will mask the treatment effect in the modeling approach.
The NutSpaFHy model was tested against experimental nutrient export datasets measured from the catchment outlets in Laurén et al. [57]. In a situation where a model is evaluated against one measured dataset, and the model output can result from a combination of multiple processes and their spatial arrangements, there is always a risk of obtaining the right results for the wrong reasons [60]. To decrease this risk, Laurén et al. [57] relied on conceptualization and construction of the model structure, keeping the number of calibrated parameters at a minimum. In NutSpaFHy, high export emerges in locations where the nutrient release exceeds the nutrient uptake for a prolonged time, and there is a water flux that may transport the nutrient load onwards.

2.3. Input Data

NutSpaFHy input contains spatially explicit data on forest resources, soil, topography, water courses and daily weather data. The forest resources input contains the soil type separating the mineral and peat soils, the site fertility class describing the site productivity (sfc, class variable from 1 to 6, highest productivity being 1), and the forest stand characteristics, such as total and species-specific tree volume (m3 ha−1), biomass (kg ha−1), canopy height (m), mean breast height diameter (cm), basal area (m2 ha−1) and stand age (years). The input was derived from openly available forest inventory data (FID) maintained by the Finnish Forest Centre (FFC) (available at [6]). The data were organized by forest compartments (stands) that had uniform site characteristics, allowing for accurate simulation of stand development, thinnings and economically feasible regeneration timing. The average forest compartment area in the FID is 1.4 ha. The data also contained the type and timing of the next harvesting operation for each forest compartment. The regeneration-mature stands created a realistic population, from which future clear-cut sites will be selected.
As the FID were mainly available for privately owned forest, the data were back-filled by Multi-Source National Forest Inventory data (MS-NFI) provided by the Natural Resources Institute of Finland. MS-NFI data are based on satellite images, field inventory data and other data sources [61], and are published in 16m×16m resolution. MS-NFI data are comparable to FID, but they are not updated yearly with growth simulation, and do not include the timing and location of the recommended harvesting operations. In our data, 87% of the forest resources data originated from FID, and 13% from MS-NFI data.
The topographic wetness index (TWI) [62] and the terrain slope were calculated using a 16 m × 16 m-resolution digital elevation model (DEM). The DEM, peatland cover, bare rock areas, roads and water elements were obtained from a public database maintained by the National Land Survey of Finland [63]. The Euclidean distance to the nearest water body was calculated for each grid cell. Soil data were derived from the Geological Survey of Finland [64]. All spatial data, if not so originally, were converted into 16 m-resolution with uniform extent.
The weather input was obtained from interpolated weather data in a 10 km×10 km grid between 2002 and 2012 [65]. The data included the daily temperature and precipitation, the global radiation, the relative humidity and the cumulative temperature sum of the growing season. The simulation period represented typical weather in the region, as the mean air temperature, precipitation and reference evapotranspiration (ET0) were close to the long-term median of the period 1981–2018 in all seasons [66]. More detailed information about the input weather is presented in [66].

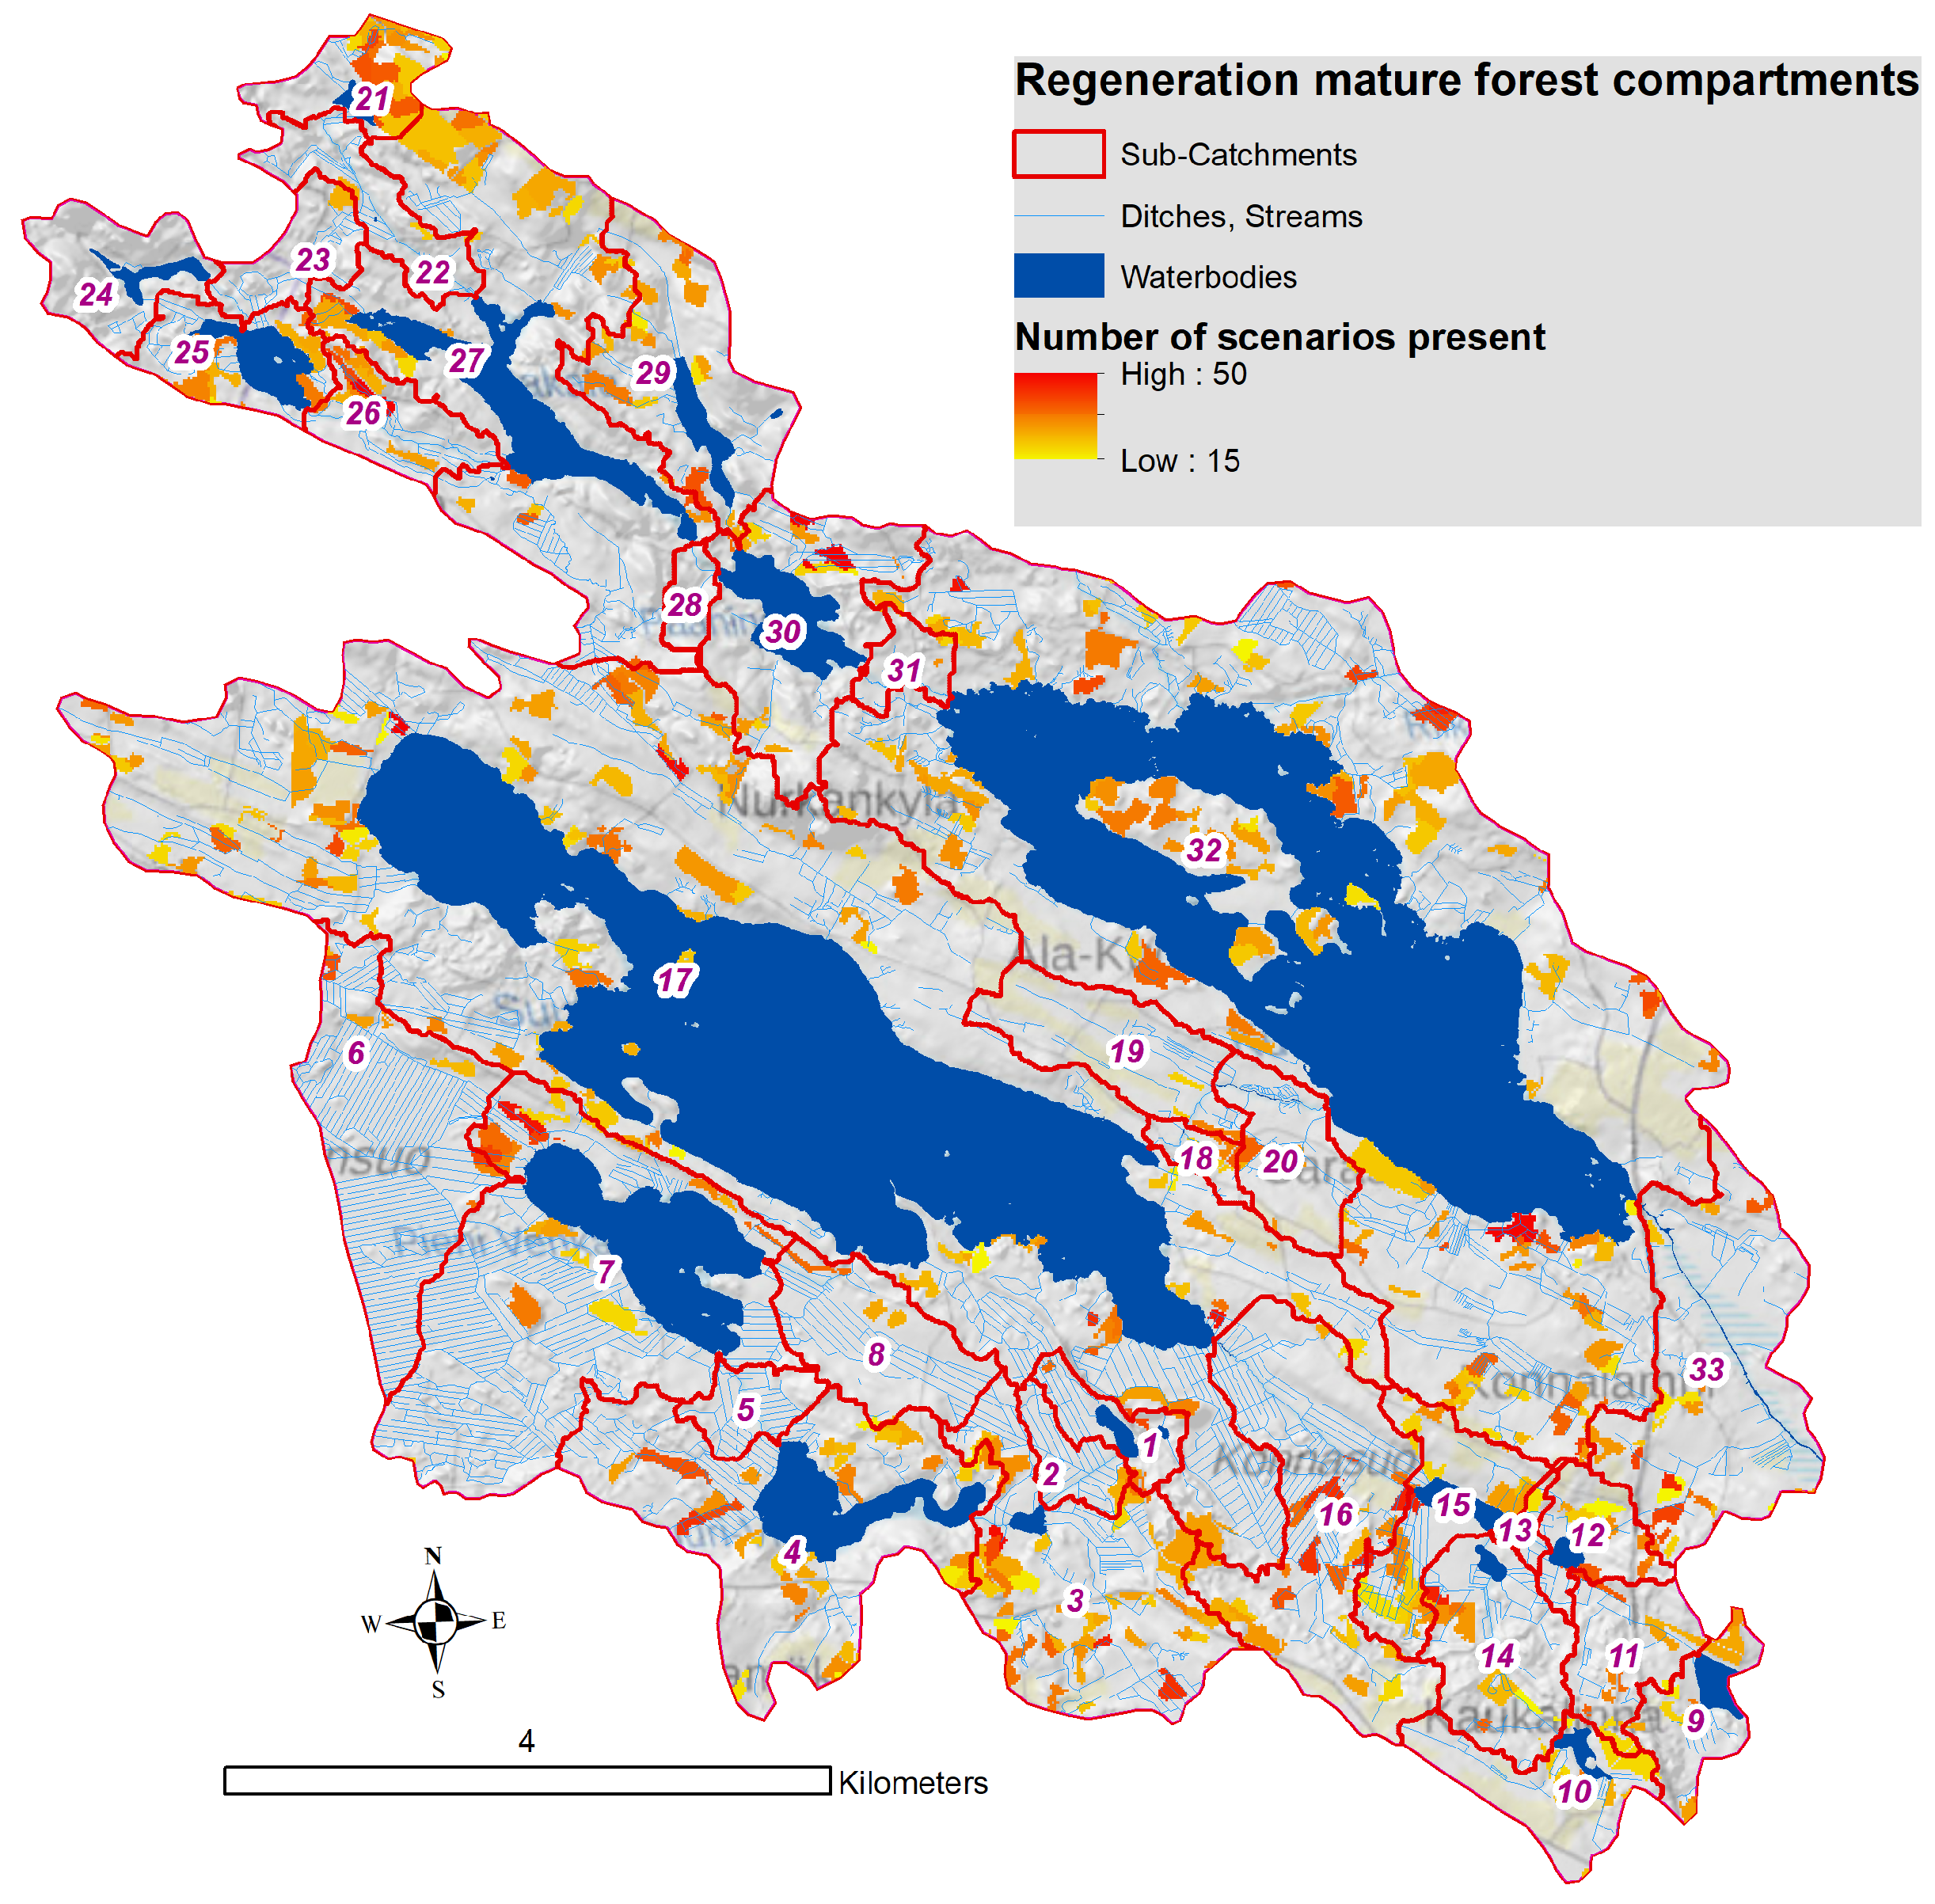
2.4. Clear-Cut Scenarios

Predicting future nutrient loads is challenging, because the exact clear-cut locations depend on the individual landowners’ decisions, and thus remain largely unknown. To tackle this uncertainty, we formed 100 clear-cut scenarios with equal total harvested areas and unique harvesting locations, using the FID containing the regeneration-mature forest compartments. All the clear-cuts occurred on March 1st of the second simulation year. The total clear-cut area was matched to the realized average annual area from the previous 10-year period. Clear-cuts in mineral and peat soils were tracked separately. The average clear-cut area was 192 ha year−1, of which 83% was performed on mineral soils, and the rest on peatland. The total area of the mature forest compartments, from which the selection of the clear-cuts was performed, was 732 ha, which represented 14% of the productive forest area. The compartments were selected randomly from the potential compartments, and some compartments ended up appearing more frequently in the scenarios than others (Figure 3). Regeneration-mature forest compartments were not evenly located in sub-catchments, because of the heterogeneous forest development class distribution resulting from the long tradition of even-aged forestry.

2.5. Data Analysis

The effect of the location of the clear-cuts on the whole catchment and sub-catchment scales was evaluated by calculating the average annual export (kg year−1) and the relative increase (%) compared to the background export. In this study, ’background export’ refers to the nutrient export from forest areas where no clear-cuts were done during the simulation period. This meant that the background export might include the effects of past forest management. The specific export was calculated by subtracting the background export from the total nutrient export, and dividing it by the area of the clear-cuts. We used these results to quantify how much the clear-cut locations affected the nutrient export, while keeping the total clear-cut area constant in the catchment scale.
When identifying the hotspots in catchments with a long forest management history, we separated the background export from the excess nutrient export caused by the forest management: this was important, because in some cases the nutrient export can be naturally high, because of the catchment characteristics, such as topography, soil types and hydrological and biogeochemical processes [40,57,67]. In other cases, high nutrient export is caused primarily by forest management. Focusing solely on the clear-cut-induced absolute (kg year−1) and relative (%) export increase would neglect the background export hotspots, where the reduction of nutrient export could also be possible; therefore, the role of background export was also studied, to identify the nutrient export reduction priorities. The variation in the background export was presented by exploring the absolute (kg year−1) and relative (kg ha−1 year−1) exports among the sub-catchments.
We used correlation analysis (Pearson) to reveal the influence of the catchment properties on the background export. The variables for the correlation analysis were extracted by calculating the mean or median of the input raster cells (excluding open-area and deciduous tree volume) located inside each sub-catchment, or by using the model outputs. The open area (%) was calculated as a fraction of raster cells where the stand volume was below a threshold value (either 2 m3 ha−1 or 10 m3 ha−1), from the forest area in the sub-catchment. The proportion of deciduous trees of the total stand volume (%) was calculated for each grid cell.
Based on preliminary analysis, we selected two sub-catchments according to different criteria. Sub-catchment 21 was selected because it contained two (out of 100) clear-cut scenarios (A and B) with identical clear-cut areas (17% of the area), but substantially different TN exports. Sub-catchment 26 was selected because it had two clear-cut scenarios with nearly identical TN export, but with different clear-cut areas. These two clear-cut scenarios, in addition to the no-clear-cut scenario (background export) from the two selected sub-catchments, were used to examine the nutrient export within the sub-catchment: this was done by calculating the nutrient balance for each grid cell, to discover the specific locations inside the sub-catchment that produced the highest nutrient export (the top 5% of the area). These locations were named as a within-catchment hotspot.

3. Results

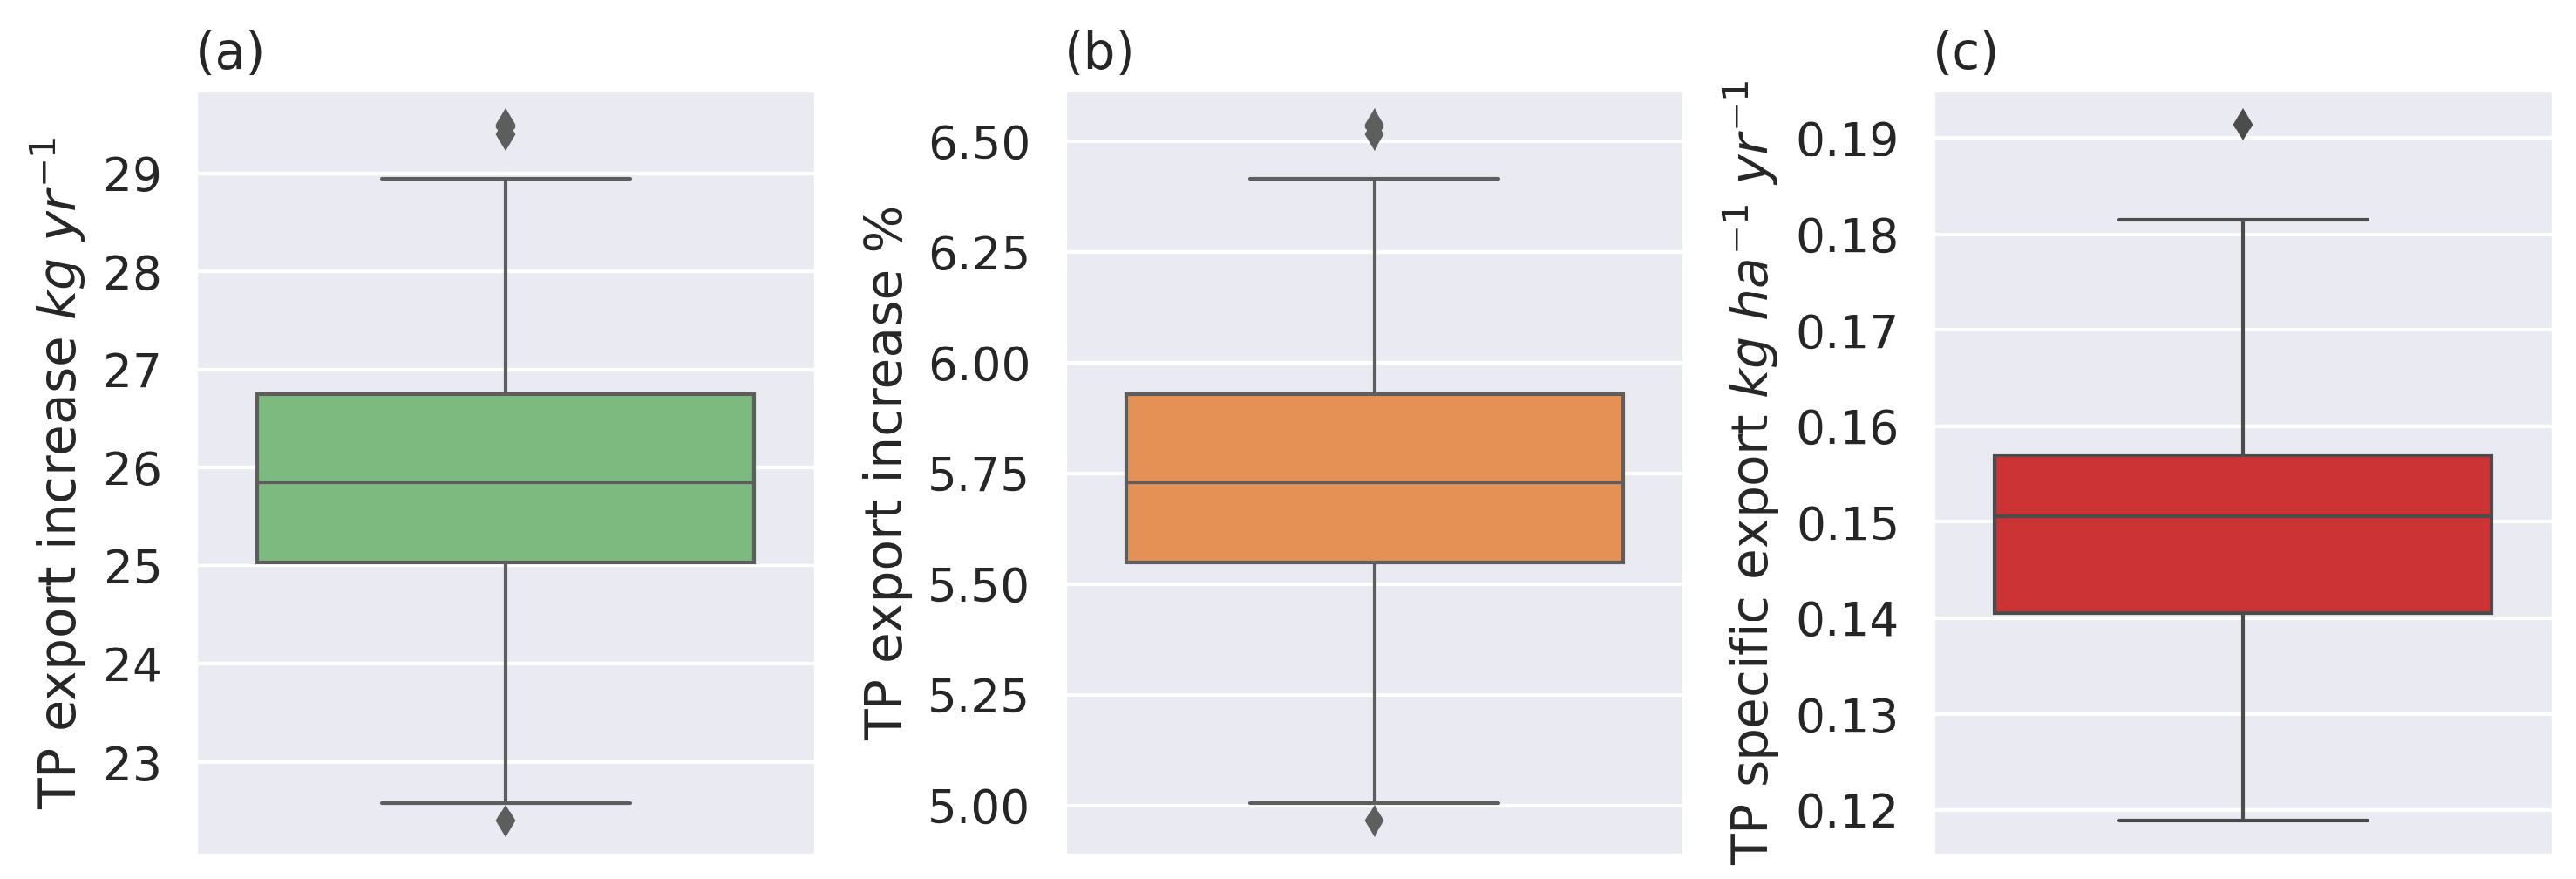
3.1. Clear-Cut-Induced Nutrient Export

Based on the simulated 100 scenarios, the clear-cuts increased the catchment scale TN export on average by 602 kg yr−1 (range 522–677 kg year−1) (Figure 4a). Background export accounted for most of the total export, and the clear-cuts increased this by 4.9% (range 4.2%–5.5%, Figure 4b). The specific TN export varied between 3.0 and 4.1 kg ha−1year−1 in the catchment scale (Figure 4c).
The average clear-cut-induced increase in TP export was 26.0 kg year−1 in the catchment scale (range 22.4–29.5 kg year−1) (Figure 5a): this increase accounted for 5.7% of the TP export (range 5.0%–6.5% (Figure 5b). The specific export varied between 0.12 kg ha−1year−1 and 0.19 kg ha−1 year−1, the average being 0.15 kg ha−1 year−1 (Figure 5c).
There was a substantial variation between the sub-catchments, in terms of how the clear-cuts increased the TN export (Figure 6). The greatest variation occurred in sub-catchment 32, where the total clear-cut-induced excess load varied between 75 and 179 kg year−1 (Figure 6a). However, in relative terms, the variation in this sub-catchment was rather small. For example, in sub-catchment 21, the relative increase in TN export varied from 5% to 69%. Sub-catchments 15, 18 and 21 emerged when the average export increase per hectare was examined (Figure 6c). When examining the range of the specific export, other sub-catchments stood out, particularly catchments 6, 7 and 14 (Figure 6d).
The TP export in the 100 clear-cut scenarios followed the same pattern as that of the TN in the absolute export increase (Figure 7a), the relative export increase (Figure 7b), the hectare-based export increase (Figure 7c) and the specific export (Figure 7d), meaning that the same sub-catchments stood out for the TP export as for the TN export. However, the TP export was not identical to the TN export (e.g., sub-catchment 18, in Figure 6c and Figure 7c) ).

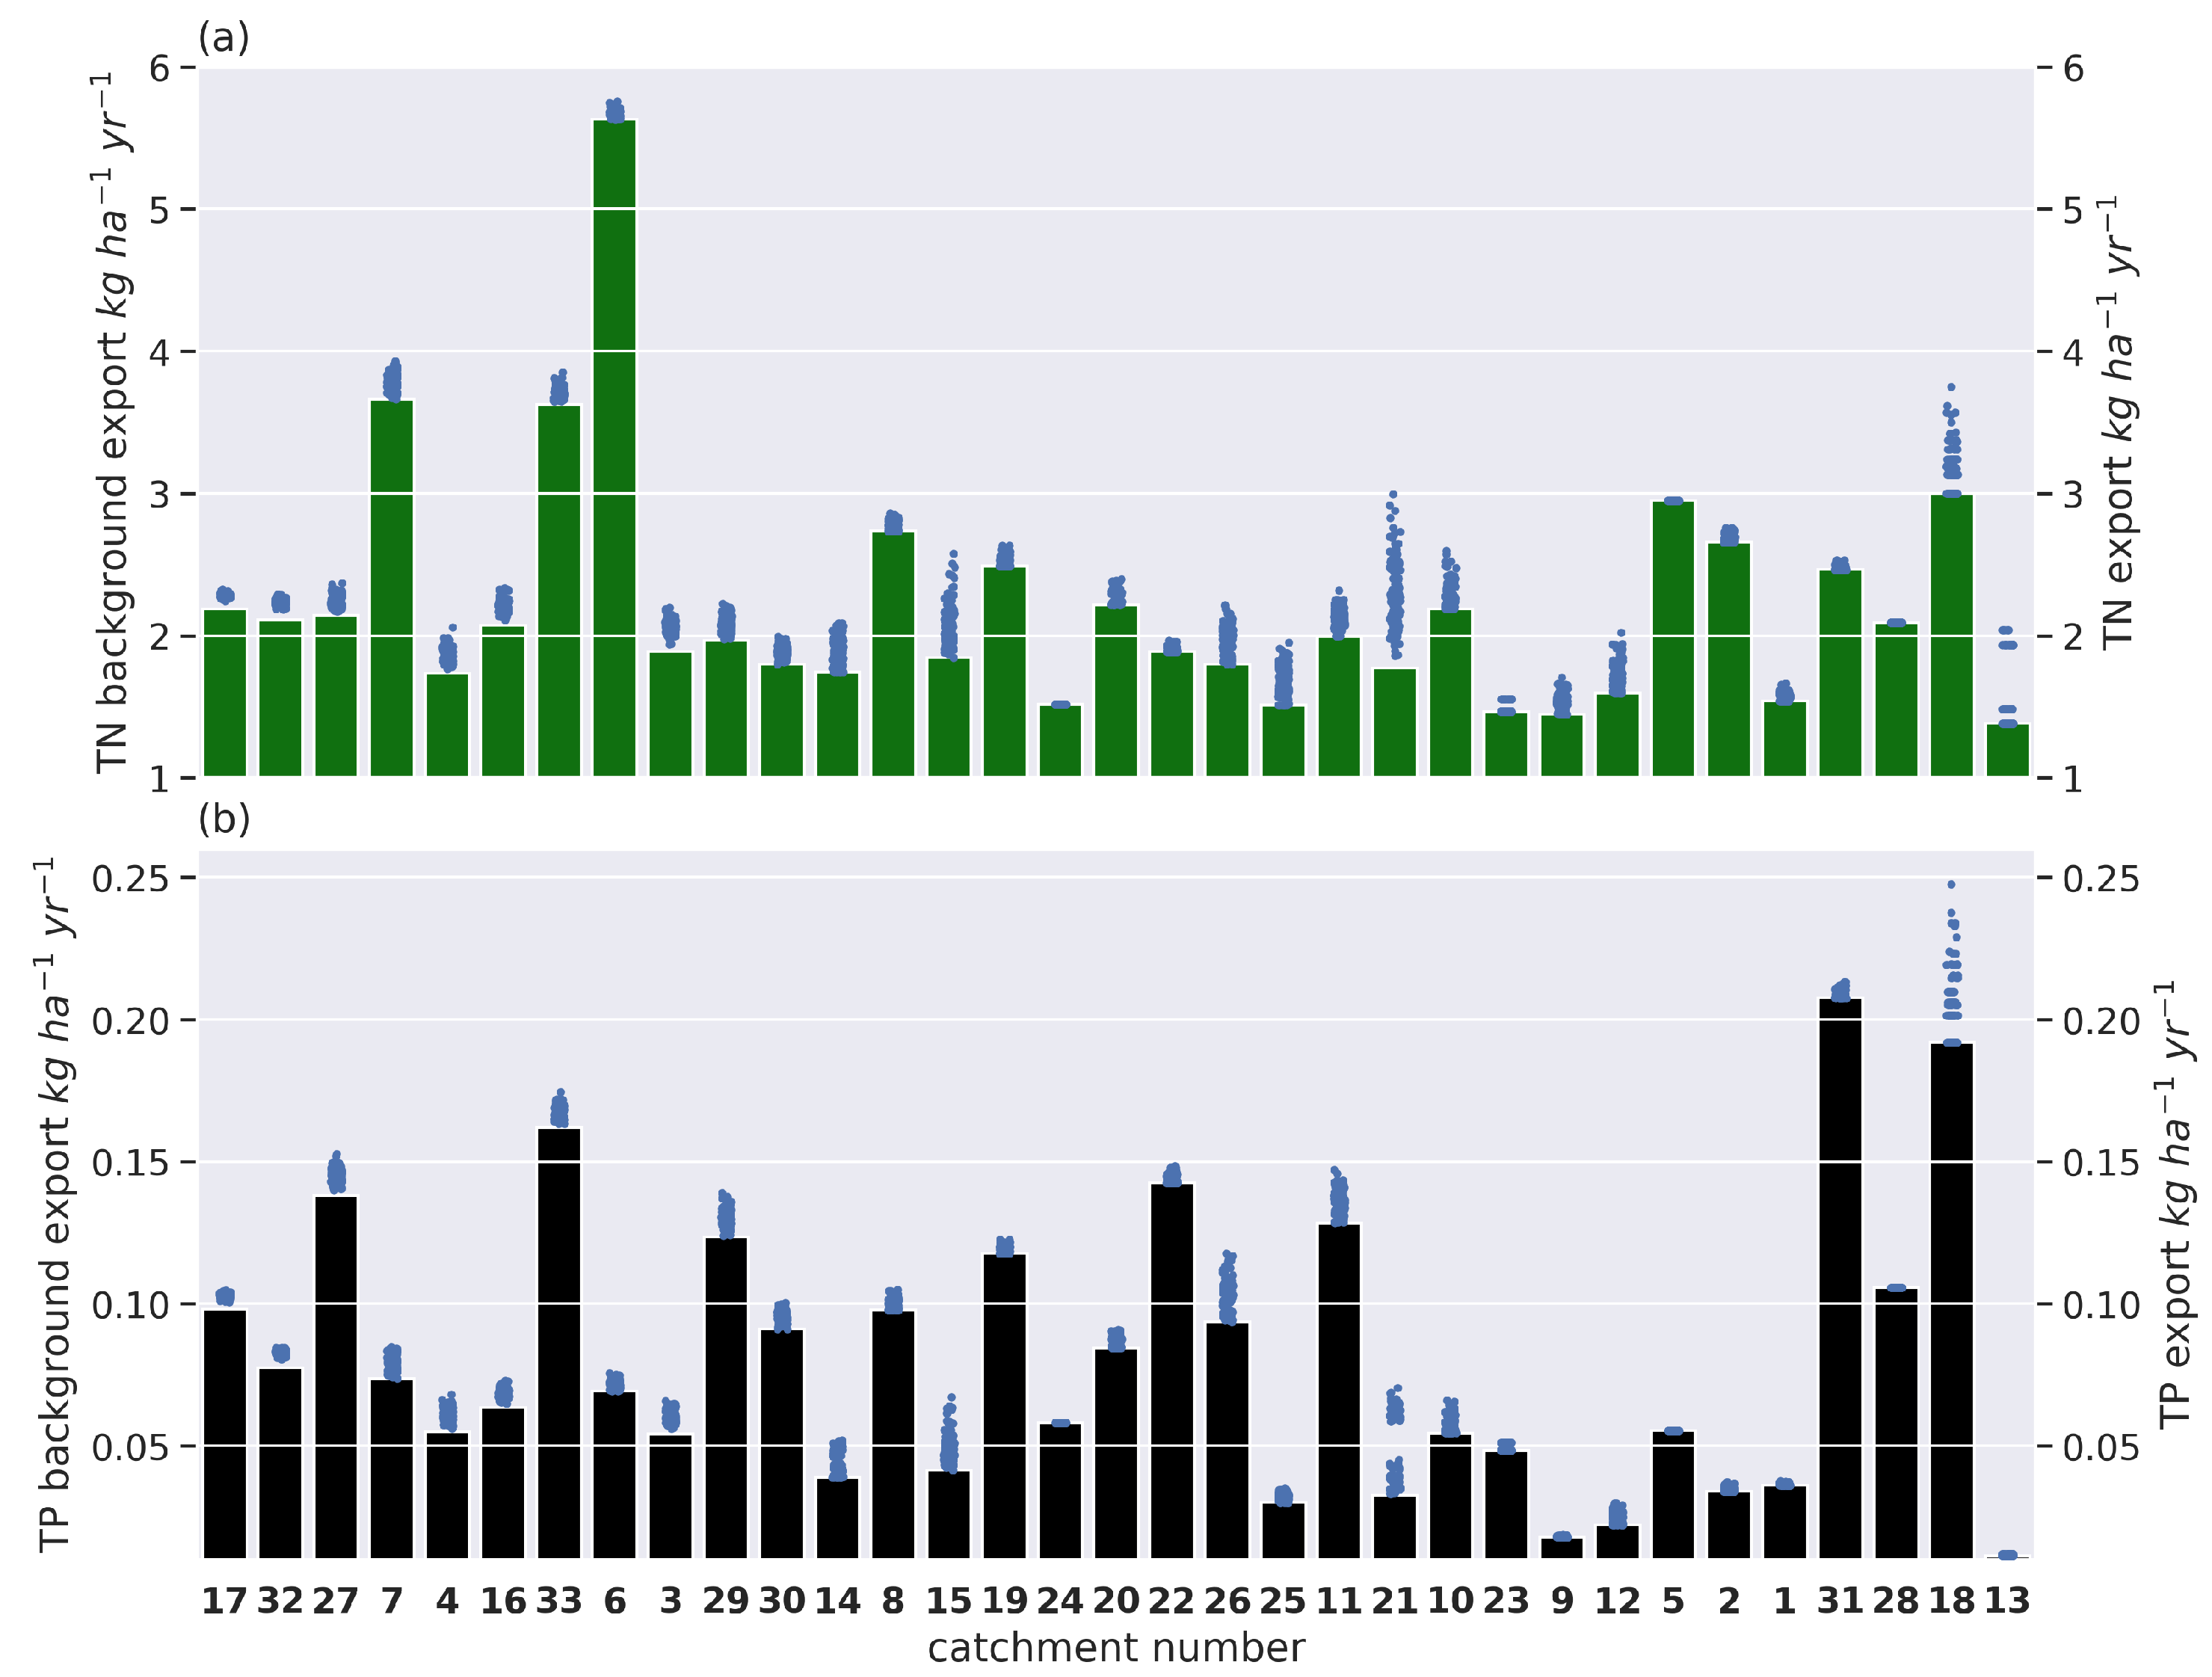
3.2. Background Export

The average annual background export for the TN and TP varied between the sub-catchments considerably (Figure 8). A major part of the variation in the absolute exports can be explained by the forest area of the sub-catchments (9–1036 hectares) (bars in Figure 8). On the other hand, there was a considerable fluctuation in the exports expressed relative to the sub-catchments forest area for both TN (line in Figure 8a) and TP (line in Figure 8b). The average annual background TN export for the whole study area was 2.4 kg ha−1year−1. The difference in the background TN export between the sub-catchment with the lowest (1.4 kg ha−1year−1) and highest export (5.6 kg ha−1year−1) was threefold. The average annual TP export in the study area was 0.08 kg ha−1year−1, whereas the lowest sub-catchment TP export was 0.01 ha−1year−1, and the highest was 0.21 ha−1year−1. The highest relative TN and TP exports did not occur in the same sub-catchments.
We found that the variables that correlated with the TN differed, to some extent, from those that correlated with the TP (Figure 9 and Figure A1). The highest positive correlation with the sub-catchment TN export was the peatland percentage (0.61). Catchment characteristics that were connected to lower TN export included mean distance to the water body (−0.36) and stand biomass (−0.31). For TP export, the highest positive correlations were with the share of the open area (0.62, 0.57) and with the runoff (0.57). Open areas here represented recent clear-cut sites, where wood volume was still low. Stand age (−0.55), fertility class (median sfc) in peat soil (−0.35) and stand biomass (−0.31) correlated negatively with TP export.

3.3. Nutrient Export Hotspots

The background export dominated the TN and TP export (Figure 10). In the majority of the clear-cut scenarios, the clear-cut area did not exceed 10% of the forest area. However, there were considerable differences between the sub-catchments as to how much the clear-cuts increased TN and TP export (Figure 10, dots). In most of the sub-catchments the clear-cut-induced increase was modest, but there were some exceptions, where nutrient export distinguished them from others (e.g., catchments 15, 18 and 21): these sub-catchments could, therefore, be defined as clear-cut-induced hotspots. However, the export increase alone would not necessarily justify the hotspots, if they were reviewed on the absolute scale: consequently, the sub-catchments 15 and 21 would stand out any more, as their background export was low compared to some other sub-catchments (e.g., 27 and 33).
When shifting the focus, in identifying within-catchment hotspots, the results showed clearly, in the selected sub-catchments 21 and 26 (Figure 11), that the nutrient export was very unevenly distributed over the grid cells. The results showed that within-catchment hotspots (top 5% of the area) produced 21%–25% of the TN export and 27%–57% of the TP export, both for background and clear-cut scenarios (Table 1).
Figure 11 shows that the increase caused by the clear-cuts was highly location-dependent. In sub-catchment 21 (Figure 11a,b), the cumulative TN export was 20% higher in clear-cut scenario 21B than in 21A (Figure 11b), even though the clear-cut area was the same 17% (Figure 11a). In sub-catchment 26, the nutrient export was similar in clear-cut scenarios 26A and 26B (Figure 11c), even though the clear-cut areas were different.
The range of the TN export at the grid-cell level was similar for both of the clear-cut scenarios in both sub-catchments. In sub-catchment 21, the range of the cumulative TN export was 5–261 kg, while in sub-catchment 26 it was 6–131 kg, during the 10 year simulation period. In both sub-catchments, there were areas with very high TN export, both inside and outside the clear-cut areas. These high nutrient export areas could have arisen from permanent location-specific properties, such as soil type and topography, or recent clear-cut, where nutrient uptake had not yet recovered. In sub-catchment 21, there was considerable difference between the clear-cut scenarios in the location of the clear-cuts within the sub-catchment and, in this case, this clearly affected the total nutrient export (see also Figure 10). Opposite to sub-catchment 21, in sub-catchment 26, even the doubling of the clear-cut area hardly increased the TN export.

4. Discussion

4.1. Impact of Clear-Cut Location on Nutrient Export, on Catchment and Sub-Catchment Scales

The results supported our hypothesis that the location of the clear-cut area, and catchment characteristics, affect the nutrient export. Previous studies have indicated that the increasing proportion of clear-cuts in the catchment increases the nutrient export load [15,41,51]. We demonstrated that the location of the clear-cut affects nutrient export both on the catchment scale and the sub-catchment scale. In the studied catchment, the simulated excess TN and TP export varied between the clear-cut scenarios, although all scenarios had the same total clear-cut area. In our study area, the clear-cuts increased the export load by 4.2%–5.5% for TN and 5.0%–6.5% for TP, with respect to the background load. At first glance, the difference between the lowest and highest export load may seem to be quite modest, but it should be noted that the clear-cut area was less than 4% of the productive forest area, and all the harvesting was done at the beginning of the simulation period. The simulations showed that the difference between the clear-cut scenarios was up to 155 kg for TN export and 7 kg for TP export in the whole study area, whilst keeping the total harvesting area constant. The previously set TP export reduction target to achieve improvement on water quality in Lake Kuonanjärvi (sub-catchment 22) was approximately 110 kg [68]. Compared to the target, locating clear-cuts covered only a small part of the reduction target and, therefore, additional water protection efforts were needed. The results indicated that there was a large variation between the sub-catchments in the clear-cut-induced nutrient export (Figure 6 and Figure 7). Thus, locating efficient water protection measures required shifting focus from the larger catchment to the sub-catchment scale.
The range in the exports between the clear-cut scenarios could be wide, both in absolute (Figure 6a and Figure 7a) and in relative terms (Figure 6b–d and Figure 7b–d). Figure 6a and Figure 7a show that in the two largest catchments (17 and 32) the absolute increase in the export was highest, but the relative increase remained modest.
The export increase in relative terms (Figure 6b and Figure 7b) could be useful to pinpoint those catchments where new clear-cuts might increase the nutrient export considerably in comparison to the background export, and where, therefore, mitigating future clear-cut-induced nutrient export is also an effective strategy on the sub-catchment scale (15, 18 and 21).
In sub-catchments 6 and 7, the additional export caused by clear-cuts (Figure 6d and Figure 7d) can be explained by the fact that the clear-cuts were located in the areas with properties increasing nutrient export. In these sub-catchments, while the relative increase (Figure 6b and Figure 7b) in export may have been modest, there may have been individual clear-cut sites that had a high local impact on the condition of small water bodies (Figure 6d and Figure 7d). On the other hand, the increase in clear-cut-induced export could remain small in such sub-catchments, where the number of stands of regeneration age (sub-catchments 5, 24 and 28, see Figure 2) were low, or where the specific export was low (e.g., sub-catchment 3, Figure 6d and Figure 7d). The TP export was not identical to the TN export (e.g., sub-catchment 18, in (Figure 6c and Figure 7c): this was logical, because the local catchment characteristics had a different impact on the TN and TP exports (see Figure 9, Figure A1 and Figure A2).
Studying the clear-cut-induced increase in the nutrient export on the sub-catchment level revealed clearly those sub-catchments with high export increase potential, but it also showed equally clearly those sub-catchments where the nutrient export reductions by methods associated with clear-cuts (e.g., additional buffer zones, transfer to continuous cover forestry) were not efficient. This information is highly valuable when forming an effective water protection strategy concentrating on using methods applicable to reducing background export (e.g., constructed wetlands.)
When reviewing the results, it should be taken into account that the clear-cut scenarios were formed by randomly selecting the regeneration-mature forest compartments, until the area threshold was reached on the catchment scale, not on the sub-catchment scale: this meant that the clear-cut area in each sub-catchment may have differed between the clear-cut scenarios, even though the total clear-cut area remained constant.
The range in the TN-specific export was 3.0–4.1 kg ha−1year−1 in the whole study area (Figure 4c), which was in the same order of magnitude as those reported from paired catchment studies in Fennoscandia [4] (range 0.08–4.94 kg ha−1year−1). The TP-specific export from the simulations (0.12–0.19 kg ha−1year−1) was also in line with the field measurements (0.01–0.53 kg ha−1year−1) [4] (Figure 5c).

4.2. Background Export

In large forested catchments, the background load is typically the major export component [4,9,33]; therefore, it is important to separate the background export from the excess nutrient export caused by the forest management [33,40,51,69,70]. Here, the background export referred to the export from the observed continuously managed forest area, which was not subject to any forest management during the simulation period.
The results showed that the background load varied greatly between the sub-catchments (Figure 8): this reflected differences in the runoff between adjacent sub-catchments, which has been generally observed to play a role in nutrient export in experimental studies [71]. Our simulated mean annual nutrient exports (TN 2.4 kg ha−1year−1, TP 0.08 kg ha−1year−1) were coherent with the measured values from managed (20 pcs.) and unmanaged (10 pcs.) forested catchments in Finland [33] (TN 2.31 kg ha−1year−1, TP 0.095 kg ha−1year−1). Furthermore, the simulated variation in TN and TP export in this study was well within the measured range [33].
The results suggest that there is no single sub-catchment feature that could explain the variation in TN or TP export (Figure 9): this was expected, as the biogeochemical and hydrological processes regulating nutrient export are highly dependent on local conditions, which can vary between the 16 m×16 m cells even more than between the catchments. For example, tree volume may be a significant factor contributing to nutrient balance on the grid-cell level, but not on the sub-catchment level, as the effect becomes masked with increasing spatial extent. Peatland area had the highest correlation (0.61) with the elevated TN export: this was in line with the results from empirical studies from managed [33] and unmanaged catchments [33,72]. The high TN export from peatland-dominated areas results from the large TN stocks in the peat [73]. The share of the open area (0.62, 0,57) and runoff (0.57) correlated positively with TP export. The strongest negative correlation with TP was with stand age. These TP correlations suggest that the appearance of the TP export hotspot was more dependent on forest management than TN export.

4.3. Hotspots

In this study, the hotspot concept was used in two different contexts. From the sub-catchment populations, we searched for hotspot sub-catchments where the TN or TP exports were exceptionally high: this was justified by the need to prioritize the water protection investments in those sub-catchments with high nutrient export. However, when defining hotspots, it is also important to take into account the condition of the receiving water body, and its ability to receive nutrient export without a considerable negative effect on water quality [74]: this means that there is no precise threshold value for hotspots based on absolute or area-based nutrient export. Because the study area consisted of 33 sub-catchments with different receiving water bodies that had different properties, we neglected the properties of the receiving water body, and determined the hotspot sub-catchment based on the simulated export only (see Figure 6, Figure 7 and Figure 10). Because the WFD also prohibits the deteriorating of the present condition of the water courses, the other premise, besides using the absolute export for hotspot identification, was comparing sub-catchments by their relative (%, see Figure 6b and Figure 7b) or area-based (kg ha−1yr−1, see Figure 6c, Figure 7c and Figure 10, dots) increase in nutrient export caused by forest management.
When identifying hotspots in catchments with a long forest management history, it is important to separate the background export from the excess nutrient export caused by the forest management. In some cases, the nutrient export may be naturally high, because of the catchment characteristics, such as topography, soil types, and hydrological and biogeochemical processes [40,57,67]. In other cases, high nutrient export is caused primarily by forest management. In both of these cases, a small share of the sub-catchment area can significantly contribute to nutrient export (Table 1). Therefore, hotspot analysis could help to improve the efficiency of the water protection measures, when the measures can be located where the nutrient export is actually realized or along their transport paths to water bodies. A topic for future research would be to find methods to assess the costs and effectiveness of the different water protection strategies.
Enhanced water protection with wider buffer zones [40,75,76,77,78,79,80] or the favoring of continuous cover forestry [81,82,83] can be applied to future forest management only and, therefore, separating background export hotspots from management-induced hotspots (Figure 10) is essential. Cost-efficient water protection calls for targeting the investments to areas where the background export is high or will become high as a result of forest management. Therefore, hotspot analysis supports decision making concerning where water protection improvements should be carried out.
To preserve the spatial resolution of the characteristics affecting nutrient export, and thus to maintain the usefulness of sub-catchment-level hotspot analysis, the sub-catchments delineated should be small enough. Based on this study, the sub-catchment area should not exceed a few hundred hectares. The two largest sub-catchments (17 and 32) in this study had a forest area of ca. thousand hectares, which probably should have been divided further into smaller sub-catchments.
The results also indicated that it is useful to extend the hotspot examination on both the sub-catchment and the within-sub-catchment scales. On the within-sub-catchment scale, the water protection planning should be done in conjunction with planning the harvesting operations: this level of planning requires sufficient resolution, to identify areas where clear-cut may mobilize a considerable amount of nutrients. The resolution of 16 m×16 m meets this requirement, and can easily be used together with forest compartment data to guide the width of the buffer-zone (Figure 11,84,85,86,87]), locate water protection structures (e.g., [88,89]) or apply continuous cover forestry [82,90].
In the model description, the export load occurs as a combined effect of biological and hydrological processes. Nutrients become soluble as a result of organic matter decomposition and input from atmospheric deposition. The nutrient uptake is explicitly accounted to the forest stand and to the ground vegetation, and implicitly to microbes, by using the immobilization term in connection with the decomposition. Water fluxes transport the dissolved nutrients along groundwater or surface water flow. Nutrient export emerges in locations where the nutrient release exceeds the nutrient uptake for a prolonged time, and where there is a water flux that may transport the nutrient load onwards. One major source of uncertainty is the actual model description, i.e., does it include the relevant processes regulating nutrient export in reality. In our case, the model included a description of the nutrient storage change calculating nutrient uptake and release by the vegetation in monthly time steps. The transport phase was then calculated, based on the Euclidean distance to the nearest water body or channel. Even though the model was evaluated against empirical data gathered from comparable small catchments, and the use of the calibrated parameters was kept to a minimum (see Section 2.2, [57]), there was still uncertainty as to whether differences between the sub-catchments and within-sub-catchments in the nutrient export were on a scale with the field conditions: this uncertainty could be diminished by actual measurements from the study area. However, we can argue that the results were probably plausible in finding differences in export generation, i.e., hotspots, because the range of the calculated export was in line with independent measurements [4,33,72] and, at the same time, the most influential catchment characteristics impacting the N and P exports were consistent with the published literature (e.g., [33]). This does not eliminate the need to verify the hotspots in the field, especially if within-sub-catchment hotspot maps are included in operational use.
The further development of the NutSpaFHy-model, to directly guide a spatial selection of the water protection measures, would require re-thinking of the model description, so as to also include sediments and their transport, which is important, especially for the calculation of P export.

4.4. Implementing Results in the Water Protection Planning Process

We present a framework for multi-scale water protection planning in two phases (Figure 12), by extending the procedure introduced by Santos et al. [91]. In Phase 1, we define the nutrient export reduction target required for the receiving water body, and we identify sub-catchments where nutrient export reduction is needed. Background and management-induced export are then be compared to the threshold nutrient export defined individually for each receiving water body (e.g., [74]). If the expected nutrient export is smaller than the threshold, the hotspot analysis is not necessary, because no additional water protection investments are needed (Figure 12, Phase 1a). If the export exceeds the threshold (Figure 12, Phase 1b1–3), the planning advances to Phase 2, where hotspots are identified (hotspot sub-catchments, see Figure 6, Figure 7 and Figure 10). Then, we detect the reason behind the excess nutrient export: if it is caused by forest management (Figure 12, Phase 1b1), water protection should be directed to sub-catchments with forthcoming forest management operations (e.g., sub-catchment 5 in Figure 12).
If the high nutrient export is due to the background export, more focus should be diverted to background export hotspots (Figure 12, Phase 1b2). In this case, water protection can be enhanced by constructed wetland and surface flow areas situated along the flow paths transporting the nutrients from the hotspots (e.g., sub-catchment 6 in Figure 12). If the forest management has a large impact on nutrient export and, at the same time, the background export is high, a combined water protection strategy is needed (Figure 12, Phase 1b3): this includes both investing in water protection structures along flowpaths, and directing additional investments to water protection of the forest operations (e.g., sub-catchment 2 in Figure 12).
From hotspot sub-catchments (e.g., sub-catchments 2, 4, 5, 6 in Figure 12), actual areas contributing to the nutrient export should be mapped at grid-cell level. The grid-level nutrient export maps are useful for practical forest management planning, e.g., delineating clear-cut areas or finding suitable places for water protection wetlands (see Figure 11). The next step in the development of this approach is to compose methods to assess the nutrient reduction efficiency of different water protection strategies.

5. Conclusions

The results revealed distinctive spatial differences in the background and in the clear-cut-induced nutrient exports. The differences occurred between the sub-catchments, and at grid-cell level within the sub-catchments. Ranking the locations according to the export load allowed for identification of the nutrient export hotspots, from where the nutrient concentration was expected to be high. A very limited area (here, 5% of the sub-catchment area—see Table 1) produced up to half of the total nutrient export. Our state-of-the-art simulation model allowed for composing a new planning framework for water protection in boreal forested catchments. The water protection efficiency of methods based on adsorption and biological uptake of nutrients (e.g., buffer zones, overland flow fields and biochar reactors) typically improves when the concentration of the incoming water is increasing. Better purification efficiency can lead to improved cost efficiency of water protection. If a simulation indicates a particularly high clear-cut-induced export, we could—instead of a clear-cut—apply continuous cover harvesting methods, to maintain a part of the stand nutrient uptake, thus alleviating the formation of the export.

Author Contributions

Conceptualization, A.L. (Antti Leinonen), A.S., M.P., L.F. and A.L. (Annamari Laurén); methodology, A.L. (Antti Leinonen), A.S., M.P., L.F. and A.L. (Annamari Laurén); writing—original draft preparation, A.L. (Antti Leinonen); writing—review and editing, A.L. (Antti Leinonen), A.S., M.P., L.F., H.P. and A.L. (Annamari Laurén); supervision, A.L. (Annamari Laurén). All authors have read and agreed to the published version of the manuscript.

Funding

This research was funded by OPERANDUM EU Horizon 2020 project grant agreement No. 776848, Academy of Finland (325168, 325169, 326831, 348103, 323997, 323998, 348102), and by the Ministry of Agriculture and Forestry project “Kokonaiskestävää puuntuotantoa turvemailta SUO”.

Institutional Review Board Statement

Not applicable.

Informed Consent Statement

Not applicable.

Data Availability Statement

The data used in this study are publicly available and are reported in [66].

Acknowledgments

The authors would like to thank the anonymous reviewers for their valuable comments. Special thanks for FID management and analysis go to Erkki Saari in the Finnish Forest Centre.

Conflicts of Interest

The authors declare no conflict of interest. The funders had no role in the design of the study, in the collection, analyses, or interpretation of data, in the writing of the manuscript or in the decision to publish the results.

Appendix A. Catchment Characteristics Correlations with TN and TP Export

Figure A1. The correlation between calculated nutrient export and input variables representing catchments characteristics.
Forests 14 00612 g0a1

Appendix B. Clear-Cut Sites’ Location-Specific Impact on Nutrient Export in 100 Clear

The allotment of the clear-cut is known to contribute to the nutrient export from the catchment (e.g., [41]). There were distinctive differences between the sub-catchments, as to how much the increase in clear-cut area actually increased the nutrient export (Figure A2a,c). For some sub-catchments, the clear-cuts increased nutrient export only slightly, whereas in others, the slope in the export increase was much steeper. In addition, the distance of the clear-cut area to the receiving water body (Figure A2b,e), and the share of the peatland clear-cuts (Figure A2c,f), affected the nutrient export. Our results indicate the complexity of the nutrient report, and the multiple factors affecting it. This highlights the need for a comprehensive modeling approach, with high resolution input data, that can account for the hydrological and biogeochemical processes regulating the export.
Figure A2. The variation in the nutrient export caused by the clear-cut sites’ location-specific characteristics can be seen in the variable spacing between dots (clear-cut scenario) belonging to the same sub-catchment (color) (af). Increasing the the clear-cut area (a,d) generally increases also the export, but the there are differences between sub-catchments. The spacing of dots in y-axis with the same position in x-axis indicates that the clear-cut sites average distance to the water body (c,e) and the proportion of clear-cuts in peat (c,f) only explains partially the export of TN or TP.
Forests 14 00612 g0a2

References

  1. WFD. Water Framework Directive. Directive 2000/60/EC of the European Parliament and the Council of 23 October 2000 establishing a framework for community action in the field of water policy. Off. J. Eur. Communities 2000, 327, 1–73. [Google Scholar]
  2. Carvalho, L.; Mackay, E.B.; Cardoso, A.C.; Baattrup-Pedersen, A.; Birk, S.; Blackstock, K.L.; Borics, G.; Borja, A.; Feld, C.K.; Ferreira, M.T.; et al. Protecting and restoring Europe’s waters: An analysis of the future development needs of the Water Framework Directive. Sci. Total. Environ. 2019, 658, 1228–1238. [Google Scholar] [CrossRef] [PubMed]
  3. Luke, N.R.I.F. Finnish Statistical Yearbook of Forestry 2021. 2021. Available online: https://www.luke.fi/en/statistics/about-statistics/statistical-publications/finnish-statistical-yearbook-of-forestry (accessed on 31 July 2022).
  4. Palviainen, M.; Finér, L.; Laurén, A.; Launiainen, S.; Piirainen, S.; Mattsson, T.; Starr, M. Nitrogen, Phosphorus, Carbon, and Suspended Solids Loads from Forest Clear-Cutting and Site Preparation: Long-Term Paired Catchment Studies from Eastern Finland. Ambio 2014, 43, 218–233. [Google Scholar] [CrossRef] [PubMed] [Green Version]
  5. Lepistö, A.; Räike, A.; Sallantaus, T.; Finér, L. Increases in organic carbon and nitrogen concentrations in boreal forested catchments—Changes driven by climate and deposition. Sci. Total. Environ. 2021, 780, 146627. [Google Scholar] [CrossRef]
  6. FFC, F.F.C. Open Forest and Nature Information. 2022. Available online: https://www.metsakeskus.fi/en/open-forest-and-nature-information (accessed on 9 July 2022).
  7. Kreutzweiser, D.P.; Hazlett, P.W.; Gunn, J.M. Logging impacts on the biogeochemistry of boreal forest soils and nutrient export to aquatic systems: A review. Environ. Rev. 2008, 16, 157–179. [Google Scholar] [CrossRef]
  8. Tamm, C.O. Nitrogen in Terrestrial Ecosystems: Questions of Productivity, Vegetational Changes, and Ecosystem Stability; Springer: Berlin/Heidelberg, Germany, 1991. [Google Scholar]
  9. Laurén, A.; Finér, L.; Koivusalo, H.; Kokkonen, T.; Karvonen, T.; Kellomäki, S.; Mannerkoski, H.; Ahtiainen, M. Water and nitrogen processes along a typical water flowpath and streamwater exports from a forested catchment and changes after clear-cutting: A modelling study. Hydrol. Earth Syst. Sci. 2005, 9, 657–674. [Google Scholar] [CrossRef]
  10. Sponseller, R.A.; Gundale, M.J.; Futter, M.; Ring, E.; Nordin, A.; Näsholm, T.; Laudon, H. Nitrogen dynamics in managed boreal forests: Recent advances and future research directions. Ambio 2016, 45, 175–187. [Google Scholar] [CrossRef] [Green Version]
  11. Grip, H. Water Chemistry and Runoff in Forest Streams at Kloten; UNGI Rapport; UNGI: Stockholm, Sweden, 1982. [Google Scholar]
  12. Ahtiainen, M. Avohakkuun ja Metsäojituksen Vaikutukset Purovesien laatuun; Vesi-ja Ympäristöhallinnon Julkaisuja. Sarja A, 45; Vesi-ja Ympäristöhallitus: Helsinki, Finland, 1990. [Google Scholar]
  13. Ahtiainen, M. The effects of forest clear-cutting and scarification on the water quality of small brooks. Hydrobiologia 1992, 243–244, 465–473. [Google Scholar] [CrossRef]
  14. Rosén, K.; Aronson, J.A.; Eriksson, H.M. Effects of clear-cutting on streamwater quality in forest catchments in central Sweden. For. Ecol. Manag. 1996, 83, 237–244. [Google Scholar] [CrossRef]
  15. Ahtiainen, M.; Huttunen, P. Long term effects of forestry managements on water quality and loading in brooks. Boreal Environ. Res. 1999, 4, 101–114. [Google Scholar]
  16. Nieminen, M. Effects of clear-cutting and site preparation on water quality from a drained Scots pine mire in southern Finland. Boreal Environ. Res. 2003, 8, 53–59. [Google Scholar]
  17. Nieminen, M. Export of dissolved organic carbon, nitrogen and phosphorus following clear-cutting of three Norway spruce forests growing on drained peatlands in southern Finland. Silva Fenn. 2004, 38, 123–132. [Google Scholar] [CrossRef] [Green Version]
  18. Piirainen, S.; Finér, L.; Mannerkoski, H.; Starr, M. Carbon, nitrogen and phosphorus leaching after site preparation at a boreal forest clear-cut area. For. Ecol. Manag. 2007, 243, 10–18. [Google Scholar] [CrossRef]
  19. Löfgren, S.; Ring, E.; von Brömssen, C.; Sørensen, R.; Högbom, L. Short-term Effects of Clear-cutting on the Water Chemistry of Two Boreal Streams in Northern Sweden: A Paired Catchment Study. Ambio 2009, 38, 347–356. [Google Scholar] [CrossRef]
  20. Nieminen, M.; Sallantaus, T.; Ukonmaanaho, L.; Nieminen, T.M.; Sarkkola, S. Nitrogen and phosphorus concentrations in discharge from drained peatland forests are increasing. Sci. Total. Environ. 2017, 609, 974–981. [Google Scholar] [CrossRef] [PubMed]
  21. Ide, J.; Finér, L.; Laurén, A.; Piirainen, S.; Launiainen, S. Effects of clear-cutting on annual and seasonal runoff from a boreal forest catchment in eastern Finland. For. Ecol. Manag. 2013, 304, 482–491. [Google Scholar] [CrossRef]
  22. Schelker, J.; Kuglerová, L.; Eklöf, K.; Bishop, K.; Laudon, H. Hydrological effects of clear-cutting in a boreal forest – Snowpack dynamics, snowmelt and streamflow responses. J. Hydrol. 2013, 484, 105–114. [Google Scholar] [CrossRef]
  23. Lundmark-Thelin, A.; Johansson, M.B. Influence of mechanical site preparation on decomposition and nutrient dynamics of Norway spruce ( Picea abies (L.) Karst.) needle litter and slash needles. For. Ecol. Manag. 1997, 96, 101–110. [Google Scholar] [CrossRef]
  24. Paavolainen, L.; Smolander, A. Nitrification and denitrification in soil from a clear-cut norway spruce (Picea abies) stand. Soil Biol. Biochem. 1998, 30, 775–781. [Google Scholar] [CrossRef]
  25. Smolander, A.; Kitunen, V.; Mälkönen, E. Dissolved soil organic nitrogen and carbon in a Norway spruce stand and an adjacent clear-cut. Biol. Fertil. Soils 2001, 33, 190–196. [Google Scholar] [CrossRef]
  26. Schelker, J.; Grabs, T.; Bishop, K.; Laudon, H. Drivers of increased organic carbon concentrations in stream water following forest disturbance: Separating effects of changes in flow pathways and soil warming. J. Geophys.-Res.-Biogeosci. 2013, 118, 1814–1827. [Google Scholar] [CrossRef]
  27. Finér, L.; Mannerkoski, H.; Piirainen, S.; Starr, M. Carbon and nitrogen pools in an old-growth, Norway spruce mixed forest in eastern Finland and changes associated with clear-cutting. For. Ecol. Manag. 2003, 174, 51–63. [Google Scholar] [CrossRef]
  28. Palviainen, M.; Finér, L.; Mannerkoski, H.; Piirainen, S.; Starr, M. Responses of ground vegetation species to clear-cutting in a boreal forest: Aboveground biomass and nutrient contents during the first 7 years. Ecol. Res. 2005, 20, 652–660. [Google Scholar] [CrossRef]
  29. Palviainen, M.; Finer, L.; Kurka, A.M.; Mannerkoski, H.; Piirainen, S.; Starr, M. Release of potassium, calcium, iron and aluminium from Norway spruce, Scots pine and silver birch logging residues. Plant Soil 2004, 259, 123–136. [Google Scholar] [CrossRef]
  30. Palviainen, M.; Finér, L.; Laurén, A.; Mannerkoski, H.; Piirainen, S.; Starr, M. Development of ground vegetation biomass and nutrient pools in a clear-cut disc-plowed boreal forest. Plant Soil 2007, 297, 43–52. [Google Scholar] [CrossRef]
  31. Räike, A.; Taskinen, A.; Knuuttila, S. Nutrient export from Finnish rivers into the Baltic Sea has not decreased despite water protection measures. Ambio 2020, 49, 460–474. [Google Scholar] [CrossRef] [Green Version]
  32. Finér, L.; Lepistö, A.; Karlsson, K.; Räike, A.; Härkönen, L.; Huttunen, M.; Joensuu, S.; Kortelainen, P.; Mattsson, T.; Piirainen, S.; et al. Drainage for forestry increases N, P and TOC export to boreal surface waters. Sci. Total. Environ. 2021, 762, 144098. [Google Scholar] [CrossRef]
  33. Aaltonen, H.; Tuukkanen, T.; Palviainen, M.; Lauren, A.A.; Tattari, S.; Piirainen, S.; Mattsson, T.; Ojala, A.; Launiainen, S.; Finer, L. Controls of Organic Carbon and Nutrient Export from Unmanaged and Managed Boreal Forested Catchments. Water 2021, 13, 2363. [Google Scholar] [CrossRef]
  34. Tattari, S.; Koskiaho, J.; Kosunen, M.; Lepistö, A.; Linjama, J.; Puustinen, M. Nutrient loads from agricultural and forested areas in Finland from 1981 up to 2010—Can the efficiency of undertaken water protection measures seen? Environ. Monit. Assess. 2017, 189, 95. [Google Scholar] [CrossRef] [Green Version]
  35. Laurén, A.; Lappalainen, M.; Kieloaho, A.J.; Karhu, K.; Palviainen, M. Temperature sensitivity patterns of carbon and nitrogen processes in decomposition of boreal organic soils—Quantification in different compounds and molecule sizes based on a multifactorial experiment. PLOS ONE 2019, 14, e0223446. [Google Scholar] [CrossRef]
  36. Ojanen, P.; Minkkinen, K.; Alm, J.; Penttilä, T. Soil–atmosphere CO2, CH4 and N2O fluxes in boreal forestry-drained peatlands. For. Ecol. Manag. 2010, 260, 411–421. [Google Scholar] [CrossRef]
  37. Laurén, A.; Palviainen, M.; Launiainen, S.; Leppä, K.; Stenberg, L.; Urzainki, I.; Nieminen, M.; Laiho, R.; Hökkä, H. Drainage and Stand Growth Response in Peatland Forests—Description, Testing, and Application of Mechanistic Peatland Simulator SUSI. Forests 2021, 12, 293. [Google Scholar] [CrossRef]
  38. Eriksson, L.O.; Löfgren, S.; Öhman, K. Implications for forest management of the EU Water Framework Directive’s stream water quality requirements—A modeling approach. For. Policy Econ. 2011, 13, 284–291. [Google Scholar] [CrossRef]
  39. Alahuhta, J.; Hökkä, V.; Saarikoski, H.; Hellsten, S. Practical integration of river basin and land use planning: Lessons learned from two Finnish case studies. Geogr. J. 2010, 176, 319–333. [Google Scholar] [CrossRef]
  40. Laudon, H.; Kuglerová, L.; Sponseller, R.A.; Futter, M.; Nordin, A.; Bishop, K.; Lundmark, T.; Egnell, G.; Ågren, A.M. The role of biogeochemical hotspots, landscape heterogeneity, and hydrological connectivity for minimizing forestry effects on water quality. Ambio 2016, 45, 152–162. [Google Scholar] [CrossRef] [Green Version]
  41. Palviainen, M.; Finér, L.; Laurén, A.; Högbom, L. A method to estimate the impact of clear-cutting on nutrient concentrations in boreal headwater streams. Ambio 2015, 44, 521–531. [Google Scholar] [CrossRef] [PubMed] [Green Version]
  42. Mattsson, T.; Finér, L.; Kortelainen, P.; Sallantaus, T. Brook Water Quality and Background Leaching from Unmanaged Forested Catchments in Finland. Water, Air Soil Pollut. 2003, 147, 275–298. [Google Scholar] [CrossRef]
  43. Gundersen, P.; Schmidt, I.K.; Raulund-Rasmussen, K. Leaching of nitrate from temperate forests – effects of air pollution and forest management. Environ. Rev. 2006, 14, 1–57. [Google Scholar] [CrossRef]
  44. Futter, M.; Ring, E.; Högbom, L.; Entenmann, S.; Bishop, K. Consequences of nitrate leaching following stem-only harvesting of Swedish forests are dependent on spatial scale. Environ. Pollut. 2010, 158, 3552–3559. [Google Scholar] [CrossRef]
  45. Blackburn, M.; Ledesma, J.L.J.; Näsholm, T.; Laudon, H.; Sponseller, R.A. Evaluating hillslope and riparian contributions to dissolved nitrogen (N) export from a boreal forest catchment. J. Geophys. Res. Biogeosci. 2017, 122, 324–339. [Google Scholar] [CrossRef]
  46. Schelker, J.; Sponseller, R.; Ring, E.; Högbom, L.; Löfgren, S.; Laudon, H. Nitrogen export from a boreal stream network following forest harvesting: Seasonal nitrate removal and conservative export of organic forms. Biogeosciences 2016, 13, 1–12. [Google Scholar] [CrossRef] [Green Version]
  47. Bredemeier, M.; Blanck, K.; Xu, Y.J.; Tietema, A.; Boxman, A.; Emmett, B.; Moldan, F.; Gundersen, P.; Schleppi, P.; Wright, R. Input-output budgets at the NITREX sites. For. Ecol. Manag. 1998, 101, 57–64. [Google Scholar] [CrossRef]
  48. Piirainen, S. Nutrient Fluxes through a Boreal Coniferous Forest and the Effects of Clear-Cutting. Ph.D. Thesis, Metsäntutkimuslaitos, Helsinki, Finland, 2002. [Google Scholar]
  49. Lucander, K.; Zanchi, G.; Akselsson, C.; Belyazid, S. The Effect of Nitrogen Fertilization on Tree Growth, Soil Organic Carbon and Nitrogen Leaching-A Modeling Study in a Steep Nitrogen Deposition Gradient in Sweden. Forests 2021, 12, 298. [Google Scholar] [CrossRef]
  50. Poikolainen, J.; Piispanen, J.; Karhu, J.; Kubin, E. Long-term changes in nitrogen deposition in Finland (1990–2006) monitored using the moss Hylocomium splendens. Environ. Pollut. (1987) 2009, 157, 3091–3097. [Google Scholar] [CrossRef] [PubMed]
  51. Laurén, A.; Heinonen, J.; Koivusalo, H.; Sarkkola, S.; Tattari, S.; Mattsson, T.; Ahtiainen, M.; Joensuu, S.; Kokkonen, T.; Finér, L. Implications of Uncertainty in a Pre-treatment Dataset when Estimating Treatment Effects in Paired Catchment Studies: Phosphorus Loads from Forest Clear-cuts. Water Air Soil Pollut. 2009, 169, 251–261. [Google Scholar] [CrossRef]
  52. Finér, L.; Mattsson, T.; Joensuu, S.; Koivusalo, H.; Laurén, A.; Makkonen, T.; Nieminen, M.; Tattari, S.; Ahti, E.; Kortelainen, P.; et al. Metsäisten Valuma-Alueiden Vesistökuormituksen Laskenta; Suomen Ympäristö: Helsinki, Finland, 2010; 33p. (In Finnish) [Google Scholar]
  53. Åström, M.; Aaltonen, E.K.; Koivusaari, J. Impact of forest ditching on nutrient loadings of a small stream—A paired catchment study in Kronoby, W. Finland. Sci. Total. Environ. 2002, 297, 127–140. [Google Scholar] [CrossRef] [PubMed]
  54. Moore, R.D.; Allen, D.; MacKenzie, L.; Spittlehouse, D.; Winkler, R. Data sets for the Upper Penticton Creek watershed experiment: A paired-catchment study to support investigations of watershed response to forest dynamics and climatic variability in an inland snow-dominated region. Hydrol. Process. 2021, 35, e14391. [Google Scholar] [CrossRef]
  55. Neary, D. Long-Term Forest Paired Catchment Studies: What Do They Tell Us That Landscape-Level Monitoring Does Not? Forests 2016, 7, 164. [Google Scholar] [CrossRef] [Green Version]
  56. Köhler, S.; Buffam, I.; Seibert, J.; Bishop, K.; Laudon, H. Dynamics of stream water TOC concentrations in a boreal headwater catchment: Controlling factors and implications for climate scenarios. J. Hydrol. 2009, 373, 44–56. [Google Scholar] [CrossRef]
  57. Lauren, A.A.; Guan, M.; Salmivaara, A.; Leinonen, A.; Palviainen, M.; Launiainen, S. NutSpaFHy—A Distributed Nutrient Balance Model to Predict Nutrient Export from Managed Boreal Headwater Catchments. Forests 2021, 12, 808. [Google Scholar] [CrossRef]
  58. Launiainen, S.; Guan, M.; Salmivaara, A.; Kieloaho, A.J. Modeling boreal forest evapotranspiration and water balance at stand and catchment scales: A spatial approach. Hydrol. Earth Syst. Sci. 2019, 23, 3457–3480. [Google Scholar] [CrossRef] [Green Version]
  59. Pohjanmies, T.; Genikova, N.; Hotanen, J.; Ilvesniemi, H.; Kryshen, A.; Moshnikov, S.; Oksanen, J.; Salemaa, M.; Tikhonova, E.; Tonteri, T.; et al. Site types revisited: Comparison of traditional Russian and Finnish classification systems for European boreal forests. Appl. Veg. Sci. 2021, 24, e12525. [Google Scholar] [CrossRef]
  60. Beven, K.; Binley, A. The Future of Distributed Models—Model Calibration and Uncertainty Prediction. Hydrol. Process. 1992, 6, 279–298. [Google Scholar] [CrossRef]
  61. Mäkisara, K.; Katila, M.; Peräsaari, J.; Tomppo, E. The Multi-Source National Forest Inventory of Finland–Methods and Results 2013. 2016. Available online: https://jukuri.luke.fi/handle/10024/532147 (accessed on 1 March 2020).
  62. Salmivaara, A. Topographical Wetness Index for Finland, 16m. 2016. Available online: http://urn.fi/urn:nbn:fi:csc-kata20170511114638598124 (accessed on 1 March 2020).
  63. NLSF, N.L.S.o.F. Topographic Database. Available online: http://www.maanmittauslaitos.fi/en/e-services/open-data-file-download-service (accessed on 1 March 2020).
  64. GSF, G.S.o.F. bedrock 1:200 000 and superficial deposits 1:20 000, 1:50 000 and 1:200 000. 2015. Available online: https://hakku.gtk.fi/en (accessed on 1 March 2020).
  65. Aalto, J.; Pirinen, P.; Jylhä, K. New gridded daily climatology of Finland: Permutation-based uncertainty estimates and temporal trends in climate. J. Geophys. Res. Atmos. 2016, 121, 3807–3823. [Google Scholar] [CrossRef] [Green Version]
  66. Salmivaara, A.; Leinonen, A.; Palviainen, M.; Korhonen, N.; Launiainen, S.; Tuomenvirta, H.; Ukonmaanaho, L.; Finér, L.; Laurén, A. Exploring the Role of Weather and Forest Management on Nutrient Export in Boreal Forested Catchments Using Spatially Distributed Model. Forests 2023, 14, 89. [Google Scholar] [CrossRef]
  67. Palviainen, M.; Laurén, A.; Launiainen, S.; Piirainen, S. Predicting the export and concentrations of organic carbon, nitrogen and phosphorus in boreal lakes by catchment characteristics and land use: A practical approach. Ambio 2016, 45, 933–945. [Google Scholar] [CrossRef] [PubMed] [Green Version]
  68. Tattari, S.; Leinonen, A. Malliperheen Sovellus Puruveden Vesistöalueelle Applying the National Integrated Modelling framework in Lake Puruvesi Region Report of Milestone 3. First Applications on National Integrated Model for River Basin Management Pilot Areas to Be Applied Ready (Case Puruvesi); Freshabit Life IP, Metsähallitus: Vantaa, Finland, 2017; 45p. (In Finnish) [Google Scholar]
  69. Nieminen, M.; Sarkkola, S.; Hellsten, S.; Marttila, H.; Piirainen, S.; Sallantaus, T.; Lepistö, A. Increasing and Decreasing Nitrogen and Phosphorus Trends in Runoff from Drained Peatland Forests—Is There a Legacy Effect of Drainage or Not? Water Air Soil Pollut. 2018, 229, 1–10. [Google Scholar] [CrossRef]
  70. Nieminen, M.; Launiainen, S.; Ojanen, P.; Sarkkola, S.; Laurén, A. Metsätalouden vesistökuormitus: Nykykäsitys ja tulevaisuuden menetelmäkehitys. MetsäTieteen Aikakauskirja 2020, 2020, 1–9. [Google Scholar] [CrossRef]
  71. Karlsen, R.H.; Seibert, J.; Grabs, T.; Laudon, H.; Blomkvist, P.; Bishop, K. The assumption of uniform specific discharge: Unsafe at any time? Hydrol. Process. 2016, 30, 3978–3988. [Google Scholar] [CrossRef] [Green Version]
  72. Kortelainen, P.; Mattsson, T.; Finér, L.; Ahtiainen, M.; Saukkonen, S.; Sallantaus, T. Controls on the export of C, N, P and Fe from undisturbed boreal catchments, Finland. Aquat. Sci. 2006, 68, 453–468. [Google Scholar] [CrossRef]
  73. Laiho, R.; Laine, J. Nitrogen and phosphorus stores in Peatlands drained for forestry in Finland. Scand. J. For. Res. 1994, 9, 251–260. [Google Scholar] [CrossRef]
  74. Kotamäki, N.; Pätynen, A.; Taskinen, A.; Huttula, T.; Malve, O. Statistical Dimensioning of Nutrient Loading Reduction: LLR Assessment Tool for Lake Managers. Environ. Manag. 2015, 56, 480–491. [Google Scholar] [CrossRef]
  75. Laurén, A.; Koivusalo, H.; Ahtikoski, A.; Kokkonen, T.; Finér, L. Water protection and buffer zones: How much does it cost to reduce nitrogen load in a forest cutting? Scand. J. For. Res. 2007, 22, 537–544. [Google Scholar] [CrossRef]
  76. Väänänen, R.; Nieminen, M.; Vuollekoski, M.; Nousiainen, H.; Sallantaus, T.; Tuittila, E.S.; Ilvesniemi, H. Retention of phosphorus in peatland buffer zones at six forested catchments in southern Finland. Silva Fenn. (Helsinki Finl. 1967) 2008, 42. [Google Scholar] [CrossRef] [Green Version]
  77. Vikman, A.; Sarkkola, S.; Koivusalo, H.; Sallantaus, T.; Laine, J.; Silvan, N.; Nousiainen, H.; Nieminen, M. Nitrogen retention by peatland buffer areas at six forested catchments in southern and central Finland. Hydrobiologia 2010, 641, 171–183. [Google Scholar] [CrossRef]
  78. Vidon, P.; Allan, C.; Burns, D.; Duval, T.P.; Gurwick, N.; Inamdar, S.; Lowrance, R.; Okay, J.; Scott, D.; Sebestyen, S. Hot Spots and Hot Moments in Riparian Zones: Potential for Improved Water Quality Management. J. Am. Water Resour. Assoc. 2010, 46, 278–298. [Google Scholar] [CrossRef]
  79. Miettinen, J.; Ollikainen, M.; Finér, L.; Koivusalo, H.; Laurén, A.; Valsta, L. Diffuse Load Abatement with Biodiversity Co-Benefits: The Optimal Rotation Age and Buffer Zone Size. For. Sci. 2012, 58, 342–352. [Google Scholar] [CrossRef]
  80. Miettinen, J.; Ollikainen, M.; Nieminen, M.; Valsta, L. Cost function approach to water protection in forestry. Water Resour. Econ. 2020, 31, 100150. [Google Scholar] [CrossRef]
  81. Nieminen, M.; Sarkkola, S.; Laurén, A. Impacts of forest harvesting on nutrient, sediment and dissolved organic carbon exports from drained peatlands: A literature review, synthesis and suggestions for the future. For. Ecol. Manag. 2017, 392, 13–20. [Google Scholar] [CrossRef]
  82. Palviainen, M.; Peltomaa, E.; Laurén, A.; Kinnunen, N.; Ojala, A.; Berninger, F.; Zhu, X.; Pumpanen, J. Water quality and the biodegradability of dissolved organic carbon in drained boreal peatland under different forest harvesting intensities. Sci. Total. Environ. 2022, 806, 150919. [Google Scholar] [CrossRef] [PubMed]
  83. Leppä, K.; Hökkä, H.; Laiho, R.; Launiainen, S.; Lehtonen, A.; Mäkipää, R.; Peltoniemi, M.; Saarinen, M.; Sarkkola, S.; Nieminen, M. Selection Cuttings as a Tool to Control Water Table Level in Boreal Drained Peatland Forests. Front. Earth Sci. 2020, 8, 428. [Google Scholar] [CrossRef]
  84. Tiwari, T.; Lundström, J.; Kuglerová, L.; Laudon, H.; Öhman, K.; Ågren, A.M. Cost of riparian buffer zones: A comparison of hydrologically adapted site-specific riparian buffers with traditional fixed widths. Water Resour. Res. 2016, 52, 1056–1069. [Google Scholar] [CrossRef] [Green Version]
  85. Kuglerová, L.; Ågren, A.; Jansson, R.; Laudon, H. Towards optimizing riparian buffer zones: Ecological and biogeochemical implications for forest management. For. Ecol. Manag. 2014, 334, 74–84. [Google Scholar] [CrossRef]
  86. Ledesma, J.L.J.; Futter, M.N.; Blackburn, M.; Lidman, F.; Grabs, T.; Sponseller, R.A.; Laudon, H.; Bishop, K.H.; Köhler, S.J. Towards an Improved Conceptualization of Riparian Zones in Boreal Forest Headwaters. Ecosystems 2017, 21, 297–315. [Google Scholar] [CrossRef] [Green Version]
  87. Lundström, J.; Öhman, K.; Laudon, H. Comparing buffer zone alternatives in forest planning using a decision support system. Scand. J. For. Res. 2018, 33, 493–501. [Google Scholar] [CrossRef]
  88. Urzainki, I.; Lauren, A.; Palviainen, M.; Haahti, K.; Budiman, A.; Basuki, I.; Netzer, M.; Hokka, H. Canal blocking optimization in restoration of drained peatlands. Biogeosciences 2020, 17, 4769–4784. [Google Scholar] [CrossRef]
  89. Niemi, M.T.; Ojanen, P.; Sarkkola, S.; Vasander, H.; Minkkinen, K.; Vauhkonen, J. Using a digital elevation model to place overland flow fields and uncleaned ditch sections for water protection in peatland forest management. Ecol. Eng. 2023, 190, 106945. [Google Scholar] [CrossRef]
  90. Laudon, H.; Maher Hasselquist, E. Applying continuous-cover forestry on drained boreal peatlands; water regulation, biodiversity, climate benefits and remaining uncertainties. Trees, For. People 2023, 11, 100363. [Google Scholar] [CrossRef]
  91. Santos, R.; Sanches Fernandes, L.; Pereira, M.; Cortes, R.; Pacheco, F. A framework model for investigating the export of phosphorus to surface waters in forested watersheds: Implications to management. Sci. Total. Environ. 2015, 536, 295–305. [Google Scholar] [CrossRef]
Figure 1. Vehka–Kuonanjärvi, Finland study area with sub-catchments 1–33, water bodies and stream network.
Forests 14 00612 g001
Figure 2. Sub-catchments 1–33, Forestland site fertility classes and peatlands in the study area. The lowest fertility classes are predominantly found in the peatland areas.
Forests 14 00612 g002
Figure 3. Location of the regeneration-mature forest compartments in 33 sub-catchments of the Vehka–Kuonanjärvi study area. Red-to-orange color indicates the quantity of the clear-cut scenarios where a forest compartment was present. Every forest compartment was selected for a minimum of 15 scenarios, and a maximum of 50 scenarios.
Forests 14 00612 g003
Figure 4. Mean annual absolute (a), relative total nitrogen (TN) export increase (b) and the specific export (c) from clear-cut sites in 100 scenarios during the 10-year simulation period. Absolute export increase (a) was calculated by subtracting the background export (scenario with no logging) from each harvesting scenario. Relative export increase (b) was the percentage of the absolute nutrient export increase from the background export. Specific export (c) was calculated by dividing the absolute export increment by the clear-cut area.
Forests 14 00612 g004
Figure 5. Mean annual absolute (a), relative total phosphorus (TP) export increase (b) and specific export (c) from clear-cut sites in 100 scenarios during the 10-year simulation period. Absolute export increase (a) was calculated by subtracting the background export (scenario with no logging) from each harvesting scenario. Relative export increase (b) was the percentage of the absolute nutrient export increase from the background export. Specific export (c) was calculated by dividing the absolute export increment by the clear-cut area.
Forests 14 00612 g005
Figure 6. Mean annual total nitrogen (TN) export increase broken down to sub-catchments in 100 clear-cut scenarios during the 10-year simulation period. The panels present: (a) absolute TN export increase; (b) increase as percentage from the background load; (c) increase in TN export per sub-catchment area; and (d) specific export (additional kg ha−1 in clear-cut area).
Forests 14 00612 g006
Figure 7. Mean annual total phosphorus (TP) export increase in 100 clear-cut scenarios during the 10-year simulation period. The panels present: (a) absolute TP export increase; (b) increase as percentage from the background load; (c) increase in TP export per sub-catchment area; and (d) specific export (additional kg ha−1 in clear-cut area.)
Forests 14 00612 g007
Figure 8. Absolute (left axis, bars) and relative (right axis, line) average annual total nitrogen (TN) (a) and total phosphorus (TP) (b) background export during the simulated 10 year period in the 33 sub-catchments.
Forests 14 00612 g008
Figure 9. The correlation between total nitrogen (TN) (a) and total phosphorus (TP) (b) background export (kg ha−1year−1) and sub-catchment characteristics.
Forests 14 00612 g009
Figure 10. The sub-catchment background export (bars) and excess export caused by the clear-cuts (dots) for TN (a) and TP (b). Each dot represents one of the 100 clear-cut scenarios.
Forests 14 00612 g010
Figure 11. Grid-level cumulative total nitrogen export from sub-catchments 21 (a,b) and 26, (c,d) according to two different clear-cut scenarios. The clear-cut areas and nutrient export hotspots are indicated by green and red. Hotspots followed only partially the clear-cut locations indicating the presence of background export hotspots. The hotspot area was 5% of the total forest area (see also Table 1).
Forests 14 00612 g011
Figure 12. Presentation of a framework for water protection planning in a forested catchment. For defining the nutrient export reduction target (Phase 1), the actual nutrient export to the receiving waterbody needs to be calculated. If the export exceeds the tolerance of the waterbody, directing additional investments to the catchment is needed (Phase 2). The work should be started by first identifying sub-catchments with high export relative to their forest area (Phase 2.1), and then proceeding to those sub-catchments (e.g. sub-catchment 2 in the figure) using nutrient storage maps (Phase 2.2).
Forests 14 00612 g012
Table 1. Contribution of the within-catchment hotspots (top 5 % of the catchment area) for the TNkg and TPkg export sum. TN% and TP% are the share of nutrient export of the hotspot areas from the total nutrient export during the 10 year period.
ScenarioClear-Cut%TNkg catch.TNkg hotspotTN%TPkg catch.TPkg hotspotTP%
Background 21041,23610,3042575643357
Clear-cut 21A1751,82011,2222280346157
Clear-cut 21B1762,40414,81024157467443
Background 26045,83011,54025239167128
Clear-cut 26A451,94010,55621273873927
Clear-cut 26B251,86411,08921281177027
Disclaimer/Publisher’s Note: The statements, opinions and data contained in all publications are solely those of the individual author(s) and contributor(s) and not of MDPI and/or the editor(s). MDPI and/or the editor(s) disclaim responsibility for any injury to people or property resulting from any ideas, methods, instructions or products referred to in the content.

