Article

Differences in the Responses of Tree-Ring Stable Carbon Isotopes of L. sibirica and P. schrenkiana to Climate in the Eastern Tianshan Mountains

1
Key Laboratory of Oasis Ecology of Education Ministry, College of Ecology and Environment, Xinjiang University, Urumqi 830017, China
2
Xinjiang Key Laboratory of Tree Ring Ecology, Key Laboratory of Tree-Ring Physical and Chemical Research (CMA), Institute of Desert Meteorology, China Meteorological Administration, Urumqi 830002, China
3
Center of Xinjiang Meteorological Information, Urumqi 830002, China
4
State Key Laboratory of Marine Geology, Tongji University, Shanghai 200092, China
*
Author to whom correspondence should be addressed.
Submission received: 22 April 2023 / Revised: 6 May 2023 / Accepted: 10 May 2023 / Published: 17 May 2023
(This article belongs to the Special Issue Response of Tree Rings to Climate Change and Climate Extremes)

Abstract

:
The eastern Tianshan Mountains are located in the arid interior of Asia, where tree growth is especially sensitive to climate. The ratio of stable carbon isotopes (δ13C) in the tree rings can provide information on changes in atmospheric CO2 concentrations, water availability, and physiological processes within the tree. In particular, the use of tree-ring δ13C values as a proxy for past atmospheric CO2 concentrations has gained widespread acceptance. In this study, detrended stable carbon isotope chronologies (13Ccorr) of Larix sibirica Ledeb. and Picea schrenkiana Fisch. et Mey was established using tree-ring samples from high elevations in the eastern Tianshan Mountains of Xinjiang, China. The relationships between the tree-ring 13Ccorr and different climatic factors were explored using the correlation function and collinearity analysis. Our results demonstrate that the tree-ring δ13Ccorr of L. sibirica is significantly and negatively correlated with precipitation and relative humidity during the growing season. The main climate factor affecting the stable carbon isotope fractionation of L. sibirica during the growing season is relative humidity during the growing season. The tree-ring δ13Ccorr of P. schrenkiana is significantly and negatively correlated with the mean temperature, mean minimum temperature, precipitation, and vapor pressure deficit from the end of the previous growing season and throughout the current growing season, especially in summer. However, it is significantly and positively correlated with relative humidity, indicating that the relationship between the climate factors and the tree-ring stable carbon isotope fractionation of P. schrenkiana is more complex. Further analysis showed that summer temperature and summer precipitation jointly controlled the tree-ring stable carbon isotope fractionation of P. schrenkiana at a high elevation. This research has important implications for our understanding of past and future climate change, as well as for the development of effective strategies to mitigate and adapt to these changes. This study also contributed to the development of a more in-depth understanding of the effects of climate change on tree growth in extremely arid environments and provided evidence to support effective forest management in arid regions.

1. Introduction

Due to their high accuracy, continuity, and strong sensitivity to environmental fluctuations, stable carbon isotopes in tree rings have become a crucial tool in dendroclimatological research [1,2]. The ratios of stable isotopes preserved in xylem cells contain information regarding past environmental conditions and are an important proxy in paleoclimate studies. They are crucial to researching both stage-specific historical environmental changes and the global carbon cycle [3]. The response of stable carbon isotopes in tree rings to climate factors varies from region to region and from species to species [4]. In many parts of the world, the response of tree-ring 13C to the climate in various coniferous and broadleaf tree species has been studied and used to accurately reconstruct climate data over hundreds and even thousands of years [5,6,7,8,9,10,11,12,13,14].
Northwestern China and the Qinghai-Tibet Plateau are ideal for dendroclimatology studies because tree growth in both regions is more sensitive to climate change, but there are significant regional differences in the responses of tree growth to climate [15,16,17,18,19,20]. Two tree species—Larix sibirica Ledeb. and Picea schrenkiana Fisch. et Mey—predominate in the Tianshan Mountains: the largest mountain system in the inland arid region of Asia. L. sibirica and P. schrenkiana, which are both endemic to the mountains and capable of withstanding cold and drought, are well-suited to dendroclimatological studies. In arid inland Asia, most dendroclimatological studies are based on tree-ring width parameter reconstruction, and tree-ring stable isotope studies are scarce [21,22,23,24]. Zhang et al. [25,26] reconstructed temperature changes in southeast Kazakhstan based on tree-ring stable carbon isotopes and combined the tree-ring width and stable carbon isotopes to reconstruct glacier mass balance changes. Qin et al. [27,28] analyzed differences in the tree-ring stable carbon isotope fractionation of P. schrenkiana in response to climate on the northern and southern slopes of the Tianshan Mountains. They also reconstructed changes in relative humidity in the eastern Tianshan Mountains over the past 443 years using tree-ring widths from L. sibirica. Nevertheless, tree-ring width can only reflect moisture information, and it is difficult to capture temperature information in the extremely arid eastern Tianshan Mountains. Therefore, other tree-ring parameters should be extracted for further study. Shang et al. [29] analyzed the stable carbon isotope composition of P. schrenkiana on the northern slope of the eastern Tianshan Mountains and explored its climatic and environmental significance. Zhang et al. [30] revealed the relationship between tree-ring stable carbon isotopes of L. sibirica and climate elements and discussed the climate response mechanism.
However, the responses of L. sibirica and P. schrenkiana to the climate in the same region remain unclear. Further studies are needed to understand how climate affects the tree-ring stable carbon isotope fractionation of different tree species in extremely arid inland Asia. In this study, the tree-ring stable carbon isotope chronologies of L. sibirica and P. schrenkiana were established, and the relationship between the tree-ring stable carbon isotopes of these two species and multiple climatic factors was investigated. The response relationships between tree-ring stable carbon isotope fractionation processes in response to climate were further explored based on the physiological mechanisms and the characteristics of the tree species itself.

2. Data and Methods

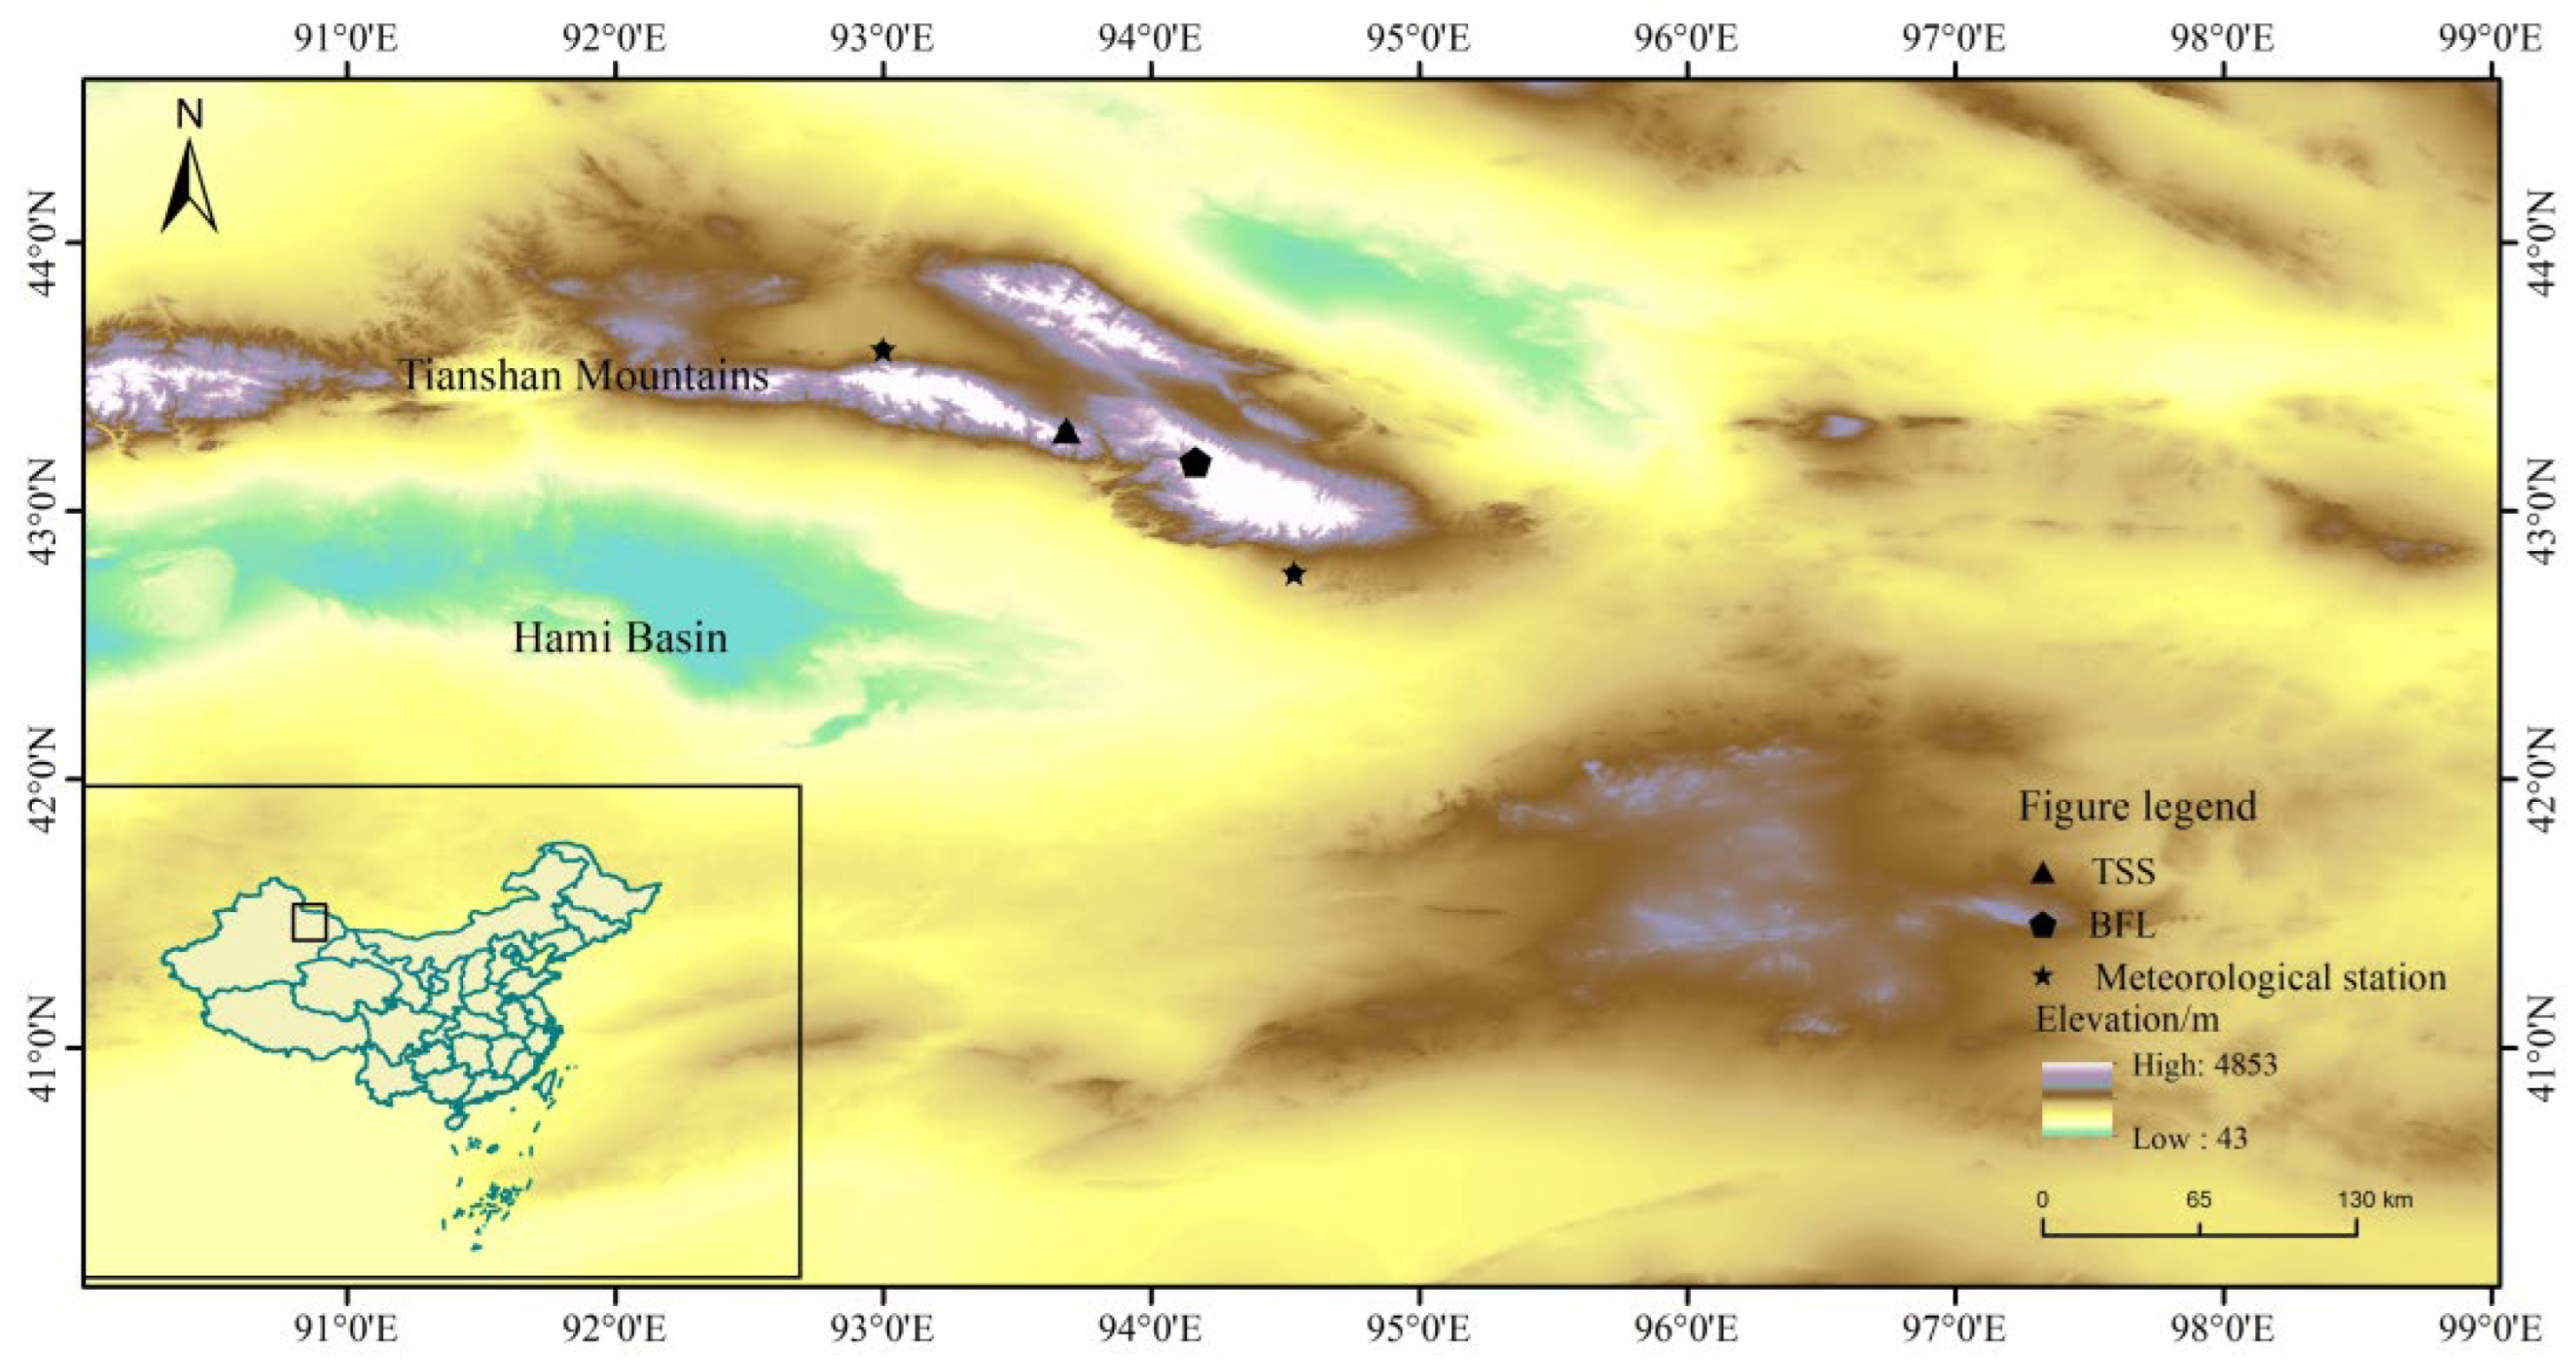
2.1. Overview of the Study Area and Sample Collection

The Tianshan Mountains are located in the middle of Asia and stretch from west to east across central Xinjiang, China, Kyrgyzstan, and Kazakhstan. This massive mountain ecosystem is characterized by low precipitation, prolonged sunshine hours, significant diurnal temperature differences, and an uneven distribution of precipitation that is primarily influenced by the westerly wind belt [31].
In July 2017, we collected 60 tree core samples by using growth cones measuring 10 mm in diameter from 25 L. sibirica individuals at breast height in the Banfang Gorge (BFL). We also collected 48 core samples from 24 P. schrenkiana individuals growing at the Tianshan Temple (TSS) and located in the eastern Tianshan Mountains of Hami (Figure 1. Details regarding the sampling sites are shown in Table 1.

2.2. Stable Carbon Isotope Chronologies Development

In accordance with fundamental dendrochronological principles and procedures, samples were air-dried and fixed, sanded, and visually dated in the lab. Then, ring-width measurements were made using a ring-width meter with an accuracy of 0.001 mm and the MeasureJ2X program. Cross-dating tests were carried out using the COFECHA program [32]. Outlier measurements, as well as chronologies that were poorly correlated with the master chronology, were removed in order to increase the accuracy of the tests. Tree-ring chronology was standardized using ARSTAN [33].
We selected 14 cores from 7 trees of L. sibirica and P. schrenkiana to develop the tree-ring stable isotope chronologies, respectively. Tree cores with no missing rings, no obvious damage, a high correlation with primary chronology, and distinct tree-ring boundaries were selected for further study based on cross-dating. The first thirty years of each tree core were removed to prevent bias due to juvenile effects [34,35]. Using a scalpel, the remaining cores were segmented year by year under a microscope. Segmentation was carried out by mixing core samples from the same calendar year with cross-dated ring-width data. Samples from each year were thoroughly crushed and mixed using a mixing ball mill (MM400, Retsch GmbH, Haan-Germany). Afterward, all samples were subjected to year-by-year α-cellulose extraction using the acetate and nitrate mixing method of Brendel et al. [36]. A 17% NaOH treatment was added to remove lignin and non-cellulosic polysaccharides [37], which is a method that is widely used in tree-ring stable isotope studies [25,26,38].
Year-by-year cellulose samples of 70–100 μg were wrapped in tin cups in the form of cubes or spheres, and stable carbon isotopes were measured using an Elemental Analyzer (Flash EA 1112; Thermo Fisher Scientific, Waltham, MA, USA) and a Stable Isotope Mass Spectrometer (MAT253, Thermo Fisher Scientific, Bremen GmbH, Bremen, Germany) at the Key Laboratory of the Ministry of the Western Environment, Lanzhou University. A laboratory-known graphite standard (−16.0‰) was measured simultaneously for every 7 samples measured. The analytical error (standard deviation) of the isotopic measurements was less than 0.05‰. The stable carbon isotope expression was defined as the relative abundance compared to the South Carolina Cretaceous Pee Dee Formation Stratigraphic American aragonite fossil (Vienna Pee Dee Belemnite VPDB) standard [39] and was calculated as follows:
δ 13 C = 13 C / 12 C sample 13 C / 12 C VPDB 1 × 10 3  
Studies have shown that the concentration of CO2 in the atmosphere has continued to rise since the industrial revolution due to the extensive use of fossil fuels [40]. Trees continuously absorb atmospheric CO2 through photosynthesis as they develop; as a result, variations in the amount of CO2 in the atmosphere inevitably affect the values of 13C in tree rings. Carbon isotopes in tree rings are affected by the balance between plant photosynthesis and respiration, which can be influenced by environmental factors such as temperature, precipitation, and solar radiation. However, the isotopic fractionation of carbon can also be influenced by the concentration of atmospheric CO2, as plants tend to discriminate against the heavier isotope of carbon when they fix CO2. This results in a decrease in the isotopic ratio of carbon in tree rings as the CO2 concentration increases. Since this change is not directly related to climate, it must be disregarded when using tree-ring 13C to study past climate change [4].
We used the best-estimate value of δ13Ccorr in 1850 since the industrial revolution, which is based on ice core measurements and is about −6.7‰ [41]. We used the measured values of tree-ring stable carbon isotopes plus the difference in ice core δ13Ccorr relative to the standard value as the corrected stable carbon isotope value. The corrected value was then defined as the detrended chronology of the δ13Ccorr tree-ring [42] (Figure 2). Based on this chronology, we analyzed the responses to the climate of the stable carbon isotopes of L. sibirica and P. schrenkiana in the eastern Tianshan Mountains.

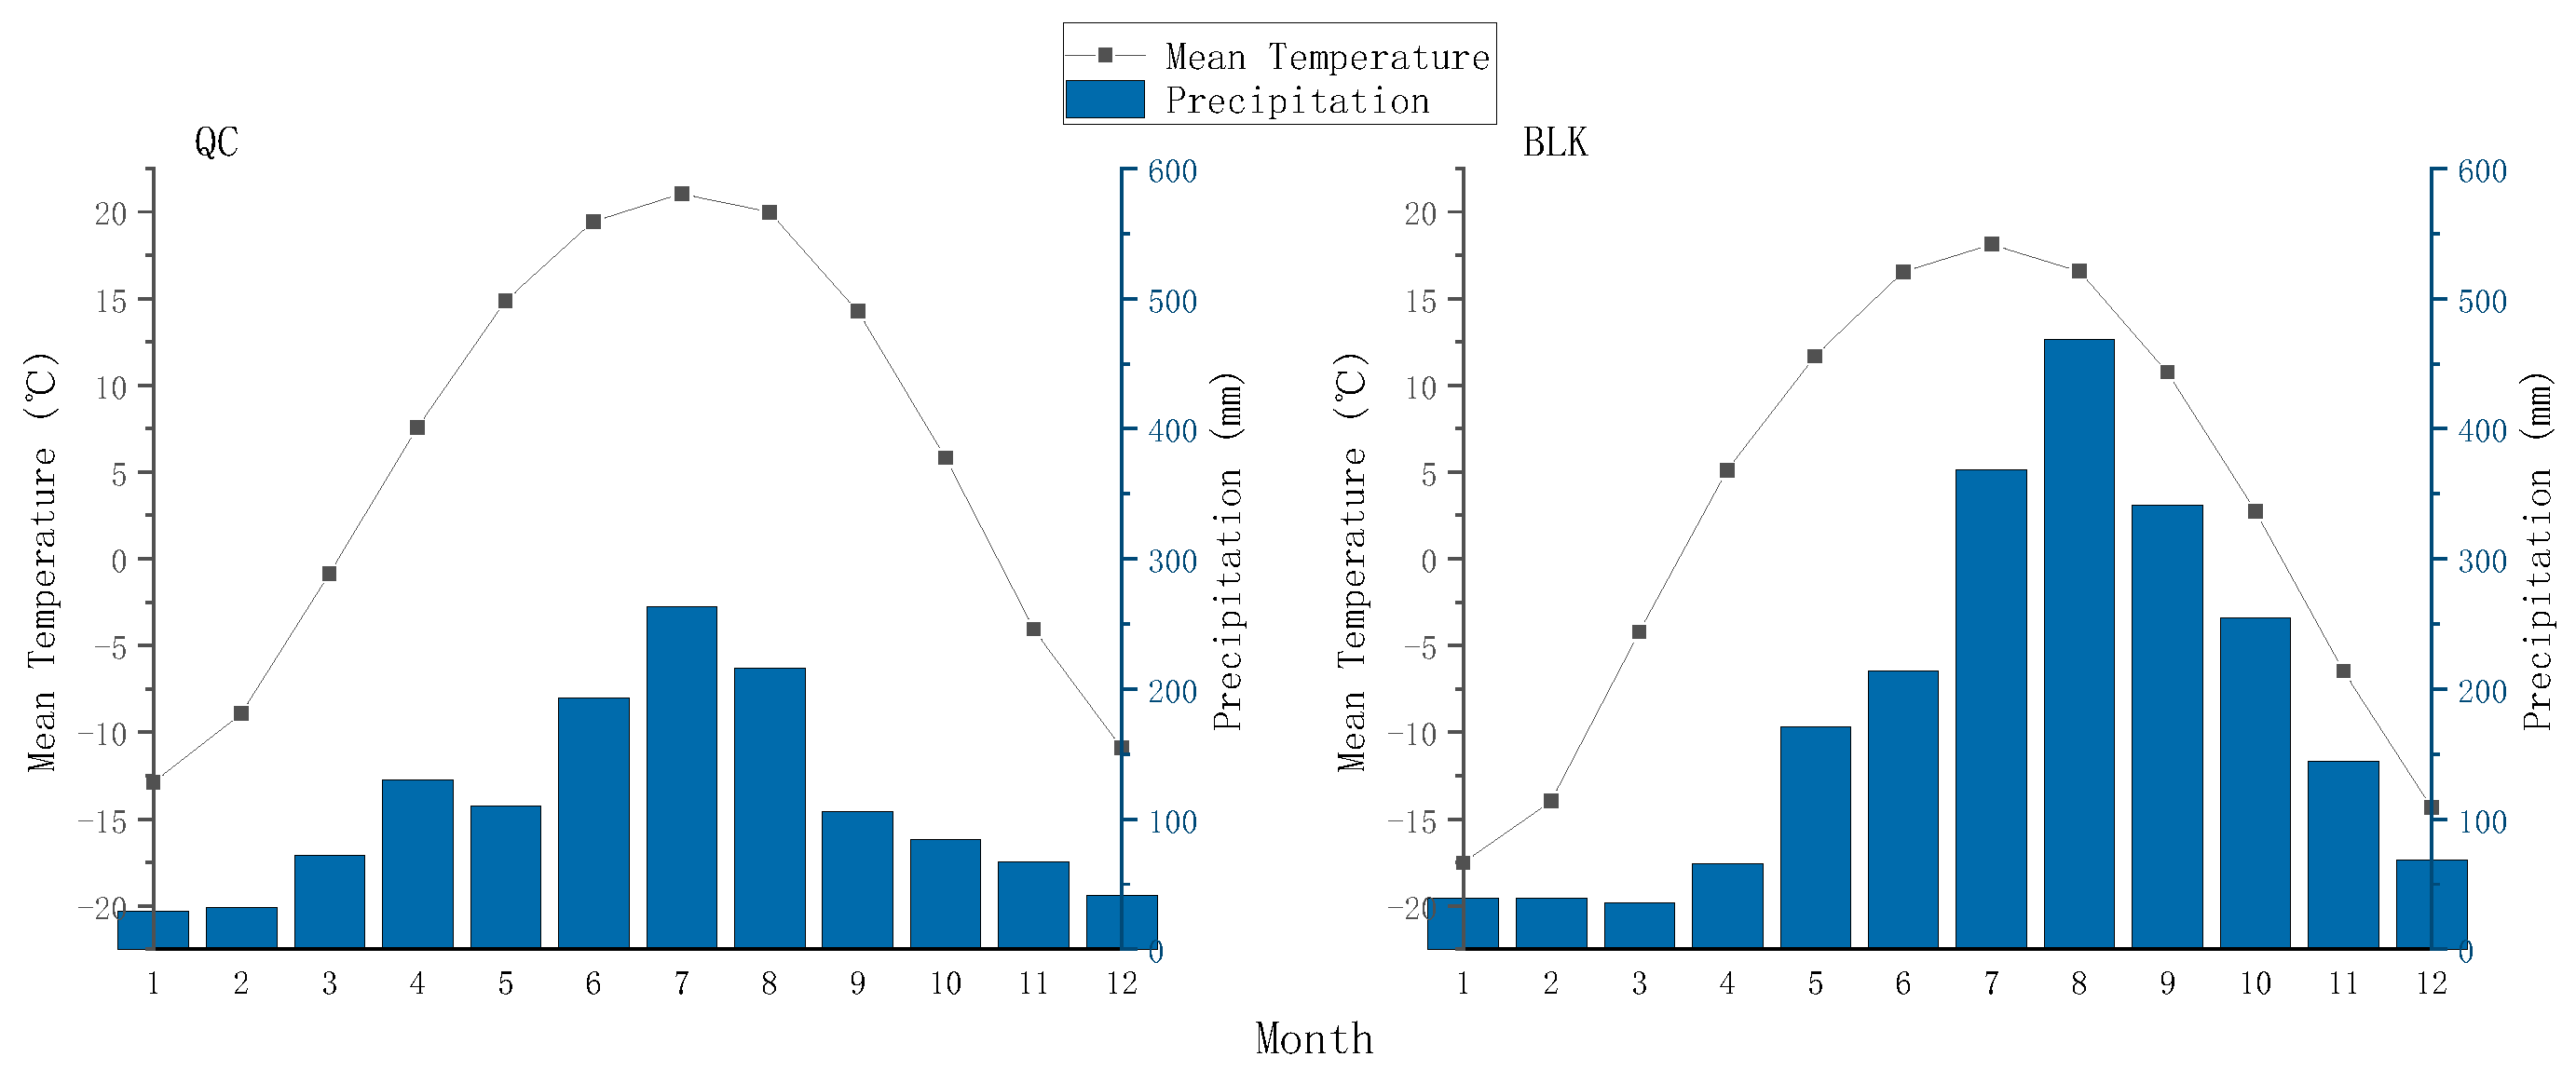
2.3. Meteorological Data

The meteorological data used in this study were obtained from the China Meteorological Data Network and the Xinjiang Uygur Autonomous Region Meteorological Information Center. Monthly meteorological data were obtained from the Balikun meteorological station (1957–2015; 43°36′ N, 93°00′ E) and from the Qincheng meteorological station (1959–1996; 42°46′ N, 94°32′ E). A total of six meteorological elements were obtained from each station: mean temperature, mean maximum temperature, mean minimum temperature, precipitation, relative humidity, and a saturated water vapor pressure deficit. The saturated water vapor pressure deficit was calculated using the following equation [43]:
VPD = (1 − RH) × 0.6108 × e(17.27T/(T+273.3))
where VPD is the month-by-month saturated water vapor pressure deficit, RH is the monthly mean relative humidity, and T is the monthly mean temperature.
This analysis showed that the annual mean temperature at the Qincheng meteorological station, which is located on the southern slope of the Tianshan Mountains, was 5.44 °C. Moreover, annual precipitation was 112 mm, and rain and heat occurred during the same period, with precipitation occurring primarily during the summer months (June to August). The annual mean temperature at the Balikun meteorological station, which is located on the northern slope of the Tianshan Mountains, was 2.08 °C, and the annual precipitation was 185.15 mm. Compared with Qincheng, Balikun had a lower mean temperature and more precipitation, mostly concentrated in the middle and end of the growing season from July to September. Precipitation at Balikun exhibited a significant increasing trend (Figure 3 and Figure 4).

2.4. Analysis Methods

Data were analyzed using mathematical and statistical methods that are common in traditional tree-ring climate studies [44]. Using the Pearson correlation, we conducted an analysis of the relationship between climate and tree-ring parameters. In order to extract seasonal-scale climate signals, we analyzed the correlation between the tree-ring carbon isotope chronology and monthly average climate variables from October of the previous year to September of the current year. To further investigate the relationship between stable carbon isotope chronologies and monthly climatological data, we performed a combined correlation analysis. We examined six meteorological variables from each of the two meteorological stations and then selected the meteorological data that best correlated with each of the chronologies. We then analyzed these correlations on a month-by-month basis. The combination of precipitation was calculated by summing the precipitation values across all months, and the other meteorological elements were calculated by averaging their values. In addition, we used collinearity analysis to examine the contribution of each climatic factor to the stable carbon isotope fractionation of the tree rings.

3. Results

3.1. Statistical Analysis of the Tree-Ring Stable Carbon Isotope Chronologies

The stable carbon isotope values of the two species were similar, though L. sibirica exhibited a slightly lower variance and a lower standard deviation than P. schrenkiana. L. sibirica tree rings, which varied from −20.287‰ to −23.619‰, with a mean value of −21.822‰ and a coefficient of variation of −0.0337. The stable carbon isotope values of P. schrenkiana varied from −20.581‰ to −24.603‰, with a mean value of −21.912‰ and a coefficient of variation of −0.0382. The interannual variation in stable carbon isotopes in L. sibirica tree rings was relatively more stable than that of P. schrenkiana tree rings (Table 2 and Figure 5).

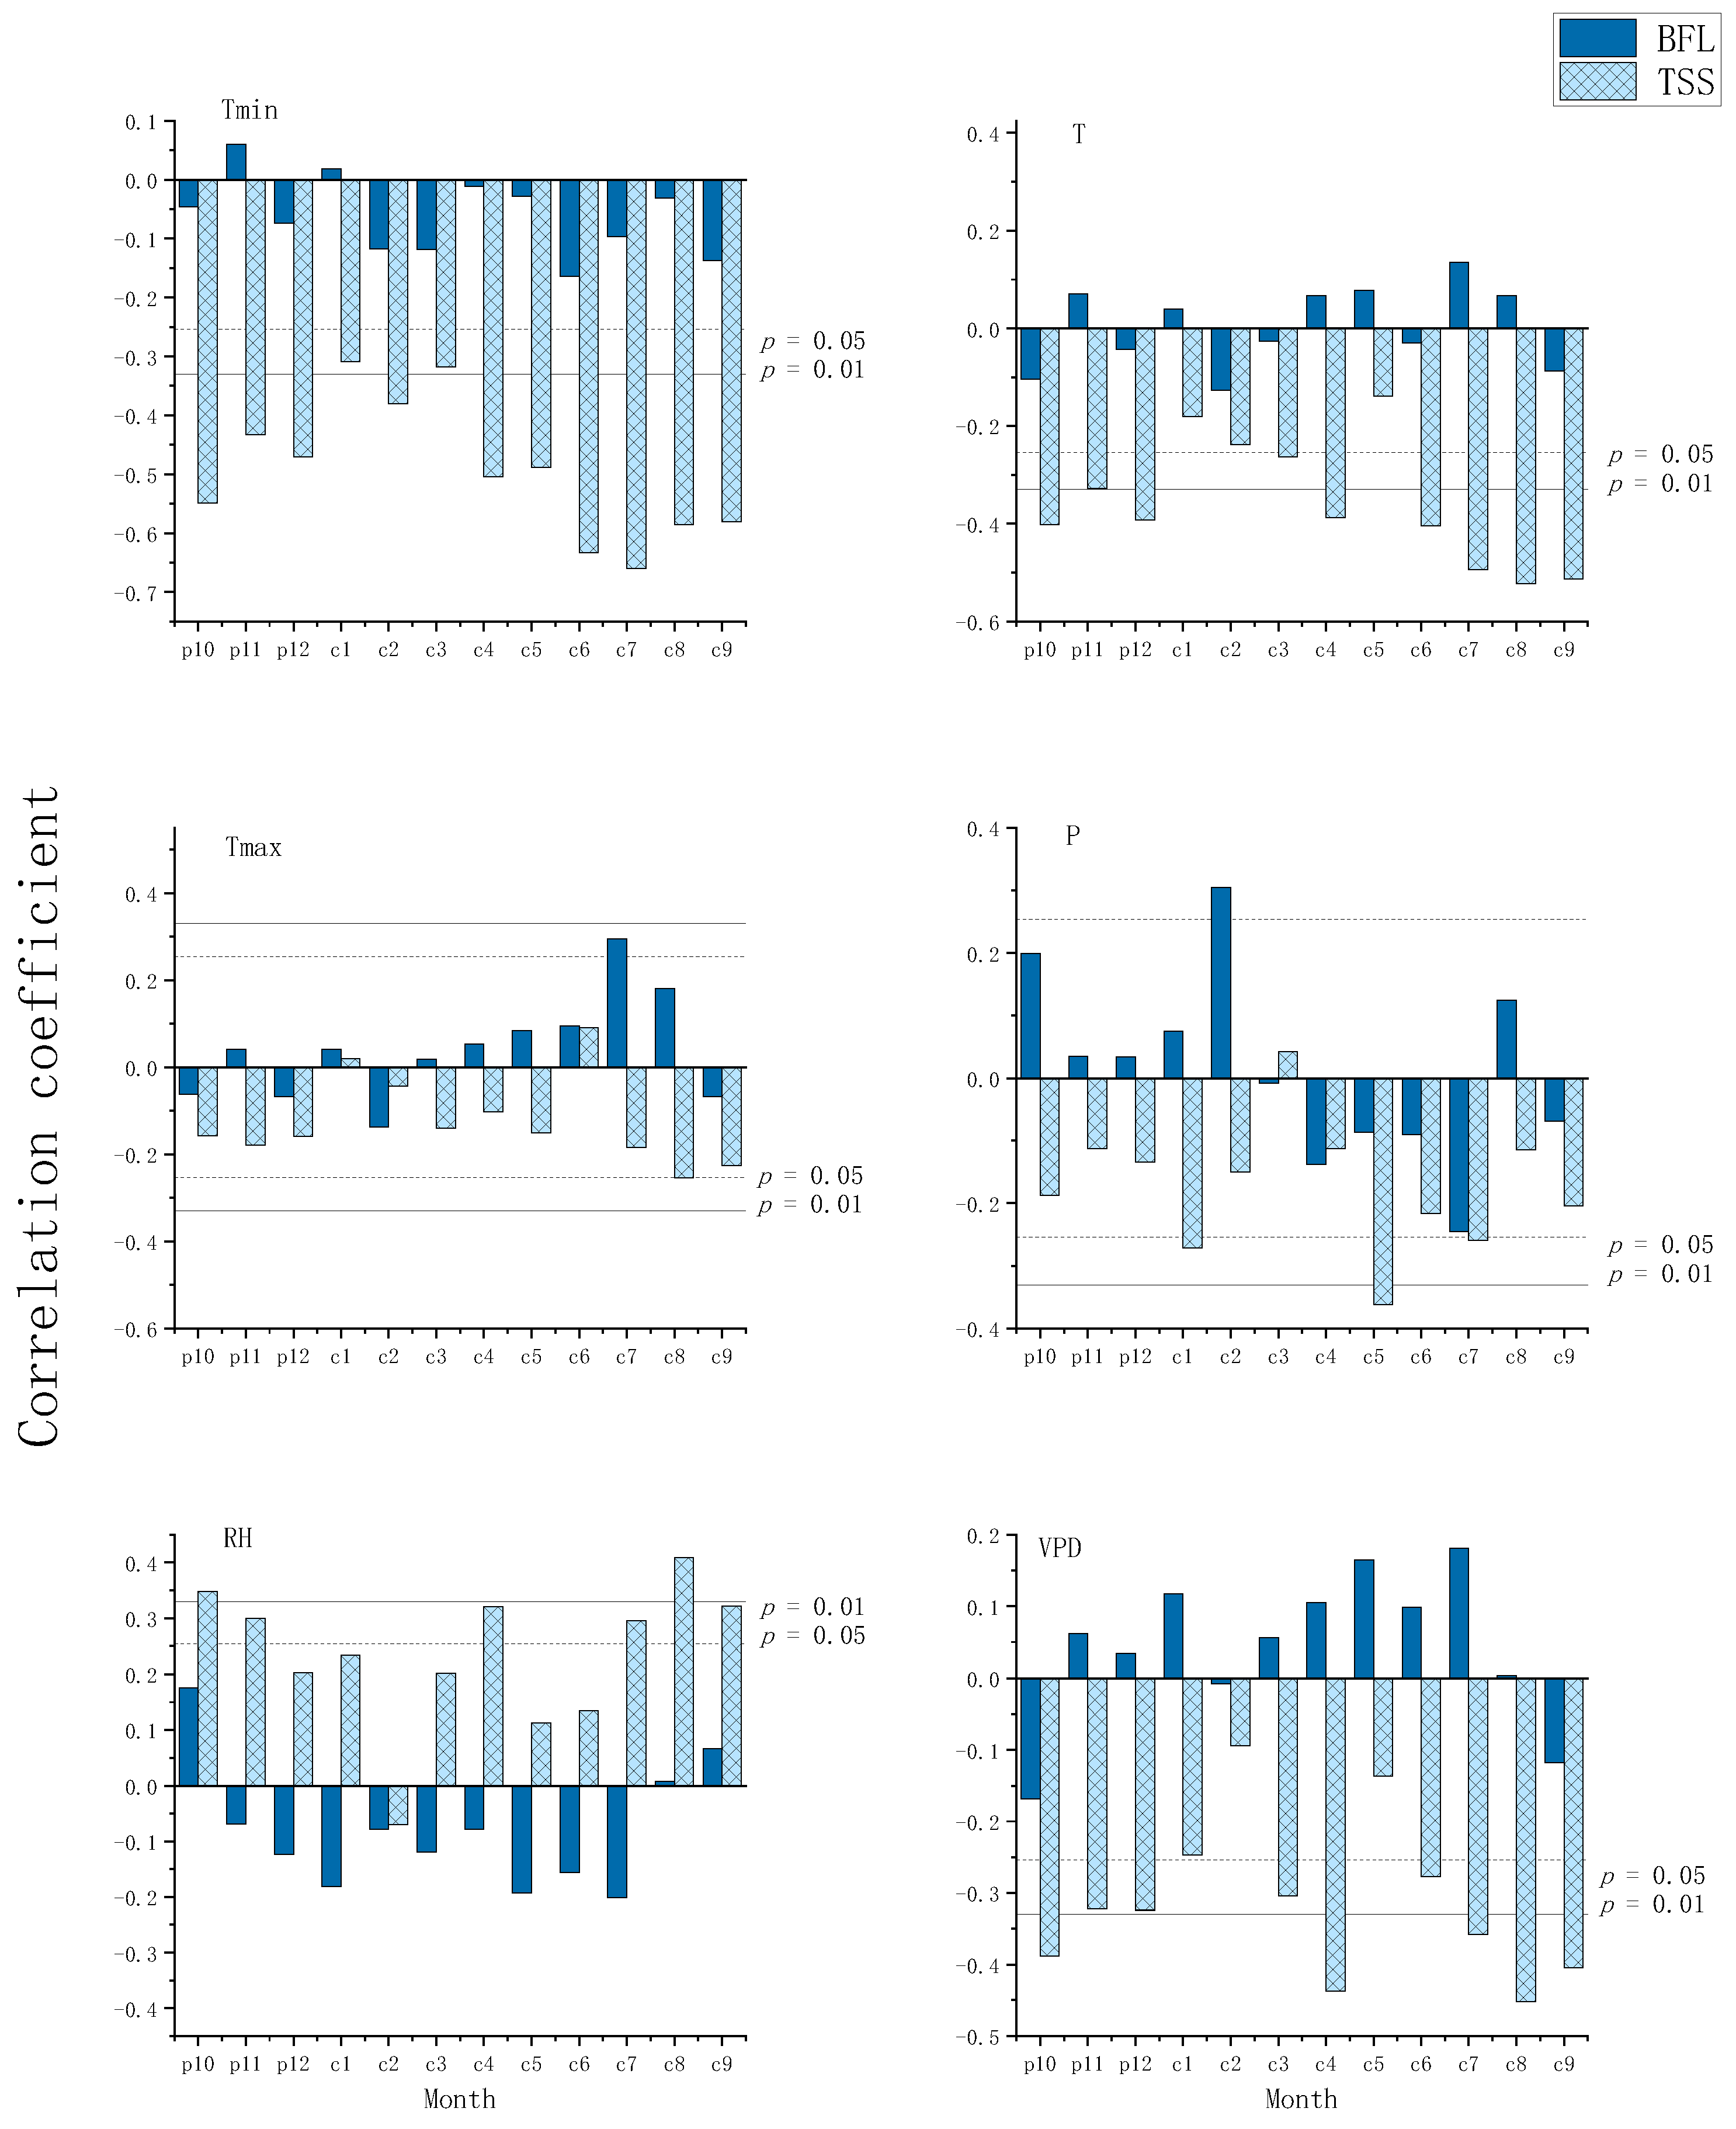
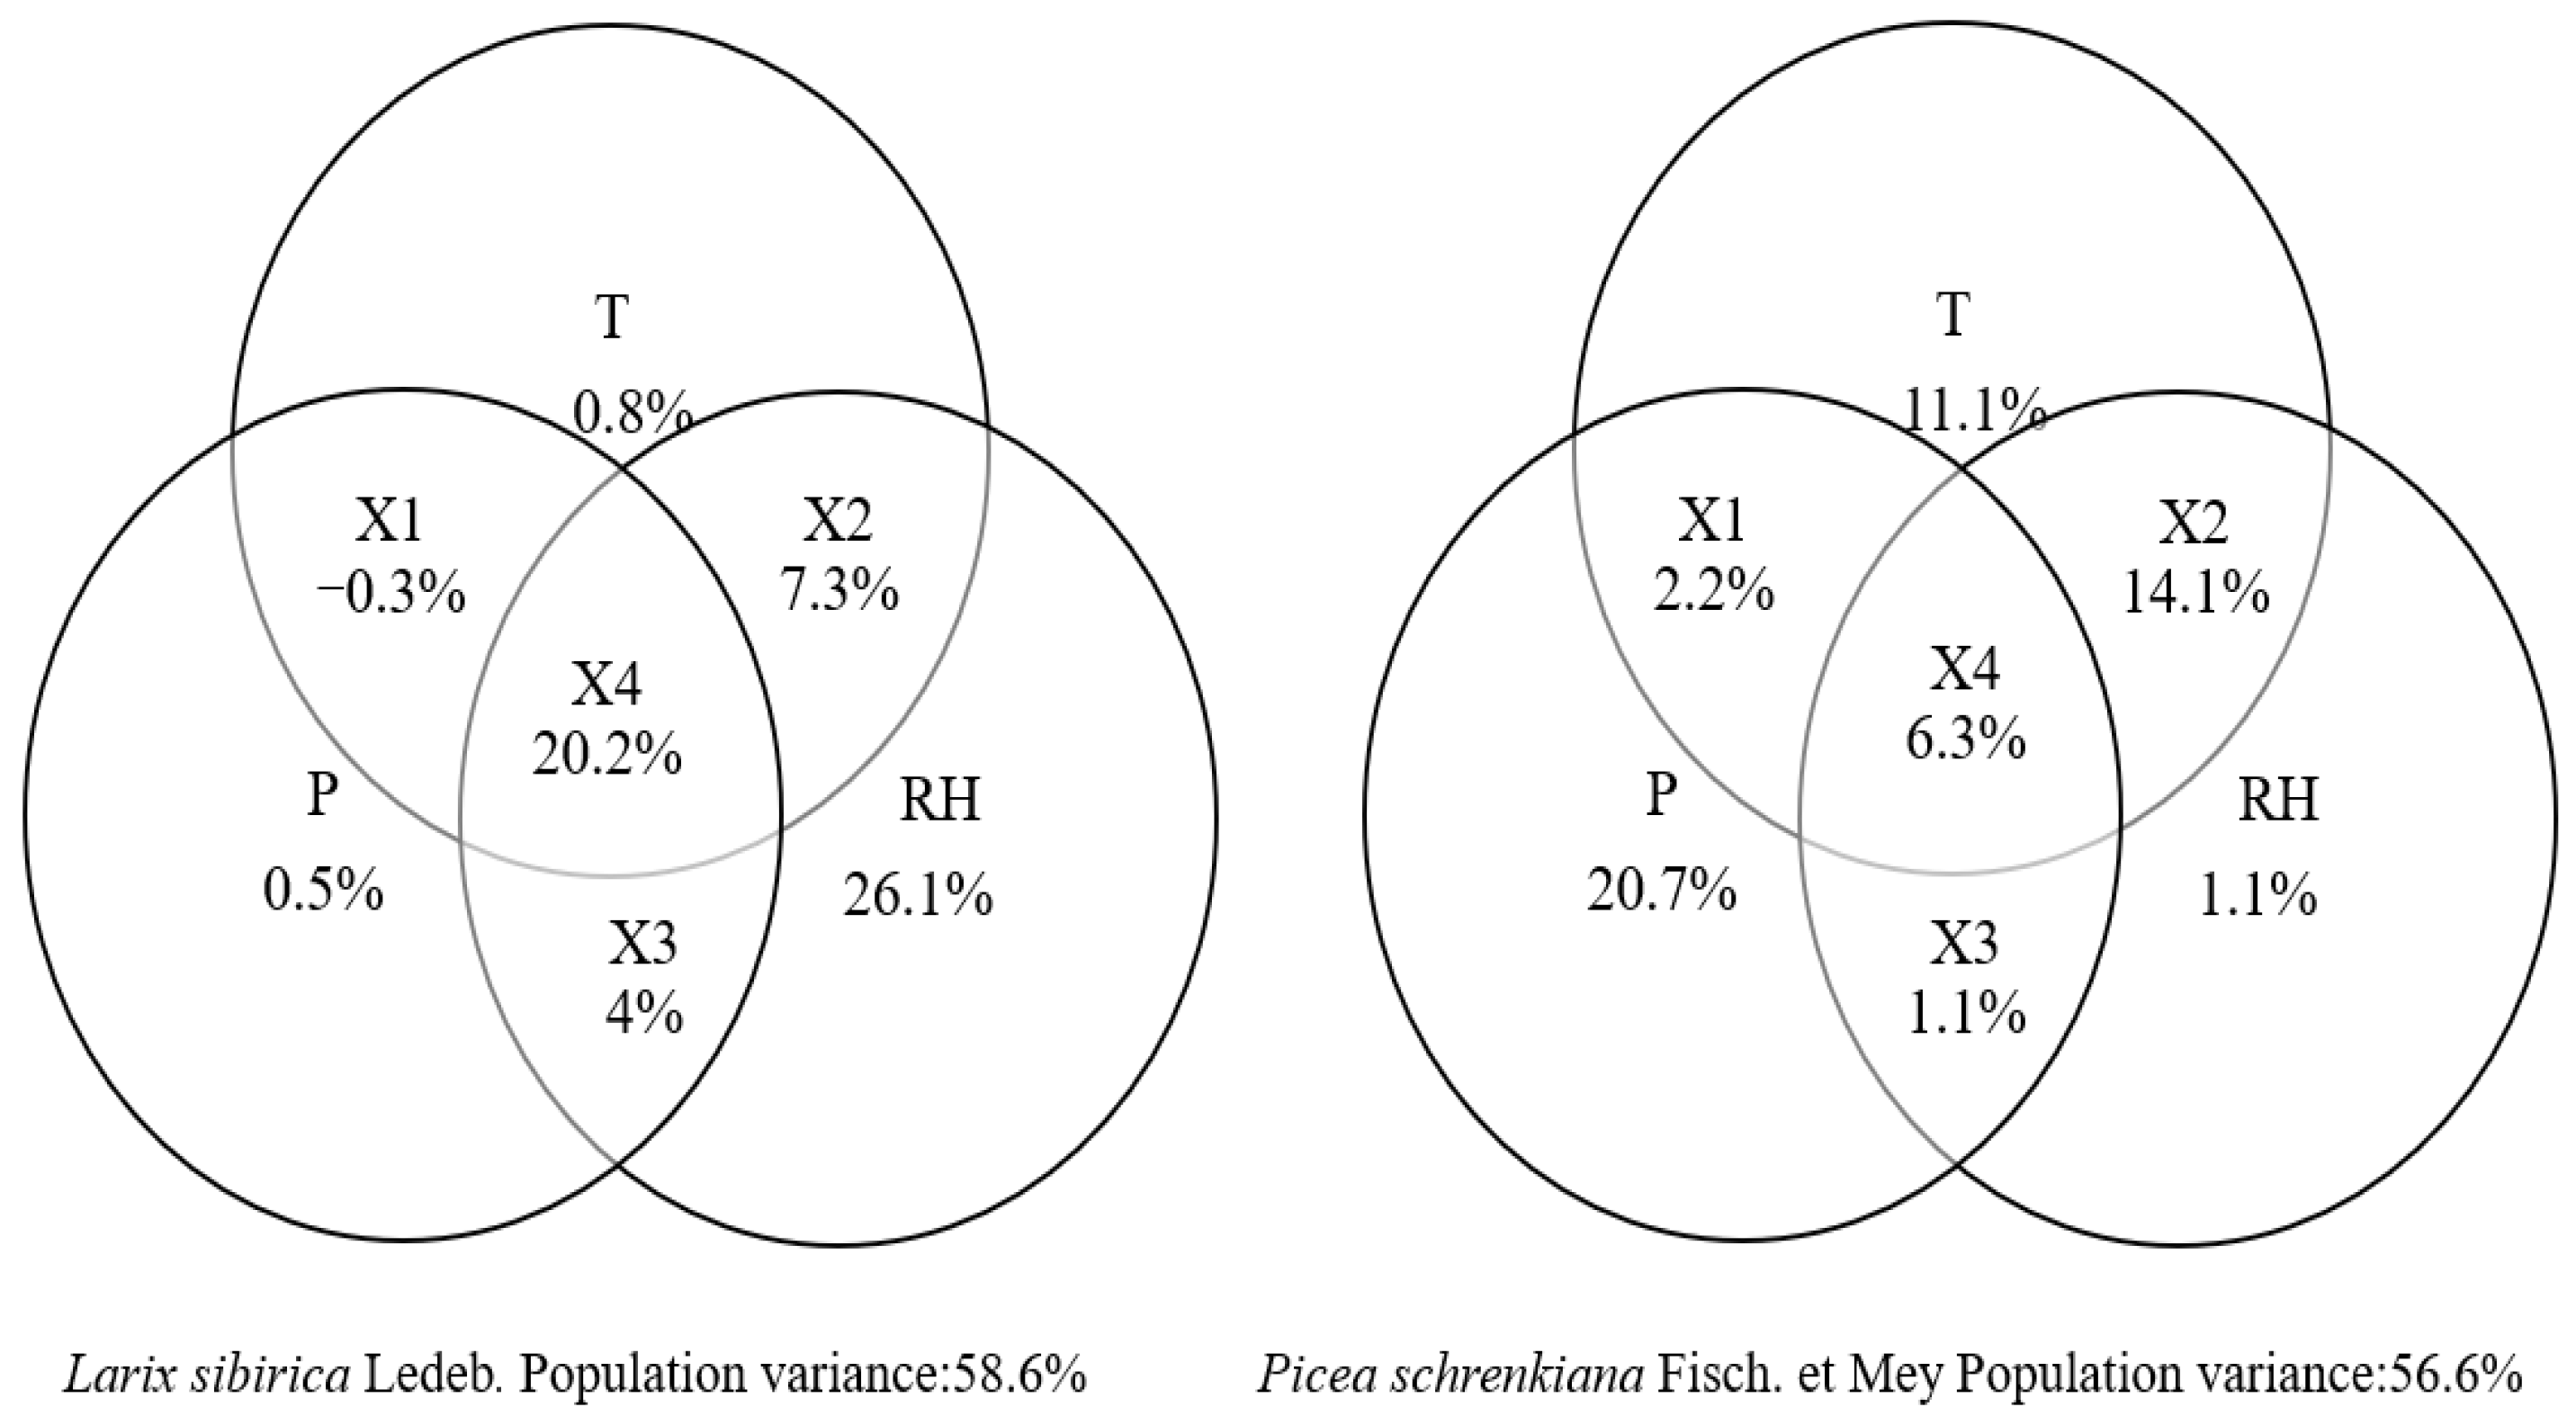
3.2. Response of Tree-Ring Stable Carbon Isotopes to Climate

We used correlation analysis to examine the relationships between the δ13Ccorr chronologies and the meteorological parameters from both the Balikun and the Qincheng meteorological stations. Specifically, we used monthly values from October of the previous year to September of the current year for the mean temperature, mean maximum temperature, mean minimum temperature, precipitation, relative humidity, and saturated saturation water vapor pressure deficit.
The δ13Ccorr chronology of P. schrenkiana showed a significantly negative correlation with the mean growing season temperature and passed the 99% significance test, but that of L. sibirica did not correlate well with the mean temperature. Neither chronology was significantly correlated with the mean maximum temperature except in July. However, the P. schrenkiana chronology correlated well with the mean minimum temperature. In all months other than January and March, the correlations between the P. schrenkiana δ13Ccorr chronology and mean minimum temperature passed the 99% significance test. In July, this correlation was as high as −0.66 (n = 59, p < 0.01). The P. schrenkiana δ13Ccorr chronology showed a significant negative correlation with growing season precipitation, as well as a significant positive correlation with relative humidity in both the previous year’s growing season and the current growing season. The highest correlation with relative humidity occurred in August, with a correlation coefficient of −0.409 (n = 59, p < 0.01). This chronology had a significantly negative correlation with the saturated water vapor pressure deficit (Figure 6).
The analysis of climatological variables observed at the Qincheng meteorological station showed that the mean and mean maximum growing season temperatures were significantly positively correlated with the tree-ring chronologies of both species. With a high correlation coefficient of −0.644 (n = 37, p < 0.01) in July of the current year, the δ13Ccorr chronology of L. sibirica expressed a significantly negative correlation with relative humidity in the current growing season and in October of the previous year, with both passing the 99% significance test. The P. schrenkiana δ13Ccorr chronology had a significant negative correlation with the relative humidity of the previous winter and from May to July of the current year. The maximum correlation coefficient was −0.683 in July of the current year (n = 37, p < 0.01). Compared to the δ13Ccorr chronology of L. sibirica, that of P. schrenkiana was more strongly correlated with climatic elements and was somewhat more influenced by precipitation during the previous winter and by current-year spring temperatures (Figure 7).
Figure 6 and Figure 7 show the correlations between δ13Ccorr chronologies of both the two tree species and the meteorological variables.
Further analysis revealed that the δ13Ccorr chronologies of L. sibirica showed significant positive correlations with monthly mean temperatures, monthly mean maximum temperatures, and various monthly combinations during the growing season of the current year. There were also significant negative correlations with relative humidity: the highest correlations between relative humidity and δ13Ccorr chronologies appeared during the growing season (Table 3) and were as high as −0.759.
The combined correlation results for P. schrenkiana were analyzed with the meteorological elements obtained from each meteorological station. This analysis shows that the tree-ring δ13Ccorr chronologies of P. schrenkiana correlated well with mean temperature and relative humidity from July of the previous year to June of the current year. They also correlated well with precipitation from September of the previous year to August of the current year. The analysis of meteorological data from the Balikun meteorological station revealed a poor correlation between P. schrenkiana and the mean maximum temperature.
As a result, further analysis with the mean minimum temperature was conducted to identify the climate variable with the greatest influence on stable carbon isotope fractionation. The results showed that the P. schrenkiana δ13Ccorr tree-ring chronologies were significantly correlated with the mean minimum temperature from June to October, with a correlation coefficient of −0.692 (n = 58, p < 0.01) (Table 4). Additionally, a first-order difference correlation analysis of the mean minimum temperature data for all months, combined with the δ13Ccorr chronologies, showed that all data failed the 99% significance test, except for those from July to August of the previous year. Therefore, the correlation between the δ13Ccorr chronologies of P. schrenkiana and the mean minimum temperature showed only a trend correlation.
The first-order difference analysis revealed that the combined correlation data passed the 99% significance test. This analysis pertained to the combined correlation data of other meteorological elements with the P. schrenkiana δ13Ccorr chronologies. Additionally, it showed a significantly positive correlation of these chronologies with the mean temperature and the mean maximum temperature from the end of the previous growing season to the current growing season. The first-order difference results showed that P. schrenkiana δ13Ccorr chronologies exhibited a significantly negative correlation with precipitation from September of the previous year to August of the current year, with a correlation coefficient of −0.502 (n = 57, p < 0.01). They also demonstrated a significant negative correlation with relative humidity from May to July of the current year, with a correlation coefficient of −0.549 (n = 57, p < 0.01).
After comparing the data from the meteorological stations in Qincheng and Balikun, we found that the P. schrenkiana tree-ring 13Ccorr chronologies were positively correlated with the mean temperature and mean minimum temperature of the meteorological station in Balikun and negatively correlated with the mean temperature and mean minimum temperature in Qincheng. The data for relative humidity also had opposite correlations. To study this difference, we determined the 21-year sliding correlation between the better-combined correlation data from the Balikun meteorological station and chronology; this could reflect the change in correlation between the two sets of data over time.
The sliding correlation analysis results showed that the combined correlation data from the Balikun meteorological station and the 21-year sliding correlation results of the TSS chronology underwent a significant change from negative to positive and positive to negative over time (Figure 8). In contrast, data from the Qincheng meteorological station were of a shorter age, which stopped in 1996. The time scale of these data and those of the Balikun meteorological station only overlapped for a short period of time, so the overall correlations were positive and negative in opposite directions. We then performed a correlation analysis of the first-order differences using the single-month meteorological data from the two stations and the first-order differences using the chronology data. We found that the two were consistent regarding their changes at high frequencies. The above correlations indicated that the main climatic factors affecting δ13C fractionation in P. schrenkiana were precipitation from the end of the previous growing season and throughout the current growing season and the mean growing season temperature.
The results of the single-factor correlation analysis indicated that the growing season precipitation and relative humidity were significantly negatively correlated with L. sibirica tree-ring δ13Ccorr chronologies. On the other hand, P. schrenkiana’s 13Ccorr chronologies were somewhat influenced by the growing season temperature, precipitation, and relative humidity. The stable carbon isotope fractionation in tree rings was probably influenced by a combination of climatic factors. To further investigate these relationships, we performed a collinearity analysis between the main climatic factors and the tree-ring δ13Ccorr chronologies. The results showed that the mean growing season temperature, precipitation, and relative humidity explained 58.6% of the variance in the BFL tree-ring stable carbon isotope chronologies. For TSS chronologies, the growing season mean temperature, precipitation from September of the previous year to August of the current year, and relative humidity from July of the previous year to June of the current year explained 56.6% of the variance. The climatic factors influencing the stable carbon isotope fractionation were higher in P. schrenkiana tree rings than those of L. sibirica.
The main factors limiting stable carbon isotope fractionation in L. sibirica included relative humidity during the growing season and the mean temperature. The P. schrenkiana tree-ring stable carbon isotope fractionation process was synergistically influenced by precipitation from the previous growing season to the current growing season and by the mean growing season temperature. These variables accounted for more than 30% of the variance (Figure 9).

4. Discussion

A series of enzymatic reactions took place during the CO2 assimilation process and during photosynthesis. Changes in the climate can impact both processes. The climatic factors that had a significant influence on organic matter synthesis could be divided into two categories: moisture and light [45]. Relative humidity and precipitation fell into the first category, whereas temperature and light intensity fell into the second. Changes in precipitation and relative humidity affected the humidity gradients and pressure, which altered the stomatal opening sizes and CO2 concentrations inside the cells. These, in turn, altered the isotopic composition of the synthesized organic matter. The production and activity of photosynthetic enzymes were primarily influenced by temperature and light intensity, which affected the speed and effectiveness of photosynthesis, and, thus, the isotopic composition of the synthesized organic matter. Additionally, changes in precipitation and relative humidity affected the saturated water vapor pressure, which drove stomatal conductance [46]. Both the rates of CO2 uptake by plants and changes in leaf stomatal conductance fluxes affected the intra-leaf intercellular CO2 concentration (Ci) or the ratio of intra-leaf intercellular CO2 concentration to the atmospheric CO2 concentration (Ci/Ca). Climatic factors such as temperature, humidity, and light all affected δ13C by influencing the distribution effects of the stomata and photosynthetic carboxylases on carbon isotopes and intercellular CO2 concentration [43].
Stable carbon isotopes record the balance between the photosynthetic rate and stomatal conductance. In arid regions, precipitation, relative humidity, and soil moisture status are the dominant factors that cause changes in stable carbon isotope signals. In humid regions, summer irradiance and temperature are the primary drivers of these changes [45]. L. sibirica is a deciduous species that grows on sunny slopes and has a deep root system. As a result, it is drought-tolerant and is less affected by precipitation compared to P. schrenkiana. L. sibirica tree-ring stable carbon isotope chronologies are significantly negatively correlated with precipitation and relative humidity, indicating how stomatal conductance has an important effect on the L. sibirica tree-ring stable carbon isotope fractionation [47]. Because the meteorological record at the Qincheng station, which was used for L. sibirica analysis, was shorter, the meteorological variables showed higher overall correlations with P. schrenkiana chronologies. L. sibirica’s stable carbon isotopes were most responsive to relative humidity during the growing season, and relative humidity was the main factor controlling the fractionation of stable carbon isotopes in L. sibirica. In the Tianshan Mountains, the growing season of L. sibirica is from May to September. Growth is fastest in June and July, which is when the δ13Ccorr chronology can be most significantly correlated with temperature and relative humidity. This is also the period during which plants are most affected by water stress (low relative humidity or low precipitation) and/or high temperature. Plant stomata may close to avoid excessive water loss, reducing the CO2 concentration in the plant [4]. The above analysis indicates that the main factor controlling δ13C fractionation in L. sibirica tree rings during the growing period is relative humidity which is influenced by both temperature and precipitation. This is especially true during the growing season when the gas exchange with the atmospheric environment occurs, and higher temperatures lead to enhanced transpiration, which indirectly affects photosynthesis. Drought stress is accompanied by more intense light, higher temperatures, and high evaporation from July to August. Together, these factors result in stomatal closure, reduced conductance, and an increase in photosynthetically fixed 13C. Given that isotope fractionation in L. sibirica is less influenced by precipitation, the temperature increase in summer decreases the relative humidity in L. sibirica’s growing environment. A lower relative humidity leads to an increase in diffusive evaporation, which trees regulate by decreasing their stomatal conductance in order to reduce water loss, thus affecting the stable carbon isotope fractionation of L. sibirica.
Saurer et al. [7] studied the relationship between δ13C in the tree rings of French beech trees, as well as climatic variables, at sites with different moisture conditions. They found that the δ13C values of beech tree rings were significantly correlated with relative air humidity from April to September. This finding is consistent with that of this study, i.e., relative humidity during the growing season had a significantly negative correlation with the L. sibirica tree-ring δ13C. Similarly, Alexander et al. [11] found that the stable carbon isotopes of L. sibirica tree rings in eastern Siberia were significantly and positively correlated with the mean maximum temperature from June to July (r = 0.46, p < 0.01) and were negatively correlated with precipitation in July (r = −0.44, p < 0.05). Jin Xiang et al. [48], in a study on Minjiang fir, found that the tree-ring δ13C chronologies from a high-elevation zone were significantly and negatively correlated with the monthly mean relative humidity in July and August of the previous year and April of the current year. This result is consistent with the results of the combined correlation analysis presented in this paper.
However, a study on Linzhi fir trees in Tibet by Liu et al. [19] showed the opposite results to those discussed above. In their study, Linzhi fir tree-ring δ13C values were affected by a strong lag effect and showed a significantly positive correlation with relative humidity from the previous September to November. This is due to the fact that Linzhi fir occurs in the humid zone along the middle reaches of the Yarlung Tsangpo River, where the relative humidity is not a growth-limiting factor. After September, with air humidity significantly decreased, relative humidity becomes the growth-limiting factor. This is also related to the influence of unique climatic conditions on the physiological and metabolic activities of trees at high altitudes on the Tibetan Plateau.
P. schrenkiana is an evergreen conifer species that grows on shady slopes and has a shallow root system. As a result, it has limited access to deep soil water resources and is more susceptible to drought stress during the growing season. The data and charts above show that P. schrenkiana δ13Ccorr chronologies are strongly correlated with precipitation at high and low frequencies, indicating that precipitation plays a key role in the stable carbon isotope fractionation of tree rings. In general, the optimum temperature for net photosynthesis in evergreen conifers is 10–25 °C [49]. At the sampling site, the mean monthly temperature in summer (June to August) was 17 °C; the summer season was when P. schrenkiana growth was at its peak [50]. Because evergreen trees continue to photosynthesize at the end of the growing season to maintain their above-ground biomass, they are also affected by climatic factors at the end of the previous year’s growing season.
It is, therefore, unsurprising that the combined meteorological data (Balikun station) from the previous year’s growing season to the current year’s growing season correlated well with P. schrenkiana tree-ring stable carbon isotopes. Following the first-order difference analysis, we found that the first-order difference between the δ13C values and the combined mean maximum temperature was significantly and positively correlated from the end of the previous growing season to the current growing season. P. schrenkiana grows on shady slopes with limited sunlight. As temperatures decrease at the end of the growing season, photosynthetic enzyme activity decreases, inhibiting photosynthesis. Thus, the mean maximum temperature affects high-frequency changes in tree-ring stable carbon isotope fractionation. Upon looking at the single-month correlation data, we found that the δ13C values of P. schrenkiana were significantly and negatively correlated with the mean minimum temperature from June to July. From the combined correlation data, we found that the P. schrenkiana δ13C values were most strongly correlated with the mean minimum temperature from June to October. Our plant physiology analysis indicated that June and July represented a period of rapid growth, but higher mean minimum temperatures outside these months could prolong the growing season and enhance photosynthetic efficiency.
Schleser et al. [51] suggested that the relationship between tree-ring δ13C values and temperature is not simply linear but rather “bell-shaped”. That is, the carbon isotope fractionation of plants is greatest when temperatures are optimal, which means that δ13C values are at their lowest rate. If temperatures are lower than is optimal for plant growth, then tree-ring δ13C values can be negatively correlated with temperature. If temperatures are higher than is optimal, then tree-ring δ13C values can be positively correlated with temperature. However, if temperatures oscillate near the optimal temperature point, their response relationship is more complicated. The mean minimum temperature occurs at night and is lower than the optimal temperature for plant growth. As a result, tree-ring δ13C values can be negatively correlated with temperature. Photosynthesis is extremely weak at night when there is little atmospheric turbulence and a significant accumulation of CO2 under the canopy. At the beginning of the night, stomatal conductance is greater than photosynthesis, and the δ13C fractionation of the carboxylation process is stronger. As the fractionation process is weakened due to the depletion of chemical energy accumulated during the daytime and respiration continues, the external CO2 concentration increases.
The results of our collinearity analysis indicate that the tree-ring stable carbon isotopes of P. schrenkiana are synergistically influenced by the mean summer temperature, precipitation, and relative humidity. During the growing season (especially in summer), carbon isotope fractionation is jointly regulated by the photosynthetic rate (temperature) and stomatal conductance (precipitation and relative humidity). Previous studies on the responses of tree-ring stable carbon isotopes to the climate in Xinjiang suggest that tree-ring stable carbon isotope fractionation in the Altai Mountains may be controlled by a combination of temperature and moisture [30]. In the central Tianshan Mountains, fractionation may be primarily moisture-driven [52]. The findings for both regions are consistent with those of the present study. Hemming et al. [6] found that high-frequency changes in the tree-ring δ13C values of beech, oak, and pine trees were negatively correlated with relative humidity from June to September. These findings are consistent with those of this study, which indicate a negative correlation between relative humidity and P. schrenkiana tree-ring δ13C during the growing season.

5. Conclusions

The stable carbon isotope values, coefficients of variation, variance, and standard deviation of P. schrenkiana tree rings were marginally higher than those of L.sibirica, suggesting that interannual variation in the tree-ring stable carbon isotopes of L. sibirica were relatively more stable. L. sibirica tree-ring δ13Ccorr chronologies showed a significantly negative correlation with precipitation and relative humidity during the growing season and a significantly positive correlation with mean temperature, mean maximum temperature, and saturated water vapor pressure deficit during the growing season. The P. schrenkiana tree-ring δ13Ccorr was negatively correlated with mean temperature, mean minimum temperature, precipitation, and saturated water vapor pressure deficit from the previous growing season to the current year and positively correlated with relative humidity. The main climatic factor controlling stable carbon isotope fractionation in L. sibirica tree rings during the growing season was relative humidity. In contrast, stable carbon isotope fractionation in P. schrenkiana tree rings appeared to be jointly controlled by hydrothermal conditions.
Overall, climatic factors had a greater impact on the stable carbon isotope fractionation in P. schrenkiana compared to L.sibirica. Relative humidity during the growing season and the synergistic effect of the mean temperature and relative humidity were the main factors limiting stable carbon isotope fractionation in L. sibirica tree rings. In P. schrenkiana tree rings, the mean temperature and precipitation during the growing season had the strongest influence on the fractionation process.
This research improved our understanding of how stable carbon isotope fractionation in tree rings varies between species and geographical regions. It can also be used as a reference to forecast how L. sibirica and P. schrenkiana change as the climate changes. Finally, it provides evidence to support more intelligent forest management in arid lands and advances our understanding of how climate change impacts tree growth in extremely dry environments.

Author Contributions

Conceptualization, R.Z.; Data curation, R.Z., L.Q. and H.G.; Formal analysis, Y.J.; Funding acquisition, R.Z. and L.Q.; Investigation, R.Z., L.Q. and Z.P.; Methodology, R.Z., L.Q., Z.P. and R.A.; Resources, R.Z. and G.L.; Validation, Y.J.; Writing—original draft, Y.J. and R.Z.; Writing—review and editing, Y.J., L.Q. and R.Z. All authors have read and agreed to the published version of the manuscript.

Funding

This work was supported by the Natural Science Foundation of Xinjiang (2022D01A160), the regional collaborative innovation project of Xinjiang (2021E01022, 2022E01045), the National Natural Science Foundation of China (41975110), the Tianshan Talent Project of Xinjiang (2022TSYCCX0003), and the Tianshan Youth Project of Xinjiang (2020Q026).

Institutional Review Board Statement

Not applicable.

Informed Consent Statement

Not applicable.

Data Availability Statement

The data presented in this study are available on request from the corresponding author.

Acknowledgments

We thank Tongwen Zhang, Huaming Shang, Yuting Fan, Heli Zhang, Youping Chen and Bin Liu for their help and support during the sample collection and experimental analysis process.

Conflicts of Interest

The authors declare no conflict of interest.

References

  1. Robertson, I.; Switsur, V.R.; Carter, A.H.C.; Barker, A.C.; Waterhouse, J.S.; Briffa, K.R.; Jones, P.D. Signal strength and climate relationships in 13C/12C ratios of tree ring cellulose from oak in east England. J. Geophys. Res. Atmos. 1997, 102, 19507–19516. [Google Scholar] [CrossRef]
  2. Leavitt, S.W.; Lone, A. Seasonal stable-carbon isotope variability in tree-ring: Possible paleoenvironmental signals. Chem. Geol. Isot. Geosci. Sect. 1991, 87, 59–70. [Google Scholar] [CrossRef]
  3. Wilson, A.T.; Grinsted, M.J. 13C/12C in cellulose and lignin as palaeothermometers. Nature 1977, 265, 133–135. [Google Scholar] [CrossRef]
  4. Francey, R.J.; Farquhar, G.D. An explanation of 13C/12C variations in tree-rings. Nature 1982, 297, 28–31. [Google Scholar] [CrossRef]
  5. Saurer, M.; Siegenthaler, U.; Schweingruber, F. The climate-carbon isotope relationship in tree-ring and the significance of site conditions. Tellus B 1995, 47, 320–330. [Google Scholar] [CrossRef]
  6. Hemming, D.I.; Switsur, V.R.; Waterhouse, J.S.; Heaton, T.H.E.; Carter, A.H.C. Climate variation and the stable carbon isotope composition of tree ring Cellulose: An intercomparison of Quercus robur, Fagus sylvatica and Pinus silvestris. Tellus B Chem. Phys. Meteorol. 1998, 50, 25–33. [Google Scholar] [CrossRef]
  7. Saurer, M.; Siegenthaler, U. 13C/12C isotope ratios in trees are sensitive to relative humidity. Dendrochronologia 1989, 7, 9–13. [Google Scholar]
  8. Barber, V.A.; Juday, G.P.; Finney, B.P.; Wilmking, M. Reconstruction of Summer Temperatures in Interior Alaska from Tree-Ring Proxies: Evidence for Changing Synoptic Climate Regimes. Clim. Chang. 2004, 63, 91–120. [Google Scholar] [CrossRef]
  9. Hafner, P.; Levanič, T. Stable carbon isotopes in Norway Spruce (Picea abies (L.) Karst.) tree-ring at two sites in Slovenia. Zb. Gozdarstva Lesar. 2009, 88, 43–52. [Google Scholar]
  10. Pawelczyk, S.; Pazdur, A.; Halas, S. Stable carbon isotopic composition of tree-ring from a Pine tree from Augustów Wilderness, Poland, as a temperature and local environment conditions indicator. Isot. Environ. Health Stud. 2004, 40, 145–154. [Google Scholar] [CrossRef]
  11. Kirdyanov, A.V.; Treydte, K.S.; Nikolaev, A.; Helle, G.; Schleser, G.H. Climate signals in tree-ring width, density and δ13C from larches in eastern Siberia (Russia). Chem. Geol. 2008, 252, 31–41. [Google Scholar] [CrossRef]
  12. Sonninen, E.; Jungner, H. Stable carbon isotope in tree-rings of a Scots alpine pine (Pinus sylvestris L.) from northern Finland. Paläoklimaforschung 1995, 15, 121–128. [Google Scholar]
  13. Sheu, D.D.; Kou, P.; Chiu, C.H.; Chen, M.J. Variability of tree-ring δ13C in Taiwan fir: Growth effect and response to May–October temperatures. Geochim. Cosmochim. Acta 1996, 60, 171–177. [Google Scholar] [CrossRef]
  14. Saurer, M.; Borella, S.; Schweingruber, F.; Siegwolf, R. Stable carbon isotopes in tree-ring of beech: Climatic versus site-related influences. Trees 1997, 11, 291–297. [Google Scholar] [CrossRef]
  15. Liu, Y.; Wu, X.D.; Leavitt, S.W.; Hughes, M.K. Stable carbon isotope in tree-ring from Huangling, China and climatic Variation. Sci. China Ser. D Earth Sci. 1996, 39, 152–160. [Google Scholar]
  16. Liu, X.H.; Shao, X.M.; Wang, L.L.; Zhao, L.J.; Wu, P.; Chen, T.; Qin, D.H.; Ren, J.W. Climatic significance of the stable carbon isotope composition of tree-ring cellulose: Comparison of Chinese hemlock (Tsuga chinensis Pritz) and alpine pine (Pinus densata Mast) in a temperate-moist region of China. Sci. China Ser. D Earth Sci. 2007, 50, 1076–1085. [Google Scholar] [CrossRef]
  17. Wang, W.Z.; Liu, X.H.; Shao, X.M.; Leavitt, S.; Xu, G.B.; An, W.L.; Qin, D.H. A 200 years temperature record from tree ring δ13C at the Qaidam Basin of the Tibetan Plateau after identifying the optimum method to correct for changing atmospheric CO2 and δ13C. J. Geophys. Res. 2011, 116, G04022. [Google Scholar] [CrossRef]
  18. Liu, X.H.; Qin, D.H.; Shao, X.M.; Chen, T.; Ren, J.W. Tibetan Himalayan fir annual rings δ13C and climatic significance. Sci. Bull. 2003, 48, 1209–1213, (In Chinese, with English Abstract). [Google Scholar]
  19. Liu, X.H.; Qin, D.H.; Shao, X.M.; Ren, J.W.; Wang, Y. Stable Carbon Isotope of Abies spectabibis from Nyingchi County of Tibet Autonomous Region and Its Response to Climate Change. J. Glaciol. Geocryol. 2002, 24, 574–578, (In Chinese, with English Abstract). [Google Scholar]
  20. Liu, Y.; Wu, X.D.; Leavitt, S.W.; Hughes, M.K. Huangling tree rings stable C isotope and climate change. Chin. Sci. 1996, 26, 125–130, (In Chinese, with English Abstract). [Google Scholar]
  21. Zhang, R.; Ermenbaev, B.; Zhang, H.; Shang, H.; Zhang, T.; Yu, S.; Chontoev, D.T.; Satylkanov, R.; Qin, L. Natural discharge changes of the Naryn River over the past 265 years and their climatic drivers. Clim. Dyn. 2020, 55, 1269–1281. [Google Scholar] [CrossRef]
  22. Zhang, R.; Ermenbaev, B.; Zhang, T.; Ali, M.; Qin, L.; Satylkanov, R. The Radial Growth of Schrenk Spruce (Picea schrenkiana Fisch. et Mey.) Records the Hydroclimatic Changes in the Chu River Basin over the Past 175 Years. Forests 2019, 10, 223. [Google Scholar] [CrossRef]
  23. Zhang, R.; Shang, H.; Yu, S.; He, Q.; Yuan, Y.; Bolatov, K.; Mambetov, B.T. Tree-ring-based precipitation reconstruction in southern Kazakhstan, reveals drought variability since A.D. 1770. Int. J. Climatol. 2017, 37, 741–750. [Google Scholar] [CrossRef]
  24. Zhang, R.; Yuan, Y.; Gou, X.; He, Q.; Shang, H.; Zhang, T.; Chen, F.; Ermenbaev, B.; Yu, S.; Qin, L.; et al. Tree-ring-based moisture variability in western Tianshan Mountains since A.D. 1882 and its possible driving mechanism. Agric. For. Meteorol. 2016, 218–219, 267–276. [Google Scholar] [CrossRef]
  25. Zhang, R.; Qin, L.; Shang, H.; Yu, S.; Gou, X.; Mambetov, B.T.; Bolatov, K.; Zheng, W.; Ainur, U.; Bolatova, A. Climatic change in southern Kazakhstan since 1850 C.E. inferred from tree rings. Int. J. Biometeorol. 2020, 64, 841–851. [Google Scholar] [CrossRef] [PubMed]
  26. Zhang, R.; Wei, W.; Shang, H.; Yu, S.; Gou, X.; Qin, L.; Bolatov, K.; Mambetov, B.T. A tree ring-based record of annual mass balance changes for the TS.Tuyuksuyskiy Glacier and its linkages to climate change in the Tianshan Mountains. Quat. Sci. Rev. 2019, 205, 10–21. [Google Scholar] [CrossRef]
  27. Qin, L.; Shang, H.M.; Zhang, T.W.; Liu, W.P.; Zhang, R.B. Response comparison of the tree-ring δ13C to climate on the southern and northern slopes of Tianshan Mountains. Acta Ecol. Sin. 2021, 41, 5713–5724, (In Chinese, with English Abstract). [Google Scholar]
  28. Qin, L.; Yuan, Y.J.; Yu, S.L.; Shang, H.M.; Chen, F.; Fan, Z.A.; Zhang, T.W.; Tong, Z. Tree-ring based monthly mean relative humidity reconstruction for the Eastern Tianshan Mountains during the last 443 years. J. Earth Environ. 2012, 3, 908–914, (In Chinese, with English Abstract). [Google Scholar]
  29. Shang, H.M.; Wei, W.S.; Yuan, Y.J.; Yu, S.L.; Zhang, R.B.; Chen, X.J. Environmental Response of Tree-ring Width and Stable Carbon Isotope at North Slope of Eastern Tianshan Mountains. Desert Oasis Meteorol. 2010, 4, 6–10, (In Chinese, with English Abstract). [Google Scholar]
  30. Zhang, R.B.; Yuan, Y.J.; Wei, W.S.; Shang, H.M.; Yu, S.L.; Zhang, T.W.; Chen, F.; Fan, Z.A.; Qin, L. Response of Stable Carbon Isotope of Larix sibirica Ledeb. Tree-rings to Climate Change. Arid Zone Res. 2012, 29, 328–334, (In Chinese, with English Abstract). [Google Scholar]
  31. Peng, Z.B.; Li, X.J.; Zhang, R.B.; Qin, L.; Zhang, H.L.; Chen, Y.P.; Liu, R. The response of tree-ring chronologies of Schrenk spruce (Picea schrenkiana Fisch. et Mey.) to climate change at high- and low- elevations of the Eastern Tianshan Mountains, Xinjiang, using different detrending methods. Acta Ecol. Sin. 2019, 39, 1595–1604, (In Chinese, with English Abstract). [Google Scholar]
  32. Holmes, R.L. Computer-assisted quality control in tree-ring dating and measurement. Tree-Ring Bull. 1983, 43, 69–78. [Google Scholar]
  33. Cook, E.R. A Time Series Analysis Approach to Tree Ring Standardization; The University of Arizona: Tucson, AZ, USA, 1985. [Google Scholar]
  34. Porté, A.; Loustau, D. Seasonal and interannual variations in carbon isotope discrimination in a maritime pine (Pinus pinaster) stand assessed from the isotopic composition of cellulose in annual rings. Tree Physiol. 2001, 21, 861–868. [Google Scholar] [CrossRef]
  35. Gagen, M.; McCarroll, D.; Loader, N.; Robertson, I.; Jalkanen, R.; Anchukaitis, K. Exorcising the ‘segment length curse’: Summer temperature reconstruction since AD 1640 using non-detrended stable carbon isotope ratios from pine trees in northern Finland. Holocene 2007, 17, 435–446. [Google Scholar] [CrossRef]
  36. Brendel, O.; Iannetta, P.; Stewart, D. A rapid and simple method to isolate pure alpha-cellulose. Phytochem. Anal. 2000, 11, 7–10. [Google Scholar] [CrossRef]
  37. Crampton, E.W.; Maynard, L.A. The Relation of Cellulose and Lignin Content to the Nutritive Value of Animal Feeds. J. Nutr. 1938, 15, 383–395. [Google Scholar] [CrossRef]
  38. Evans, M.N.; Reichert, B.K.; Kaplan, A.; Anchukaitis, K.J.; Vaganov, E.A.; Hughes, M.K.; Cane, M.A. A forward modeling approach to paleoclimatic interpretation of tree-ring data. J. Geophys. Res. 2006, 111, G03008. [Google Scholar] [CrossRef]
  39. Coplen, T.B. Discontinuance of SMOW and PDB. Nature 1995, 375, 285. [Google Scholar] [CrossRef]
  40. Leavitt, S.W.; Lara, A. South American tree-ring show declining μ13C trend. Tellus B Chem. Phys. Meteorol. 1994, 46, 152–157. [Google Scholar] [CrossRef]
  41. Rubino, M.; Etheridge, D.M.; Thornton, D.P.; Howden, R.; Allison, C.E.; Francey, R.J.; Langenfelds, R.L.; Steele, L.P.; Trudinger, C.M.; Spencer, D.A.; et al. Revised records of atmospheric trace gases CO2, CH4, N2O, and δ13C-CO2 over the last 2000 years from Law Dome, Antarctica. Earth Syst. Sci. Data 2019, 11, 473–492. [Google Scholar] [CrossRef]
  42. Cernusak, L.A.; Ubierna, N. Carbon Isotope Effects in Relation to CO2 Assimilation by Tree Canopies. In Stable Isotopes in Tree Rings; Springer International Publishing: Cham, Switzerland, 2022; pp. 291–310. [Google Scholar] [CrossRef]
  43. Campbell, G.S.; Norman, J.M. An Introduction to Environmental Biophysics, 2nd ed.; Springer: New York, NY, USA, 1998. [Google Scholar] [CrossRef]
  44. Speer, J.H. Fundamentals of Tree-Ring Research; The University of Arizona Press: Tucson, AZ, USA, 2010; p. 333. [Google Scholar]
  45. McCarroll, D.; Loader, N.J. Stable isotopes in tree rings. Quat. Sci. Rev. 2004, 23, 771–801. [Google Scholar] [CrossRef]
  46. McCarroll, D.; Pawellek, F. Stable carbon isotope ratios of Pinus sylvestris from northern Finland and the potential for extracting a climate signal from long Fennoscandian chronologies. Holocene 2001, 11, 517–526. [Google Scholar] [CrossRef]
  47. Treydte, K.S.; Frank, D.C.; Saurer, M.; Helle, G.; Schleser, G.H.; Esper, J. Impact of climate and CO2 on a millennium-long tree-ring carbon isotope record. Geochim. Cosmochim. Acta 2009, 73, 4635–4647. [Google Scholar] [CrossRef]
  48. Jin, X.; Xu, Q.; Liu, S.; Jiang, C.Q. Relationships of stable carbon isotope of Abies faxoniana tree-rings to climate in sub-alpine forest in Western Sichuan. Acta Ecol. Sin. 2014, 34, 1831–1840, (In Chinese, with English Abstract). [Google Scholar]
  49. Yu, G.R.; Wang, Q.F. Physiological ecology of photosynthesis, transpiration, and water use in plants. J. Nucl. Agric. 2010, 24, 579, (In Chinese, with English Abstract). [Google Scholar]
  50. Zhang, R.B.; Yuan, Y.J.; Gou, X.H.; Zhang, T.W.; Zou, C.; Ji, C.R.; Fan, Z.A.; Qin, L.; Shang, H.M.; Li, X.J. Intra-annual radial growth of Schrenk spruce (Picea schrenkiana Fisch. et Mey) and its response to climate on the northern slopes of the Tianshan Mountains. Dendrochronologia 2016, 40, 36–42. [Google Scholar] [CrossRef]
  51. Schleser, G.H.; Frielingsdorf, J.; Blair, A. Carbon isotope behaviour in wood and cellulose during artifcial aging. Chem. Geol. 1999, 158, 121–130. [Google Scholar] [CrossRef]
  52. Xu, G.B.; Liu, X.H.; Qin, D.H.; Chen, T.; Sun, W.Z.; An, W.L.; Wang, W.Z.; Wu, G.J.; Zeng, X.M.; Ren, J.W. Drought history inferred from tree ring δ13C and δ18O in the central Tianshan Mountains of China and linkage with the North Atlantic Oscillation. Theor. Appl. Climatol. 2014, 116, 385–401. [Google Scholar] [CrossRef]
Figure 1. Locations of sampling sites and meteorological stations.
Forests 14 01032 g001
Figure 2. Two tree-ring δ13Ccorr chronologies. BFL represents the L. sibirica chronology and TSS represents the P. schrenkiana chronology.
Forests 14 01032 g002
Figure 3. Variations in mean monthly temperature and precipitation at the Qincheng and Balikun meteorological stations.
Forests 14 01032 g003
Figure 4. Variations in mean annual temperature and precipitation variation at the Qincheng and Balikun meteorological stations.
Forests 14 01032 g004
Figure 5. Two tree-ring δ13Ccorr chronologies. BFL represents the L. sibirica chronology and TSS represents the P. schrenkiana chronology.
Forests 14 01032 g005
Figure 6. Relationships between the tree-ring stable carbon isotope chronologies and key climatic factors as observed at the Balikun meteorological station. T: mean temperature; Tmin: mean minimum temperature; Tmax: mean maximum temperature; P: precipitation; RH: relative humidity; VPD: saturated water vapor pressure. p10 represents October of the previous year; c9 represents January of the current year.
Forests 14 01032 g006
Figure 7. Relationships between the tree-ring stable carbon isotope chronologies and key climatic factors as observed at the Qincheng meteorological station. T: mean temperature; Tmin: mean minimum temperature; Tmax: mean maximum temperature; P: precipitation; RH: relative humidity; VPD: saturated water vapor pressure. p10 represents October of the previous year; c9 represents January of the current year.
Forests 14 01032 g007
Figure 8. Sliding correlation analysis between the P. schrenkiana δ13Ccorr chronology and meteorological variables. P7c6 represents the combination from July to June of the previous year;.c6c10 represents the combination from June to October of the current year.
Forests 14 01032 g008
Figure 9. Collinearity analysis between the δ13Ccorr and meteorological factors. T is the mean temperature combination from June to August at Qingcheng meteorological station; P is the precipitation–growing season combination; RH is the relative humidity growing season combination. Only the combinations with the best correlations with the δ13Ccorr of L. sibirica are shown. T is the mean temperature combination from June to October (c6c10) at Balikun meteorological station; P is the precipitation combination from September of the previous year to August of the current year(p9c8); RH is the relative humidity combination from July of the previous year to June of the current year(p7c6). Only the combinations with the best correlations with the δ13Ccorr of P. schrenkiana are shown. X1 is the combined effect of the mean temperature and precipitation. X2 is the combined effect of the mean temperature and relative humidity. X3 is the combined effect of precipitation and relative humidity. X4 is the combined effect of all three climate factors. The corresponding percentage values represent the explained variance of the parameters.
Forests 14 01032 g009
Table 1. Sampling site information.
Sampling SitesCode
Name
Latitude/NLongitude/EElevation/mAspectSlope (°)Canopy Closure
L. sibiricaBanfang GorgeBFL43°11′94°10′2900–2950N10–150.3
P. schrenkianaTianshan TempleTSS43°18′93°41′2620NE300.5
Table 2. Statistics of the tree-ring stable carbon isotope chronologies.
CodenameYearMaximumMinimumMeanVarianceStandard DeviationCoefficient of Variation
BFL1850–2017−20.287‰−23.619‰−21.822‰0.5410.735−0.0337
TSS1850–2017−20.581‰−24.603‰−21.912‰0.7010.837−0.0382
Table 3. Correlations between various meteorological variables observed at Qingcheng meteorological station and the stable carbon isotope chronology of BFL during the growing season. p7c6 represents the combination from July to June of the previous year; c6c10 represents the combination from June to October of the current year.
p7c6p8c7p9c8p10c9c5c8c5c9c6c7c6c8c6c9c6c10c7c8
T−0.0350.0210.0610.2500.521 **0.493 **0.411 *0.529 **0.418 *0.2980.497 **
Tmax0.1400.1980.2470.3020.49 **0.477 **0.383 *0.526 **0.439 **0.36 *0.495 **
P−0.435 **−0.581 **−0.589 **−0.406 *−0.483 **−0.494 **−0.375 *−0.442 **−0.462 **−0.483 **−0.445 **
RH−0.621 **−0.663 **−0.671 **−0.681 **−0.739 **−0.759 **−0.717 **−0.724 **−0.741 **−0.715 **−0.636 **
VPD0.562 **0.655 **0.711 **0.704 **0.699 **0.727 **0.664 **0.707 **0.717 **0.707 **0.623 **
* and ** represent the correlation coefficient exceeding 95% and 99% of the significance tests, respectively.
Table 4. Correlations between various meteorological variables observed at Balikun meteorological station and the stable carbon isotope chronology of TSS during the growth season. p7c6 represents the combination from July to June of the previous year; c6c10 represents the combination from June to October of the current year.
p7c6P8c7p9c8p10c9c5c8c5c9c6c7c6c8c6c9c6c10c7c8
T−0.544 **−0.526 **−0.514 **−0.491 **−0.436 **−0.474 **−0.477 **−0.492 **−0.513 **−0.52 **−0.459 **
Tmin−0.638 **−0.634 **−0.627 **−0.635 **−0.656 **−0.667 **−0.678 **−0.671 **−0.677 **−0.692 **−0.653 **
P−0.422 **−0.531 **−0.55 **−0.5 **−0.432 **−0.48 **−0.378 **−0.377 **−0.424 **−0.452 **−0.267 *
RH0.474 **0.437 **0.41 **0.338 **0.324 *0.357 **0.26 *0.351 **0.376 **0.391 **0.383 **
VPD−0.597 **−0.536 **−0.488 **−0.453 **−0.403 **−0.432 **−0.373 **−0.434 **−0.456 **−0.466 **−0.431 **
* and ** represent the correlation coefficient exceeding 95% and 99% of the significance tests, respectively.
Disclaimer/Publisher’s Note: The statements, opinions and data contained in all publications are solely those of the individual author(s) and contributor(s) and not of MDPI and/or the editor(s). MDPI and/or the editor(s) disclaim responsibility for any injury to people or property resulting from any ideas, methods, instructions or products referred to in the content.

