Exposure of Protected and Unprotected Forest to Plant Invasions in the Eastern United States

 , , and
Abstract
:1. Introduction
2. Materials and Methods
3. Results
4. Discussion
5. Conclusions
Supplementary Materials
Author Contributions
Funding
Acknowledgments
Conflicts of Interest
References
- Ervin, J. Protected area assessments in perspective. BioScience 2003, 53, 819–822. [Google Scholar] [CrossRef]
- IUCN (International Union for the Conservation of Nature). Guidelines for Protected Areas Management Categories; IUCN: Cambridge, UK; Gland, Switzerland, 1994; p. 261. [Google Scholar]
- Jenkins, C.N.; Joppa, L. Expansion of the global terrestrial protected area system. Biol. Conserv. 2009, 142, 2166–2174. [Google Scholar] [CrossRef]
- Balmford, A.; Leader-Williams, N.; Green, M.J.B. Parks or arks: Where to conserve large threatened mammals. Biodivers. Conserv. 1995, 4, 595–607. [Google Scholar] [CrossRef]
- Geldmann, J.; Barnes, M.; Coad, L.; Craigie, I.D.; Hockings, M.; Burgess, N.D. Effectiveness of terrestrial protected areas in reducing habitat loss and population declines. Biol. Conserv. 2013, 161, 230–238. [Google Scholar] [CrossRef]
- MacKinnon, D.; Lemieux, C.J.; Beazley, K.; Woodley, S.; Helie, R.; Perron, J.; Elliott, J.; Haas, C.; Langlois, J.; Lazaruk, H.; et al. Canada and Aichi Biodiversity Target 11: Understanding ‘other effective area-based conservation measures’ in the context of the broader target. Biodivers. Conserv. 2015, 24, 3559–3581. [Google Scholar] [CrossRef]
- Watson, J.E.M.; Darling, E.S.; Venter, O.; Maron, M.; Walston, J.; Possingham, H.P.; Dudley, N.; Hockings, M.; Barnes, M.; Brooks, T.M. Bolder science needed now for protected areas. Conserv. Biol. 2016, 30, 243–248. [Google Scholar] [CrossRef] [PubMed]
- Pressey, R.L.; Weeks, R.; Gurney, G.G. From displacement activities to evidence-informed decisions in conservation. Biol. Conserv. 2017, 212, 337–348. [Google Scholar] [CrossRef]
- Possingham, H.P.; Gerber, L.R. The effect of conservation spending. Nature 2017, 551, 309–310. [Google Scholar] [CrossRef] [PubMed]
- Joppa, L.N.; O’Connor, B.; Visconti, P.; Smith, C.; Geldmann, J.; Hoffmann, M.; Watson, J.E.; Butchart, S.H.; Virah-Sawmy, M.; Halpern, B.S.; et al. Filling in biodiversity threat gaps. Science 2016, 352, 416–418. [Google Scholar] [CrossRef] [PubMed] [Green Version]
- Carey, C.; Dudley, N.; Stolton, S. Squandering paradise? In The Importance and Vulnerability of the World’s Protected Areas; World Wildlife Fund for Nature International: Gland, Switzerland, 2000; p. 229. [Google Scholar]
- Hockings, M.; Stolton, S.; Leverington, F.; Dudley, N.; Courrau, J. Evaluating effectiveness. In A Framework for Assessing Management Effectiveness of Protected Areas, 2nd ed.; IUCN: Gland, Switzerland; Cambridge, UK, 2006; p. 105. [Google Scholar]
- Nagendra, H.; Lucas, R.; Honrado, J.P.; Jongman, R.H.G.; Tarantino, C.; Adamo, M.; Mairota, P. Remote sensing for conservation monitoring: Assessing protected areas, habitat extent, habitat condition, species diversity, and threats. Ecol. Indic. 2013, 33, 45–59. [Google Scholar] [CrossRef]
- Margules, C.R.; Pressey, R.L. Systematic conservation planning. Nature 2000, 405, 243–253. [Google Scholar] [CrossRef] [PubMed]
- Wurtzebach, Z.; Schultz, C. Measuring ecological integrity: History, practical applications, and research opportunities. BioScience 2016, 66, 446–457. [Google Scholar] [CrossRef]
- Hansen, A.J.; Piekielek, N.; Davis, C.; Hass, J.; Theobald, D.M.; Gross, J.E.; Monahan, W.B.; Olliff, T.; Running, S.W. Exposure of U.S. National Parks to land use and climate change 1900–2100. Ecol. Appl. 2014, 24, 484–502. [Google Scholar] [CrossRef] [PubMed]
- Lövei, G.L. Global change through invasion. Nature 1997, 388, 627–628. [Google Scholar] [CrossRef]
- Mack, R.N.; Simberloff, D.; Lonsdale, W.M.; Evans, H.; Clout, M.; Bazzaz, F.A. Biotic invasions: Causes, epidemiology, global consequences, and control. Ecol. Appl. 2000, 10, 689–710. [Google Scholar] [CrossRef]
- Pejchar, L.; Mooney, H.A. Invasive species, ecosystem services and human well-being. Trends Ecol. Evol. 2009, 24, 497–504. [Google Scholar] [CrossRef] [PubMed]
- Kettenring, K.M.; Adams, C.R. Lessons learned from invasive plant control experiments: A systematic review and meta-analysis. J. Appl. Ecol. 2011, 48, 970–979. [Google Scholar] [CrossRef]
- Fei, S.; Phillips, J.; Shouse, M. Biogeomorphic impacts of invasive species. Annu. Rev. Ecol. Evol. Syst. 2014, 45, 69–87. [Google Scholar] [CrossRef]
- Schulze, K.; Knights, K.; Coad, L.; Geldmann, J.; Leverington, F.; Eassom, A.; Marr, M.; Butchart, S.H.M.; Hockings, M.; Burgess, N.D. An assessment of threats to terrestrial protected areas. Conserv. Lett. 2018, 11, e12435. [Google Scholar] [CrossRef] [Green Version]
- Drees, L. A retrospective on NPS invasive species policy and management. Park Sci. 2004, 22, 21–26. [Google Scholar]
- Fancy, S.G.; Gross, J.E.; Carter, S.L. Monitoring the condition of natural resources in US national parks. Environ. Monit. Assess. 2009, 151, 161–174. [Google Scholar] [CrossRef] [PubMed]
- Iannone, B.V., III; Oswalt, C.M.; Liebhold, A.M.; Guo, Q.; Potter, K.M.; Nunez-Mir, G.C.; Oswalt, S.N.; Pijanowski, B.C.; Fei, S. Region-specific patterns and drivers of macroscale forest plant invasions. Divers. Distrib. 2015, 21, 1181–1192. [Google Scholar] [CrossRef]
- Oswalt, C.; Fei, S.; Guo, Q.; Iannone, B.V., III; Oswalt, S.; Pijanowski, B.; Potter, K. A subcontinental view of forest plant invasions using national inventory data. NeoBiota 2015, 24, 49–54. [Google Scholar] [CrossRef]
- Oswalt, C.M.; Oswalt, S.N. Invasive plants on forest land in the United States. In Forest Health Monitoring: National Category, Trends, and Analysis 2013; Potter, K.M., Conkling, B.L., Eds.; General Technical Report SRS-207; Department of Agriculture Forest Service, Southern Research Station: Asheville, NC, USA, 2015; p. 64. [Google Scholar]
- Riitters, K.; Potter, K.; Iannone, B., III; Oswalt, C.; Fei, S.; Guo, Q. Landscape correlates of forest plant invasions: A high-resolution analysis across the eastern United States. Divers. Distrib. 2017, 24, 274–284. [Google Scholar] [CrossRef] [Green Version]
- Lemke, D.; Hulme, P.E.; Brown, J.A.; Tadesse, W. Distribution modelling of Japanese honeysuckle (Lonicera japonica) invasion in the Cumberland Plateau and Mountain Region, USA. For. Ecol. Manag. 2011, 262, 139–149. [Google Scholar] [CrossRef]
- Catford, J.A.; Vesk, P.A.; White, M.D.; Wintle, B.A. Hotspots of plant invasion predicted by propagule pressure and ecosystem characteristics. Divers. Distrib. 2011, 17, 1099–1110. [Google Scholar] [CrossRef]
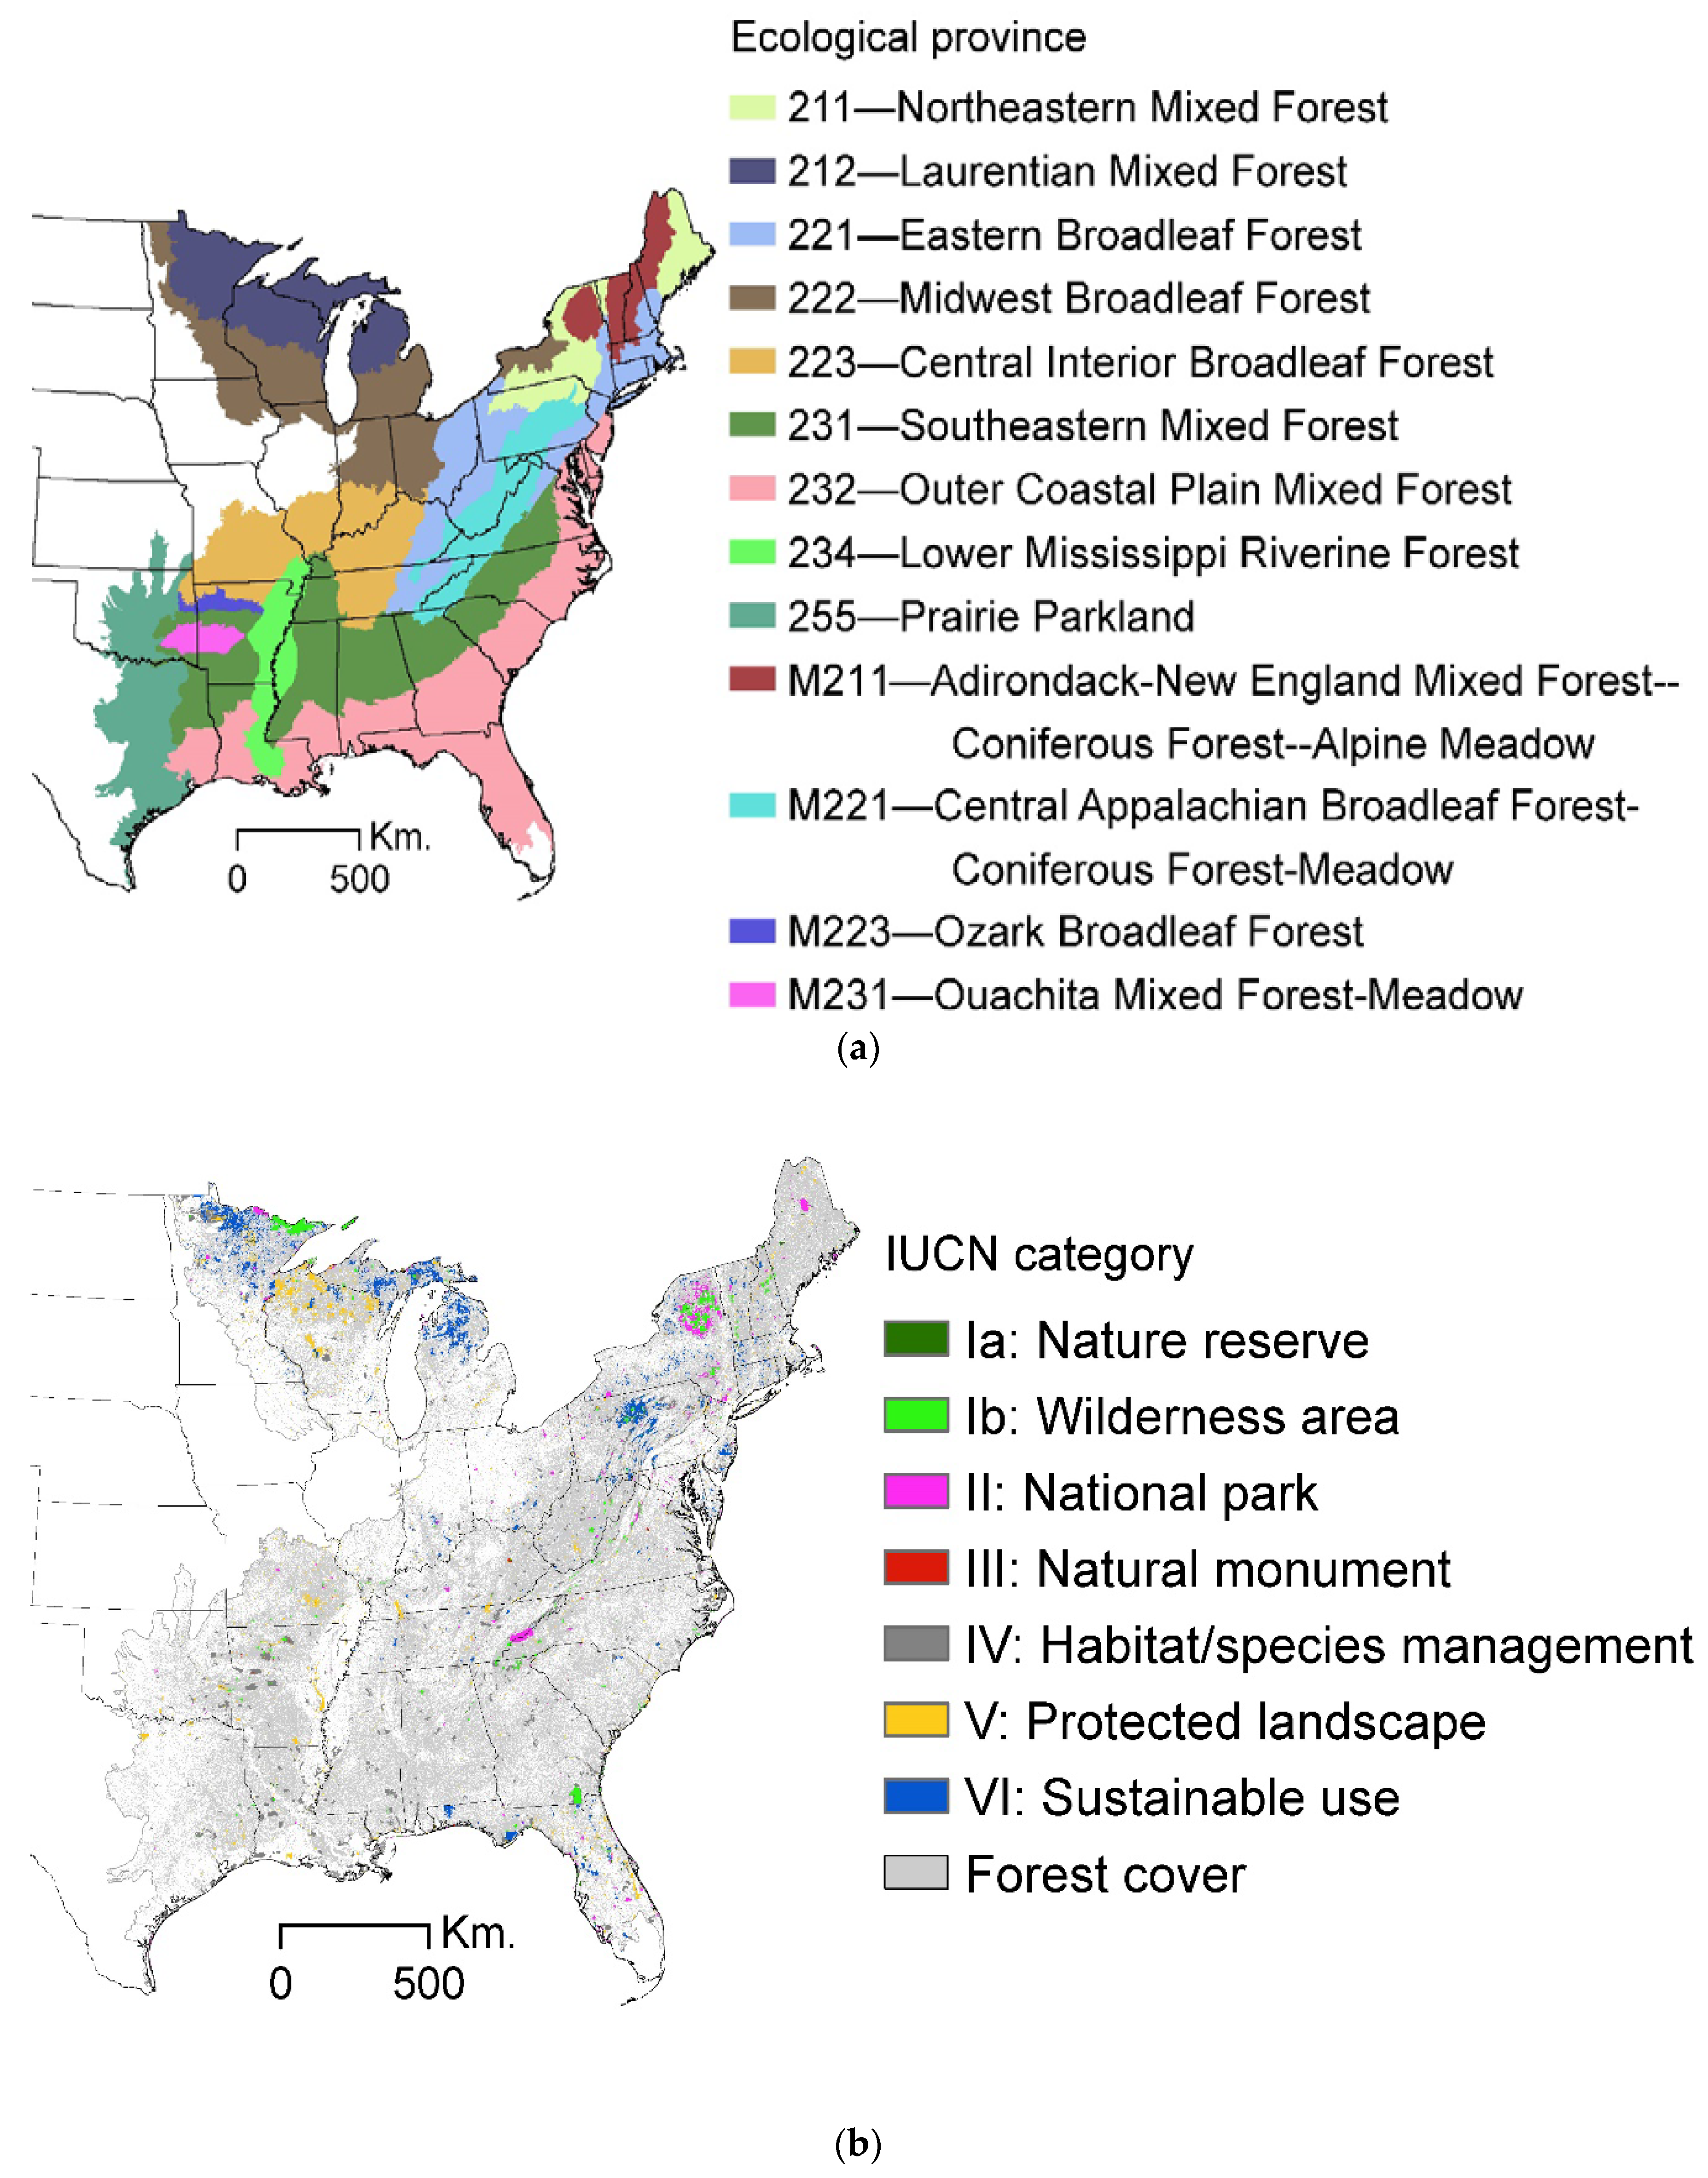
- Bailey, R.G. Descriptions of the Ecoregions of the United States, 2nd ed.; Department of Agriculture Forest Service: Washington, DC, USA, 1995; p. 108.
- Cleland, D.T.; Freeouf, J.A.; Keys, J.E., Jr.; Nowacki, G.J.; Carpenter, C.; McNab, W.H. Ecological Subregions: Sections and Subsections of the Conterminous United States; Gen. Tech. Report WO-76; Department of Agriculture, Forest Service: Washington, DC, USA, 2007.
- Smith, W.B.; Miles, P.D.; Perry, C.H.; Pugh, S.A. Forest Resources of the United States, 2007; General Technical Report WO-78; US Department of Agriculture, Forest Service: Washington, DC, USA, 2009; p. 336.
- Oswalt, S.N.; Smith, W.B.; Miles, P.D.; Pugh, S.A. Forest Resources of the United States, 2012: A Technical Document Supporting the Forest Service 2015 Update of the RPA Assessment; General Technical Report WO-91; Department of Agriculture, Forest Service, Washington Office: Washington, DC, USA, 2014; p. 218.
- Bechtold, W.A.; Patterson, P.L. The Enhanced Forest Inventory and Analysis Program—National Sampling Design and Estimation Procedures; Technical Report for US Department of Agriculture, Forest Service, Southern Research Station: Asheville, NC, USA, 2005; p. 85.
- USDA (United States Department of Agriculture). Field Inventory and Analysis National Core Field Guide. Volume I: Field Data Collection for Phase 2 Plots; Version 7.0; U.S. Department of Agriculture, Forest Service: Washington, DC, USA, 2015; p. 431.
- Ries, P.; Dix, M.E.; Lelmini, M.; Thomas, D. National Strategy and Implementation Plan for Invasive Species Management; United States Department of Agriculture, Forest Service: Washington, DC, USA, 2004.
- O’Connell, B.M.; LaPoint, E.B.; Turner, J.A.; Ridley, T.; Pugh, S.A.; Wilson, A.M.; Waddell, K.L.; Conkling, B.L. The Forest Inventory and Analysis Database: Database Description and User Guide Version 6.0.2 for Phase 2; U.S. Department of Agriculture, Forest Service: Washington, DC, USA, 2015; p. 748.
- The Conservation Biology Institute (CBI). PAD-US (CBI Edition) Version 2; CBI: Corvallis, OR, USA, 2012. [Google Scholar]
- Gooden, B.; French, K.; Turner, P.J.; Downey, P.O. Impact threshold for an alien plant invader, Lantana camara L., on native plant communities. Biol. Conserv. 2009, 142, 2631–2641. [Google Scholar] [CrossRef]
- Asaad, I.; Lundquist, C.J.; Erdmann, M.V.; Costello, M.J. Ecological criteria to identify areas for biodiversity conservation. Biol. Conserv. 2017, 213, 309–316. [Google Scholar] [CrossRef]
- USGS (United States Geological Survey). Gap Analysis Program. Protected Areas Database of the United States—PAD-US Standards and Methods Manual for Data Stewards. U.S. Geological Survey Gap Analysis Program, Boise State University, 2013; Available online: https://gapanalysis.usgs.gov/wp-content/uploads/2013/10/PADUS_Standards_Oct2013_USGSreview.pdf or https://gapanalysis.usgs.gov/blog/iucn-definitions/; (accessed on 1 November 2017). [Google Scholar]
- Wood, E.M.; Pidgeon, A.M.; Radeloff, V.C.; Helmers, D.P.; Culbert, P.D.; Keuler, N.S.; Flather, C.H. Long-term avian community response to housing development at the boundary of US protected areas: Effect size increases with time. J. Appl. Ecol. 2015, 52, 1227–1236. [Google Scholar] [CrossRef]
- Scott, J.M.; Davis, F.W.; McGhie, R.G.; Wright, R.G.; Groves, C.; Estes, J. Nature reserves: Do they capture the full range of America’s biological diversity? Ecol. Appl. 2001, 11, 999–1007. [Google Scholar] [CrossRef]
- Jenkins, C.N.; Van Houtan, K.S.; Pimm, S.L.; Sexton, J.O. US protected lands mismatch biodiversity priorities. Proc. Natl. Acad. Sci. USA 2015, 112, 5081–5086. [Google Scholar] [CrossRef] [PubMed] [Green Version]
- Reid, A.M.; Morin, L.; Downey, P.O.; French, K.; Virtue, J.G. Does invasive plant management aid the restoration of natural ecosystems? Biol. Conserv. 2009, 142, 2342–2349. [Google Scholar] [CrossRef]
- Vokoun, M.; Amacher, G.S.; Sullivan, J.; Wear, D. Examining incentives for adjacent non-industrial private forest landowners to cooperate. For. Policy Econ. 2010, 12, 104–110. [Google Scholar] [CrossRef]
- Butler, B.J.; Hewes, J.H.; Dickinson, B.J.; Andrejczyk, K.; Butler, S.M.; Markowski-Lindsay, M. USDA Forest Service National Woodland Owner Survey: National, Regional, and State Statistics for Family Forest and Woodland Ownerships with 10+ Acres, 2011–2013; Resource Bulletin NRS-99; U.S. Department of Agriculture, Forest Service: Newtown Square, PA, USA, 2016; p. 39.
- Locke, H.; Dearden, P. Rethinking protected area categories and the new paradigm. Environ. Conserv. 2005, 32, 1–10. [Google Scholar] [CrossRef]
- Joppa, L.N.; Loarie, S.R.; Pimm, S.L. On the protection of “protected areas”. Proc. Natl. Acad. Sci. USA 2008, 105, 6673–6678. [Google Scholar] [CrossRef] [PubMed]


| Province | Total Area | Protected Area | Strictly Protected Area 1 | ||
|---|---|---|---|---|---|
| Mha 2 | Mha | % 3 | Mha | % 4 | |
| 211 | 13.6 | 1.3 | 9.7 | 0.6 | 42.1 |
| 212 | 25.8 | 5.8 | 22.3 | 1.3 | 22.5 |
| 221 | 26.4 | 1.2 | 4.7 | 0.7 | 55.6 |
| 222 | 36.7 | 1.3 | 3.4 | 0.8 | 60.5 |
| 223 | 31.0 | 1.0 | 3.2 | 0.5 | 51.9 |
| 231 | 47.0 | 1.1 | 2.3 | 0.9 | 81.5 |
| 232 | 55.6 | 3.6 | 6.5 | 2.5 | 68.6 |
| 234 | 10.9 | 0.6 | 5.9 | 0.5 | 73.6 |
| 255 | 24.6 | 0.3 | 1.4 | 0.2 | 70.8 |
| M211 | 9.8 | 1.7 | 17.0 | 1.4 | 83.8 |
| M221 | 16.9 | 1.8 | 10.5 | 1.3 | 71.7 |
| M223 | 1.7 | 0.2 | 9.3 | 0.1 | 88.0 |
| M231 | 2.9 | 0.3 | 10.6 | 0.3 | 87.0 |
| All | 302.8 5 | 20.2 | 6.7 | 11.0 | 54.5 |
| Province | Forest Land Area | Protected Area | Strictly Protected Area | Forest Share of: | |||
|---|---|---|---|---|---|---|---|
| All Protected Area | Strictly Protected Area | ||||||
| Mha | Mha | % 1 | Mha | % 2 | % | % | |
| 211 | 9.9 | 1.3 | 12.7 | 0.5 | 42.3 | 94.0 | 94.5 |
| 212 | 17.1 | 4.6 | 27.1 | 0.8 | 18.1 | 80.3 | 64.3 |
| 221 | 14.2 | 1.1 | 7.6 | 0.5 | 50.3 | 87.3 | 78.9 |
| 222 | 7.0 | 0.7 | 9.7 | 0.4 | 50.9 | 53.8 | 45.3 |
| 223 | 12.9 | 0.8 | 6.3 | 0.4 | 48.3 | 81.5 | 75.8 |
| 231 | 29.4 | 1.0 | 3.3 | 0.8 | 81.7 | 86.9 | 87.2 |
| 232 | 32.9 | 2.5 | 7.6 | 1.6 | 64.6 | 68.8 | 64.8 |
| 234 | 3.0 | 0.5 | 15.6 | 0.4 | 79.0 | 71.9 | 77.2 |
| 255 | 6.8 | 0.2 | 2.3 | 0.1 | 72.1 | 46.7 | 47.5 |
| M211 | 8.6 | 1.6 | 18.1 | 1.3 | 85.3 | 94.4 | 96.1 |
| M221 | 11.9 | 1.6 | 13.8 | 1.2 | 71.9 | 91.6 | 91.9 |
| M223 | 1.3 | 0.2 | 11.5 | 0.1 | 90.3 | 92.1 | 94.5 |
| M231 | 2.3 | 0.3 | 12.5 | 0.3 | 89.0 | 92.8 | 94.9 |
| All | 157.0 3 | 16.1 | 10.3 | 8.4 | 52.1 | 79.9 | 76.5 |
| Protection Category | Estimated Forest Area | Estimated Invaded Forest Area | Estimated Uninvaded Forest Area | |
|---|---|---|---|---|
| Proportion | Absolute | |||
| Mha | % | Mha | Mha | |
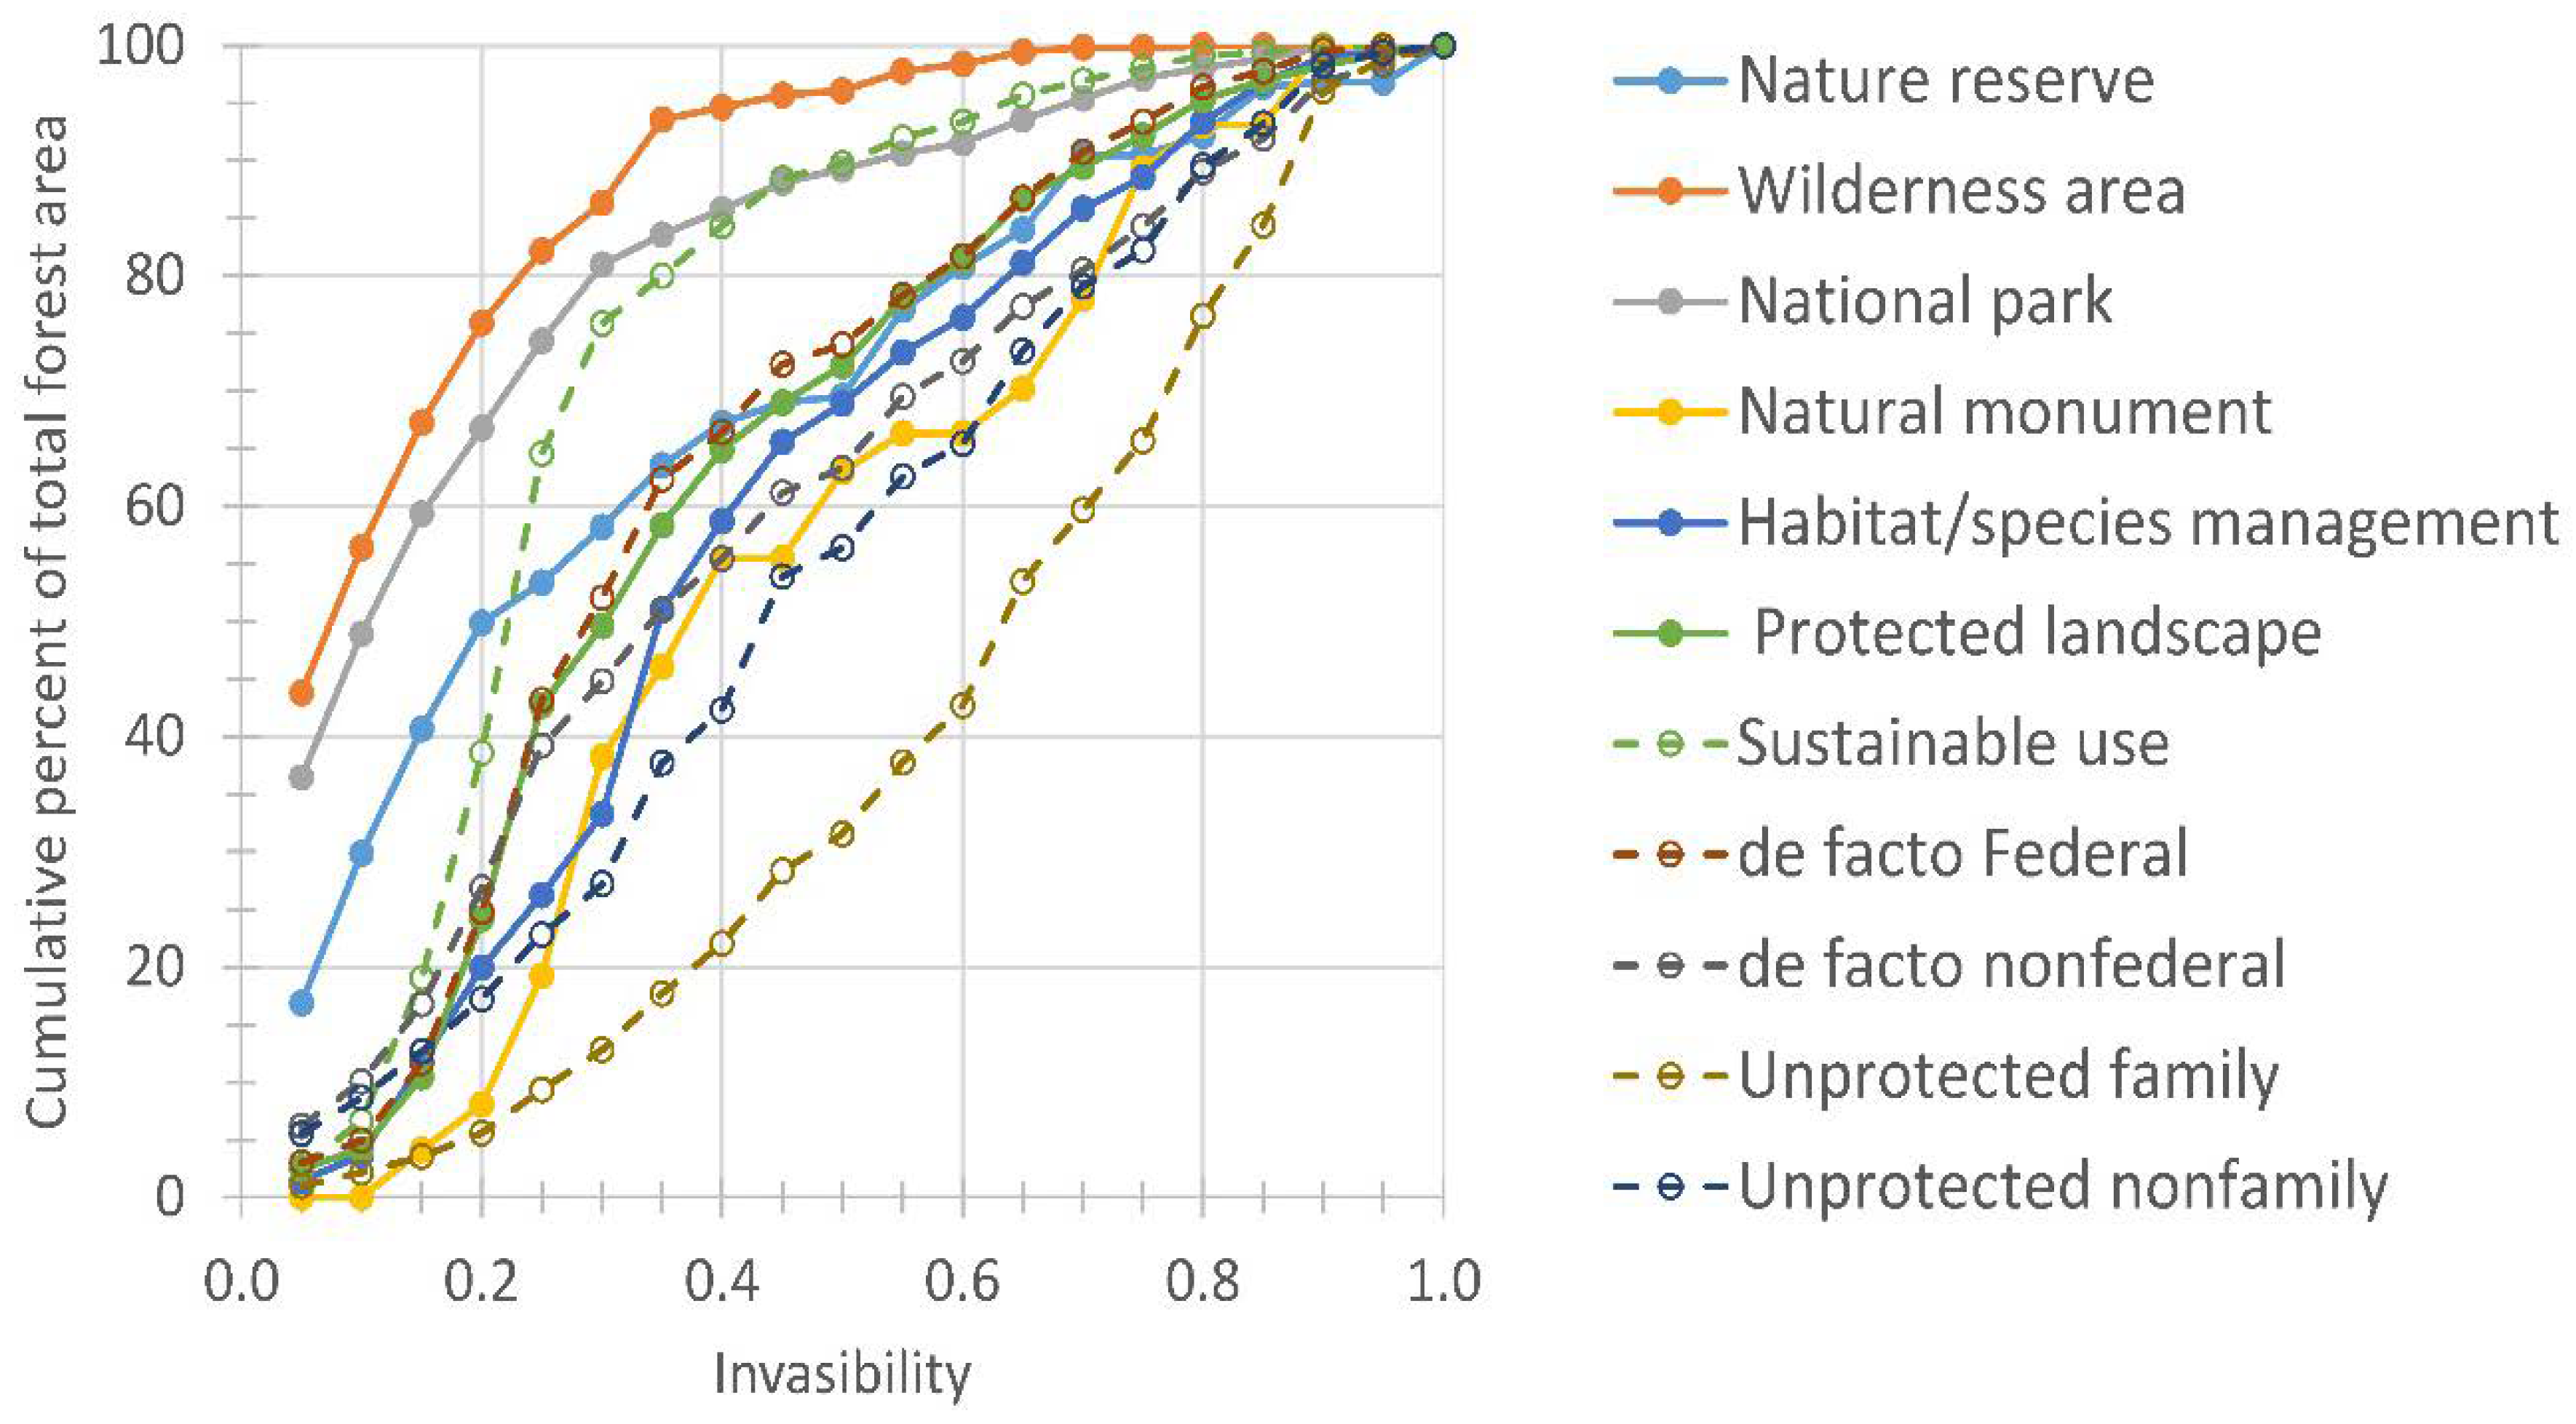
| Wilderness area | 1.64 | 12.5 | 0.20 | 1.44 |
| National park | 1.59 | 18.1 | 0.29 | 1.31 |
| Sustainable use | 4.97 | 26.3 | 1.31 | 3.66 |
| Nature reserve | 0.18 | 31.0 | 0.06 | 0.13 |
| de facto Federal | 10.01 | 35.6 | 3.56 | 6.45 |
| Protected landscape | 2.76 | 36.7 | 1.01 | 1.75 |
| de facto nonfederal | 7.23 | 40.8 | 2.95 | 4.28 |
| Habitat/species management | 4.93 | 40.9 | 2.02 | 2.91 |
| Natural monument | 0.06 | 45.4 | 0.03 | 0.03 |
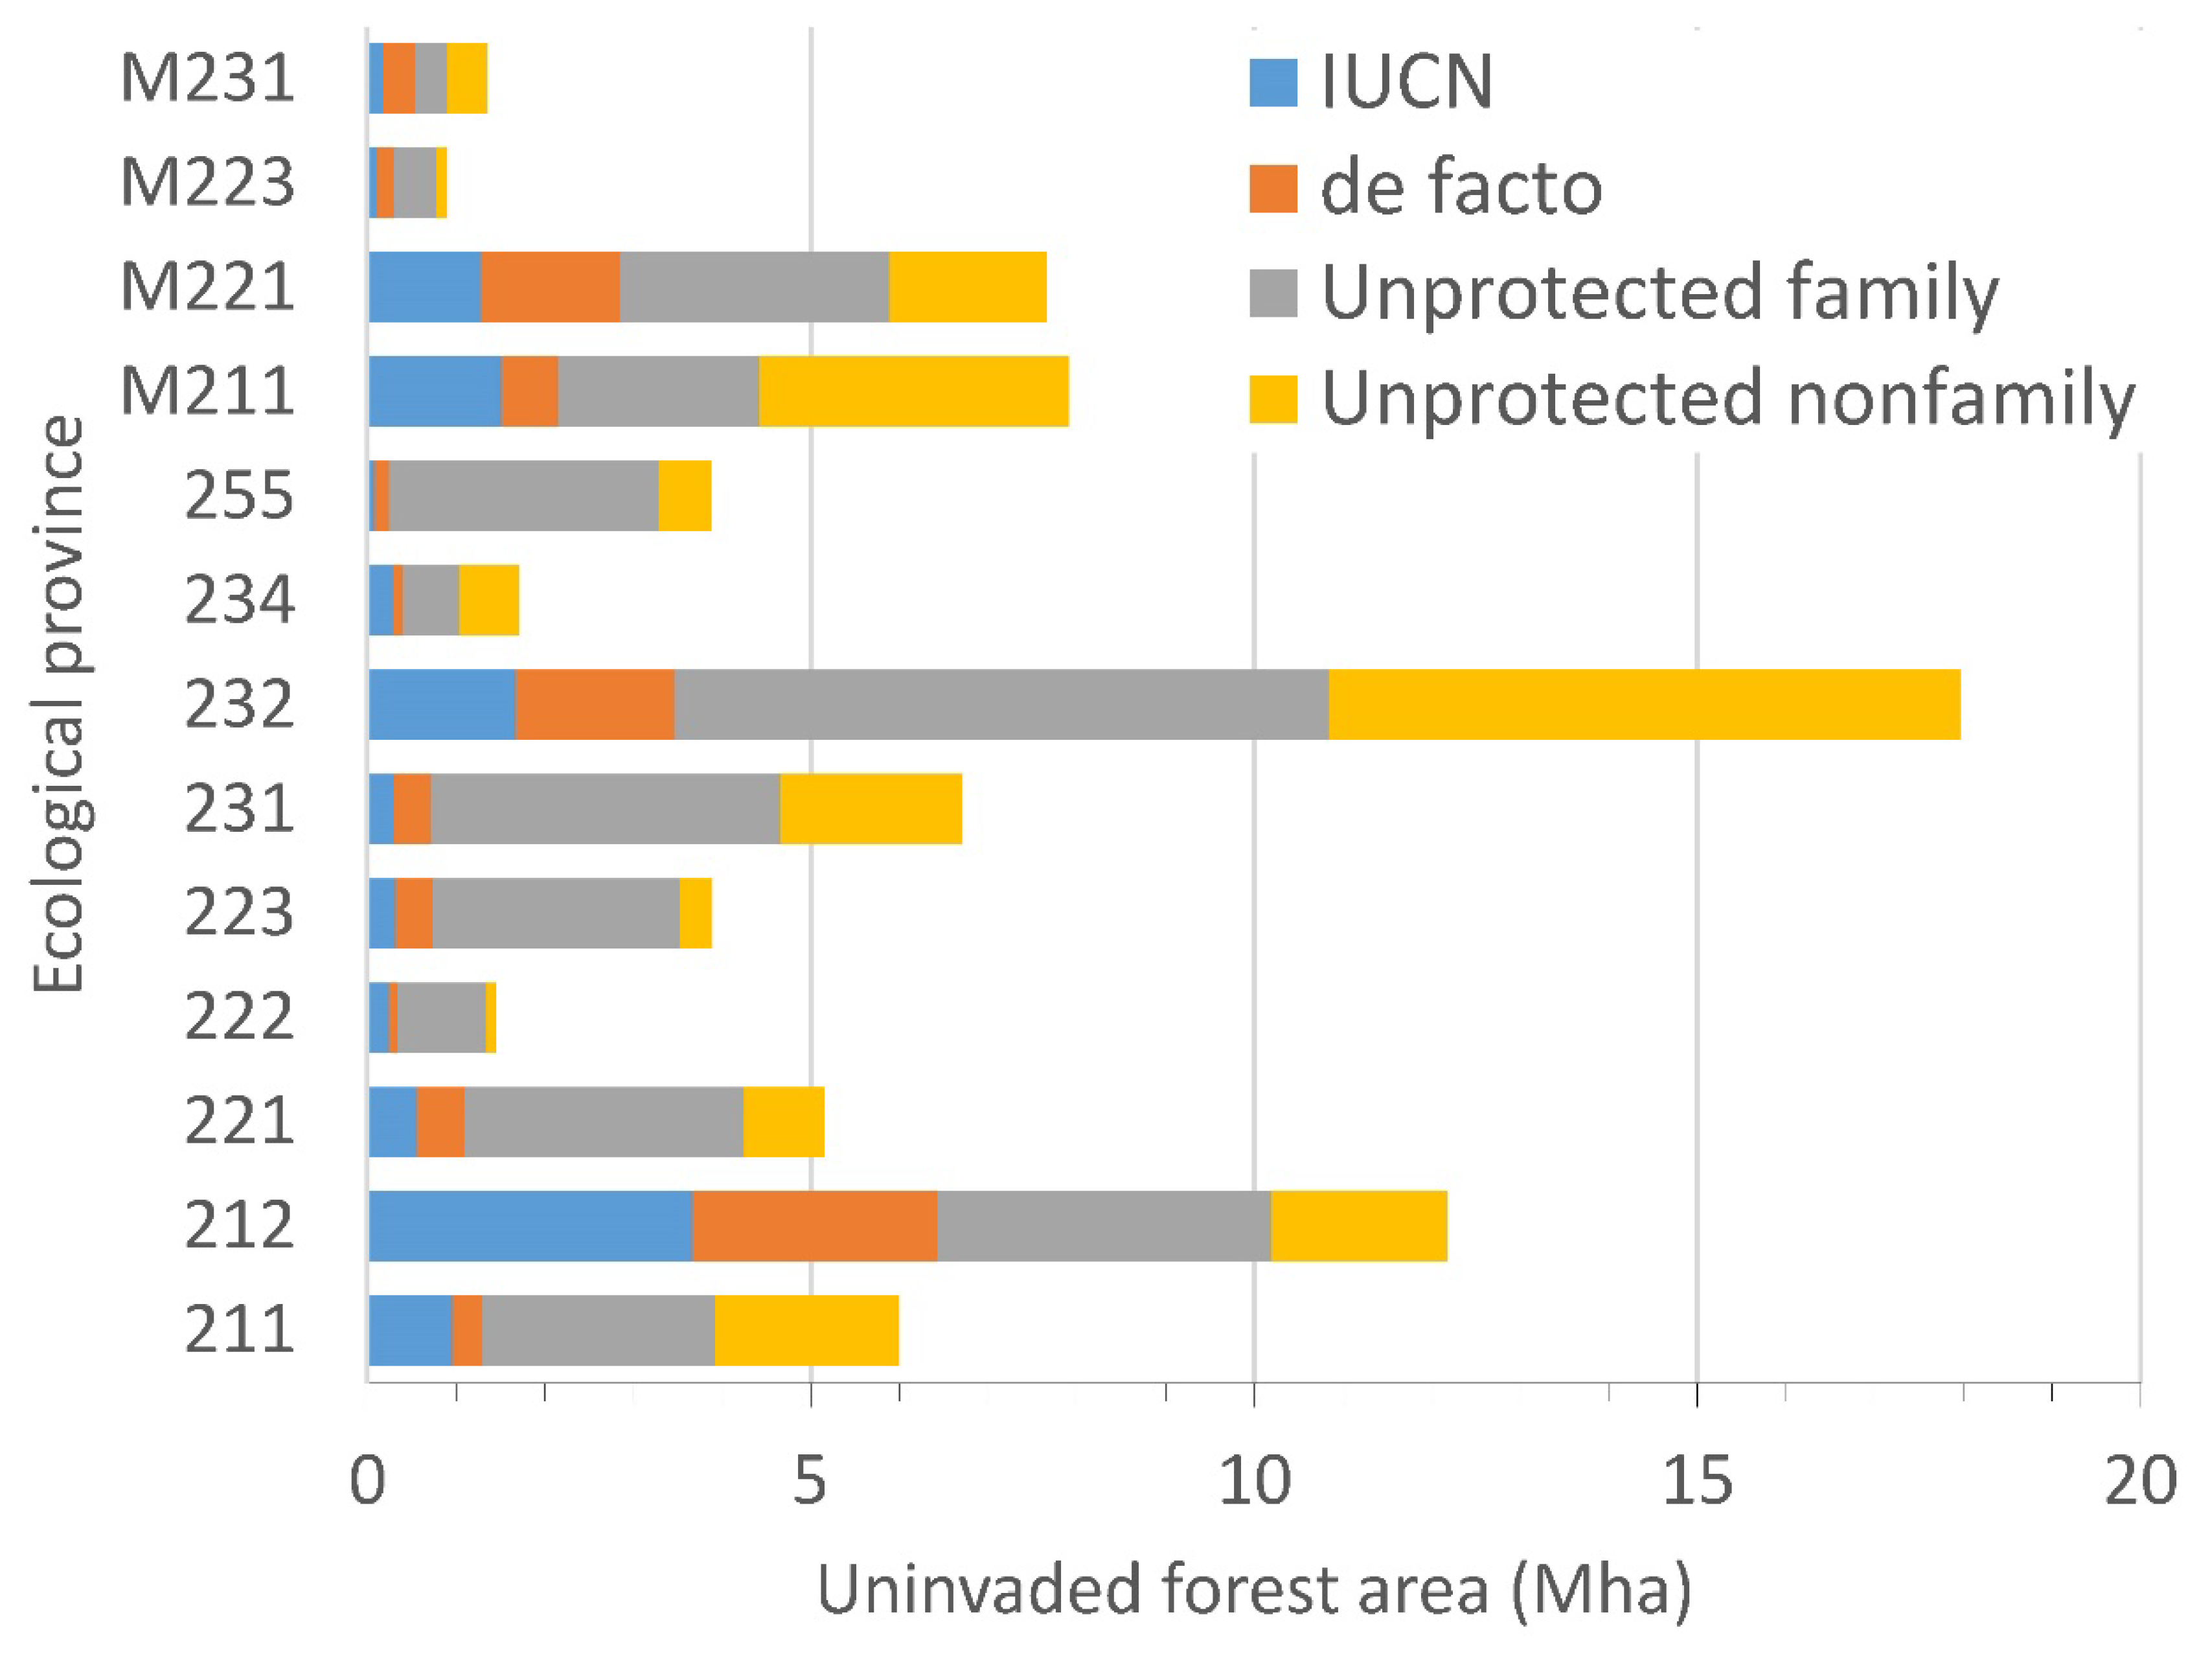
| Unprotected nonfamily 1 | 38.14 | 46.0 | 17.55 | 20.58 |
| Unprotected family 2 | 85.51 | 60.0 | 51.32 | 34.19 |
| All protection categories | 157.03 3 | 51.1 | 80.30 | 76.73 |
© 2018 by the authors. Licensee MDPI, Basel, Switzerland. This article is an open access article distributed under the terms and conditions of the Creative Commons Attribution (CC BY) license (http://creativecommons.org/licenses/by/4.0/).
Share and Cite
Riitters, K.; Potter, K.M.; Iannone, B.V., III; Oswalt, C.; Guo, Q.; Fei, S. Exposure of Protected and Unprotected Forest to Plant Invasions in the Eastern United States. Forests 2018, 9, 723. https://0-doi-org.brum.beds.ac.uk/10.3390/f9110723
Riitters K, Potter KM, Iannone BV III, Oswalt C, Guo Q, Fei S. Exposure of Protected and Unprotected Forest to Plant Invasions in the Eastern United States. Forests. 2018; 9(11):723. https://0-doi-org.brum.beds.ac.uk/10.3390/f9110723
Chicago/Turabian StyleRiitters, Kurt, Kevin M. Potter, Basil V. Iannone, III, Christopher Oswalt, Qinfeng Guo, and Songlin Fei. 2018. "Exposure of Protected and Unprotected Forest to Plant Invasions in the Eastern United States" Forests 9, no. 11: 723. https://0-doi-org.brum.beds.ac.uk/10.3390/f9110723