Wood Density Profiles and Their Corresponding Tissue Fractions in Tropical Angiosperm Trees

 , , , , and
Abstract
:
1. Introduction
2. Materials and Methods
2.1. Study Site and Samples
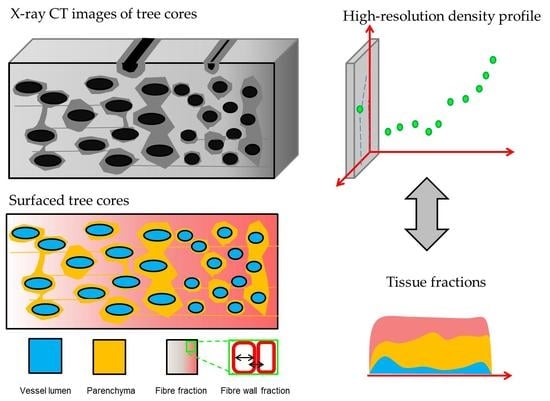
2.2. X-Ray CT Densitometry
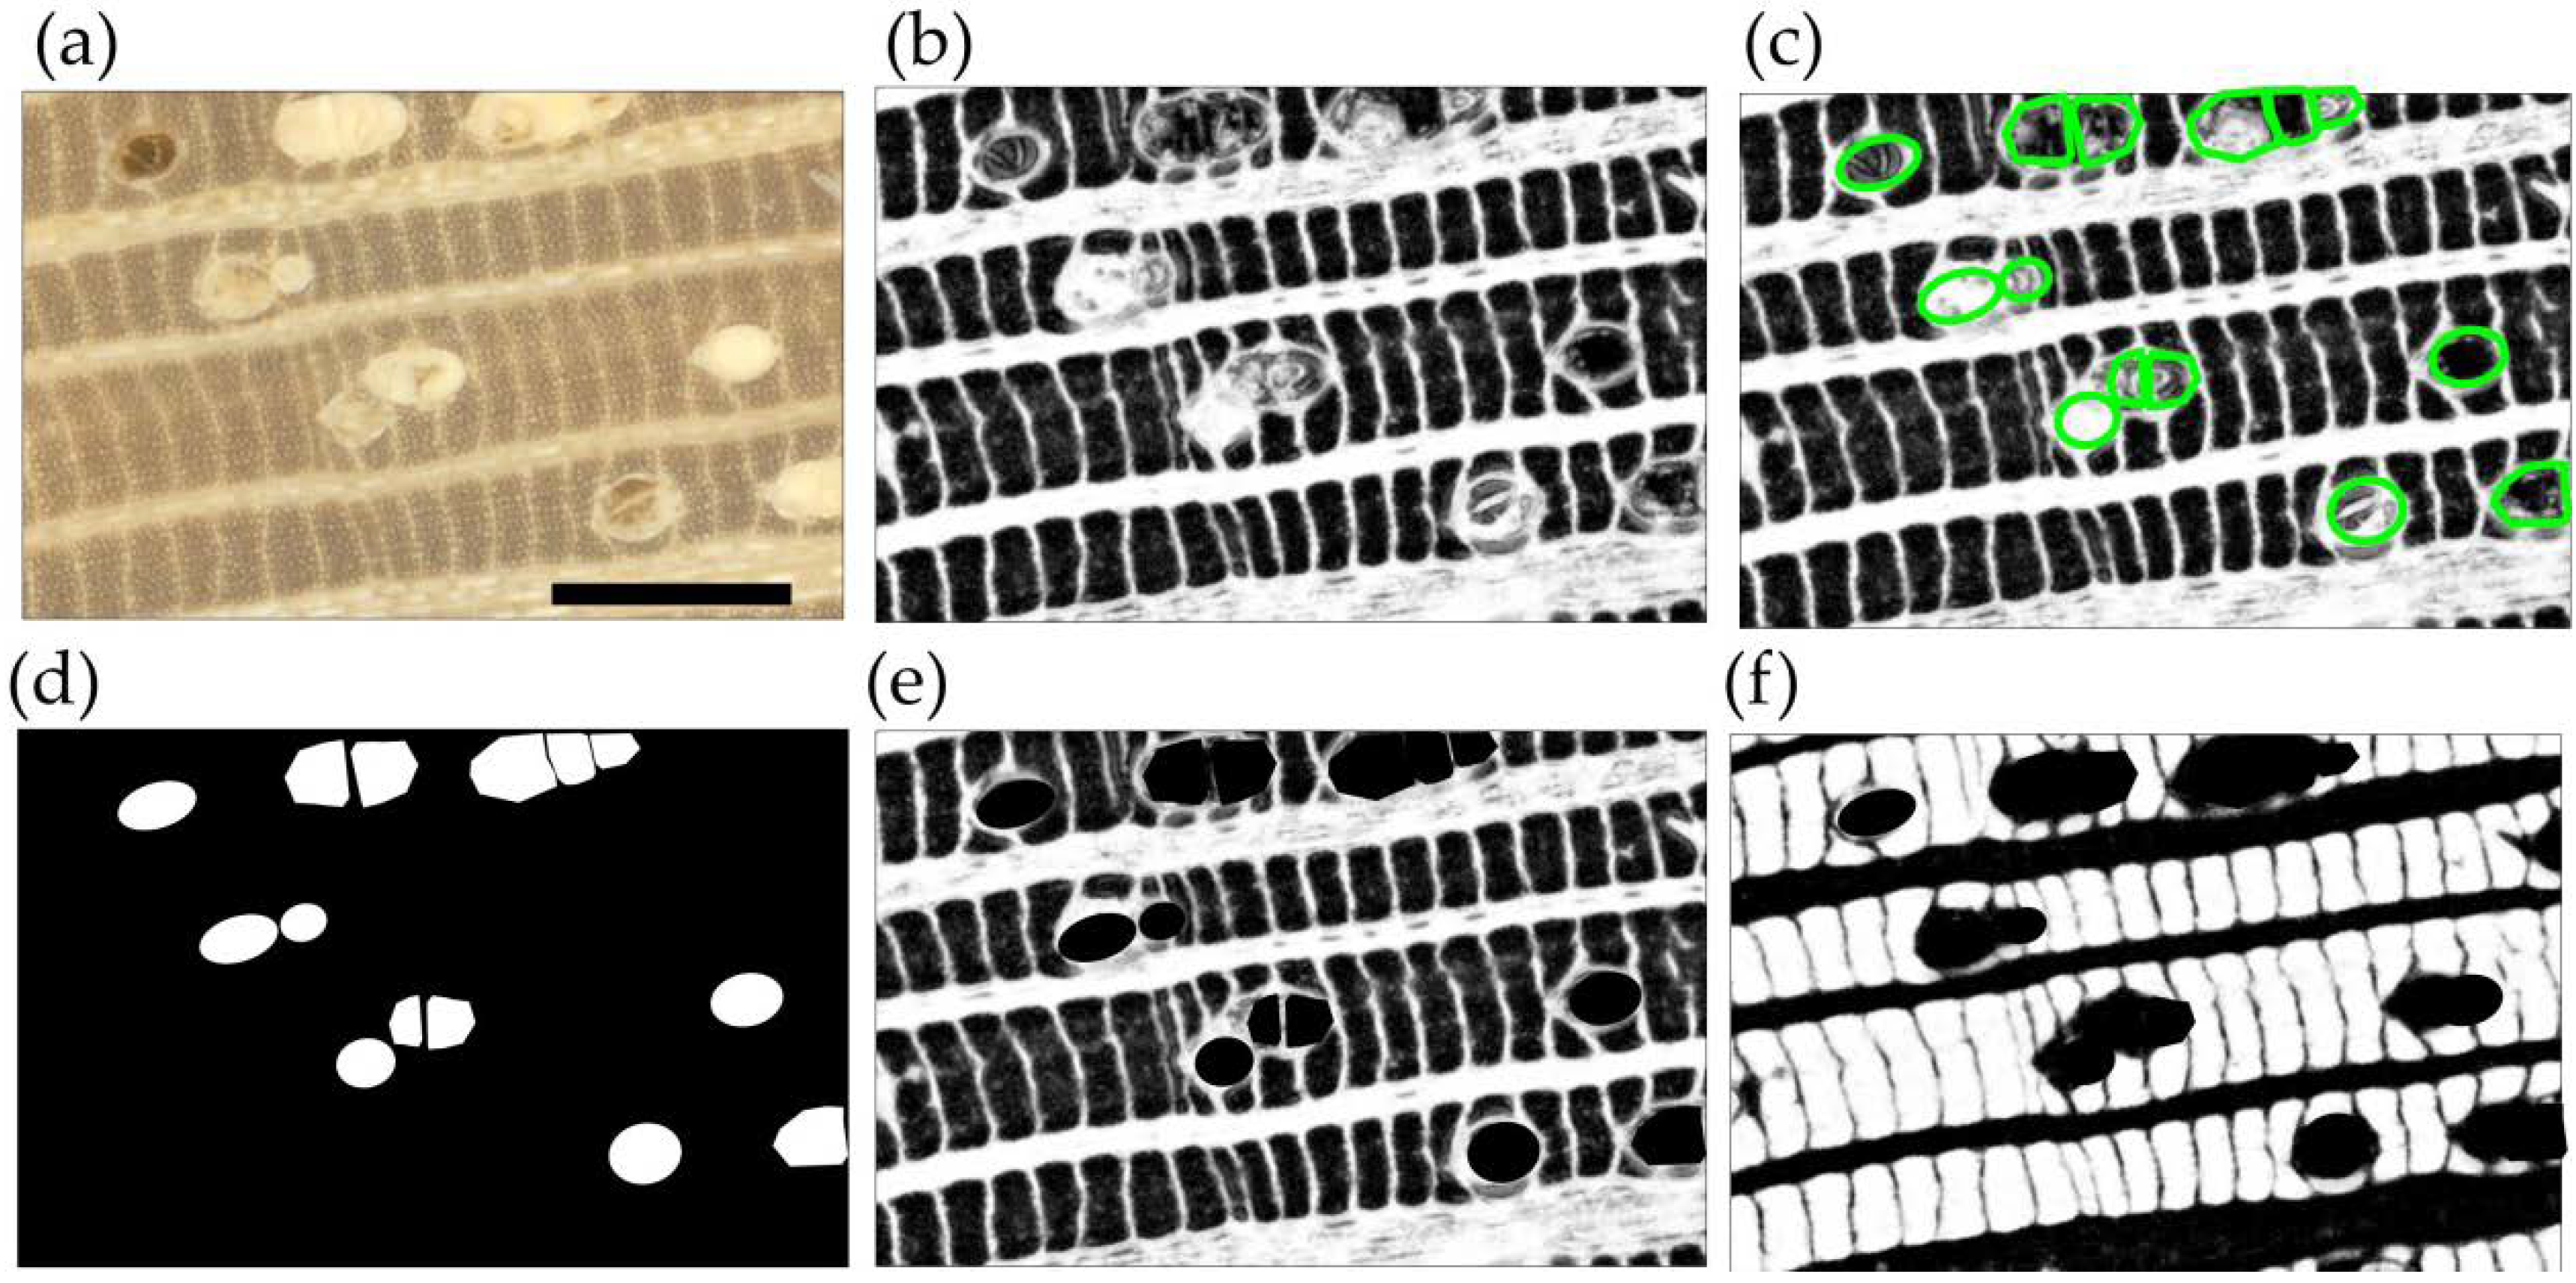
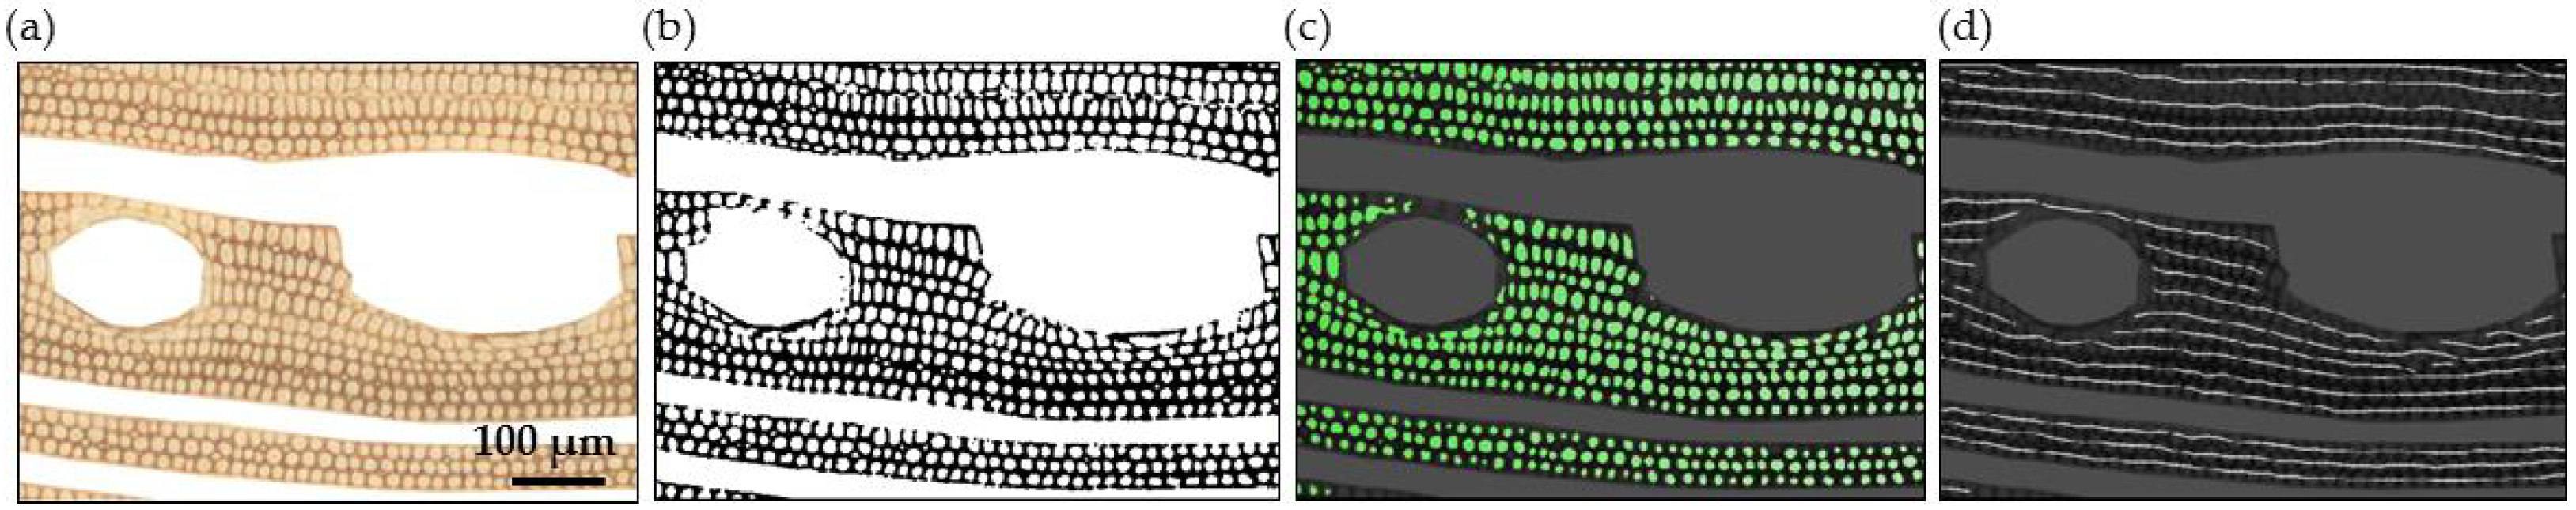
2.3. Wood Anatomical Measurements
2.3.1. Parenchyma and Vessels
2.3.2. Fibres
2.4. Model and Local Correlation
3. Results
3.1. General Wood Density—Anatomical Fractions Relationship
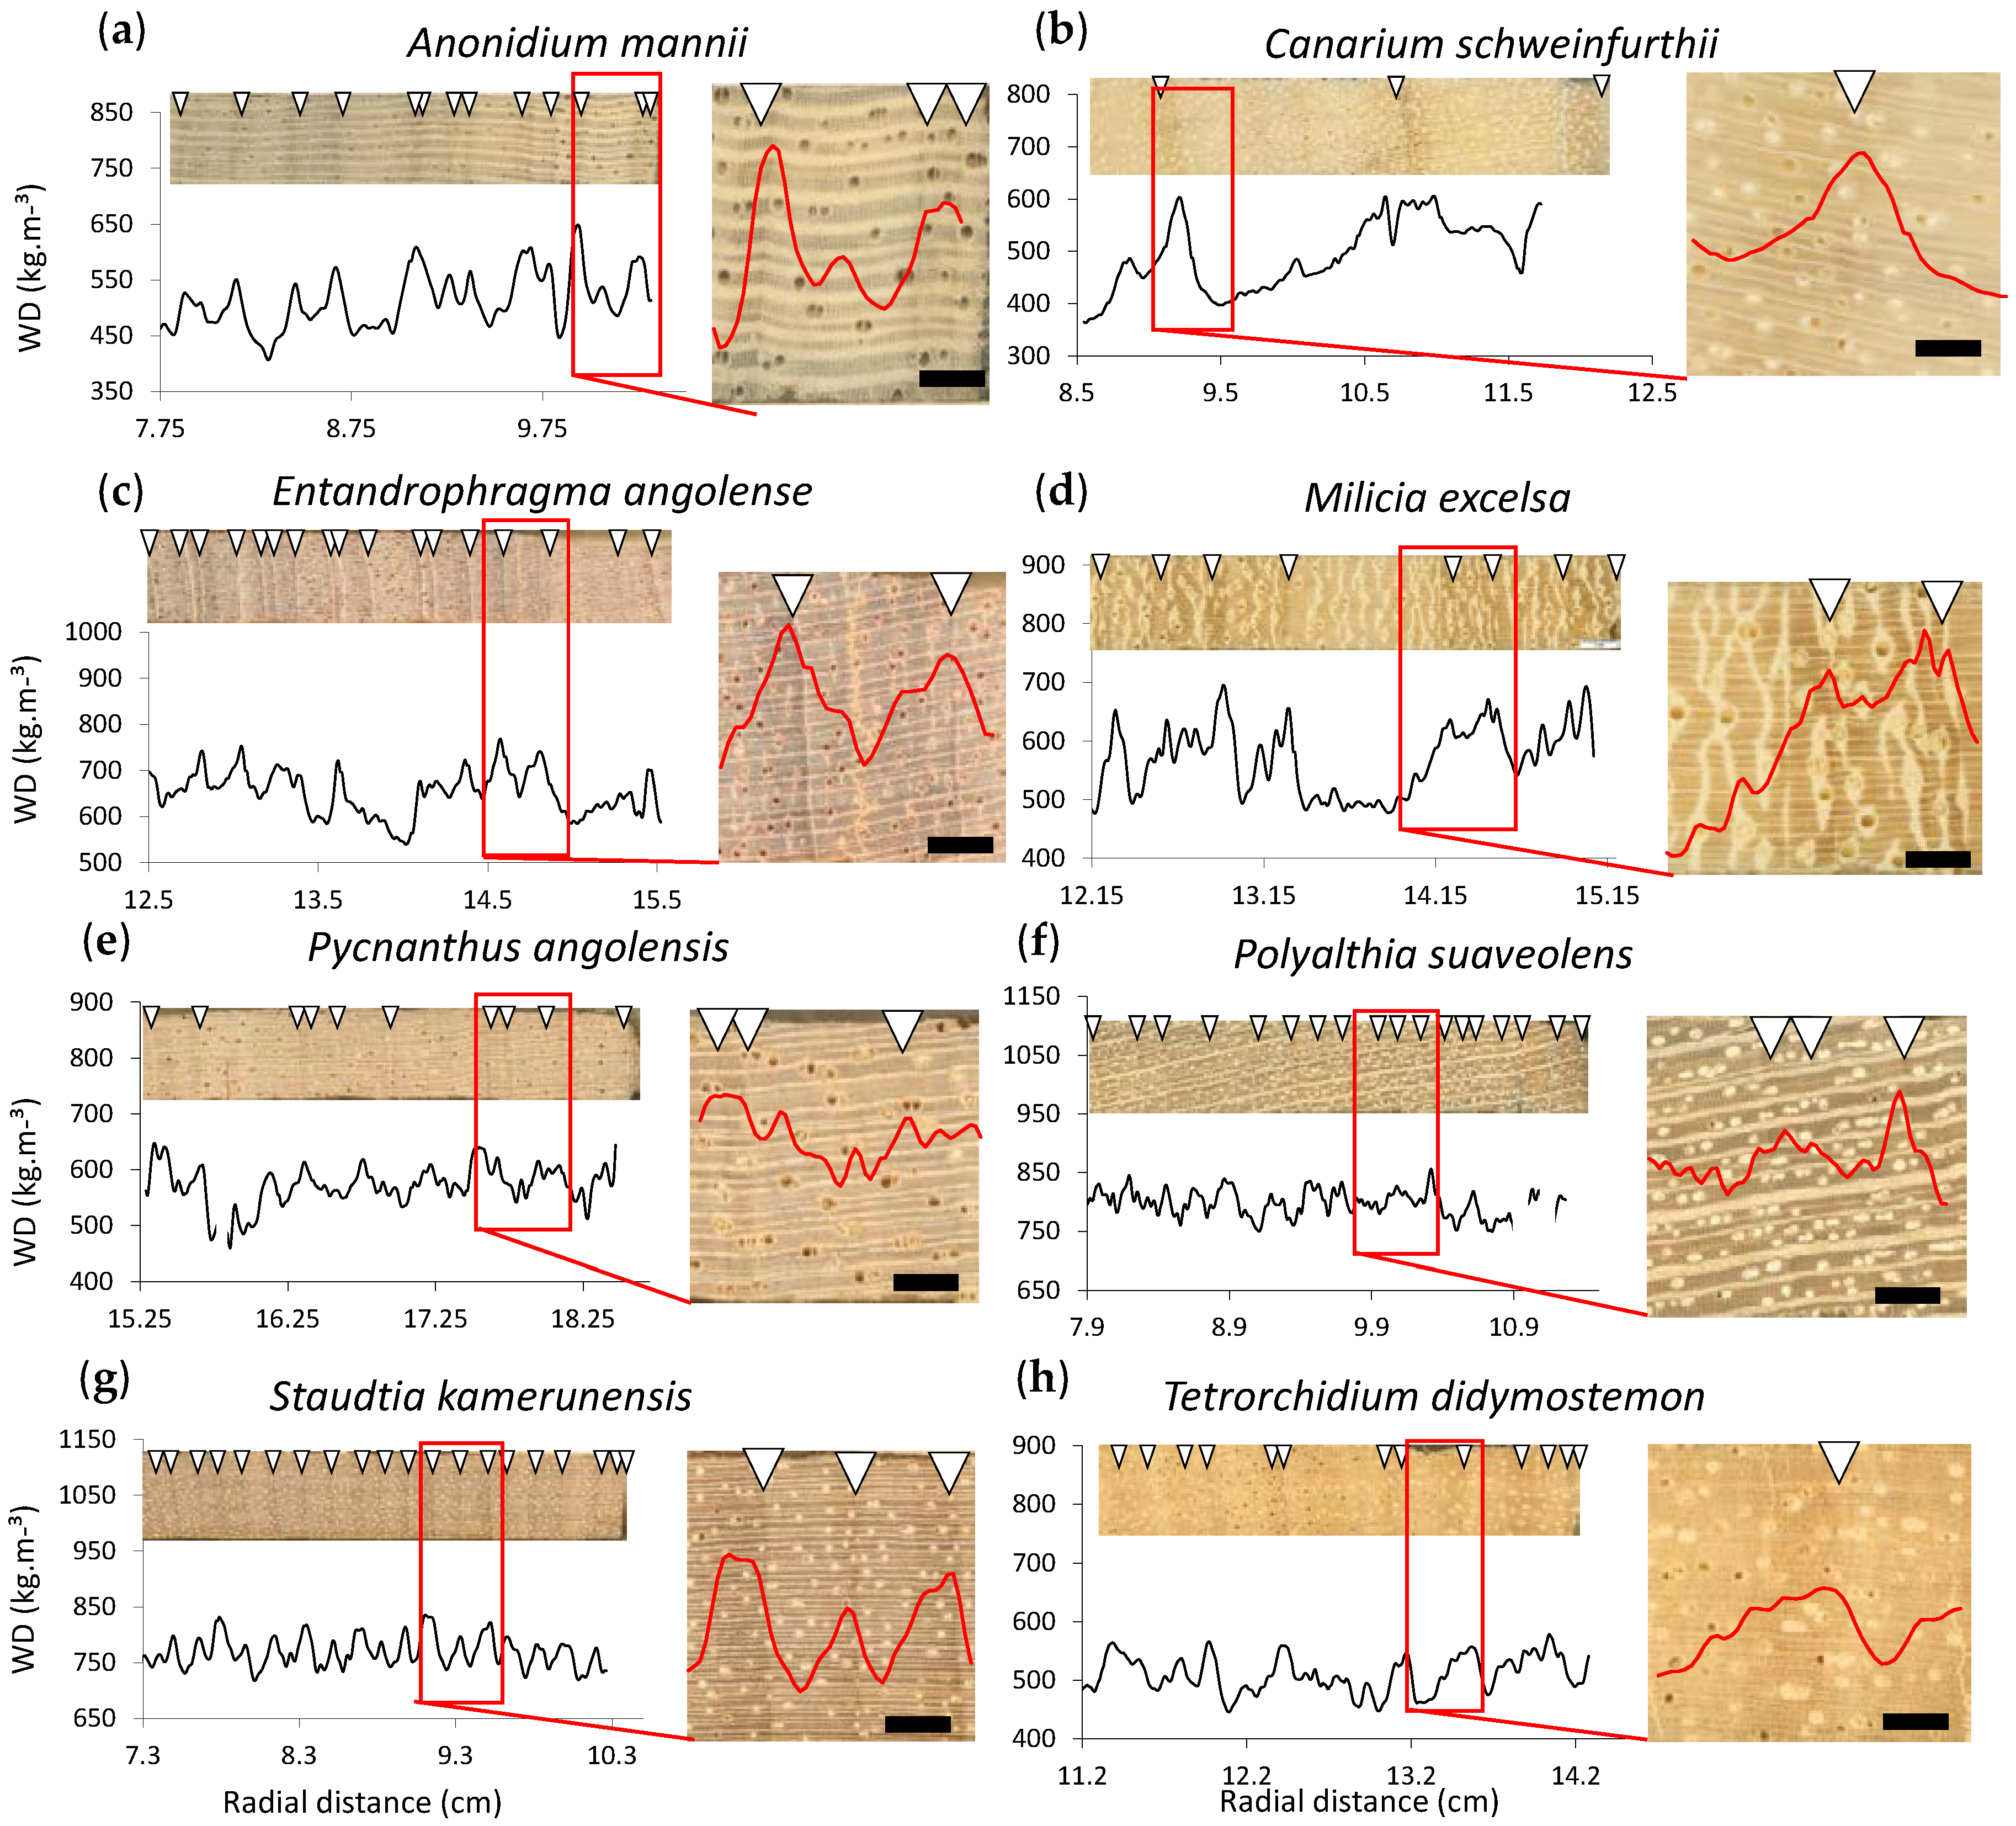
3.2. Local Definition of the Density Profile: Growth Ring Boundary Criterion
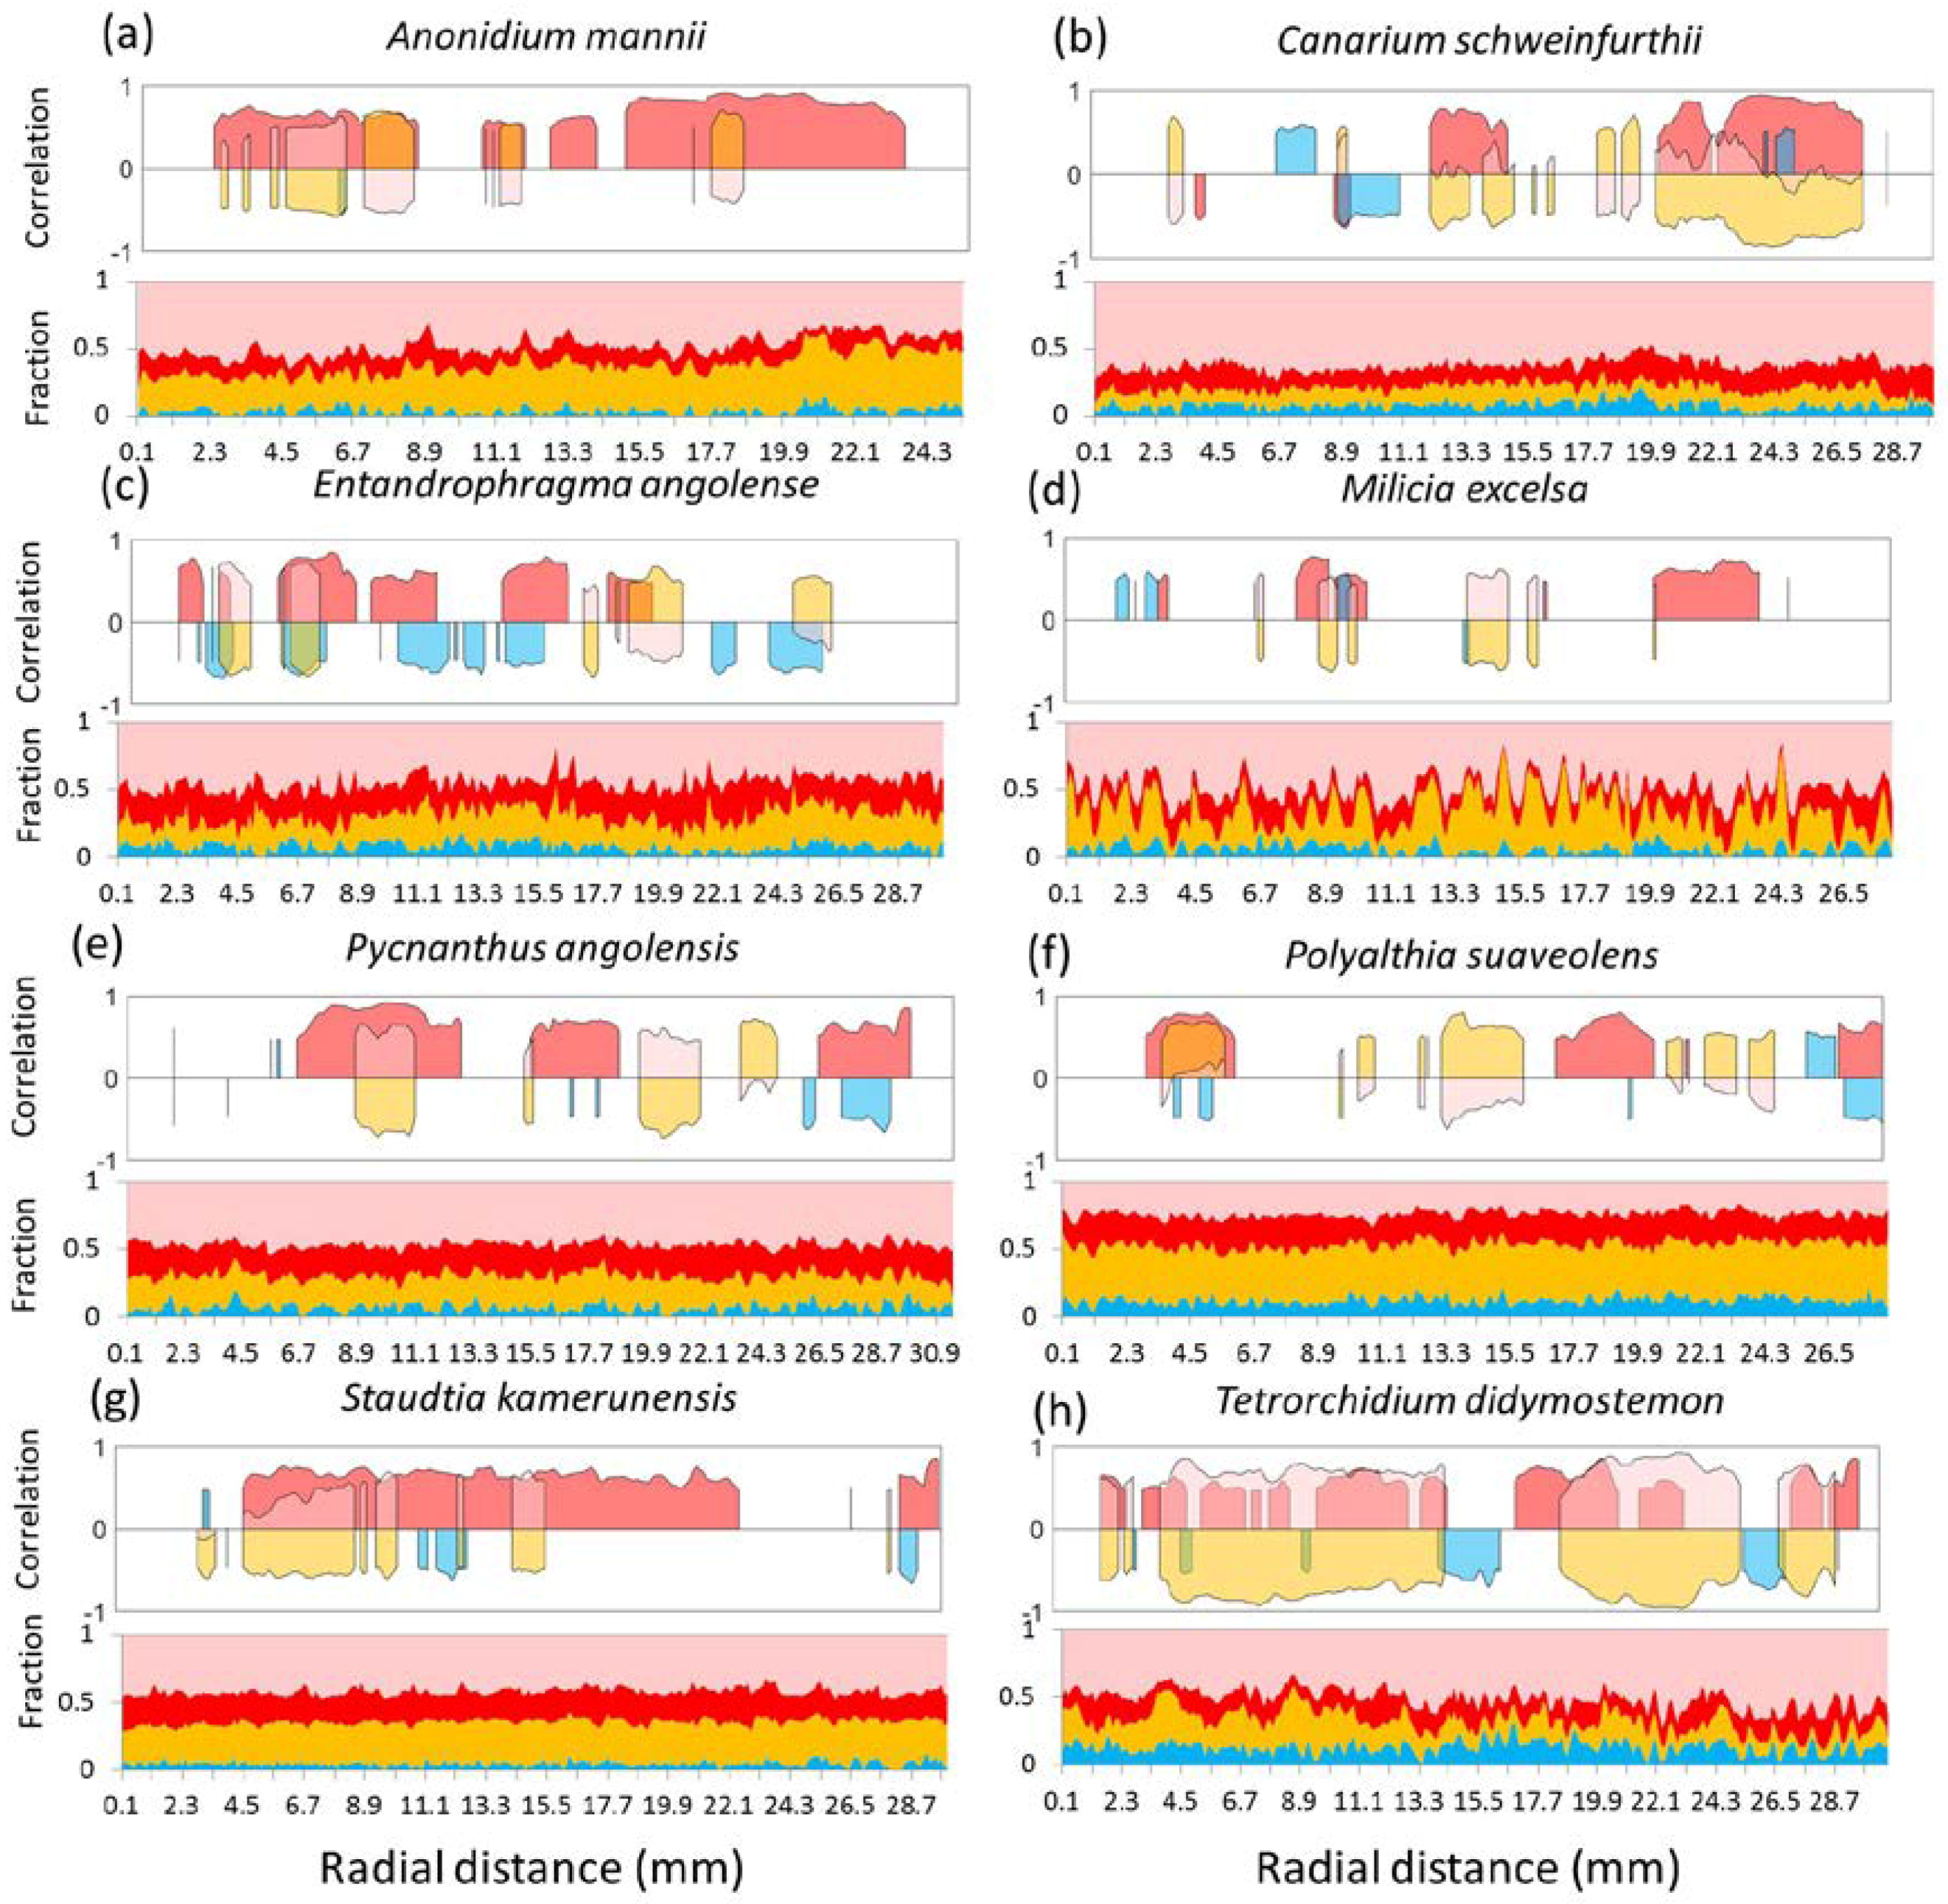
3.3. Local Radial Variation in the Relation between Wood Density and Wood Anatomical Fractions
4. Discussion
5. Conclusions
Author Contributions
Funding
Acknowledgments
Conflicts of Interest
References
- Chave, J.; Coomes, D.; Jansen, S.; Lewis, S.L.; Swenson, N.G.; Zanne, A.E. Towards a worldwide wood economics spectrum. Ecol. Lett. 2009, 12, 351–366. [Google Scholar] [CrossRef] [PubMed] [Green Version]
- Lachenbruch, B.; Mcculloh, K.A. Traits, properties, and performance: How woody plants combine hydraulic and mechanical functions in a cell, tissue, or whole plant. New Phytol. 2014, 204, 747–764. [Google Scholar] [CrossRef] [PubMed]
- Baker, T.R.; Phillips, O.L.; Malhi, Y.; Almeida, S.; Arroyo, L.; Di Fiore, A.; Erwin, T.; Killeen, T.J.; Laurance, S.G.; Laurance, W.F.; et al. Variation in wood density determines spatial patterns in Amazonian forest biomass. Glob. Chang. Biol. 2004, 10, 545–562. [Google Scholar] [CrossRef]
- Hietz, P.; Valencia, R.; Joseph Wright, S. Strong radial variation in wood density follows a uniform pattern in two neotropical rain forests. Funct. Ecol. 2013, 27, 684–692. [Google Scholar] [CrossRef] [Green Version]
- Bastin, J.F.; Fayolle, A.; Tarelkin, Y.; Van Den Bulcke, J.; De Haulleville, T.; Mortier, F.; Beeckman, H.; Van Acker, J.; Serckx, A.; Bogaert, J.; et al. Wood specific gravity variations and biomass of central African tree species: The simple choice of the outer wood. PLoS ONE 2015, 10, e0142146. [Google Scholar] [CrossRef] [PubMed] [Green Version]
- Bouriaud, O.; Leban, J.-M.; Bert, D.; Deleuze, C. Intra-annual variations in climate influence growth and wood density of Norway spruce. Tree Physiol. 2005, 25, 651–660. [Google Scholar] [CrossRef] [PubMed] [Green Version]
- Björklund, J.A.; Gunnarson, B.E.; Seftigen, K.; Esper, J.; Linderholm, H.W. Blue intensity and density from northern Fennoscandian tree rings, exploring the potential to improve summer temperature reconstructions with earlywood information. Clim. Past 2014, 10, 877–885. [Google Scholar] [CrossRef]
- Polge, H. Établissement des courbes de variation de la densité du bois par exploration densitométrique de radiographies d’échantillons prélevés à la tarière sur des arbres vivants. Applications dans les domaines Technologique et Physiologique. Ann. Sci. For. 1966, 23, 215. [Google Scholar] [CrossRef]
- Evans, R. Rapid measurement of the transverse Dimensions of Tracheids in radial wood sections from Pinus radiata. Holzforschung 1994, 48, 168–172. [Google Scholar] [CrossRef]
- Chen, F.F.; Evans, R. Automated measurement of vessel properties in birch and poplar wood. Holzforschung 2010, 64, 369–374. [Google Scholar] [CrossRef]
- Jacquin, P.; Longuetaud, F.; Leban, J.M.; Mothe, F. X-ray microdensitometry of wood: A review of existing principles and devices. Dendrochronologia 2017, 42, 42–50. [Google Scholar] [CrossRef]
- Bergsten, U.; Lindeberg, J.; Rindby, A.; Evans, R. Batch measurements of wood density on intact or prepared drill cores using x-ray microdensitometry. Wood Sci. Technol. 2001, 35, 435–452. [Google Scholar] [CrossRef]
- De Mil, T.; Vannoppen, A.; Beeckman, H.; Van Acker, J.; Van den Bulcke, J. A field-to-desktop toolchain for X-ray CT densitometry enables tree ring analysis. Ann. Bot. 2016, 117, 1187–1196. [Google Scholar] [CrossRef] [PubMed] [Green Version]
- Van den Bulcke, J.; Boone, M.N.; Van Acker, J.; Stevens, M.; Van Hoorebeke, L. X-ray tomography as a tool for detailed anatomical analysis. Ann. For. Sci. 2009, 66, 1–12. [Google Scholar] [CrossRef]
- Van den Bulcke, J.; Wernersson, E.L.G.; Dierick, M.; Van Loo, D.; Masschaele, B.; Brabant, L.; Boone, M.N.; Van Hoorebeke, L.; Haneca, K.; Brun, A.; et al. 3D tree-ring analysis using helical X-ray tomography. Dendrochronologia 2014, 32, 39–46. [Google Scholar] [CrossRef]
- Steffenrem, A.; Kvaalen, H.; Dalen, K.S.; Høibø, O.A. A high-throughput X-ray-based method for measurements of relative wood density from unprepared increment cores from Picea abies. Scand. J. For. Res. 2014, 29, 506–514. [Google Scholar] [CrossRef]
- Briffa, K.R. Trees tell of past climates: But are they speaking less clearly today? Philos. Trans. R. Soc. Lond. B Biol. Sci. 1998, 353, 65–73. [Google Scholar] [CrossRef]
- Björklund, J.; Seftigen, K.; Schweingruber, F.; Fonti, P.; von Arx, G.; Bryukhanova, M.V.; Cuny, H.E.; Carrer, M.; Castagneri, D.; Frank, D.C. Cell size and wall dimensions drive distinct variability of earlywood and latewood density in Northern Hemisphere conifers. New Phytol. 2017, 216, 728–740. [Google Scholar] [CrossRef] [PubMed]
- Goldstein, G.; Santiago, S.L. Tropical Tree Physiology; Springer: Berlin, Germany, 2016; p. 467. ISBN 9783319274201. [Google Scholar]
- Mariaux, A. Les cernes dans les bois tropicaux africains, nature et périodicité: Peuvent-ils révéler l’âge des arbres? Bois For. Trop. 1967, 113, 3–14. [Google Scholar]
- Nepveu, G. Croissance et qualité du bois de framiré. Evolution de la largeur de cerne et des composantes densitométriques en fonction de l’âge. Bois For. Trop. 1976, 165, 39–58. [Google Scholar]
- Pagotto, M.A.; DeSoto, L.; Carvalho, A.; Nabais, C.; Filho, M.T.; Ribeiro, A.; Lisi, C.S. Evaluation of X-ray densitometry to identify tree-ring boundaries of two deciduous species from semi-arid forests in Brazil. Dendrochronologia 2017, 42, 94–103. [Google Scholar] [CrossRef]
- Guilley, E.; Mothe, F.; Nepveu, G. A procedure based on conditional probabilities to estimate proportions and densities of tissues from X-ray images of Quercus petraea samples. IAWA J. 2002, 23, 235–252. [Google Scholar] [CrossRef]
- Roque, R.M.; Tomazelo-Filho, M. Relationships between anatomical features and intra-ring wood density profiles in Gmelina arborea applying X-ray densitometry. Cerne 2007, 13, 384–392. [Google Scholar]
- Fichtler, E.; Worbes, M. Wood anatomical variables in tropical trees and their relation to site conditions and individual tree morphology. IAWA J. 2012, 33, 119–140. [Google Scholar] [CrossRef]
- Leclercq, A. Influence of beechwood anatomical features upon its physico-mechanical properties. Mitt. Bundesforsch. Forst-Holzw. Hamburg Reinbek 1980, 131, 33–47. [Google Scholar]
- Benedet, F.; Doucet, J.; Fayolle, A.; Gourlet-Fleury, S.; Vincke, D. Cofortraits, African Plant Traits Information Database. Version 1.0. Available online: http://coforchange.cirad.fr/african_plant_trait (accessed on 12 October 2018).
- Dierick, M.; Van Loo, D.; Masschaele, B.; Van den Bulcke, J.; Van Acker, J.; Cnudde, V.; Van Hoorebeke, L. Recent micro-CT scanner developments at UGCT. Nucl. Instrum. Methods Phys. Res. Sect. B Beam Interact. Mater. Atoms 2014, 324, 35–40. [Google Scholar] [CrossRef] [Green Version]
- Dierick, M.; Masschaele, B.; Van Hoorebeke, L. Octopus, a fast and user-friendly tomographic reconstruction package developed in LabView®. Meas. Sci. Technol. 2004, 15, 1366–1370. [Google Scholar] [CrossRef]
- Vlassenbroeck, J.; Dierick, M.; Masschaele, B.; Cnudde, V.; Van Hoorebeke, L.; Jacobs, P. Software tools for quantification of X-ray microtomography at the UGCT. Nucl. Instrum. Methods Phys. Res. Sect. A Accel. Spectrom. Detect. Assoc. Equip. 2007, 580, 442–445. [Google Scholar] [CrossRef]
- De Ridder, M.; Van den Bulcke, J.; Vansteenkiste, D.; Van Loo, D.; Dierick, M.; Masschaele, B.; De Witte, Y.; Mannes, D.; Lehmann, E.; Beeckman, H.; et al. High-resolution proxies for wood density variations in Terminalia superba. Ann. Bot. 2011, 107, 293–302. [Google Scholar] [CrossRef]
- Arganda-Carreras, I.; Kaynig, V.; Rueden, C.; Eliceiri, K.W.; Schindelin, J.; Cardona, A.; Seung, H.S. Trainable Weka Segmentation: A machine learning tool for microscopy pixel classification. Bioinformatics 2017, 33, 2424–2426. [Google Scholar] [CrossRef]
- Schneider, C.A.; Rasband, W.S.; Eliceiri, K.W. NIH Image to ImageJ: 25 years of image analysis. Nat. Methods 2012, 9, 671–675. [Google Scholar] [CrossRef] [PubMed] [Green Version]
- Kennel, P.; Subsol, G.; Guéroult, M.; Borianne, P. Automatic identification of cell files in light microscopic images of conifer wood. In Proceedings of the 2010 2nd International Conference on Image Processing Theory, Tools and Applications, Paris, France, 7–10 July 2010; pp. 98–103. [Google Scholar] [CrossRef]
- Wu, K.; Otoo, E.; Shoshani, A. Optimizing connected component labeling algorithms. In Proceedings of the Medical Imaging 2005: Image Processing, San Diego, CA, USA, 12–17 February 2005. [Google Scholar] [CrossRef]
- Fiorio, C.; Gustedt, J. Two linear time Union-Find strategies for image processing. Theor. Comput. Sci. 1996, 154, 165–181. [Google Scholar] [CrossRef]
- Van Der Walt, S.; Schönberger, J.L.; Nunez-Iglesias, J.; Boulogne, F.; Warner, J.D.; Yager, N.; Gouillart, E.; Yu, T. Scikit-image: Image processing in Python. PeerJ 2014, 2, e453. [Google Scholar] [CrossRef] [PubMed]
- Pedregosa, F.; Varoquaux, G.; Gramfort, A.; Michel, V.; Thirion, B.; Grisel, O.; Blondel, M.; Müller, A.; Nothman, J.; Louppe, G.; et al. Scikit-learn: Machine Learning in Python. J. Mach. Learn. Res. 2012, 12, 2825–2830. [Google Scholar]
- Ziemińska, K.; Butler, D.W.; Gleason, S.M.; Wright, I.J.; Westoby, M. Fibre wall and lumen fractions drive wood density variation across 24 Australian angiosperms. AoB Plants 2013, 5. [Google Scholar] [CrossRef] [Green Version]
- Dadzie, P.K.; Amoah, M.; Frimpong-Mensah, K.; Shi, S.Q. Comparison of density and selected microscopic characteristics of stem and branch wood of two commercial trees in Ghana. Wood Sci. Technol. 2016, 50, 91–104. [Google Scholar] [CrossRef]
- Worbes, M. One hundred years of tree-ring research in the tropics-a brief history and an outlook to future challenges. Dendrochronologia 2002, 20, 217–231. [Google Scholar] [CrossRef]
- Worbes, M. How to Measure Growth Dynamics in Tropical Trees. IAWA J. 1995, 16, 337–351. [Google Scholar] [CrossRef]
- Worbes, M. Structural and other adaptations to long-term flooding by trees in Central Amazonia. Amazoniana 1985, 9, 459–484. [Google Scholar]
- Coster, C. Zur anatomie und physiologie der zuwachszonen-und jahresringbildung in den tropen. Ann. Jard. Bot. Buitenzorg 1927, 37, 49–161. [Google Scholar]
- Tarelkin, Y.; Delvaux, C.; De Ridder, M.; El Berkani, T.; De Cannière, C.; Beeckman, H. Growth-ring distinctness and boundary anatomy variability in tropical trees. IAWA J. 2016, 37, S1–S7. [Google Scholar] [CrossRef]
- Spicer, R. Symplasmic networks in secondary vascular tissues: Parenchyma distribution and activity supporting long-distance transport. J. Exp. Bot. 2014, 65, 1829–1848. [Google Scholar] [CrossRef] [PubMed]
- Morris, H.; Plavcová, L.; Cvecko, P.; Fichtler, E.; Gillingham, M.A.F.; Martínez-Cabrera, H.I.; Mcglinn, D.J.; Wheeler, E.; Zheng, J.; Ziemiska, K.; et al. A global analysis of parenchyma tissue fractions in secondary xylem of seed plants. New Phytol. 2016, 209, 1553–1565. [Google Scholar] [CrossRef] [PubMed]
- Zheng, J.; Martínez-Cabrera, H.I. Wood anatomical correlates with theoretical conductivity and wood density across China: Evolutionary evidence of the functional differentiation of axial and radial parenchyma. Ann. Bot. 2013, 112, 927–935. [Google Scholar] [CrossRef] [PubMed]
- Beeckman, H. Wood anatomy and trait-based ecology. IAWA J. 2016, 37, 127–151. [Google Scholar] [CrossRef]


| Test Species | Tw Label | Family | DBH (cm) | Site | Life Strategy | Phenology |
|---|---|---|---|---|---|---|
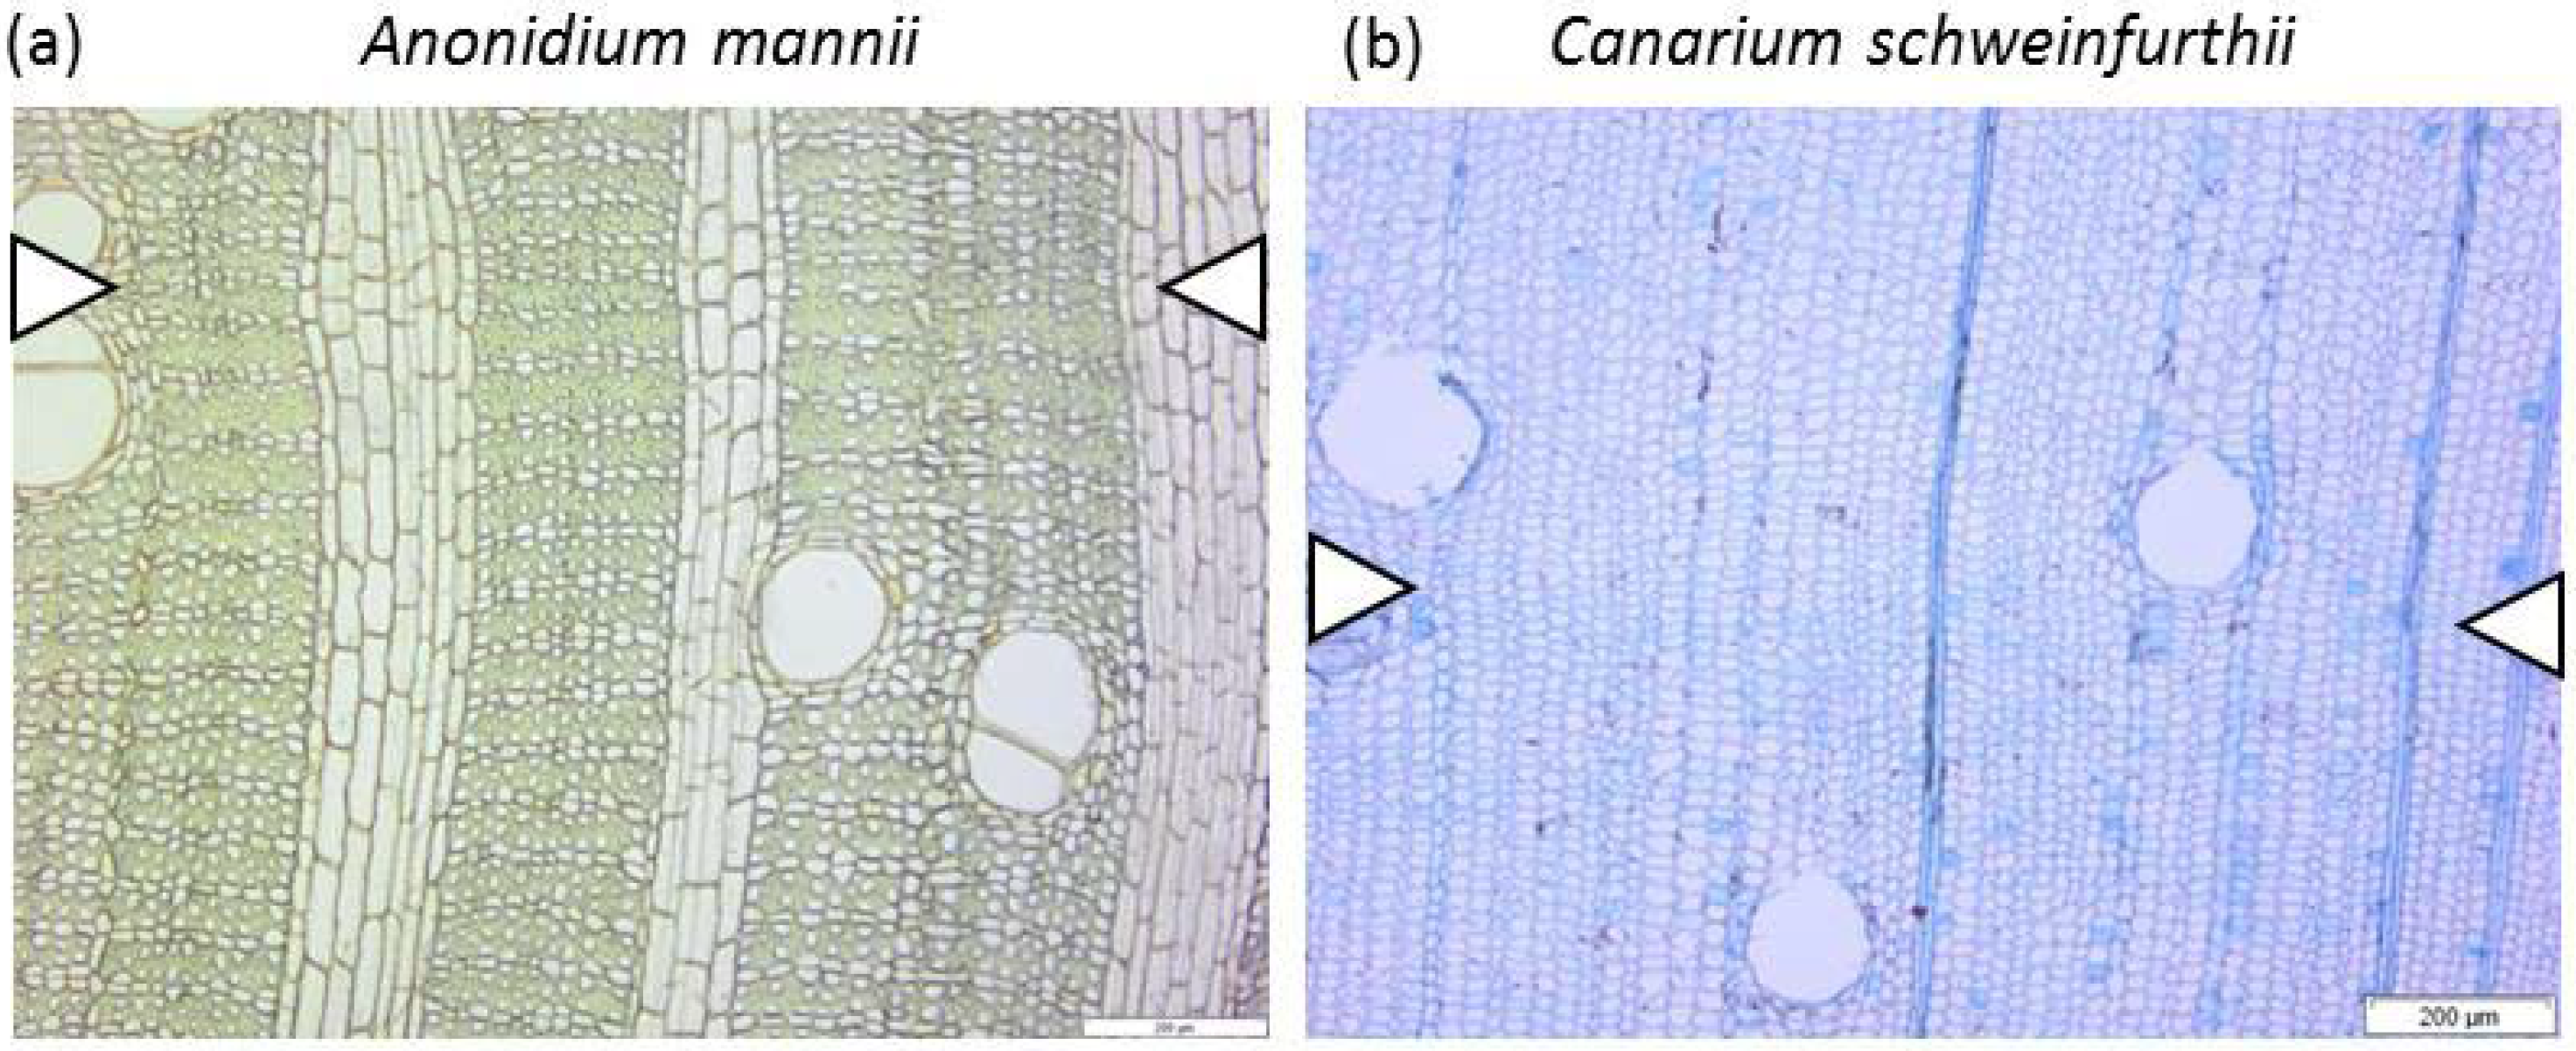
| Anonidium mannii (Oliv.) Engl. & Diels | Tw64366 | Annonaceae | 26.7 | Malebo | Shade bearer | Evergreen |
| Canarium schweinfurthii Engl. | Tw78659 | Burseraceae | 31.7 | Luki | Light demanding | Deciduous |
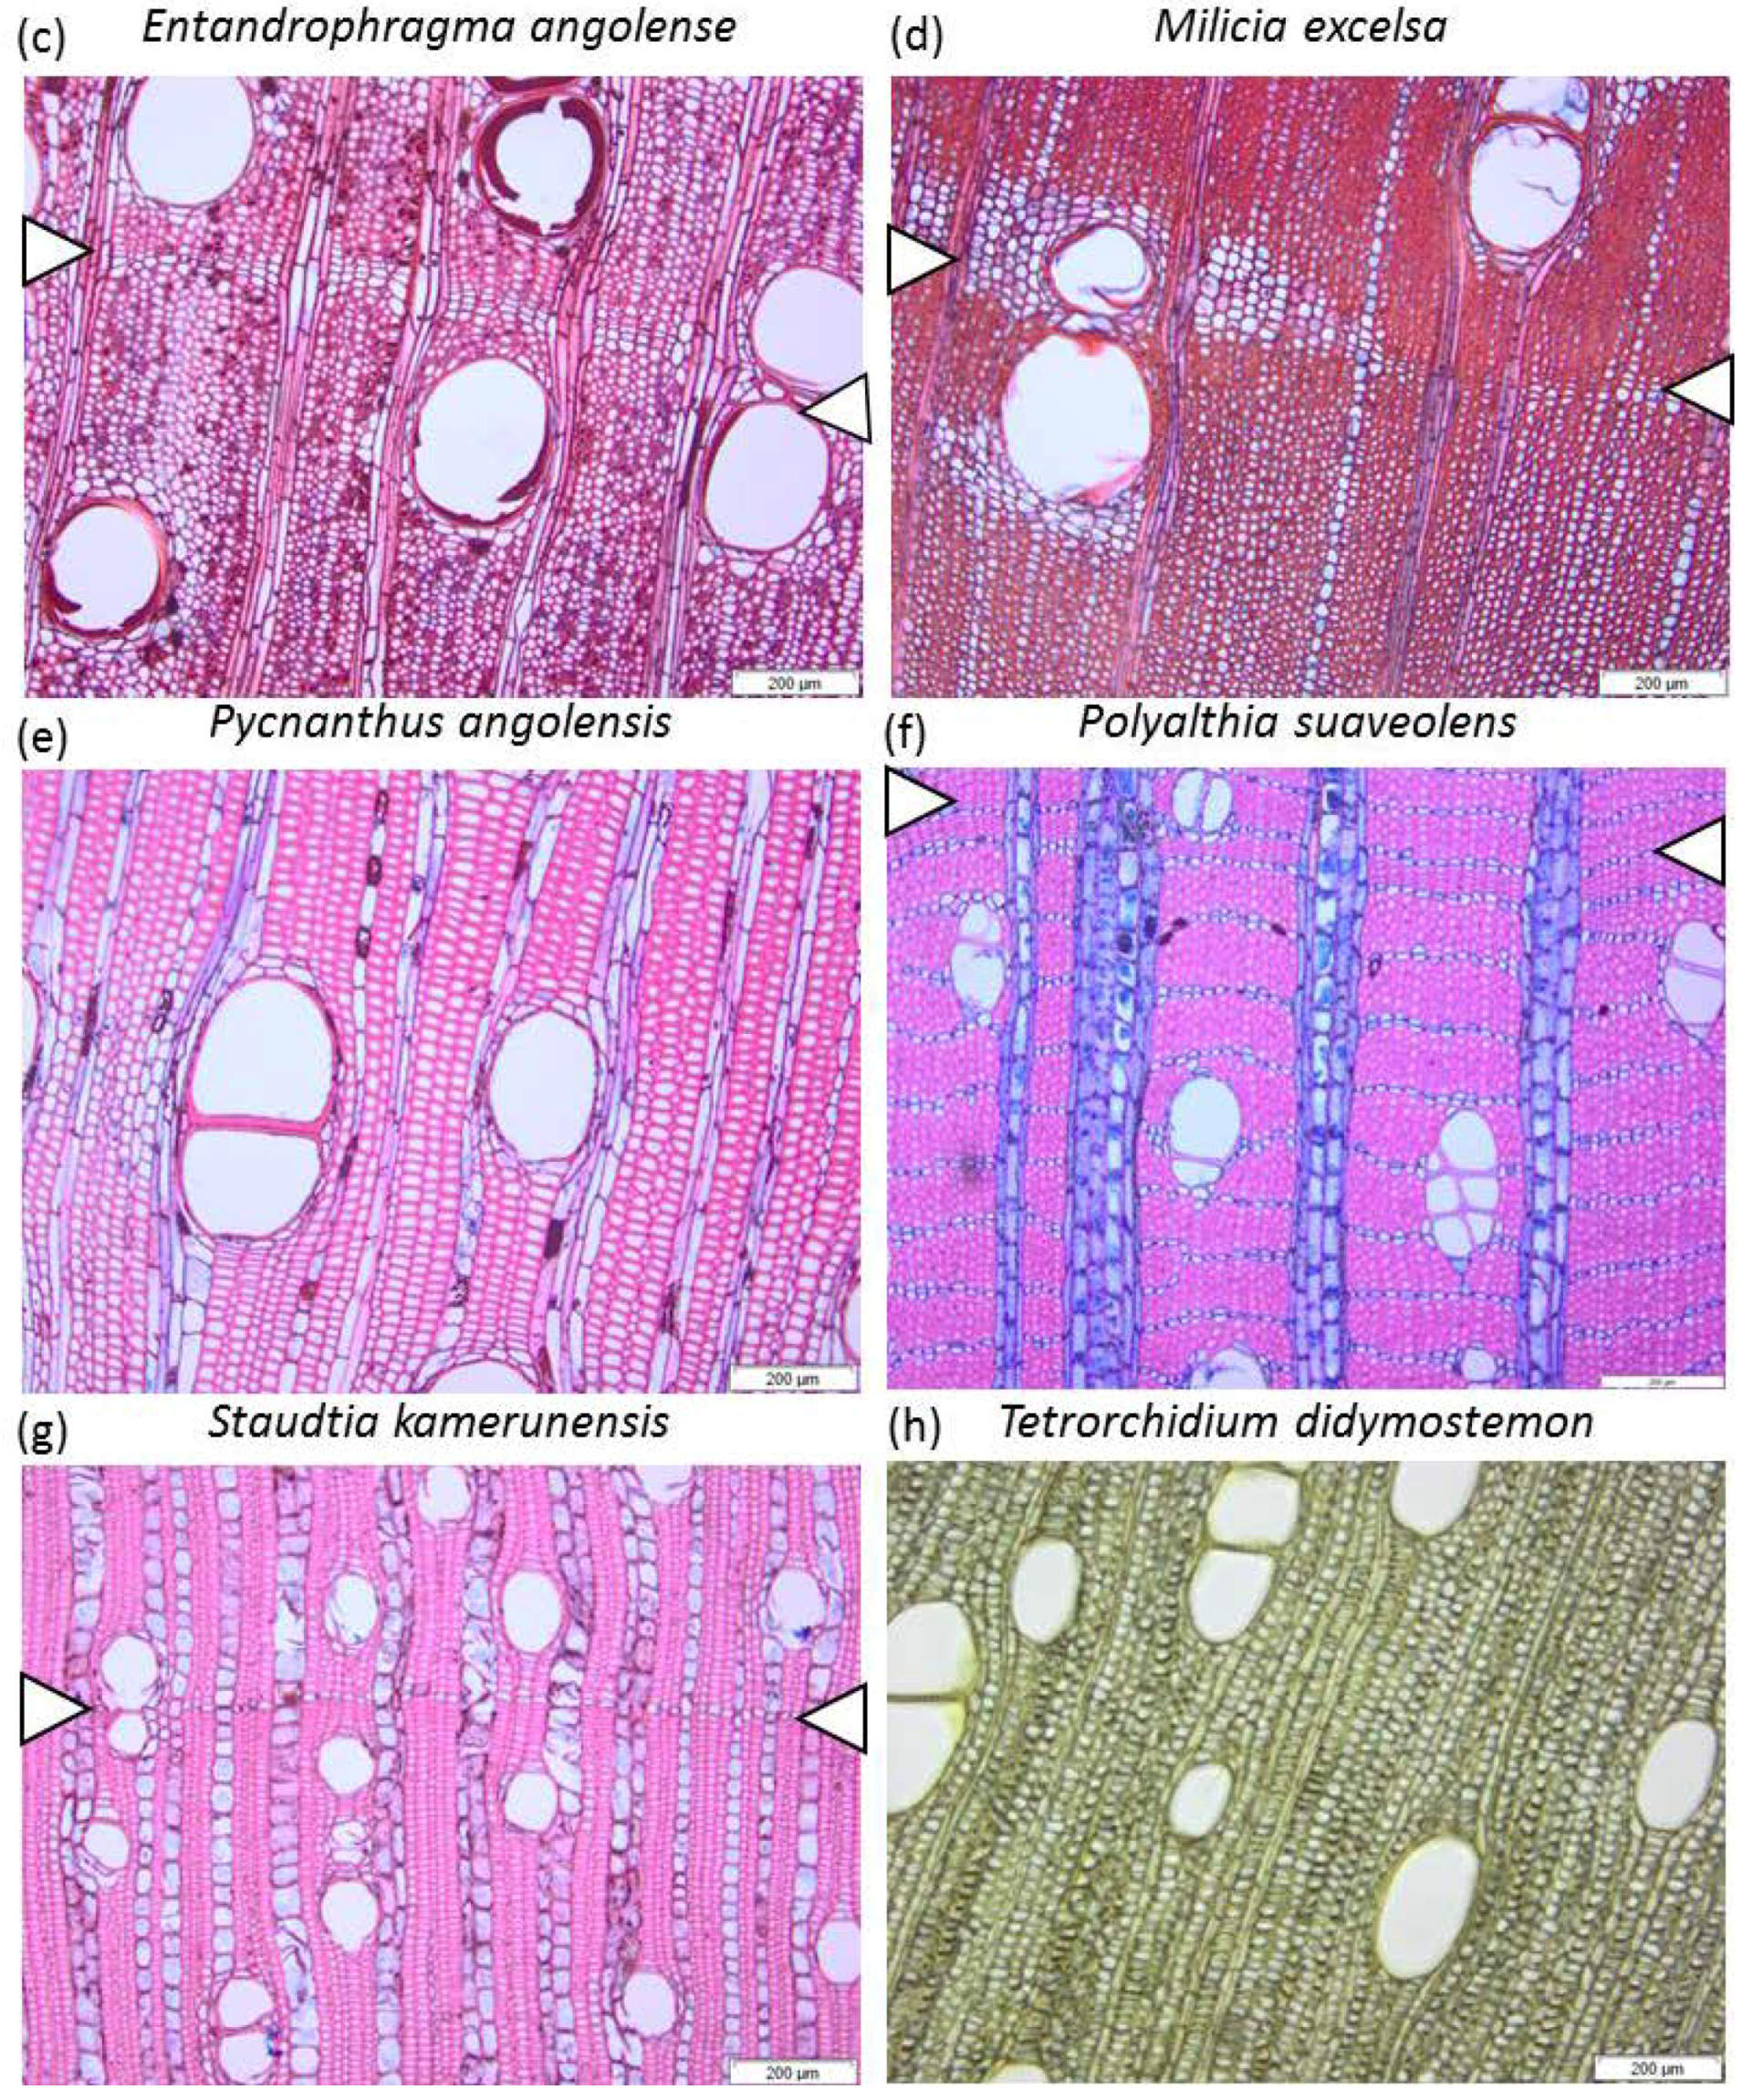
| Entandrophragma angolense (Welw.) C.DC. | Tw78727 | Meliaceae | 37.2 | Malebo | Light demanding | Deciduous |
| Milicia excelsa (Welw.) C.C. Berg | Tw78904 | Moraceae | 32 | Luki | Light demanding | Deciduous |
| Pycnanthus angolensis (Welw.) Warb. | Tw78728 | Myristicaceae | 44 | Malebo | Light demanding | Evergreen |
| Polyalthia suaveolens Engl. & Diels | Tw68771 | Annonaceae | 27.5 | Yoko | Shade bearer | Evergreen |
| Staudtia kamerunensis Warb. | Tw68713 | Myristicaceae | 23.8 | Luki | Shade bearer | Evergreen |
| Tetrorchidium didymostemon (Baill.) Pax & K.Hoffm. | Tw78828 | Myristicaceae | 33.4 | Luki | Light demanding | Evergreen |
| Species | WD (kg·m−3) | PRM (-) | VL (-) | F (-) | FW (-) |
|---|---|---|---|---|---|
| A. mannii | 513.15 (48.77) | 0.34 (0.07) | 0.04 (0.03) | 0.62 (0.09) | 0.23 (0.06) |
| C. schweinfurthii | 500.91 (60.75) | 0.13 (0.03) | 0.09 (0.04) | 0.78 (0.04) | 0.22 (0.04) |
| E. angolense | 651.89 (47.61) | 0.23 (0.07) | 0.08 (0.04) | 0.69 (0.08) | 0.35 (0.06) |
| M. excelsa | 571.17 (57.71) | 0.28 (0.14) | 0.06 (0.04) | 0.66 (0.16) | 0.25 (0.06) |
| P. angolensis | 570.79 (36.30) | 0.23 (0.03) | 0.07 (0.04) | 0.7 (0.04) | 0.33 (0.03) |
| P. suaveolens | 794.36 (25.82) | 0.42 (0.03) | 0.12 (0.04) | 0.46 (0.04) | 0.49 (0.06) |
| S. kamerunensis | 768.67 (26.51) | 0.31 (0.03) | 0.05 (0.02) | 0.64 (0.03) | 0.35 (0.05) |
| T. didymostemon | 510.30 (30.72) | 0.19 (0.08) | 0.13 (0.05) | 0.67 (0.09) | 0.25 (0.05) |
| Fixed effects | |
|---|---|
| Intercept | 490.92 |
| Parenchyma fraction | −24.39 |
| Vessel lumina fraction | −94.22 |
| Fibre wall fraction | 453.67 |
| % of variance | 65% |
| Random effects | Contribution to total variance (%) |
| Species | 4 |
| Species|parenchyma | 4 |
| Species|vessels | 6 |
| Species|fibre walls | 13 |
| Residuals | 8 |
© 2018 by the authors. Licensee MDPI, Basel, Switzerland. This article is an open access article distributed under the terms and conditions of the Creative Commons Attribution (CC BY) license (http://creativecommons.org/licenses/by/4.0/).
Share and Cite
De Mil, T.; Tarelkin, Y.; Hahn, S.; Hubau, W.; Deklerck, V.; Debeir, O.; Van Acker, J.; De Cannière, C.; Beeckman, H.; Van den Bulcke, J. Wood Density Profiles and Their Corresponding Tissue Fractions in Tropical Angiosperm Trees. Forests 2018, 9, 763. https://0-doi-org.brum.beds.ac.uk/10.3390/f9120763
De Mil T, Tarelkin Y, Hahn S, Hubau W, Deklerck V, Debeir O, Van Acker J, De Cannière C, Beeckman H, Van den Bulcke J. Wood Density Profiles and Their Corresponding Tissue Fractions in Tropical Angiosperm Trees. Forests. 2018; 9(12):763. https://0-doi-org.brum.beds.ac.uk/10.3390/f9120763
Chicago/Turabian StyleDe Mil, Tom, Yegor Tarelkin, Stephan Hahn, Wannes Hubau, Victor Deklerck, Olivier Debeir, Joris Van Acker, Charles De Cannière, Hans Beeckman, and Jan Van den Bulcke. 2018. "Wood Density Profiles and Their Corresponding Tissue Fractions in Tropical Angiosperm Trees" Forests 9, no. 12: 763. https://0-doi-org.brum.beds.ac.uk/10.3390/f9120763