Surface Changes of Selected Hardwoods Due to Weather Conditions


1
Faculty of Wood Sciences and Technology, Technical University in Zvolen, T.G. Masaryka 24, 960 53 Zvolen, Slovakia
2
Faculty of Forestry and Wood Sciences, Czech University of Life Sciences in Prague, Kamýcká 129, 16521 Praha 6-Suchdol, Czech Republic
*
Author to whom correspondence should be addressed.
Forests 2018, 9(9), 557; https://0-doi-org.brum.beds.ac.uk/10.3390/f9090557
Submission received: 14 August 2018
/
Revised: 6 September 2018
/
Accepted: 7 September 2018
/
Published: 11 September 2018
(This article belongs to the Special Issue Wood Properties and Processing)
Abstract
:The study is focused on the surface changes of five hardwoods (oak, black locust, poplar, alder and maple) that were exposed to natural weathering for 24 months in the climatic conditions of Central Europe. Colour, roughness, visual and chemical changes of exposed surface structures were examined. The lowest total colour changes (ΔE*) were found for oak (23.77), the highest being recorded for maple (34.19). Roughness differences after 24-month exposure (ΔRa) showed minimal changes in poplar wood (9.41); the highest changes in roughness were found on the surface of alder (22.18). The presence of mould and blue stains was found on the surface of maple, alder and poplar. Chemical changes were characterized by lignin and hemicelluloses degradation. Decreases of both methoxy and carbonyl groups, cleavage of bonds in lignin and hemicelluloses, oxidation reaction and formation of new chromophores were observed. In the initial phases of the degradation process, the discoloration was related to chemical changes; in the longer period, the greying due to settling of dust particles and action of mould influenced the wood colour. The data were confirmed by confocal laser scanning microscopy. The obtained results revealed degradation processes of tested hardwood surfaces exposed to external environmental factors.
1. Introduction
One of the major contributions to securing sustainable development is the use of renewable natural materials, which undoubtedly include wood. In an effort to reduce the ecological burden, the surface of wooden structures is often left untreated. In addition to the traditional interior design elements, the use of non-treated wood is expanding even further into the exterior. Contemporary trends even prefer untreated wood that turns grey after exposure to weather under aboveground conditions over non-durable wood with applied surface coatings [1], since wood with higher natural durability [2] allows outdoor utilization without any deterioration risk [3]. However, wood is susceptible to environmental degradation similar to other natural materials [4]—it changes surface properties due to weather and can even be attacked by biotic agents if the basic design principles are not respected. Weathering is defined as the slow decomposition of materials subjected to weather factors [5], causing mostly unwanted and premature product failures [6]. The main weathering factors are solar radiation and water (moisture) acting synergistically with temperature, wind, airborne pollutants, biological agents, and acid rain, etc. [6,7,8].
The main organic components in wood, lignin, hemicelluloses and cellulose, react to weathering. Lignin is the wood component most susceptible to photodegradation caused mainly by ultraviolet (UV) light [9,10,11]. This aromatic biopolymer strongly absorbs UV radiation [12]. The initial decrease in lignin content is accompanied by generation of carbonyl groups, whereas degradation of cellulose is indicated by a loss of weight and reduction in the degree of polymerization. Extractives, such as terpenes, terpenoids, phenols, lignans, tannins, flavonoids, etc. [10,13], responsible for wood colour, odour and natural durability against biodegradation [4], are also affected by weathering. Photodegraded products are leached out of the wood surface by water [1]. The changes caused by weathering develop rapidly and cannot be fully avoided, as presented in previous work focused on weathering of untreated wood [14,15]. The rate of degradation is usually related to wood species [12], intensity of light and light wavelengths [16], period of irradiation [12,17,18] and climatic factors occurring during exposure [19].
Weathering affects only the surface layers of wood [20]. Atmospheric degradation is then manifested by the change of colour reflecting the chemical changes [21,22], followed by the formation of cracks and increased roughness of the samples [23,24]. Untreated wood specimens exhibit higher colour changes in a shorter time than treated specimens [25]. Some wood species turn yellow or brown; eventually, they turn grey due to growth of fungi and moulds [26] and by the dust particles in air which penetrate the porous structure of wood [19]. These changes occur to a depth of only 0.05–2.5 mm [11,23]. The depth has a relatively high correlation with the total colour difference value [15]. The next parameter used to analyse the weathering effects is surface roughness. During natural weathering, increasing roughness has been reported [15,27,28,29]. The increase is caused by unequal erosion of the surface in the late wood and early wood with thin walled cells and lower density [30]. As the result, the early wood is degraded faster [31], mainly in the case of softwoods with lower density [15]. The wood also reacts to moisture and water from ambient atmosphere [32]. Its surface wettability significantly increases during weathering [27]. Some species reached full wettability after 1 year of exposure [33]. Chemical changes in wood during weathering are often investigated by Fourier Transform Infrared Spectroscopy (FTIR) analysis [10,14,34,35]. According to Pandey [35], the total colour difference was related to the lignin degradation and increase of carbonyl groups. Hardwoods underwent a faster degradation than softwoods because the syringyl structure in hardwoods degraded faster than guaiacyl structures in softwoods. Liu et al. [36] and Reinprecht et al. [37] studied surface changes of 10 tropical woods during weathering. According to the results, colour changes might be caused by leaching of extractives, oxidation and degradation of lignin; however, the degree of change was different for every wood species. In the study of Gupta et al. [14], FTIR was used for prediction of wooden cladding service life. There are efforts to minimize the use of harmful chemicals [38]; therefore, it is important to understand the degradation processes in untreated wood during weathering. The service life determination of wooden components is a crucial research constraint that needs a thorough investigation of material properties before the prediction is done [14,39].
The objective of this paper is to characterize hardwood’ overall performance under specific exterior conditions of Central Europe (surface, visual and chemical parameters) using different scientific methods, considering the increasing application of untreated wood outdoors. The results can lead to deepening knowledge in this area, to comparison of naturally durable and less durable species and to proper and more frequent use of untreated hardwoods in applications directly exposed to weathering. During weathering, we assume that gradual lignin decomposition and changes in the hemicellulose complex are manifested by pronounced colour changes and increased surface roughness of the wood surface. These findings are supported by microscopic analysis. This study follows and expands the findings of the previously published study of Oberhofnerová et al. [15], which presents the results of colour and roughness changes after one year of natural weathering.
2. Materials and Methods
2.1. Material Preparation
The experiment was conducted using three samples for each weathering period, all of them with dimensions 375 × 78 × 20 mm (Longitudinal × Tangential × Radial), from five hardwood species (black locust, oak, maple, alder and poplar wood). A total of 75 samples were used for the experiment. Only the heartwood was tested. Before exposure, the test samples were sanded with sandpaper grit of 120 (P120). The specification of used wood species is given in Table 1.
2.2. Natural Weathering
The natural weathering test was performed at Suchdol, Prague, Czech Republic (50°07′49.68″ N, 14°22′13.87″ E, 285 m altitude) and lasted 24 months (from 15 December 2014 to 20 December 2016 for four periods—3, 6, 12 and 24 months). The overview of weather conditions is given in Table 2. The samples were exposed outdoors, at 45° inclination angle, facing south and placed approximately 1 m above the ground according to [41]. The specimens were stabilized at 20 ± 2 °C and 65% relative humidity (RH) before the measurements for 7 days. The colour, roughness, FTIR, and confocal microscopy were measured first on the surface before exposure (measurements were repeated after each weathering period).
2.3. Colour Measurement
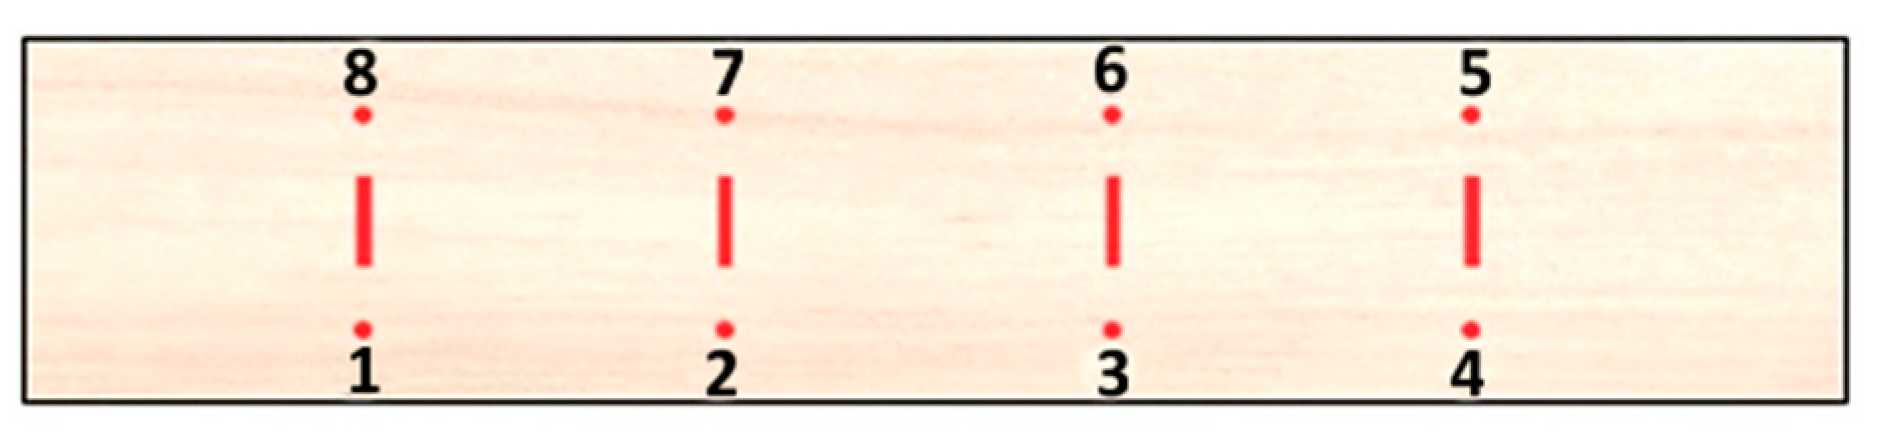
The colour of the wood surface was measured using a spectrophotometer CM-600d (Konica Minolta, Osaka, Japan). A standard illuminant D65, viewing angle of 10° and SCI (Specular Component Included), was used. The colour values were measured at 8 given positions of each sample (Figure 1) and expressed in the Lab system [43]. This colorimetric system comprises three independent axes perpendicular to each other. The L* axis determines the lightness (0-black, 100-white), the a* axis determines the ratio between red (positive) and green (negative) and finally the b* axis represents the ratio between yellow (positive) and blue (negative). Total colour change ΔE* was calculated using the Equation (1) [44]:
where ΔL*, Δa*, Δb* are differences in individual axes (difference between the value measured after and before exposure).
2.4. Roughness Measurement
Surface roughness was assessed with a stylus profilometer Talysurf Form Intra (Taylor-Hobson, Leicester, UK). The measurements were made according to standards [45,46] on the surface of each sample at the same positions, Figure 1. The Ra (arithmetical mean profile deviation) was measured in the perpendicular direction to the fibres. These measurements were considered representative surface-roughness indicators. The tracing length was 15 mm and cut-off lengths were 2.5 mm.
2.5. ATR-FTIR Analysis
FTIR spectra of weathered wood surfaces were recorded on a Nicolet iS10 FT-IR spectrometer (Thermo Fisher Scientific, Waltham, MA, USA), equipped with Smart iTR using an attenuated total reflectance (ATR) sampling accessory attached to a diamond crystal. The spectra were acquired by accumulating 64 scans at a spectral resolution of 4 cm−1 in an absorbance mode from 4000 to 400 cm−1 standardised using the baseline method and analysed using OMNIC 8.0 software (Thermo Fisher Scientific, Waltham, MA, USA). Measurements were performed on four replicates per sample. The spectral range 1800–800 cm−1 was evaluated. Each specimen was measured on the tangential face.
2.6. Confocal Laser Scanning Microscopy
To evaluate the surface degradation of hardwoods, microscopic structural changes of wood surfaces were studied using a confocal laser scanning microscope Lext Ols 4100 (Olympus, Tokyo, Japan) before and after each exposure of samples to natural weathering.
2.7. Statistical Evaluation
The statistical evaluation was done in Statistica 12 software (Statsoft, Palo Alto, CA, USA) and MS Excel 2013 (Microsoft, Redmond, WA, USA) using mean values, standard deviations, analysis of variance (ANOVA), and Tukey´s N HSD multiple comparison test at α = 0.05 significance level.
3. Results
The effect of wood species and period of exposure and their interactions on the measured properties (colour parameters and roughness) after weathering were evaluated as statistically significant (p < 0.05)—see Table 3. For further evaluation, Tukey’s HSD test was used to compare specific differences between wood species.
3.1. Colour Changes
The colour parameters (L*, a*, b*) expressed as colour differences (∆L*, ∆a*, ∆b*) measured on the surface of investigated hardwoods (Table 4, Table 5 and Table 6) and corresponding colour differences (∆E*) are presented (Table 7). Total colour difference ΔE* increased over the duration of external exposure for all the hardwoods [25,28,47]. The highest colour difference after two years of weathering was observed for maple (ΔE* = 34.2) and the lowest for oak wood (ΔE* = 23.8).
3.2. Roughness Changes
The average roughness values (Ra) of unweathered (control) and weathered samples expressed as roughness differences after and before each exposure period (∆Ra) are showed in Table 8.
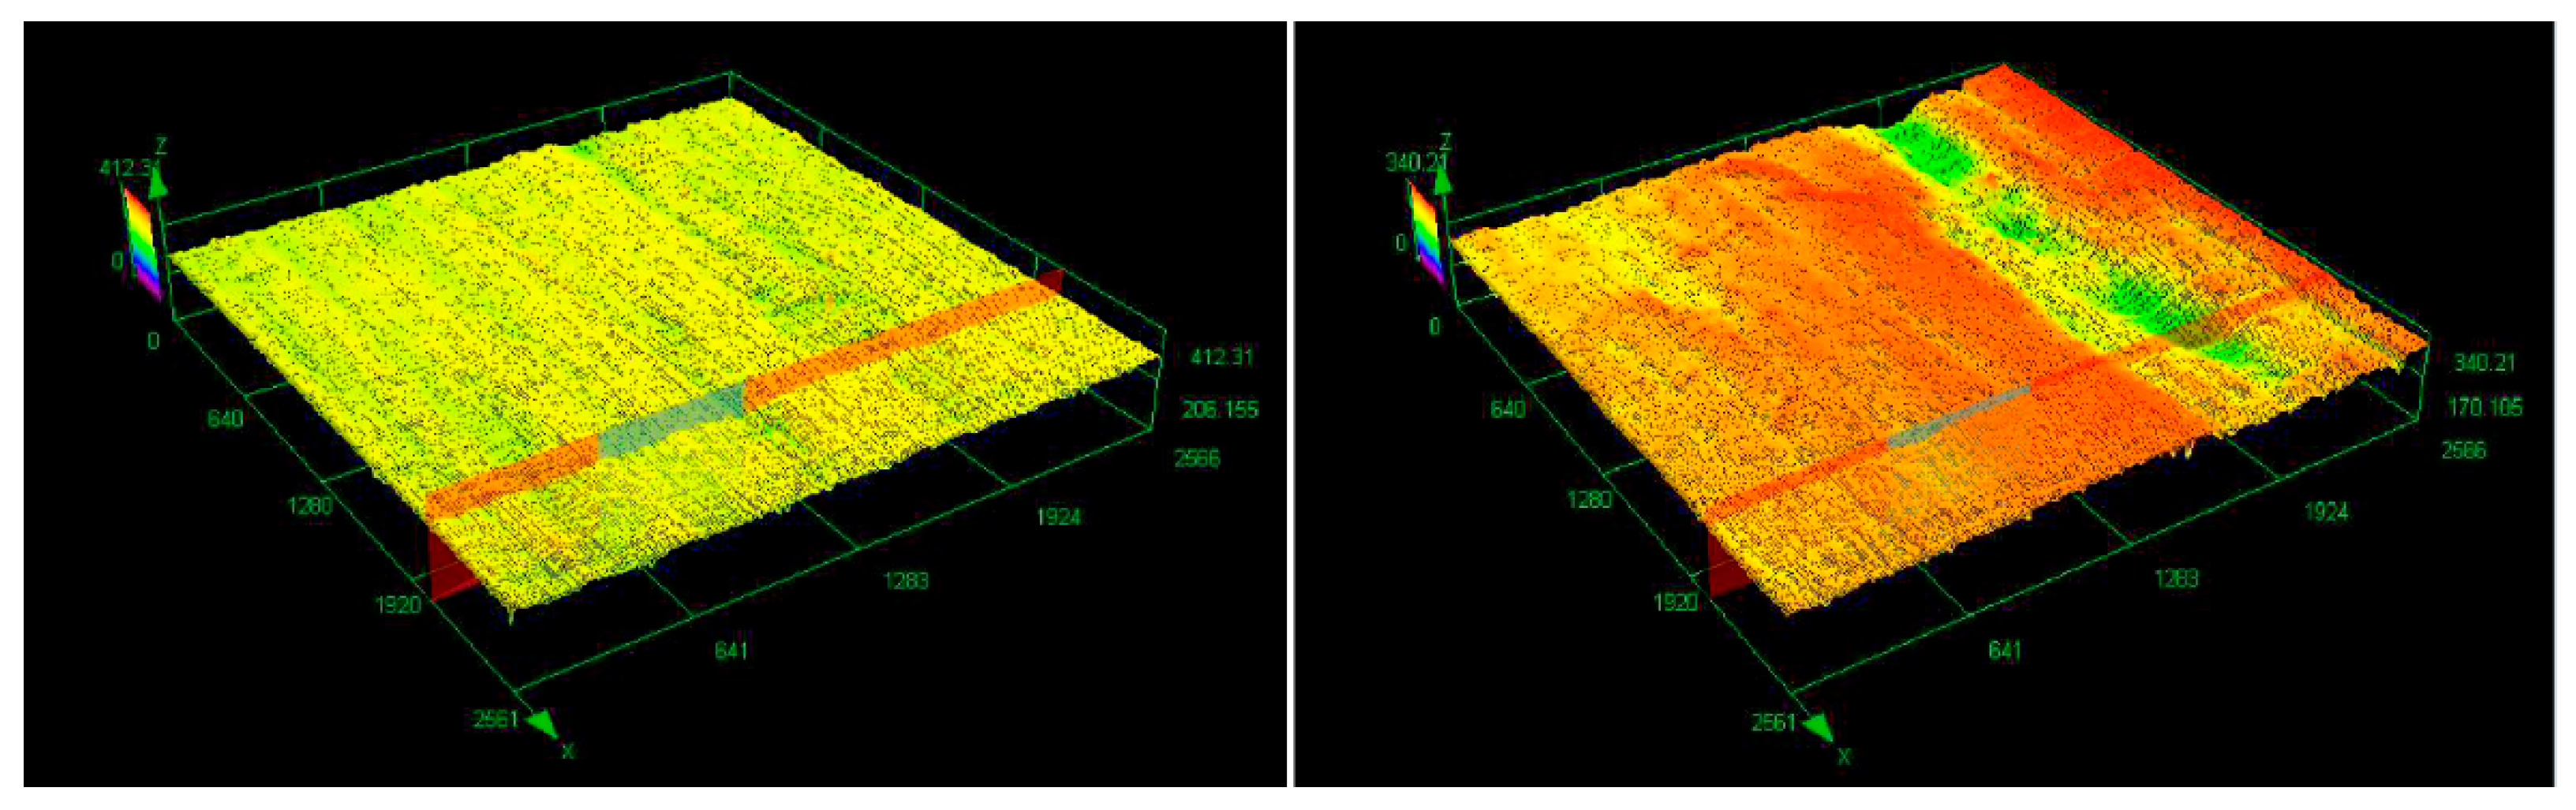
The following figures (Figure 2, Figure 3, Figure 4, Figure 5 and Figure 6) show the 3D microstructure of the surface of all examined wood samples after 2 years of weathering obtained by confocal laser scanning microscopy. The degree of surface erosion, determining the wood roughness change, is represented by a colour range ranging from purple to red.
3.3. Visual Evaluation
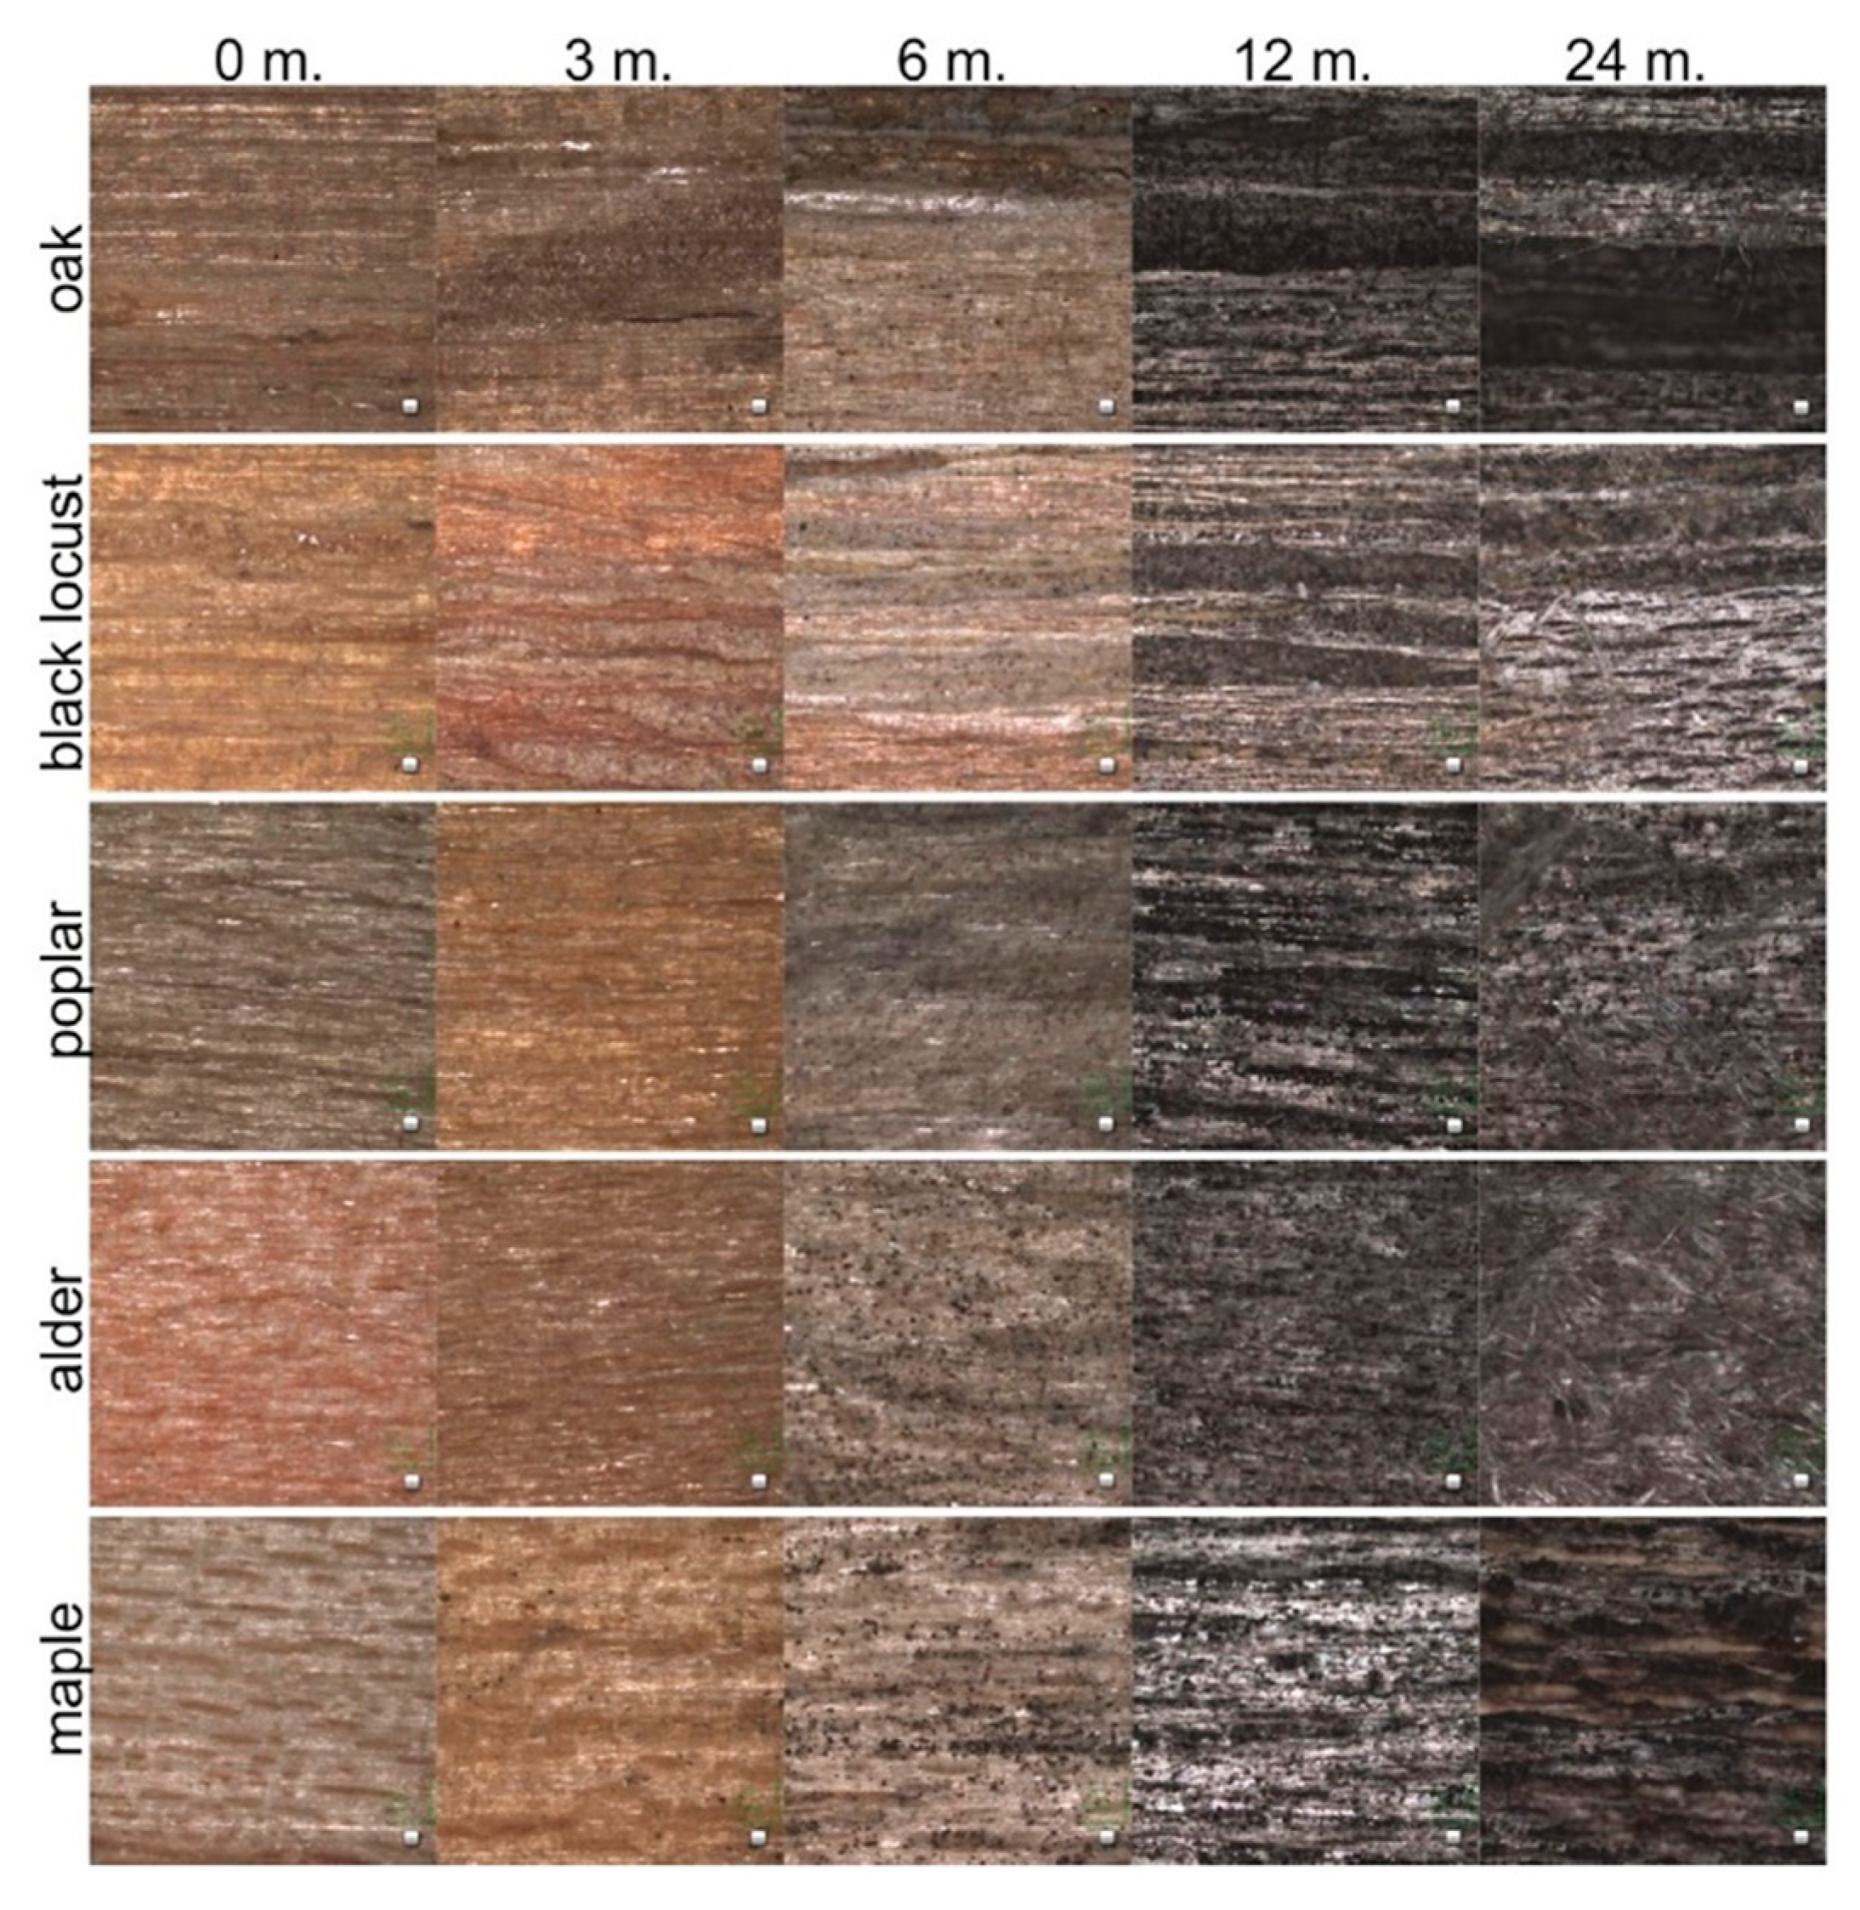
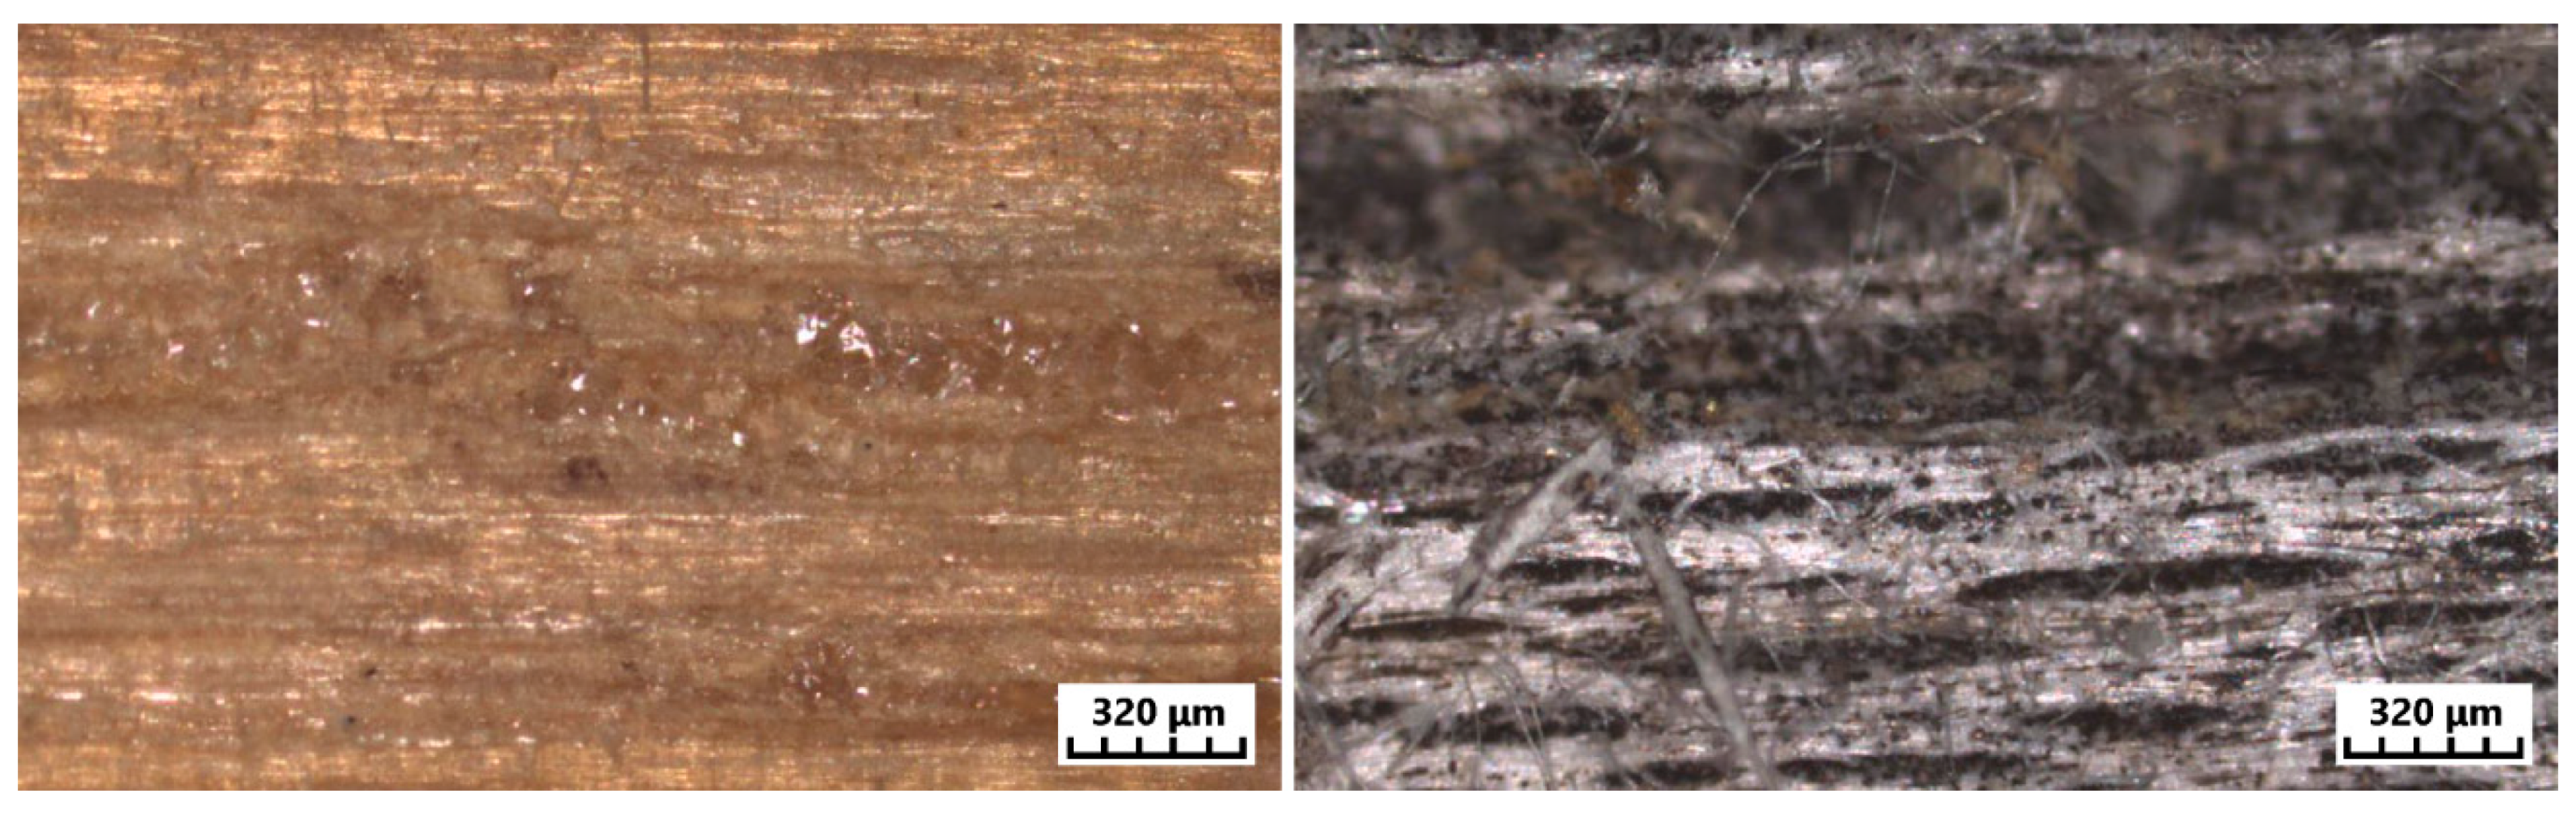
Visual evaluation of samples was performed using confocal laser scanning microscopy of the wood sample surface before and during exposure (Figure 7). The detailed analysis of surface changes during weathering of wood species was performed by confocal laser microscope (Figure 8, Figure 9, Figure 10, Figure 11 and Figure 12).
3.4. Changes in the FTIR Spectra
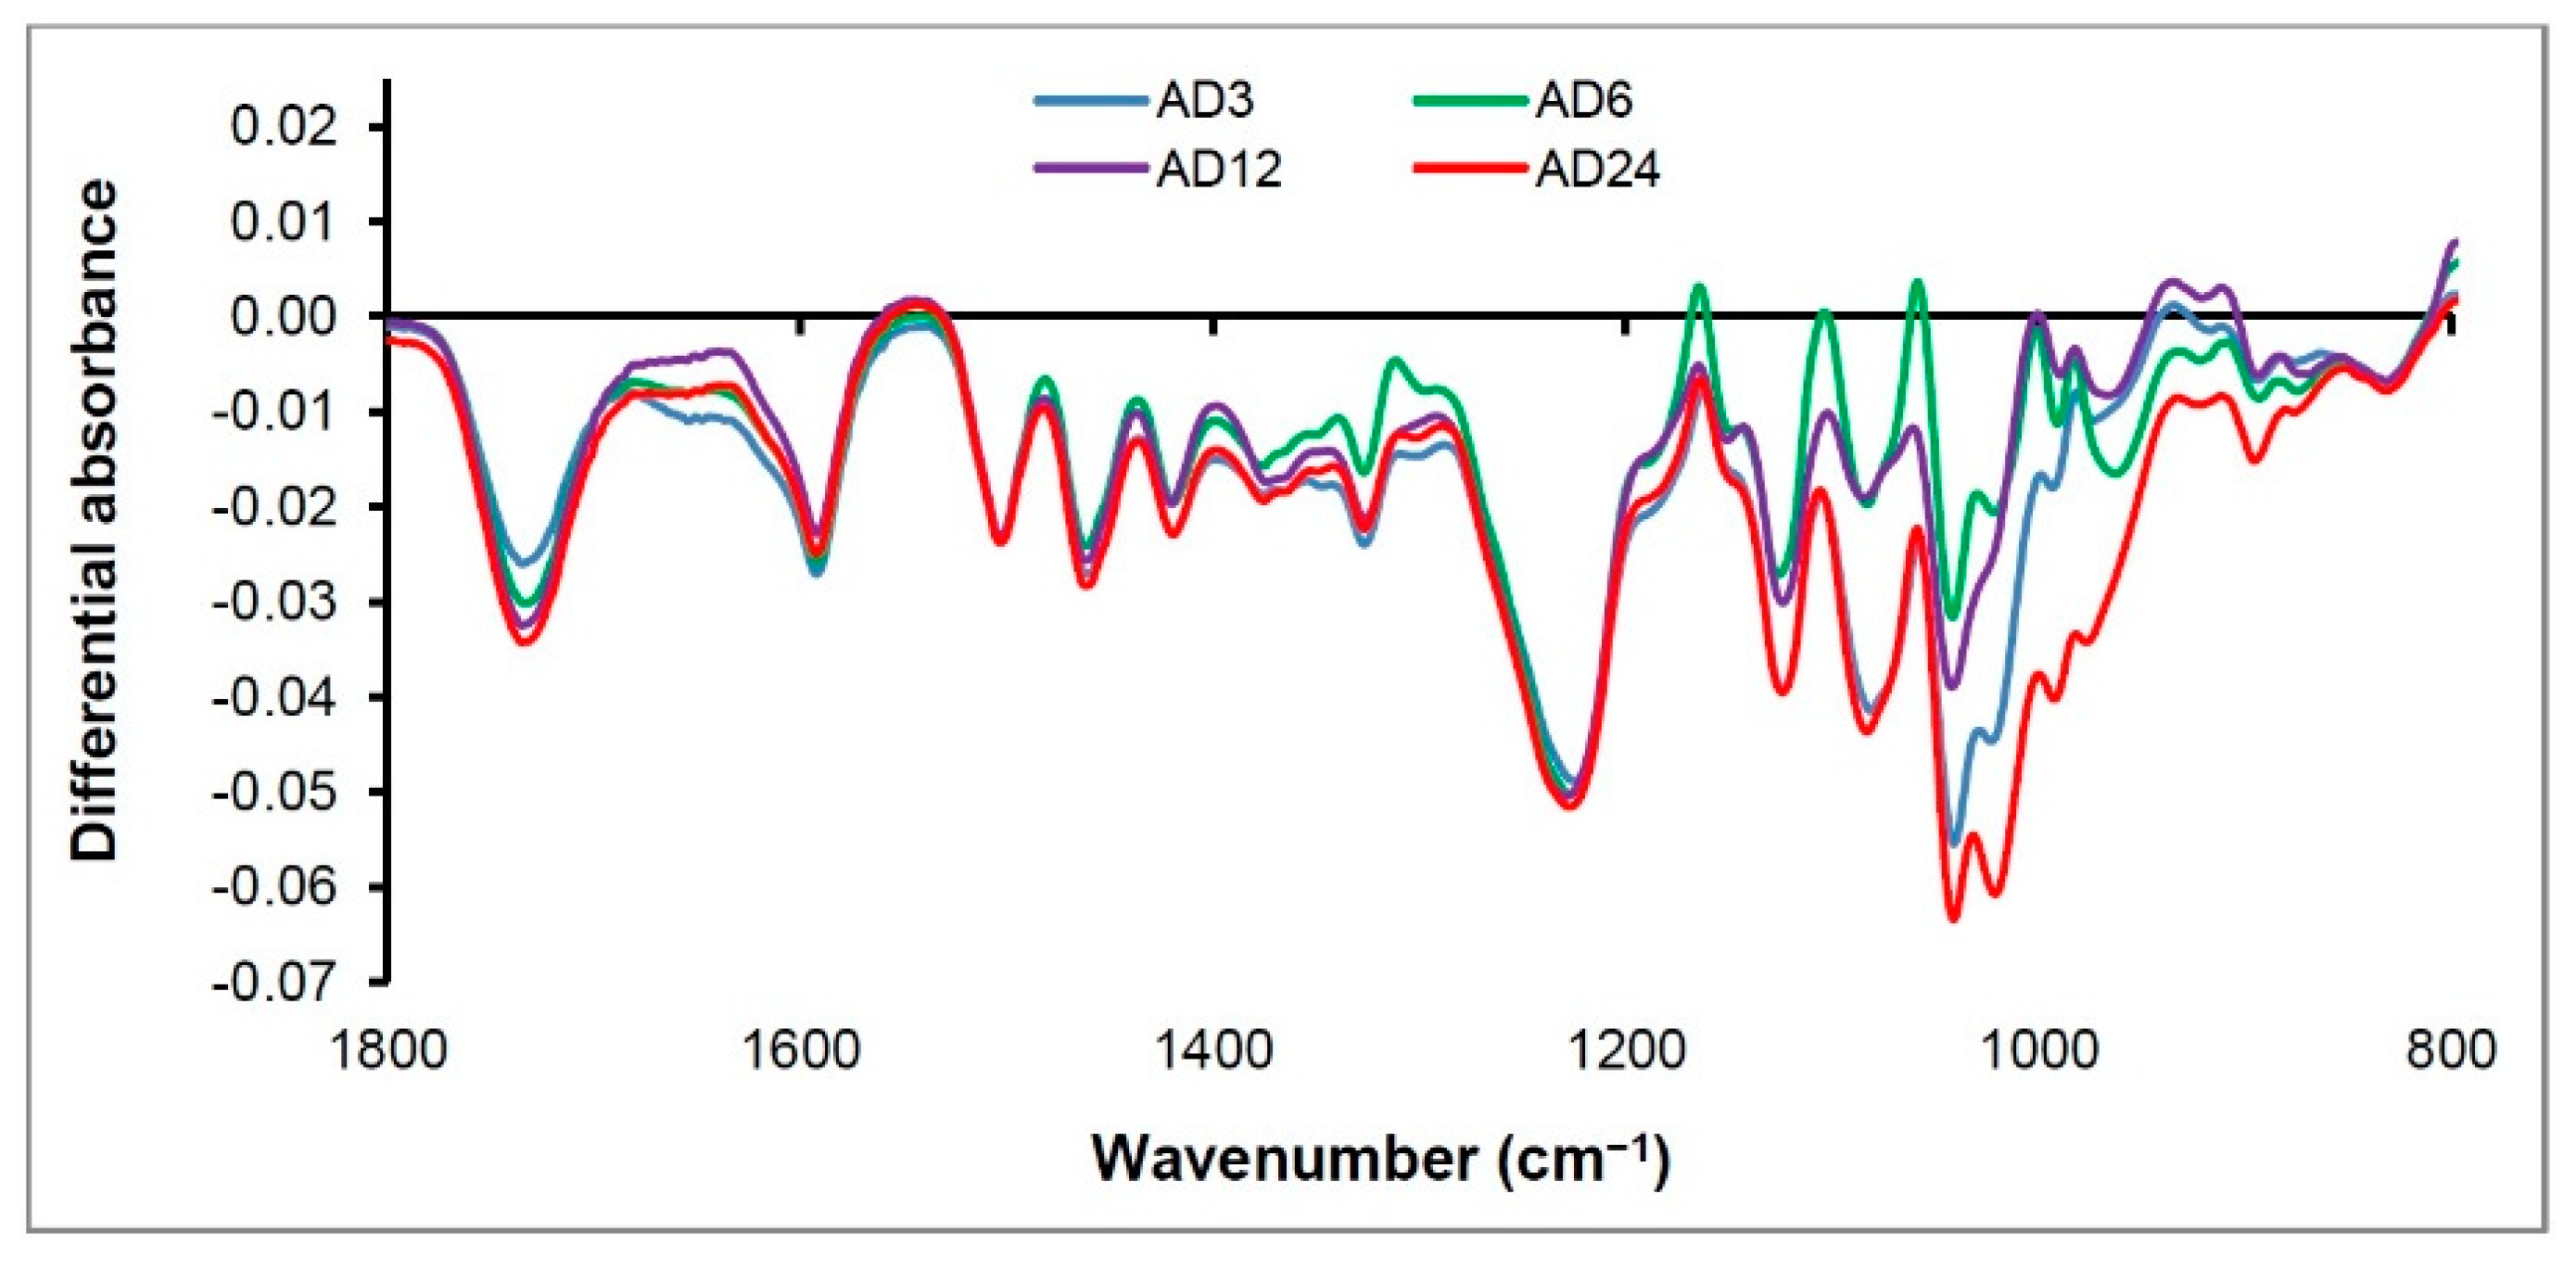
Chemical changes of wood surface components were evaluated by ATR-FTIR analysis. They are expressed as the differential FTIR spectra (difference in absorbance after and before of each exposure period, denoted as AD3 (Absorbances Difference after 3 month of weathering), AD6—after 6 months and so on, Figure 13, Figure 14, Figure 15, Figure 16 and Figure 17). The positive values refer to the increase, negative values to the decrease in the absorbance. The absorbance of bands at 1730 cm−1 (C=O vibration of non-conjugated carbonyl groups in hemicelluloses), 1600 cm−1 and 1505 cm−1 (C=C skeletal vibrations in aromatic structure of lignin), 1460 cm−1 (C−H bending in CH3 group in lignin), 1235 cm−1 (C−O stretching in lignin and xylan) and 1267 cm−1 (C−O stretching in lignin structure) decreased during natural weathering. These results indicate that the structure of the lignin polymer and hemicelluloses was degraded to a significant extent.
4. Discussion
During the weathering process, colour parameter changes showed practically identical trends for all analysed wood samples. A decreased L* (Table 4, negative values of ∆L*) value was observed, similar to Turkoglu et al. [25]. Darkening of the wood surface was more pronounced after twelve months of natural weathering. The value a* gradually decreased (negative trend in ∆a*), mainly after 12 months. The lowest values were found for oak and alder (Table 5). The decrease in the chromaticity coordinate b* (negative trend in ∆b*) was similar (Table 6). A sharp drop in the b* value (increase in b* difference) was observed in the first half of the 24-month cycle, with the remainder of the exposure declining only slightly. The reduction is caused by leaching of decomposed lignin and extractives from the surface [25,48]. At the end of the two-year exposure, values a* and b* stabilized at a level which correspond to the grey colour. Undoubtedly, untreated wood exhibits higher colour changes than treated wood during natural weathering [1,25,27]. The highest changes in colour parameters were observed in initial phases of weathering as in the studies of Lesar et al. [1] and Sharrat et al. [49]. The more pronounced changes were noted during the first 12 months; then, the other changes were negligible due to the formation of the grey degraded layer which acts as a protective barrier and slows the weathering process [50]. The greying caused by the action of weather and dust settling into the porous and degraded surface can be visibly observed after 6 months, especially for less durable wood species such as maple and alder (Figure 7). After 12 months of weathering, the greying was obvious for all the tested hardwoods. The tearing of wood fibers was observed after 24 months of weathering (Figure 8, Figure 9, Figure 10, Figure 11 and Figure 12). The presence of slight fungal growth was observed after a few months of weathering on poplar, alder and maple (Figure 10, Figure 11 and Figure 12) as in the study of Mohebby and Saei [27].
As shown by the measured values, the surface roughness value of native wood samples increased with weathering time (Table 8 and Figure 2, Figure 3, Figure 4, Figure 5 and Figure 6), as presented in other studies [27,28]. However, the surface roughness of some wood samples (black locust, oak and alder) partly decreased with weathering between the 6th and 12th month period. Similar trends have also been observed by Turkoglu et al. [51]. Increasing roughness is caused by lignin decomposition [26]. Another effect can be the absorption of the thermal component of solar radiation. Turkulin et al. [52] reported that this radiation mostly degraded the middle lamella, which is between two cell walls and holds the cells together. This degradation increases the roughness of the wood surface [31]. Kerber et al. [53] also reported that in addition to the leaching of lignin degraded by natural weathering reactions, the increase in the roughness of the wood is also related to sudden changes in humidity (absorption and desorption of the humidity) causing the presence of superficial cracks. Also, rain water helps to remove loosened fibres and particles produced during irradiation and to move leached lignin fragments to the top layer that is mainly composed of cellulose (which causes the grey colour of the wood and a rough texture [12]). Elevated temperature [54], high moisture content [52] and diluted acid [55] can increase the photodegradation rate. Additional factors contributing to weathering are superficial wetting and drying, generating surface stresses that can cause checking [7,56]. The changes in surface structure after 2 years of weathering were apparent in laser scanning microscopy as well (Figure 2, Figure 3, Figure 4, Figure 5 and Figure 6), where tearing of the wood fibres (Figure 8, Figure 9, Figure 10, Figure 11 and Figure 12) and surface erosion, more obvious in less dense earlywood than in latewood [30], caused by abiotic factors, were observed (Figure 8, Figure 9, Figure 10, Figure 11 and Figure 12).
The dominant factor responsible for wood degradation is lignin, which absorbs ultraviolet and visible radiation due to its chromophoric groups. However, the effect of visible light to surface degradation at later stages of weathering was observed [57,58,59]. According to Norrstrom [60], lignin is responsible for absorbing 80% to 95% of the total UV light absorbed by wood, carbohydrates 5 to 20% and extractives about 2%. FTIR spectra of weathered wood (Figure 13, Figure 14, Figure 15, Figure 16 and Figure 17) showed that the absorbance at 1730 cm−1 (C=O vibration of the non-conjugated carbonyl groups, stretching in xylan) decreased at higher exposure times. This is in accordance with findings of natural and artificial weathering of seven tropical woods [37]. The decreasing trend of this band was probably caused by the condensation reactions of lignin as well as by hemicellulose deacetylation [61]. Hemicelluloses are the least resistant to thermal treatment, and carboxylic acids (predominantly acetic acid) are formed by their decomposition. Carboxylic acids cause the depolymerization of cellulose and cleavage of bonds in lignin [62,63].
The band occurring at 1600 cm−1 is characteristic of aromatic compounds and is attributed to aromatic skeleton vibrations. In our case, a sustained decrease in absorbance was recorded. The absorbance at 1505 cm−1 (and C=C skeletal stretching vibrations in aromatic rings in lignin) showed a slight decrease. The samples did not show remarkable changes in this regard. A similar effect in the intensity was also observed after UV treatment of wood [8,64]. Decreased absorption at that band is interpreted as lignin decay combined with the formation of new carbonyl groups, evidencing photo-induced oxidation of the wood surface. During the weathering test, the decrease of the band at 1462 cm−1 (C−H asymmetric bending in CH3 group in lignin) revealed the loss of lignin [65]. The peaks at 1235 cm−1 (C−O stretching in lignin and xylan) and 1267 cm−1 (C−O stretching and breathing of guaiacyl ring) are assigned to lignin [66,67]. Described phenomena may indicate changes in lignin structures leading to a decrease of methoxy groups in lignin.
The degradation mechanism is complex with different paths leading to water soluble products and finally to chromophoric groups like carboxylic acids, quinines or hydroperoxides [68]. These water-soluble compounds can be extracted from wood by rain during weathering processes, resulting in the decrease of carbonyl groups and the increase in surface roughness.
5. Conclusions
The study revealed the overall degradation process of hardwoods caused by abiotic factors in the exterior using different experimental methods. Five hardwoods from the temperate climate zone with different natural durability (oak, black locust, poplar, alder and maple wood) were exposed to natural weathering for 24 months. Significant colour changes were noticeable after 3 months of weathering. During the first year of weathering, all the hardwoods were characterized by high colour changes. The decrease in lightness L* indicated gradual darkening of the samples, decreasing a* and b* values showed a more pronounced shift to the grey colour. During the second year of weathering, the colour changed only slightly. The highest colour difference after 2 years of weathering was recorded for maple wood, the lowest for oak. The roughness change Ra had a similarly increasing trend (with the exception of poplar), but as opposed to the colour changes, the largest increase was observed during the second year of weathering, specifically for alder. ATR-FTIR analysis confirmed the assumption of degradation, in particular, in the structure of lignin and hemicelluloses of hardwoods. Decreases of both methoxy and carbonyl groups, cleavage of bonds in lignin and hemicelluloses, oxidation reaction and formation of new chromophores were observed during weathering. Based on the presented results, the use of more durable wood species (oak, black locust) in the exterior can be recommended (the lowest discolouration, relatively low roughness changes, no formation of moulds or fungi). Alder was also characterized by relatively good values of colour changes, but mould and degraded wood fibers were formed on its surface.
The significant impact of weathering factors on the quality and wood colour and roughness was demonstrated. The obtained findings regarding surface parameters (colour, roughness) were supported by visual performance, microscopic and chemical analysis. Presented results give some useful information about the surface degradation and related chemical changes of different hardwoods during exposure to weathering. The obtained results can increase the possible use of untreated hardwoods in applications directly exposed to weathering.
Author Contributions
E.O. and M.P. conceived and designed the experiments; E.O. and M.P. measured colour and roughness; I.K. analyzed the colour data; I.K. and F.K. measured and analyzed the FTIR data; I.K., E.O., F.K. and M.P. wrote the paper.
Funding
This research was funded by the Slovak Research and Development Agency under the contract No. APVV-16-0326 (30%), by the VEGA agency of the Ministry of Education, Science, Research and Sport of the Slovak Republic No. 1/0387/18 (30%) and by the Internal Grant Agency of the Faculty of Forestry and Wood Sciences, project IGA No. A07/18 (40%).
Conflicts of Interest
The authors declare no conflict of interest. The funders had no role in the design of the study; in the collection, analyses, or interpretation of data; in the writing of the manuscript, and in the decision to publish the results.
References
- Lesar, B.; Humar, M.; Kržišnik, D.; Thaler, N.; Žlahtič, M. Performance of façade elements made of five different thermally modified wood species on model house in Ljubljana. In Proceedings of the World Conference on Timber Engineering, Vienna, Austria, 22–25 August 2016; ISBN 978-390303900-1. Available online: http://wcte2016.conf.tuwien.ac.at/ (accessed on 3 September 2016).
- EN 350: 2016. Durability of Wood and Wood-Based Products. Testing and Classification of the Durability to Biological Agents of Wood and Wood-Based Materials; European Committee for Standardization: Brussels, Belgium, 2016. [Google Scholar]
- Ganne-Chédeville, C.; Volkmer, T.; Letsch, B.; Lehmann, M. Measures for the maintenance of untreated wood facades. In Proceedings of the 12th World Conference on Timber Engineering, Auckland, New Zealand, 15–19 July 2012; Quenneville, P., Ed.; Poster presentation. pp. 504–509. [Google Scholar]
- Feist, W.C.; Hon, D.N.S. Chemistry of weathering and protection. In The Chemistry of Solid Wood; Rowell, R.M., Ed.; American Chemical Society: Washington, DC, USA, 1984; Chapter 11; pp. 401–451. ISBN 0-8412-0796-8. [Google Scholar]
- Sandak, J.; Sandak, A.; Riggio, M. Characterization and monitoring of surface weathering on exposed timber structures with a multi-sensor approach. Int. J. Archit. Herit. 2015, 9, 674–688. [Google Scholar] [CrossRef]
- Kržišnik, D.; Lesar, B.; Thaler, N.; Humar, M. Influence of Natural and Artificial Weathering on the Colour Change of Different Wood and Wood-Based Materials. Forests 2018, 9, 488. [Google Scholar] [CrossRef]
- Evans, P.D. Weathering and photoprotection of wood. In Development of Commercial Wood Preservatives: Efficacy, Environmental, and Health Issues; Schultz, T.P., Militz, H., Freeman, M.H., Goodell, B., Nicholas, D.D., Eds.; ACS Symposium Series 982; American Chemical Society: Washington, DC, USA, 2008; Chapter 5; pp. 69–117. ISBN 978-0-8412-3951-7. [Google Scholar]
- Müller, U.; Rätzsch, M.; Schwanninger, M.; Steiner, M.; Zöbl, H. Yellowing and IR- changes of spruce wood as result of UV-irradiation. J. Photochem. Photobiol. B 2003, 69, 97–105. [Google Scholar] [CrossRef]
- Kubovský, I.; Kačík, F.; Reinprecht, L. The impact of UV radiation on the change of colour and composition of the surface of lime wood treated with a CO2 laser. J. Photochem. Photobiol. A 2016, 322, 60–66. [Google Scholar] [CrossRef]
- Pandey, K.K. A note on the influence of extractives on the photo-discoloration and photo-degradation of wood. Polym. Degrad. Stab. 2005, 87, 375–379. [Google Scholar] [CrossRef]
- Reinprecht, L. Wood Deterioration, Protection and Maintenance; John Wiley & Sons, Ltd.: Chichester, UK, 2016; p. 376. ISBN 978-1-119-10653-1. [Google Scholar]
- Hon, D.N.S.; Minemura, N. Color and discoloration. In Wood and Cellulosic Chemistry; Hon, D.N.S., Shirashi, N., Eds.; Marcel Dekker: New York, NY, USA, 2001; pp. 385–442. [Google Scholar]
- Brocco, V.F.; Paes, J.B.; da Costa, L.G.; Brazolin, S.; Arantes, M.D.C. Potential of teak heartwood extracts as a natural wood preservative. J. Clean. Prod. 2017, 142, 2093–2099. [Google Scholar] [CrossRef]
- Gupta, B.S.; Jelle, B.P.; Hovde, P.J.; Rüther, P. Studies of wooden cladding materials degradation by spectroscopy. Proc. Inst. Civ. Eng. Constr. Mater. 2011, 164, 329–340. [Google Scholar] [CrossRef] [Green Version]
- Oberhofnerová, E.; Pánek, M.; García-Cimarras, A. The effect of natural weathering on untreated wood surface. Maderas. Ciencia y Tecnología 2017, 19, 173–184. [Google Scholar] [CrossRef]
- Tolvaj, L.; Varga, D. Photodegradation of timber of three hardwood species caused by different light sources. Acta Silv. Lign. Hung. 2012, 8, 145–155. [Google Scholar] [CrossRef] [Green Version]
- Kačík, F.; Kubovský, I. Chemical changes of beech wood due to CO2 laser irradiation. J. Photochem. Photobiol. A 2011, 222, 105–110. [Google Scholar] [CrossRef]
- Kúdela, J.; Kubovský, I. Accelerated-ageing-induced photo-degradation of beech wood surface treated with selected coating materials. Acta Facultatis Xylologiae Zvolen 2016, 58, 27–36. [Google Scholar] [CrossRef]
- Hon, D.N.S.; Chang, S.T. Surface degradation of wood by ultraviolet light. J. Polym. Sci. Polym. Chem. Ed. 1984, 22, 2227–2241. [Google Scholar] [CrossRef]
- Kataoka, Y.; Kiguchi, M. Depth profiling of photo-induced degradation in wood by FT-IR microspectroscopy. J. Wood Sci. 2001, 47, 325–327. [Google Scholar] [CrossRef]
- Tolvaj, L.; Papp, G. Outdoor weathering of impregnated and steamed black locust. In Proceedings of the ICWSF’99 Conference, Missenden Abbey, UK, 14–16 July 1999; pp. 112–115. [Google Scholar]
- Williams, R.S.; Feist, W.C. Water Repellents and Water-Repellent Preservatives for Wood; General Technical Report FPL-GTR-109; USDA, Forest Products Laboratory: Madison, WI, USA, 1999; pp. 1–12. [Google Scholar]
- Feist, W.C. Outdoor wood weathering and protection. In Archaeological Wood: Properties, Chemistry, and Preservation; Advances in Chemistry Series 225; Rowell, R.M., Barbour, R.J., Eds.; American Chemical Society: Washington, DC, USA, 1989; pp. 263–298. [Google Scholar]
- Ozgenc, O.; Hiziroglu, S.; Yildiz, U.C. Weathering properties of wood species treated with different coating applications. BioResources 2012, 7, 4875–4888. [Google Scholar] [CrossRef]
- Turkoglu, T.; Baysal, E.; Toker, H. The effects of natural weathering on color stability of impregnated and varnished wood materials. Adv. Mater. Sci. Eng. 2015, 1–9. [Google Scholar] [CrossRef]
- Feist, W.C. Weathering of wood in structural uses. In Structural Uses of Wood in Adverse Environments; Van Nostrand Reinhold Company: New York, NY, USA, 1982; pp. 156–178. [Google Scholar]
- Mohebby, B.; Saei, A.M. Effects of geographical directions and climatological parameters on natural weathering of fir wood. Constr. Build. Mater. 2015, 94, 684–690. [Google Scholar] [CrossRef]
- Nzokou, P.; Kamdem, D.P.; Temiz, A. Effect of accelerated weathering on discoloration and roughness of finished ash wood surfaces in comparison with red oak and hard maple. Progr. Org. Coat. 2011, 71, 350–354. [Google Scholar] [CrossRef]
- Xie, Y.; Krause, A.; Militz, H.; Mai, C. Weathering of uncoated and coated wood treated with methylated 1,3-dimethylol-4,5-dihydroxyethyleneurea (mDMDHEU). Holz Roh. Werkst. 2008, 66, 455–464. [Google Scholar] [CrossRef]
- Williams, R.S.; Knaebe, M.T.; Feist, W.C. Erosion rates of wood during natural weathering. Part II. Earlywood and latewood erosion rates. Wood Fiber Sci. 2001, 33, 43–49. [Google Scholar]
- Tolvaj, L.; Molnar, Z.; Magoss, E. Measurement of photodegradation-caused roughness of wood using a new optical method. J. Photochem. Photobiol. B 2014, 134, 23–26. [Google Scholar] [CrossRef] [PubMed]
- Feist, W.C. Natural weathering of wood and its control by water-repellent preservatives. Am. Paint. Contr. 1992, 69, 18–25. [Google Scholar]
- Oberhofnerová, E.; Pánek, M. Surface wetting of selected wood species by water during initial stages of weathering. Wood Res. 2016, 61, 545–552. [Google Scholar]
- Žlahtič, M.; Humar, M. Influence of artificial and natural weathering on the hydrophobicity and surface properties of wood. BioResources 2016, 11, 4964–4989. [Google Scholar] [CrossRef]
- Pandey, K.K. Study of the effect of photo-irradiation on the surface chemistry of wood. Polym. Degrad. Stab. 2005, 90, 9–20. [Google Scholar] [CrossRef]
- Liu, R.; Pang, X.; Yang, Z. Measurement of three wood materials against weathering during long natural sunlight exposure. Measurement 2017, 102, 179–185. [Google Scholar] [CrossRef]
- Reinprecht, L.; Mamoňová, M.; Pánek, M.; Kačík, F. The impact of natural and artificial weathering on the visual, colour and structural changes of seven tropical woods. Eur. J. Wood Prod. 2018, 76, 175–190. [Google Scholar] [CrossRef]
- Singh, T.; Singh, A.P. A review on natural products as wood protectant. Wood Sci. Technol. 2012, 46, 851–870. [Google Scholar] [CrossRef]
- Brischke, C.; Rapp, A.O. Dose–response relationships between wood moisture content, wood temperature and fungal decay determined for 23 European field test sites. Wood Sci. Technol. 2008, 42, 507–518. [Google Scholar] [CrossRef]
- ČSN 49 0108. Drevo. Zisťovanie Hustoty [Wood. Determination of the Density]; Český Normalizační Institut: Prague, Czech Republic, 1993. [Google Scholar]
- EN 927-3: 2006. Paints and Varnishes—Coating Materials and Coating Systems for Exterior Wood—Part 3: Natural Weathering Test; CEN: Brussels, Belgium, 2006. [Google Scholar]
- Meteostanice: 2017. Meteorological Station of the Czech University of Life Sciences in Prague, Faculty of Agrobiology, Food and Natural Resources. Available online: http://meteostanice.agrobiologie.cz (accessed on 4 December 2017).
- ISO 11664-4. Colorimetry—Part 4: CIE 1976 L*a*b* Colour Space; International Organization for Standardization: Geneva, Switzerland, 2008. [Google Scholar]
- ISO 11664-6. Colorimetry—Part 6: CIEDE2000 Colour-Difference Formula; International Organization for Standardization: Geneva, Switzerland, 2013. [Google Scholar]
- EN ISO 4287. Geometrical Product Specifications (GPS)—Surface Texture: Profile Method-Terms, Definitions, and Surface Texture Parameters; International Organization for Standardization: Geneva, Switzerland, 1997. [Google Scholar]
- EN ISO 4288. Geometrical Product Specifications (GPS)—Surface Texture: Profile Method—Rules and Procedures for the Assessment of Surface Texture; International Organization for Standardization: Geneva, Switzerland, 1996. [Google Scholar]
- Kropf, F.W.; Sell, J.; Feist, W.C. Comparative weathering tests of North American and European exterior wood finishes. For. Prod. J. 1994, 44, 33–41. [Google Scholar]
- Pastore, T.C.; Santos, K.O.; Rubim, J.C. A spectrocolorimetric study on the effect of ultraviolet irradiation of four tropical hardwoods. Bioresour. Technol. 2004, 93, 37–42. [Google Scholar] [CrossRef] [PubMed]
- Sharratt, V.; Hill, C.A.S.; Kint, D.P.R. A study of early colour change due to simulated accelerated sunlight exposure in Scots pine (Pinus sylvestris). Polym. Degrad. Stabil. 2009, 94, 1589–1594. [Google Scholar] [CrossRef]
- Browne, F.L.; Simonson, H.C. The penetration of light into wood. For. Prod. J. 1957, 7, 308–314. [Google Scholar]
- Turkoglu, T.; Kabasakal, Y.; Baysal, E.; Gunduz, A.; Kucuktuvek, M.; Bayraktar, D.K.; Toker, H.; Peker, H. Surface characteristics of heated and varnished oriental beech after accelerated weathering. Wood Res. 2017, 62, 961–972. [Google Scholar]
- Turkulin, H.; Derbyshire, H.; Miller, E.R. Investigations into the photodegradation of wood using microtensile testing—Part 5: The influence of moisture on photodegradation rates. Holz als Roh-und Werkstoff 2004, 62, 307–312. [Google Scholar] [CrossRef]
- Kerber, P.R.; Stangerlin, D.M.; Pariz, E.; de Melo, R.R.; de Souza, A.P.; Calegari, L. Colorimetry and surface roughness of three amazonian woods submitted to natural weathering. Nativa 2016, 4, 303–307. [Google Scholar] [CrossRef]
- Derbyshire, H.; Miller, E.R.; Turkulin, H. Investigations into the photodegradation of wood using microtensile testing. Part 3: The influence of temperature on photodegradation rates. Holz als Roh-und Werkstoff 1997, 55, 287–291. [Google Scholar] [CrossRef]
- Hon, D.N.S. Degradative effects of ultraviolet light and acid rain on wood surface quality. Wood Fiber Sci. 1994, 26, 185–191. [Google Scholar]
- Williams, R.S. Weathering of wood. In Handbook of Wood Chemistry and Wood Composites; Rowell, R.M., Ed.; CRC Press: Boca Raton, FL, USA, 2005; pp. 139–185. [Google Scholar]
- Kataoka, Y.; Kiguchi, M.; Williams, R.; Evans, D. Violet light causes photodegradation of wood beyond the zone affected by ultraviolet radiation. Holzforschung 2007, 61, 23–27. [Google Scholar] [CrossRef]
- Živković, V.; Arnold, M.; Radmanović, K.; Richter, K.; Turkulin, H. Spectral sensitivity in the photodegradation of fir wood (Abies alba Mill.) surfaces: Colour changes in natural weathering. Wood Sci. Technol. 2014, 48, 239–252. [Google Scholar] [CrossRef]
- Živković, V.; Arnold, M.; Pandey, K.K.; Richter, K.; Turkulin, H. Spectral sensitivity in the photodegradation of fir wood (Abies alba Mill.) surfaces: Correspondence of physical and chemical changes in natural weathering. Wood Sci. Technol. 2016, 50, 989–1002. [Google Scholar] [CrossRef]
- Norrstrom, H. Light absorbing properties of pulp and paper components. Sven. Papperstidn. 1969, 72, 25–38. [Google Scholar]
- Li, R.; Xu, W.; Wang, X.; Wang, C. Modeling and predicting of the color changes of wood surface during CO2 laser modification. J. Clean. Prod. 2018, 183, 818–823. [Google Scholar] [CrossRef]
- Kačík, F.; Podzimek, S.; Vizárová, K.; Kačíková, D.; Čabalová, I. Characterization of cellulose degradation during accelerated ageing by SEC-MALS, SEC-DAD, and A4F-MALS methods. Cellulose 2016, 23, 357–366. [Google Scholar] [CrossRef]
- Sun, Z.; Fridrich, B.; de Santi, A.; Elangovan, S.; Barta, K. Bright Side of Lignin Depolymerization: Toward New Platform Chemicals. Chem. Rev. 2018, 118, 614–678. [Google Scholar] [CrossRef] [PubMed]
- Pandey, K.K.; Vuorinen, T. Comparative study of photodegradation of wood by a UV laser and a Xenon light source. Polym. Degrad. Stabil. 2008, 93, 2138–2146. [Google Scholar] [CrossRef]
- Shen, H.; Zhang, S.; Cao, J.; Jiang, J.; Wang, W. Improving anti-weathering performance of thermally modified wood by TiO2 sol or/and paraffin emulsion. Constr. Build. Mater. 2018, 169, 372–378. [Google Scholar] [CrossRef]
- Faix, O. Fourier transform infrared spectroscopy. In Methods in Lignin Chemistry; Lin, S.Y., Dence, C.W., Eds.; Springer: Berlin, Germany, 1992; pp. 83–109. [Google Scholar]
- Müller, G.; Schöpper, C.; Vos, H.; Kharazipour, A.; Polle, A. FTIR-ATR spectroscopic analysis of changes in wood properties during particle and fibreboard production of hard and softwood trees. BioResources 2009, 4, 49–71. [Google Scholar] [CrossRef]
- Wang, X.; Ren, H. Comparative study of the photo-discoloration of moso bamboo (Phyllostachys pubescens Mazel) and two wood species. Appl. Surf. Sci. 2008, 254, 7029–7034. [Google Scholar] [CrossRef]
Figure 1.
Points on the samples for measuring colour (dots) and roughness (lines).

Figure 2.
3D image of oak wood surface before (left) and after 2 years of weathering (right)—confocal laser scanning microscopy (area of 800 × 800 μm).
Figure 2.
3D image of oak wood surface before (left) and after 2 years of weathering (right)—confocal laser scanning microscopy (area of 800 × 800 μm).

Figure 3.
3D image of black locust wood surface before (left) and after 2 years of weathering (right)—confocal laser scanning microscopy (area of 800 × 800 μm).
Figure 3.
3D image of black locust wood surface before (left) and after 2 years of weathering (right)—confocal laser scanning microscopy (area of 800 × 800 μm).

Figure 4.
3D image of poplar wood surface before (left) and after 2 years of weathering (right)—confocal laser scanning microscopy (area of 800 × 800 μm).
Figure 4.
3D image of poplar wood surface before (left) and after 2 years of weathering (right)—confocal laser scanning microscopy (area of 800 × 800 μm).

Figure 5.
3D image of alder wood surface before (left) and after 2 years of weathering (right)—confocal laser scanning microscopy (area of 800 × 800 μm).
Figure 5.
3D image of alder wood surface before (left) and after 2 years of weathering (right)—confocal laser scanning microscopy (area of 800 × 800 μm).

Figure 6.
3D image of maple wood surface before (left) and after 2 years of weathering (right)—confocal laser scanning microscopy (area of 800 × 800 μm).
Figure 6.
3D image of maple wood surface before (left) and after 2 years of weathering (right)—confocal laser scanning microscopy (area of 800 × 800 μm).

Figure 7.
Confocal microscopy of samples during exposure to natural weathering (each scan corresponds to an area of 2.5 × 2.5 mm).
Figure 7.
Confocal microscopy of samples during exposure to natural weathering (each scan corresponds to an area of 2.5 × 2.5 mm).

Figure 8.
Confocal laser scanning microscopy of oak wood before and after 2 years of weathering (detail).
Figure 8.
Confocal laser scanning microscopy of oak wood before and after 2 years of weathering (detail).

Figure 9.
Confocal laser scanning microscopy of black locust wood before and after 2 years of weathering (detail).
Figure 9.
Confocal laser scanning microscopy of black locust wood before and after 2 years of weathering (detail).

Figure 10.
Confocal laser scanning microscopy of poplar wood before and after 2 years of weathering (detail).
Figure 10.
Confocal laser scanning microscopy of poplar wood before and after 2 years of weathering (detail).

Figure 11.
Confocal laser scanning microscopy of alder wood before and after 2 years of weathering (detail).
Figure 11.
Confocal laser scanning microscopy of alder wood before and after 2 years of weathering (detail).

Figure 12.
Confocal laser scanning microscopy of maple wood before and after 2 years of weathering (detail).
Figure 12.
Confocal laser scanning microscopy of maple wood before and after 2 years of weathering (detail).

Figure 13.
Differential Fourier Transform Infrared Spectroscopy (FTIR) spectra of oak wood samples.

Figure 14.
Differential FTIR spectra of black locust samples.

Figure 15.
Differential FTIR spectra of poplar wood samples.

Figure 16.
Differential FTIR spectra of alder wood samples.

Figure 17.
Differential FTIR spectra of maple wood samples.


Table 1.
Specification of used hardwoods. Natural durability against fungi is given in the range of 1–5, where 1 signifies the best durability. Wood density was determined at 12% wood moisture according to ČSN 49 0108 [40].
Table 1.
Specification of used hardwoods. Natural durability against fungi is given in the range of 1–5, where 1 signifies the best durability. Wood density was determined at 12% wood moisture according to ČSN 49 0108 [40].
| Hardwood | Natural Durability Against Fungi (EN 350) | Average Density (kg/m3) | Initial Appearance |
|---|---|---|---|
| Oak (Quercus robur L.) | 2 | 710 |  |
| Black locust (Robinia pseudoacacia L.) | 1–2 | 827 |  |
| Poplar (Populus sp.) | 5 | 413 |  |
| Alder (Alnus glutinosa (L.) Gaertn) | 5 | 534 |  |
| Maple (Acer pseudoplatanus L.) | 5 | 599 |  |
Table 2.
Weather conditions during the natural weathering test. Values are based on data from a weather station [42].
Table 2.
Weather conditions during the natural weathering test. Values are based on data from a weather station [42].
| Period (Months) | Average Temperature (°C) | Relative Humidity (%) | Total Precipitation (mm) | Average Total Solar Radiation (kJ/m2) | ||||
|---|---|---|---|---|---|---|---|---|
| 2015 | 2016 | 2015 | 2016 | 2015 | 2016 | 2015 | 2016 | |
| 0–2 | 2.0 | 0.58 | 77.3 | 82.58 | 23.3 | 66.2 | 10,678 | 11,977 |
| 2–4 | 5.2 | 4.53 | 67.1 | 74.98 | 58.8 | 44.2 | 18,722 | 18,067 |
| 4–6 | 14.1 | 18.02 | 61.5 | 66.15 | 71 | 178.8 | 20,488 | 20,164 |
| 6–8 | 21.2 | 19.09 | 55.2 | 64.39 | 91.3 | 134 | 17,432 | 16,496 |
| 8–10 | 14.4 | 15.86 | 67.8 | 67.63 | 72.3 | 81.1 | 8496 | 5082 |
| 10–12 | 6.7 | 1.05 | 80.6 | 75.16 | 53.7 | 48 | 2549 | 2271 |
Table 3.
Results of multifactorial ANOVA test (* denotes p < 0.05).
| Factors | Response Variables | ||||
|---|---|---|---|---|---|
| L* | a* | b* | ΔE* | Ra* | |
| Wood Species (WS) | * | * | * | * | * |
| Period of Exposure (PE) | * | * | * | * | * |
| WS × PE | * | * | * | * | * |
Table 4.
Exposure time-dependence of L* value (lightness differences ∆L* are in brackets). The data represent mean values.
Table 4.
Exposure time-dependence of L* value (lightness differences ∆L* are in brackets). The data represent mean values.
| Exposure Time | Oak | Black Locust | Poplar | Alder | Maple | |||||
|---|---|---|---|---|---|---|---|---|---|---|
| 0 m | 66.02 | (0) | 71.47 | (0) | 82.38 | (0) | 72.03 | (0) | 79.23 | (0) |
| 3 m | 68.06 | (2.04) | 61.77 | (−9.70) | 75.73 | (−6.65) | 66.54 | (−5.49) | 77.44 | (−1.79) |
| 6 m | 70.15 | (4.13) | 64.96 | (−6.51) | 65.68 | (−16.70) | 58.70 | (−13.33) | 74.29 | (−4.94) |
| 12 m | 50.57 | (−15.45) | 49.29 | (−22.18) | 51.68 | (−30.70) | 53.19 | (−18.84) | 54.48 | (−24.75) |
| 24 m | 49.29 | (−16.73) | 51.82 | (−19.65) | 52.35 | (−30.03) | 54.00 | (−18.03) | 47.81 | (−31.42) |
Table 5.
Exposure time-dependence of a* value (chromaticity differences ∆a* are in brackets). The data represent mean values.
Table 5.
Exposure time-dependence of a* value (chromaticity differences ∆a* are in brackets). The data represent mean values.
| Exposure Time | Oak | Black Locust | Poplar | Alder | Maple | |||||
|---|---|---|---|---|---|---|---|---|---|---|
| 0 m | 6.34 | (0) | 2.71 | (0) | 4.16 | (0) | 11.11 | (0) | 5.20 | (0) |
| 3 m | 4.49 | (−1.85) | 9.95 | (7.24) | 5.18 | (1.02) | 7.10 | (−4.01) | 4.85 | (−0.35) |
| 6 m | 1.73 | (−4.61) | 4.76 | (2.05) | 1.49 | (−2.67) | 1.98 | (−9.13) | 1.40 | (−3.8) |
| 12 m | 0.77 | (−5.57) | 1.44 | (−1.27) | 0.76 | (−3.4) | 1.24 | (−9.87) | 0.51 | (−4.69) |
| 24 m | 1.15 | (−5.19) | 1.45 | (−1.26) | 1.39 | (−2.77) | 1.50 | (−9.61) | 1.78 | (−3.42) |
Table 6.
Exposure time-dependence of b* value (chromaticity differences ∆b* are in brackets). The data represent mean values.
Table 6.
Exposure time-dependence of b* value (chromaticity differences ∆b* are in brackets). The data represent mean values.
| Exposure Time | Oak | Black Locust | Poplar | Alder | Maple | |||||
|---|---|---|---|---|---|---|---|---|---|---|
| 0 m | 20.49 | (0) | 26.77 | (0) | 16.69 | (0) | 21.78 | (0) | 16.98 | (0) |
| 3 m | 16.64 | (−3.85) | 20.79 | (−5.98) | 20.24 | (3.55) | 21.36 | (−0.42) | 19.06 | (2.08) |
| 6 m | 9.18 | (−11.31) | 12.16 | (−14.61) | 8.50 | (−8.19) | 8.52 | (−13.26) | 7.19 | (−9.79) |
| 12 m | 4.87 | (−15.62) | 6.64 | (−20.13) | 3.84 | (−12.85) | 4.84 | (−16.94) | 3.12 | (−13.86) |
| 24 m | 4.43 | (−16.06) | 4.41 | (−22.36) | 4.43 | (−12.26) | 4.37 | (−17.41) | 3.96 | (−13.02) |
Table 7.
Exposure time-dependence of ΔE* value. The data represent mean values.
| Exposure Time | Oak | Black Locust | Poplar | Alder | Maple |
|---|---|---|---|---|---|
| 0 m | 0 | 0 | 0 | 0 | 0 |
| 3 m | 4.74 | 13.50 | 7.61 | 6.90 | 2.77 |
| 6 m | 12.90 | 16.12 | 18.79 | 20.91 | 11.61 |
| 12 m | 22.67 | 29.97 | 33.46 | 27.19 | 28.76 |
| 24 m | 23.77 | 29.79 | 32.56 | 26.84 | 34.19 |
Table 8.
Exposure time-dependence of arithmetical mean profile deviation Ra (roughness differences ∆Ra are in parentheses).
Table 8.
Exposure time-dependence of arithmetical mean profile deviation Ra (roughness differences ∆Ra are in parentheses).
| Exposure Time | Oak | Black Locust | Poplar | Alder | Maple | |||||
|---|---|---|---|---|---|---|---|---|---|---|
| 0 m | 7.08 | (0) | 4.48 | (0) | 6.27 | (0) | 5.25 | (0) | 4.10 | (0) |
| 3 m | 8.75 | (1.67) | 6.57 | (2.09) | 9.54 | (3.27) | 8.62 | (3.37) | 6.11 | (2.01) |
| 6 m | 15.76 | (8.68) | 13.32 | (8.85) | 10.80 | (4.53) | 8.76 | (3.51) | 6.17 | (2.07) |
| 12 m | 14.77 | (7.69) | 8.36 | (3.88) | 14.46 | (8.19) | 7.70 | (2.44) | 8.07 | (3.97) |
| 24 m | 21.93 | (14.85) | 19.67 | (15.19) | 15.68 | (9.41) | 27.43 | (22.18) | 23.62 | (19.52) |
© 2018 by the authors. Licensee MDPI, Basel, Switzerland. This article is an open access article distributed under the terms and conditions of the Creative Commons Attribution (CC BY) license (http://creativecommons.org/licenses/by/4.0/).
Share and Cite
MDPI and ACS Style
Kubovský, I.; Oberhofnerová, E.; Kačík, F.; Pánek, M. Surface Changes of Selected Hardwoods Due to Weather Conditions. Forests 2018, 9, 557. https://0-doi-org.brum.beds.ac.uk/10.3390/f9090557
AMA Style
Kubovský I, Oberhofnerová E, Kačík F, Pánek M. Surface Changes of Selected Hardwoods Due to Weather Conditions. Forests. 2018; 9(9):557. https://0-doi-org.brum.beds.ac.uk/10.3390/f9090557
Chicago/Turabian StyleKubovský, Ivan, Eliška Oberhofnerová, František Kačík, and Miloš Pánek. 2018. "Surface Changes of Selected Hardwoods Due to Weather Conditions" Forests 9, no. 9: 557. https://0-doi-org.brum.beds.ac.uk/10.3390/f9090557
Note that from the first issue of 2016, this journal uses article numbers instead of page numbers. See further details here.