1. Introduction
Effective customer care and data-driven service assurance have become a vital need for telecommunication companies, especially as regards the progression towards automating the management of technical tickets: in addition, this enables a thorough and objective evaluation of the performance of the service assurance functions, based on generated reports and prescribed Key Performance Indicators (KPIs), which implies increased productivity, improved quality of service and, in some cases, even personalized satisfaction of the end user.
More in detail, designing a successful data-driven service assurance system requires:
in-house design and development in order to offer a solution that is at the same time cheap and adaptable to all service needs;
tight integration with the customer portal in order to allow the access to all relevant online services with the same login credentials;
support to all activities that are characteristic of an incident management process, such as opening, classifying, assigning, solving, closing and archiving an IT incident;
enabling the exchange of files and comments regarding an IT incident, as this makes the served customers satisfied by allowing them to interact with IT agents in order to clarify the problem or understand the solution;
provision of email notifications that allow for keeping all involved parties informed on any ticket update;
automatic classification and ticket rerouting to the relevant IT agents, which is expected to significantly minimize resolution time of each ticket and consequently enhance user satisfaction;
generation of reports to measure the KPIs that are chosen to evaluate the success of the customer care service.
For detailed references, the advantages and challenges of using data-driven service assurance in an organization have already been explored in the Information Technology Infrastructure Library (ITIL) framework of best practices for delivering IT services (see [
1,
2,
3,
4,
5,
6,
7,
8]). Moreover, the positive influence of ticketing services on the implementation of the incident management process is stressed in [
1,
2,
3,
4,
5,
6,
7,
8,
9,
10]. Indeed, being able to automate several key activities such as identification, prioritization, assignment, diagnosis and closure of technical tickets plays a relevant role in enhancing the said process. In addition, data-driven service assurance (see [
4,
5,
6]) facilitates the measurement and improvement of several important KPIs for the IT business processes, such as the percentage of incidents detected and solved in the first attempt, the mean number of incidents that occurred per day and the average lifetime of an incident. In particular, in [
8], it is clearly stated that automatic incident classification proves to be extremely effective at minimizing ticket resolution time. Providing an automated solution to the challenge of ticket classification is a relevant emerging task also according to [
10].
Some related additional features that are in part beyond the scope of this work but testify the interest of the scientific and industrial community are the multimedia chat service architecture introduced in [
11], as well as rule-based reasoning for fault diagnosis and visual dashboards for helping desk tickets monitoring, which is illustrated in [
12,
13]. In addition, a probabilistic framework for IT ticket annotation and search based on natural language processing is introduced in [
14,
15,
16,
17]. In [
15], a predictive model based on Support Vector Machines (SVMs) and K-Nearest Neighbours (KNN) is discussed with the aim to automate incident categorization with the specific help of ticket description and other relevant ticket attributes. In a similar way, in [
18], the dispatch of a ticket to the correct resolution group is successfully automated by means of a tool that combines SVMs and discriminative term-based classification techniques. Alternatively, Multinomial Naive Bayes (MNB) and Softmax Regression Neural Network (SNN) are used in [
19] for text classification purposes aimed at categorizing user tickets. Finally, several methods to detect duplicate tickets/bugs are proposed in [
20,
21,
22].
In particular, this paper, with respect to the emerging need for preventing customers from issuing a request for technical ticket reopening on customer service platforms of telecommunication companies, provides the following contributions:
the identification of relevant correlations between the reopening of a technical customer service ticket, on the one hand, and Quality of Service (QoS) parameters of the 5G fiber optic networks, on the other hand, based on the actual use the customer is currently making of the fixed network itself;
based on such correlations, the design of a data-driven model capable of predicting whether a customer will call the assistance service once again even though his/her technical ticket has already been closed.
Incidentally, reopened tickets are to be considered as those tickets that were formerly solved and have been reopened [
23].
The proposed approach may prove particularly useful in the domain of 5G enabling technologies. Indeed, even with the advent of 5G, optical fiber is the most suitable means for wireless backhaul networks. Indeed, even in networks where this is not the case, the wireless backhaul actually has to be connected into a fiber backhaul. For this reason, fiber technology is increasingly being preferred for the so-called fronthaul, especially when it comes to connecting the dense mesh of 5G small cells. There are several benefits, such as increased speeds matched with lower attenuation, significant immunity with respect to electromagnetic interference, relatively small size, and practically unlimited potential in terms of bandwidth. Hence, customer service in order to address any technical issue relative to the Quality of Service (QoS) perceived in 5G fiber optic networks has a critical role, especially with the advent of the emerging Fixed Wireless Access (FWA) paradigm [
24].
The paper contribution lies in the fact that the effectiveness of the proposed approach is evaluated on the customer complaints that arise in conditions of intensive usage of the fixed network of a major Italian network operator. Indeed, according to IBM analyses in [
25] and to [
26], by automating up to 85% of the customer service process thanks to the usage of predictive tools such as the one presented in this work, an increase in efficiency up to 90% can be obtained, together with a reduction in the operating costs between 25% and 30%.
Similar machine learning methods have already been used in order to solve resource allocation problems in order to improve the perceived QoS in [
27,
28,
29]. In more detail, Pietrabissa et al. have already focused on distributed load balancing in Software Defined Networking relying on Lyapunov-based decision-making algorithms in [
27], on optimal buffer allocation for guaranteeing QoS in multimedia Internet broadcasting for mobile networks in [
28], and on predictor-based control design for improving Quality of Experience in delay-sensitive Future Internet frameworks in [
29]. In contrast with the cited works, this paper specifically focuses on the prediction of the ticket reopening phenomena that characterize fixed networks and therefore also 5G fiber optic networks. To this aim, we exploited several machine learning approaches and compared the obtained performance results.
The paper is organized as follows:
Section 2 introduces the so-called Analytical Base Table (ABT), namely the dataset to be given as an input to the predictive model for training and test purposes, as well as the data collection and preparation activity that has been carried out to assemble said ABT.
Section 3 presents the performance achieved by different machine learning based classifiers, comparing the results obtained on the original dataset against those obtained on the reduced dataset.
Section 4 discusses a further dimensionality reduction effort before introducing the Bayesian network classifier whose performance is the best in class. Concluding remarks end the paper.
2. Data Collection, Data Preparation and Analytical Base Table
With the aim of effectively predicting ticket reopening relative to the QoS perceived in 5G fiber optic networks—namely, according to the emerging FWA paradigm—the methodological approach inspiring this work can be structured as follows.
A first data collection and data preparation effort were made, by collecting, aggregating, cleaning and preparing the relevant data for the subsequent processing phase, resulting in a homogeneous ABT to be fed to the predictive analytics/classification engine that was subsequently designed and developed. This first activity was carried out in the framework of an extensive joint research initiative on Next Generation Networks between ELIS Innovation Hub and Vodafone over the years 2018–2021.
Then, the KPI definition was necessary, that is, the identification of the relevant KPIs that allows for quantifying the benefits that are ultimately yielded by the adoption of the proposed predictive analytics engine. In this respect, we chose to evaluate the performance of the proposed predictive analytics engine in terms of accuracy, Gini coefficient, Youden index, and Area Under the ROC Curve (AUC).
The design and training of the predictive analytics engine followed, together with the evaluation of the performance obtained on a suitable test dataset.
In more detail, the relevant input data are collected from two heterogeneous data sources,
the former related to the Virtual Unbundled Local Access (VULA) technology—VULA offers a means to any licensed network operator to effectively join the ultrabroadband network infrastructure of the backbone provider by virtually accessing the last mile only;
the latter related to the Sub-Loop Unbundling (SLU) technology—SLU is alternative to VULA, yet it joins the network infrastructure of the backbone provider only at the copper section, thus exhibiting lower performance than VULA.
The original dataset X is therefore represented by an matrix aggregating the inputs from both VULA and SLU technologies. After being suitably cleaned, it reports network QoS parameters collected over a period of days of intensive usage for a group of m = 600,000 users.
The
i-th row of
X (for
,
associated with a user
i that the customer service has already closed a ticket for (since the aim of the paper is to predict ticket
reopening), accounts for the values of the
n network QoS parameters perceived by user
i on day
v. Among the
m users, in the considered period, 25% reopened a ticket due to a technical issue that is still unsolved even though a ticket in that respect had already been closed. In particular, data collection was carried out with a specific data matching criterion: namely, in the case of a reopened ticket, only the last data point—i.e., the last values of the
n features—that is, the temporally closest to ticket reopening for the considered user is collected and stored in the dataset
X, whereas, for all other tickets—that have already been closed and have not been reopened yet—all data in the time interval between ticket closing and the last possible sampling instant are collected and stored in the dataset
X.
In order to obtain a smaller dataset, with reduced dimensionality () but with very similar information content, we first performed feature reduction on the original dataset X by removing all features with very low variance, i.e., proving to be redundant when it comes to estimating the probability of ticket reopening.
Then, we carried out a linear correlation analysis among the features which, however, did not yield any relevant results; this is why we chose to resort to hierarchical clustering in order to shed light on any existing nonlinear correlations.
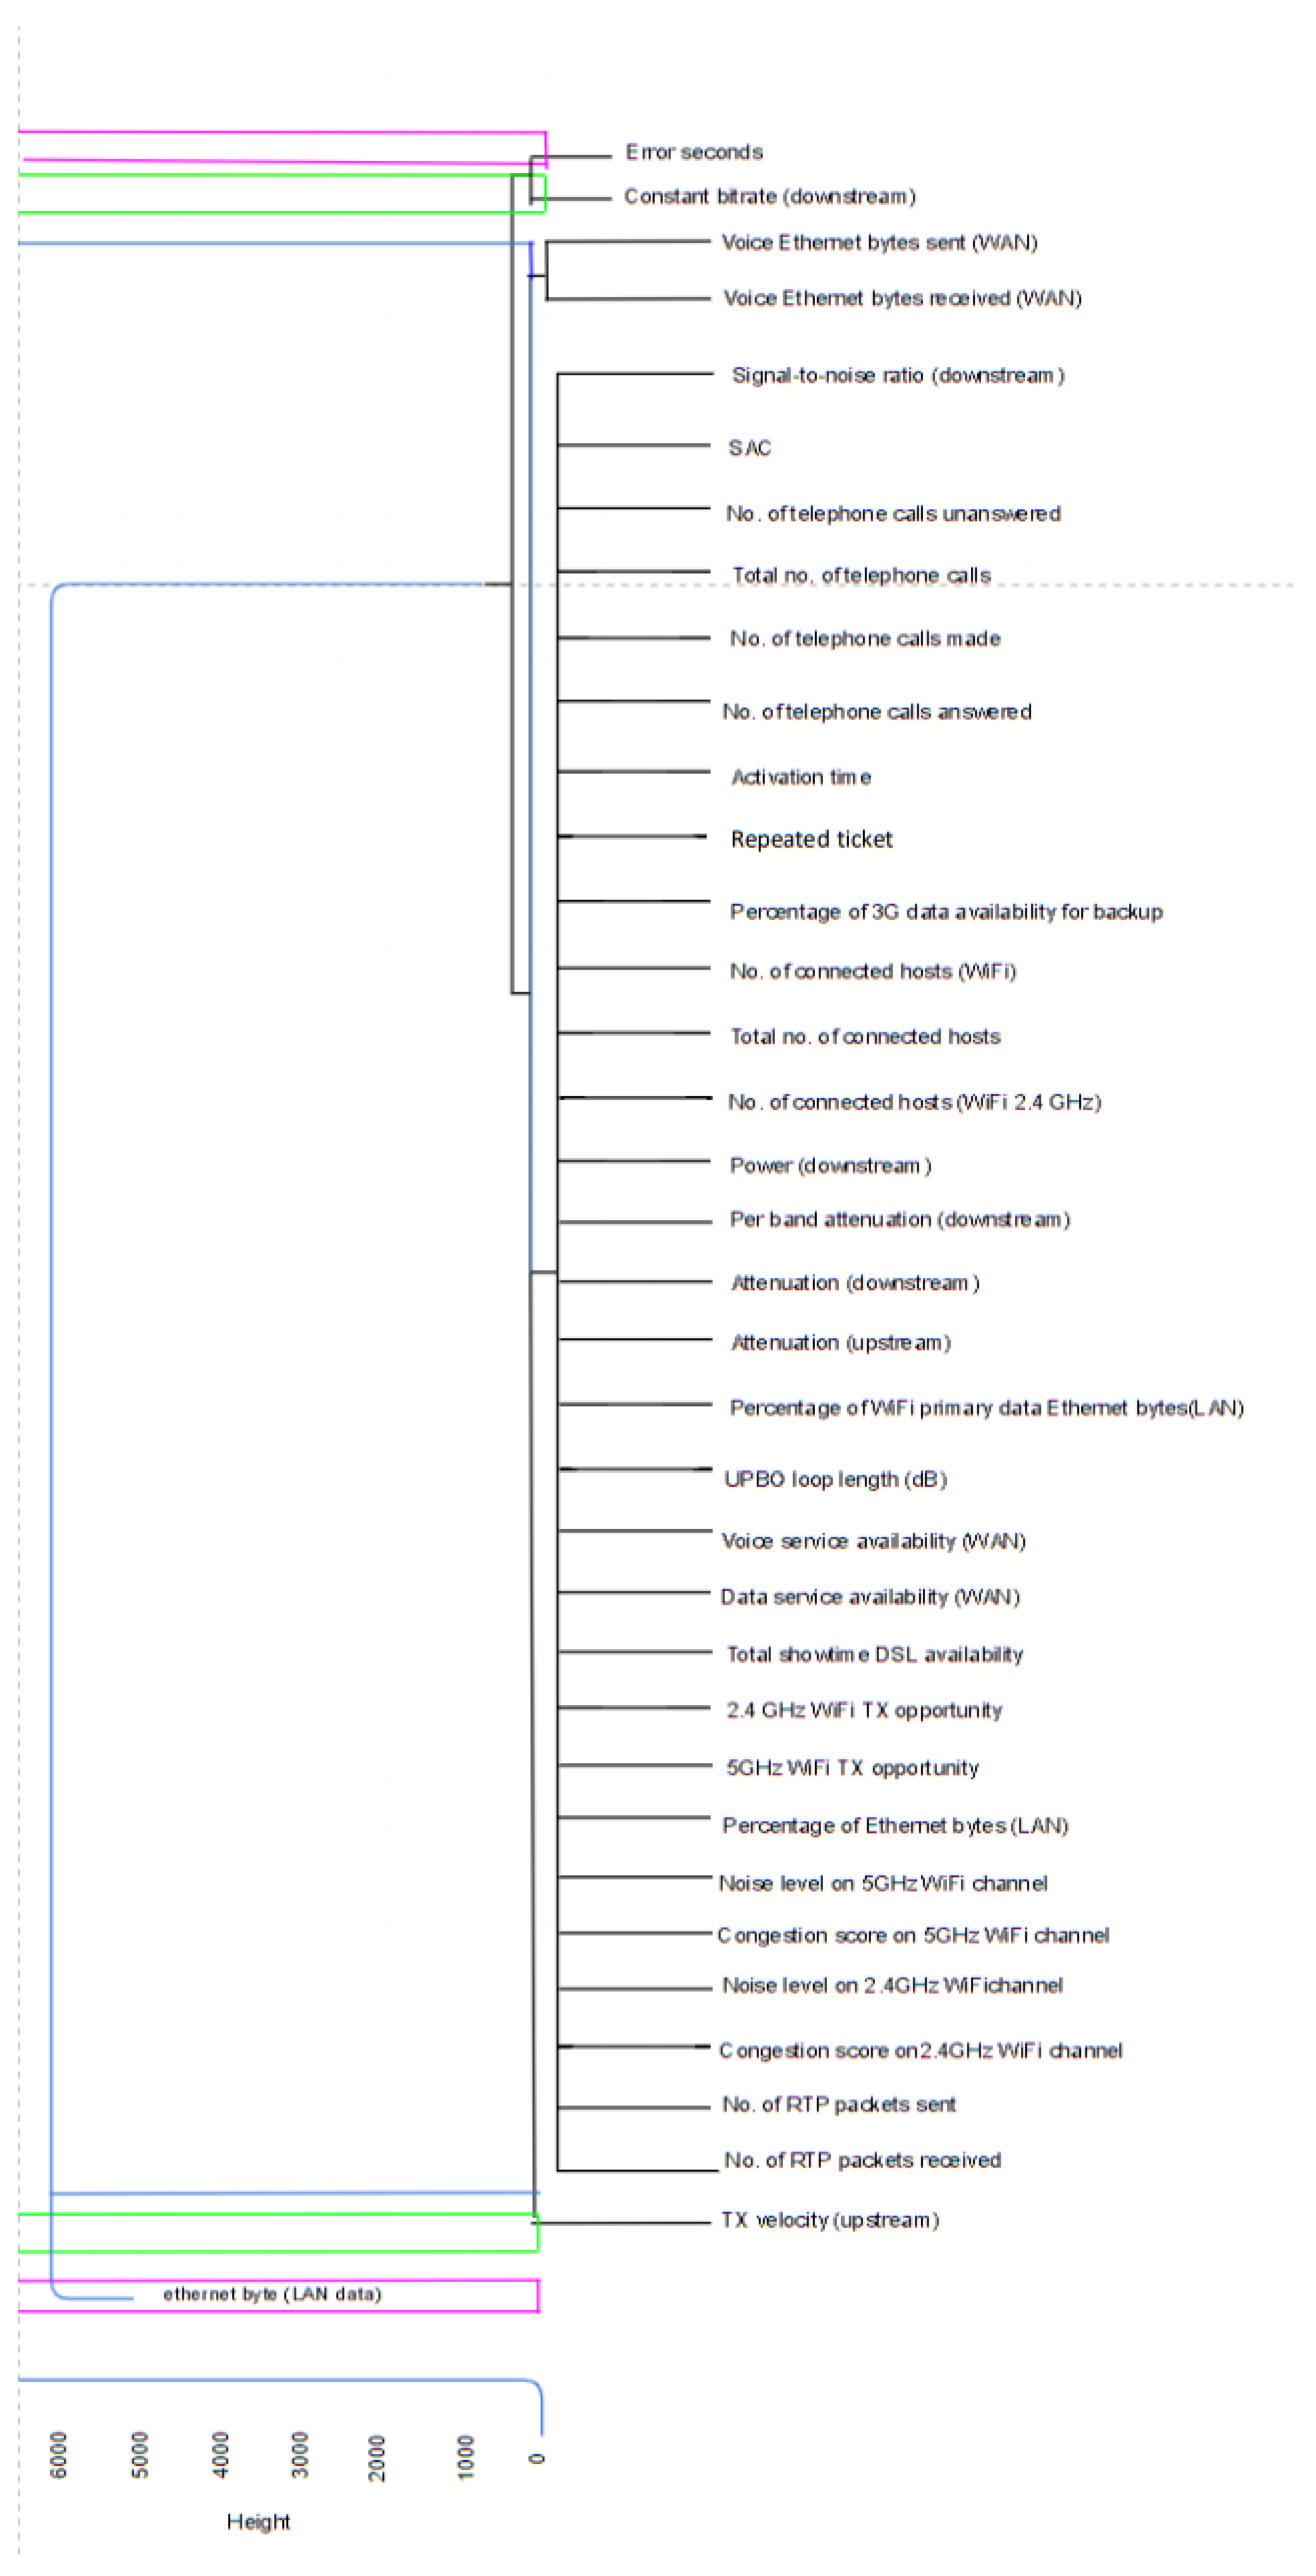
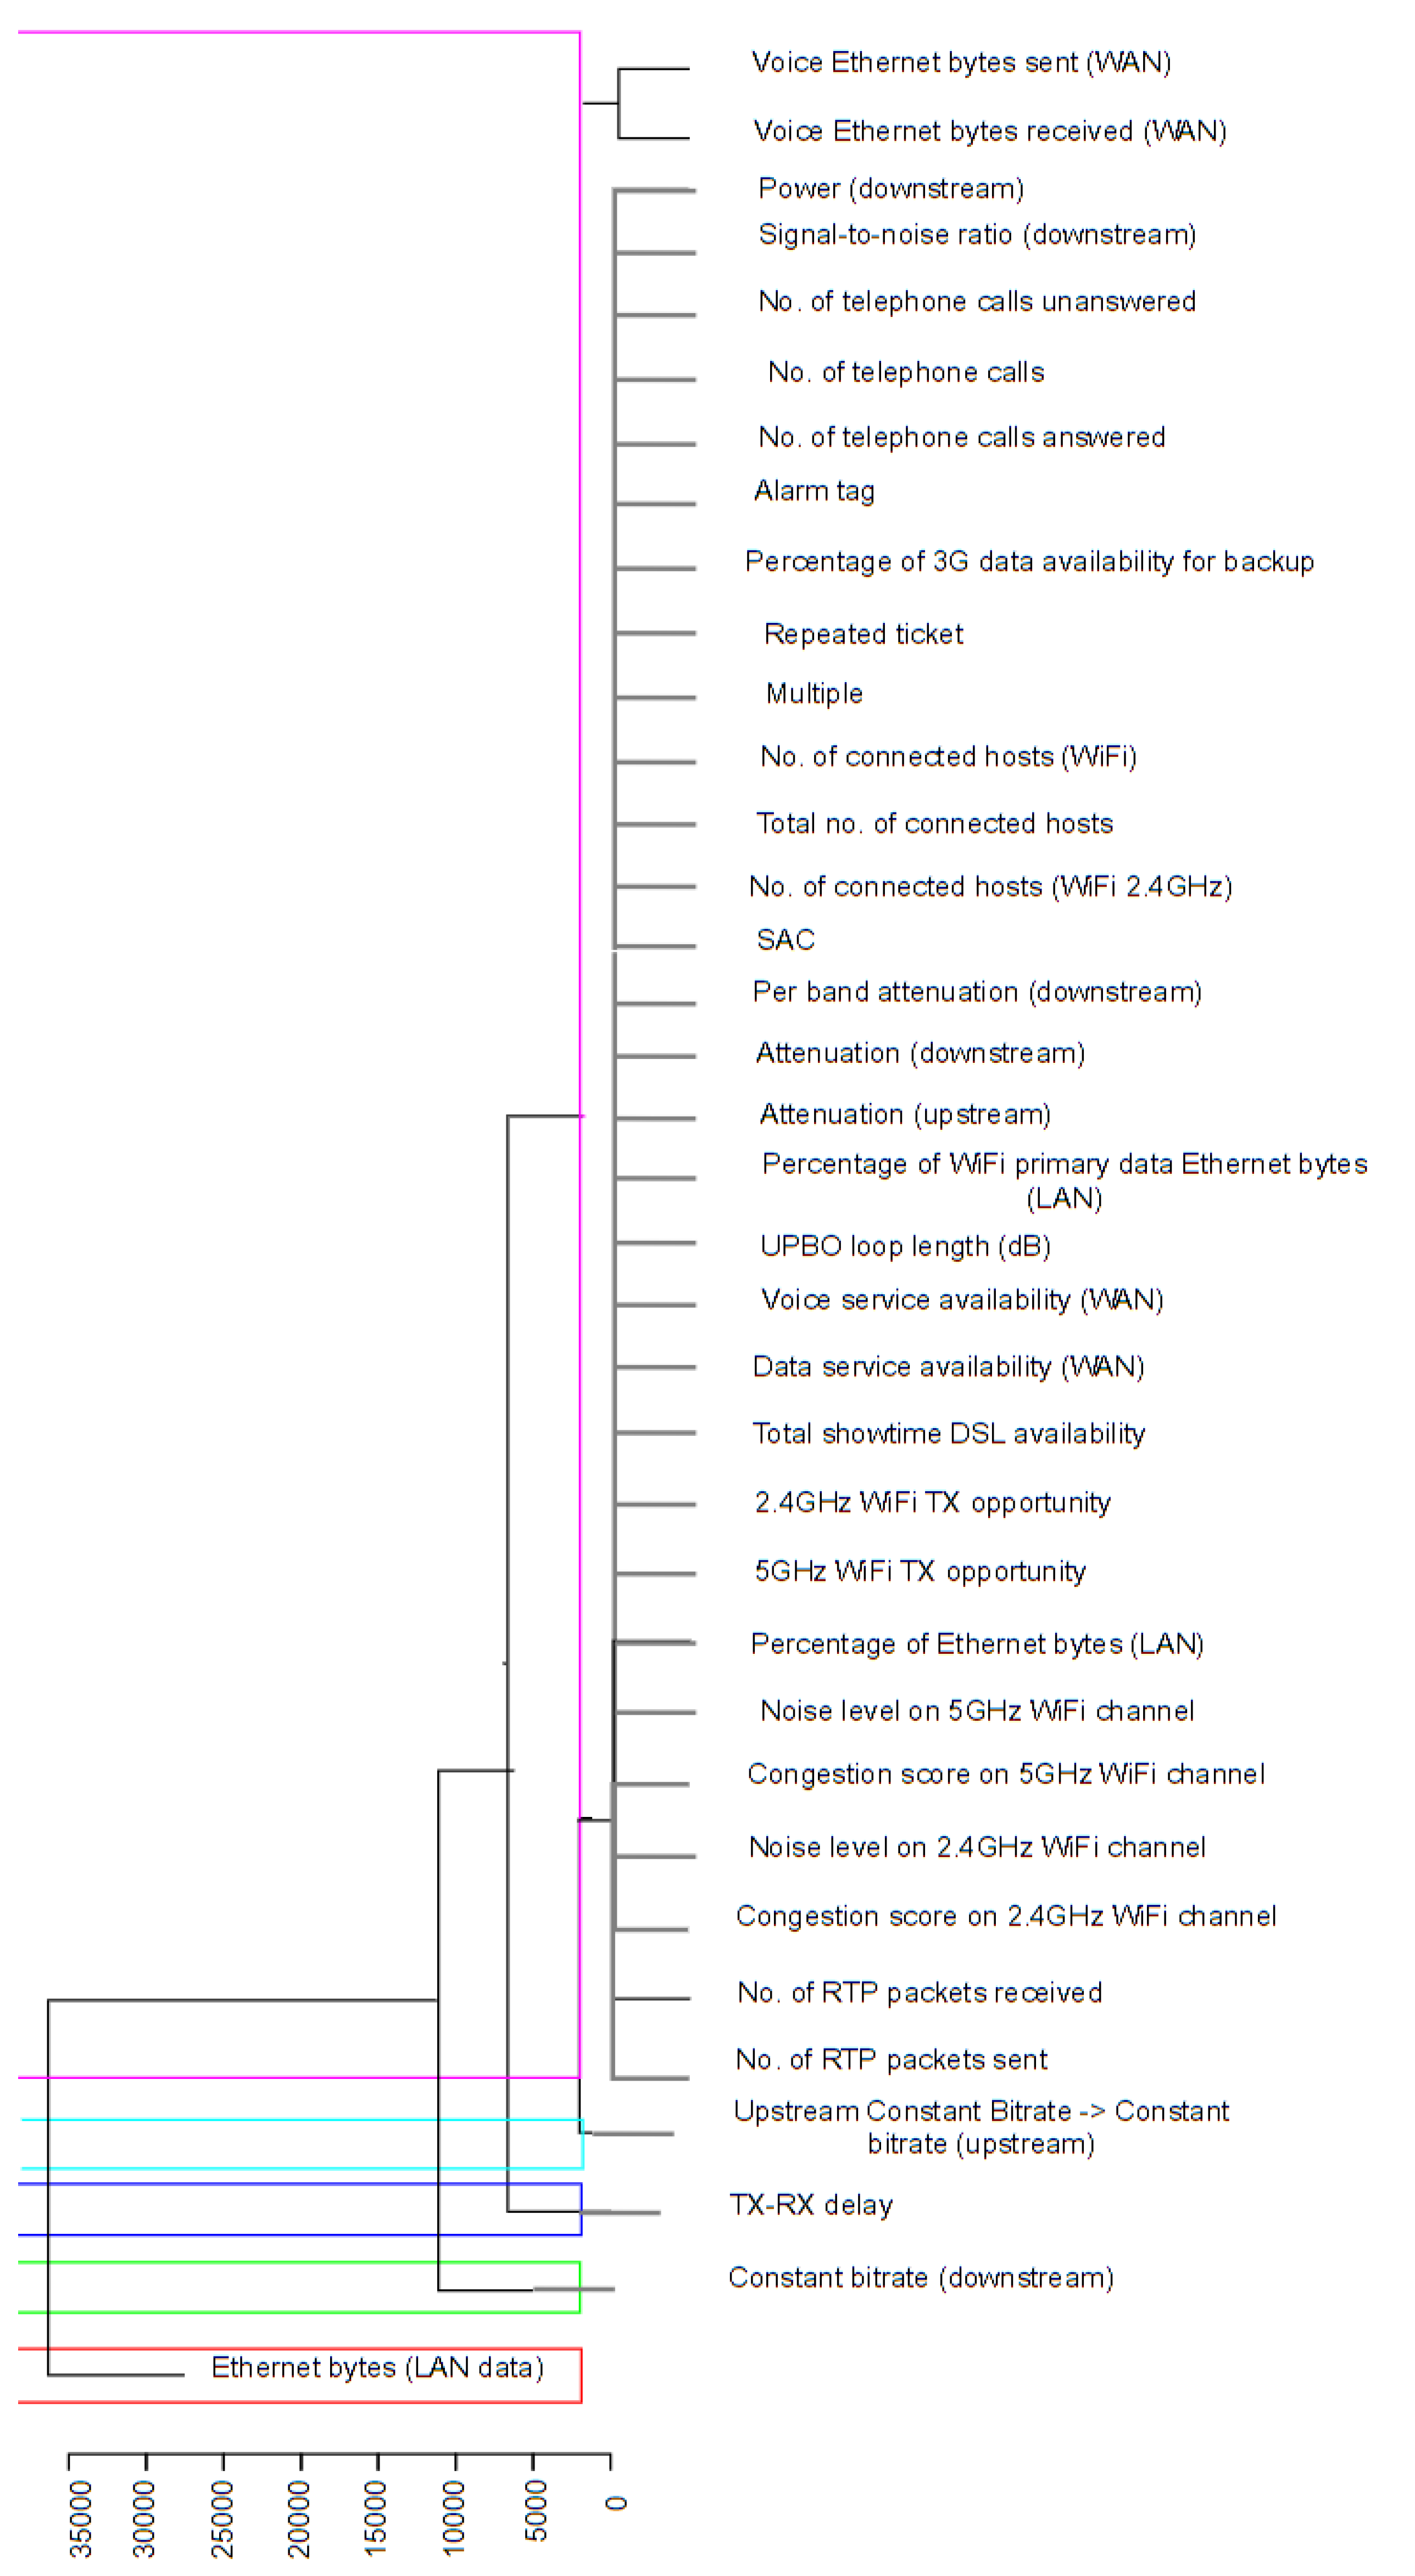
The result of hierarchical clustering, performed on the portion of
X accounting for the VULA and SLU inputs alternatively, is represented by the
dendrograms shown in
Figure 1 and
Figure 2, which represent the resulting hierarchies of clusters, by reporting:
In both dendrograms, important correlations emerged—which had not been as evident from linear correlation analysis at all—between ticket reopening (accounted for by the ‘Repeated ticket’ variable) and some network parameters. The most relevant evidence is related to the correlations of the Repeated ticket variable with the following:
Percentage of 3G data availability for backup;
Alarm tag;
Number of connected hosts (WiFi);
Total number of connected hosts.
As regards the last two, it is reasonable that the higher the number of connected devices, the higher the performance degradation.
A specific remark has to be made relative to the tight correlation of the Repeated ticket variable with the Alarm tag. Indeed, the Alarm tag parameter is a boolean variable which is valued 1 if the so-called customer-premises equipment parameter hits the alarm and 0 otherwise according to two alarm-triggering rules:
if in almost 4 out of 8 measurements, the SAC parameter goes below threshold;
if in 3 consecutive measurements, the SAC parameter goes below the threshold.
The SAC variable, which specifically accounts for attenuation-related QoS, can have values in the range from 1 to 6 (where 1 accounts for ‘bad’ and 6 for ‘good’) and is obtained by comparing other two parameters, namely signal-to-noise ratio (downstream) and attenuation (downstream), respectively.
The correlation between Repeated ticket and Alarm tag can be considered as primary since it is the tightest one. Therefore, in addition to the primary correlations highlighted by the dendrograms, starting from the tight correlation between Repeated ticket and Alarm tag, other secondary correlations also emerge between the Repeated ticket variable, on the one hand, and SAC, signal-to-noise ratio (downstream) and attenuation (downstream), on the other hand. In particular, by observing the relationship among these variables, we can notice the following high degrees of correlation:
correlation between Alarm tag and SAC for both VULA and SLU technologies;
correlation between SAC and signal-to-noise ratio for the SLU technology and correlation between the same variables for the VULA technology;
correlation between SAC and attenuation (downstream) for the SLU technology and between the same variables for the VULA technology.
It is also possible to evaluate the similarity degree between the two dendrograms by computing the so-called entanglement parameter—ranging from 0, which accounts for no entanglement—to 1—which accounts for full entanglement. A low entanglement score implies a good alignment degree between the QoS performance of the two technologies with respect to the time period and set of users observed. In the considered case, the entanglement parameter is evaluated to be equal to 0.175, thus allowing us to consider as ABT a reduced dataset extracted from the original one X. In particular, the Repeated ticket variable occupies very similar positions in both dendrograms. In light of this, it is reasonable to adopt the same predictive algorithm to predict ticket reopening for both VULA and SLU technologies.
As a result, the following lessons can be learned from the data preparation activity carried out in this section:
no relevant linear correlations emerge between the Repeated ticket variable and QoS parameters;
the variables exhibiting primary nonlinear correlations with the Repeated ticket variable are the percentage of 3G data availability for backup and the Alarm tag;
the variables exhibiting secondary nonlinear correlations with the Repeated ticket variable are SAC, signal-to-noise ratio, and attenuation in downstream;
the datasets related to the VULA and SLU technologies are very much correlated with each other due to the 0.175 entanglement coefficient computed between the two dendrograms in
Figure 1 and
Figure 2.
Hence, the reduced dataset we are going to resort to hereinafter can be regarded as a matrix reporting the following network QoS parameters for the same group of m users at time t: (i) SAC, (ii) signal-to-noise ratio (downstream), (iii) attenuation (downstream), (iv) constant bitrate (downstream), (v) downstream maximum rate, (vi) Ethernet bytes (LAN data), (vii) percentage of Ethernet bytes (LAN), (viii) percentage of WiFi primary data Ethernet bytes (LAN), (ix) attenuation (upstream), (x) current bitrate (upstream), (xi) upstream maximum rate, (xii) power (upstream), (xiii) UPBO (upstream power back-off) loop length (dB), (xiv) ticket close code, and (xv) repeated ticket.
The ticket close code has not been mentioned so far but was already also present in the original dataset
X: it testifies that the network operator has acknowledged the causes that are attributable to the variations in the QoS parameters for which the user is complaining. The ticket close code variable may take one of the following values: (a) activity on the OCA protocol, (b) existence of a known problem that is pending for resolution, (c) line/device problem needing for device reboot, (d) line/device problem needing for device reset, (e) unexploited link/GNP (Geographic Number Portability), (f) LNI-minimum bitrate, (g) maximum obtainable performance, (h) no trouble found, (i) OLO2OLO problem—OLO2OLO is the Italian platform allowing the migration of access lines between different network operators insisting on the same network infrastructure—, (j) performance degradation resulting from monitoring, (k) macroproblem due to the network infrastructure, (l) known network outage, (m) network outage detected as a result of monitoring, (n) access degradation of the network infrastructure resulting from monitoring, (o) access network degradation relative to the backbone provider, (p) access network degradation relative to the network operator, and (q) wrong assignment of the network service to a user. For the sake of completeness, in
Table 1, we show the relative frequency of each ticket close code in the considered dataset.
We now present our predictive model. In more detail, we are going to address the following classification problem: is a user at risk of reopening a ticket that was previously closed even though the related technical issue (in terms of perceived QoS) was still not solved?
4. A Bayesian Network Classifier Trained on a Further Reduced Dataset
We now propose another data-driven classification model, namely based on a Bayesian network, aimed at improving the performance already obtained on the dataset by means of a further dimensionality reduction, namely resorting to the further reduced dataset .
4.1. Bayesian Network Classifier
Based on the reduced dataset, we trained a classifier resorting to a Bayesian network.
A Bayesian network is a probabilistic graphical model that, by representing a set of variables and their conditional dependencies via a directed acyclic graph , allows for predicting the likelihood that one of several possible known causes is the contributing factor behind the occurrence of a specific event. In the considered case, the aim is that of predicting if a combination of network QoS parameters belongs to the discrete class variable Repeated ticket.
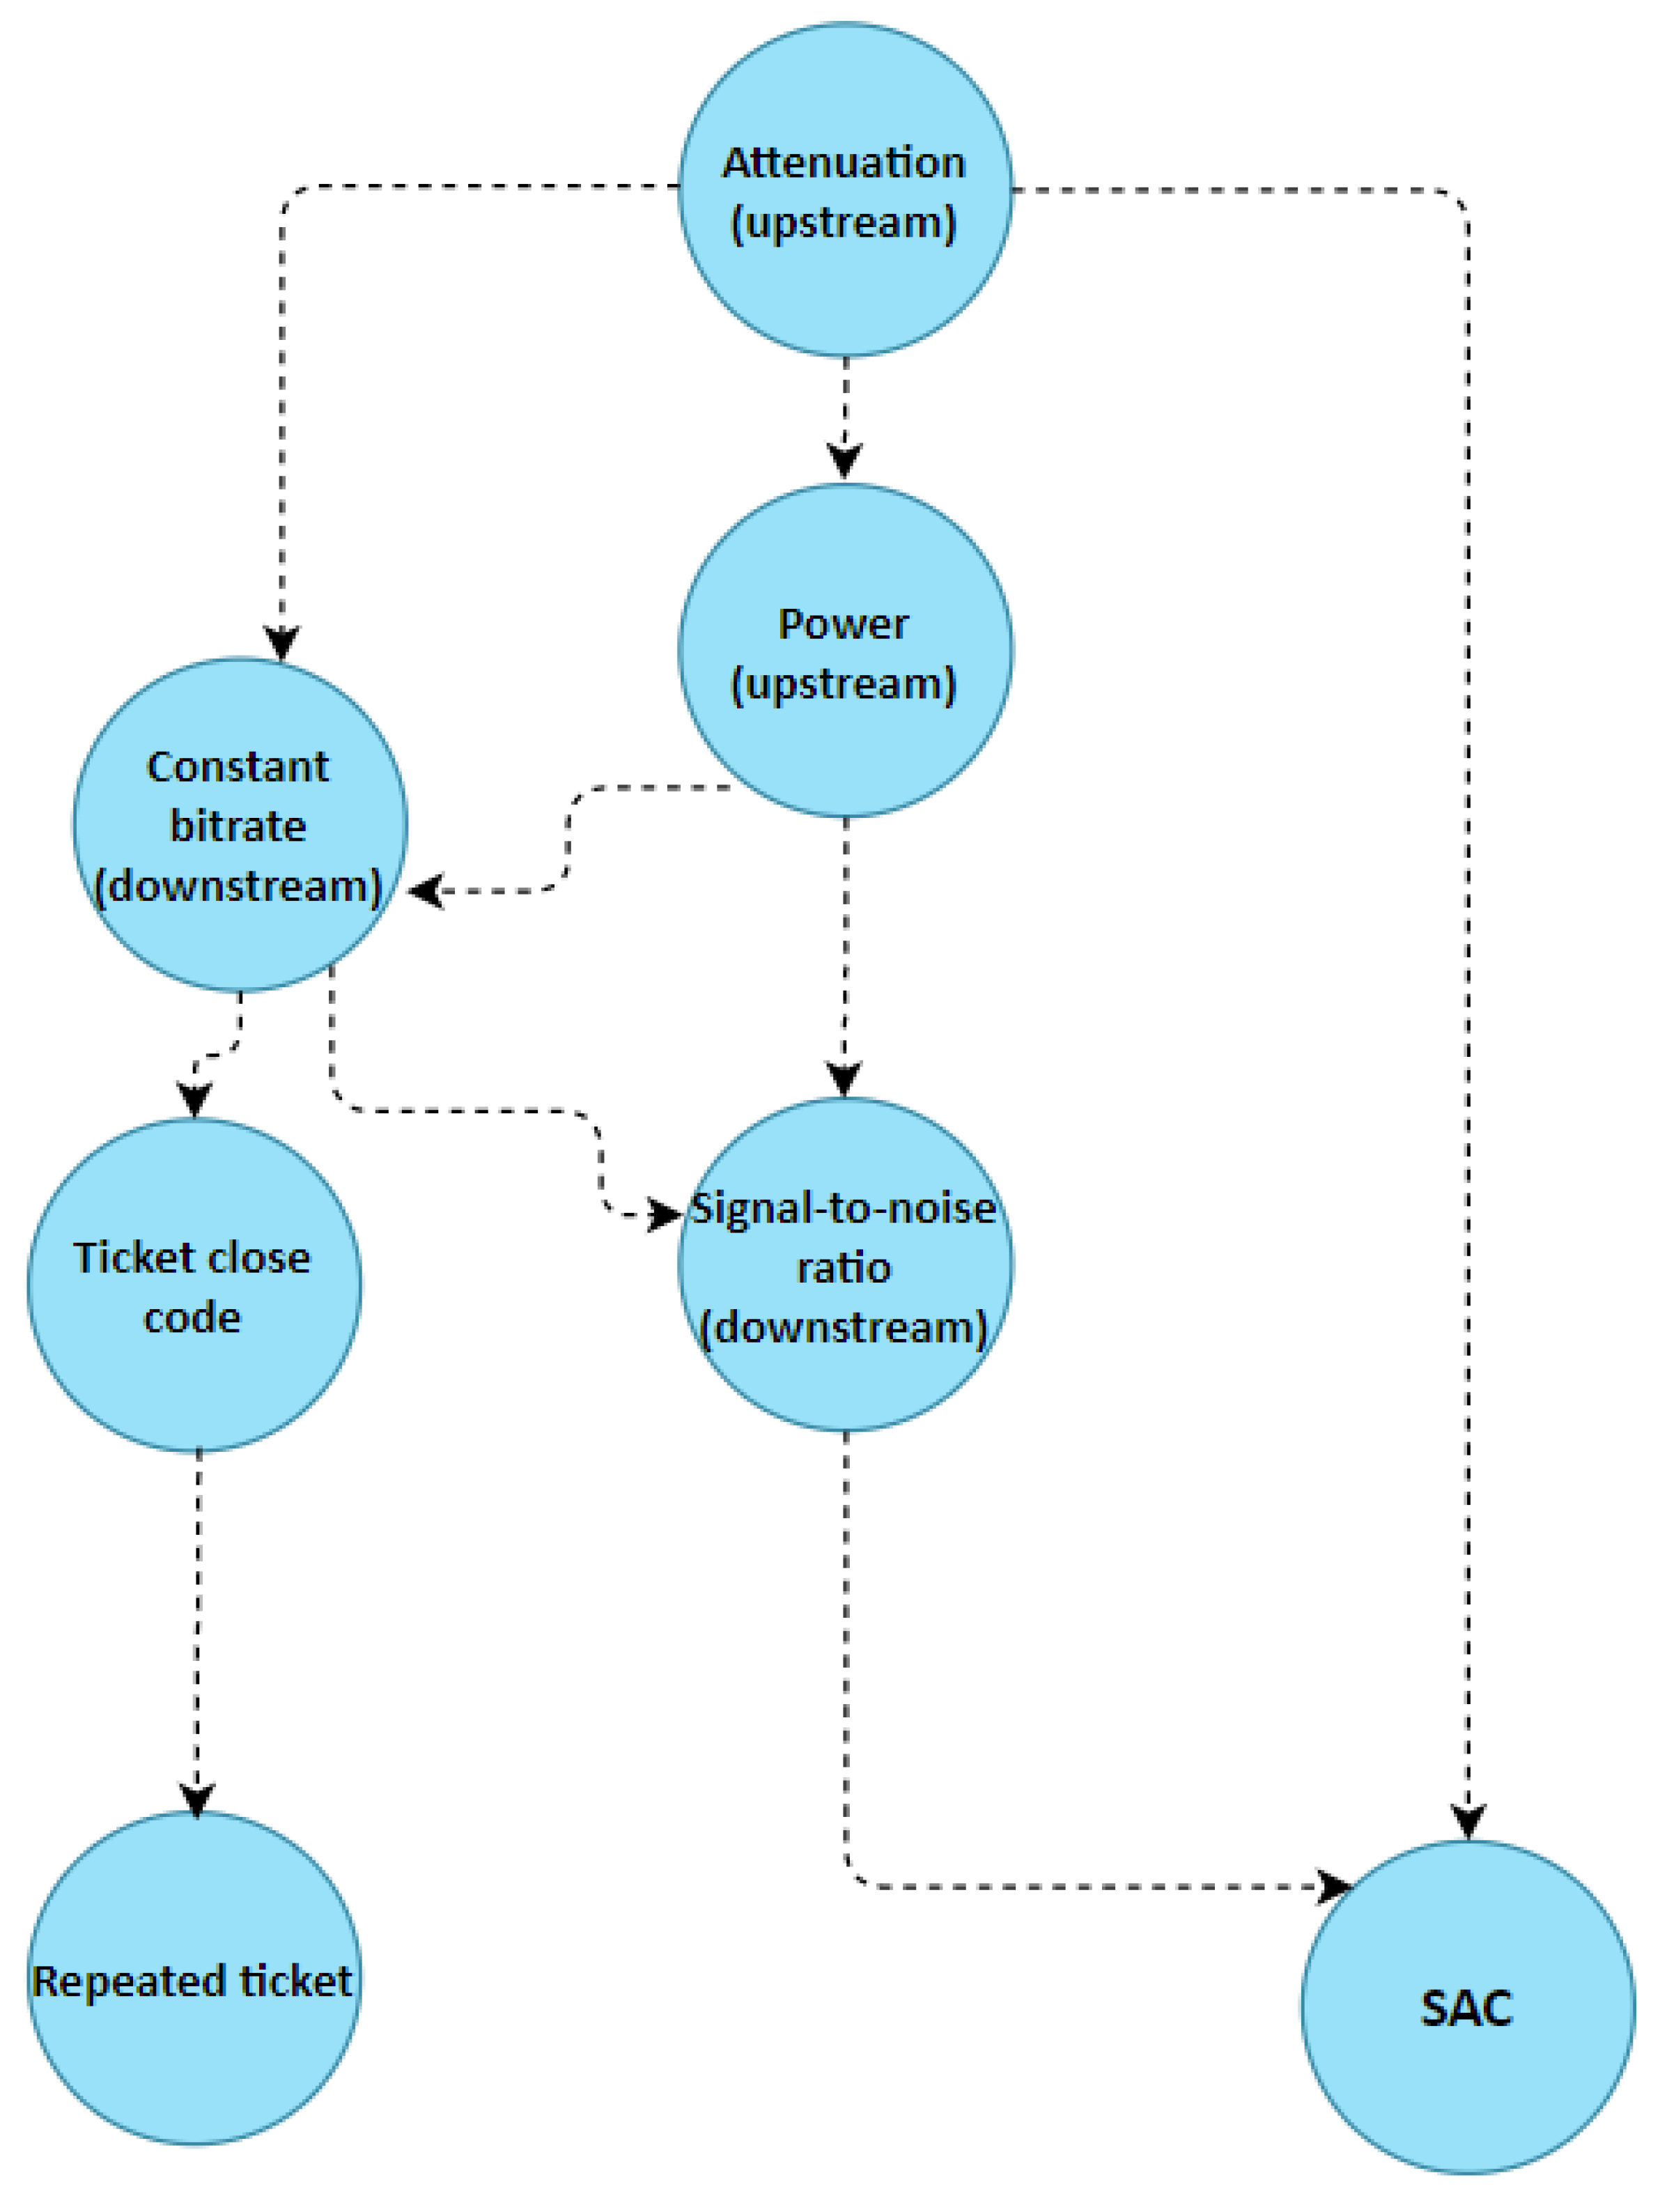
In more detail, we learned a Naive Bayes network structure
as in
Figure 3, revolving around the following input variables, which therefore compose the new reduced dataset
as a
matrix, with
:
We set the Upstream Attenuation node as root node and the SAC and Repeated ticket nodes as leaf nodes.
The variables’ alarm tag and percentage of 3G data availability for backup have been preliminarily excluded from the ABT because, from a statistical viewpoint, they were not suitable for the algorithm procedure that is behind training a Bayesian network classifier.
In addition, before training the classifier, we chose to perform discretization—referred to as the process of grouping values into intervals in order to limit the number of possible states—on the input data according to the type and distribution of each variable, in order to optimize the performance in the creation of the Bayesian network graph. The following two methods were applied onto the continuous variables of the ABT: namely, quantile (subdivision by frequency) and uniform (subdivision into a suitable number of groups of the same size) discretization.
Quantile discretization was performed onto the constant bitrate (downstream), signal-to-noise ratio (downstream), attenuation (upstream) and power (upstream) variables, by grouping the values of each variable into four same size bins, split based on percentiles.
Uniform discretization, instead, was performed onto the ticket close code and SAC, grouping the values of each variable into four same-width discrete bins depending on the span of possible values for each considered variable.
The Repeated ticket variable was discretized into two disjoint bins, of which 15% are repeated tickets and the rest are non-repeated.
Table 4 shows the characteristics of the Bayesian network in detail. The value of the Pearson correlation coefficient (denoted with ‘Strength’ in the table) indicates the existing degree of correlation between the variables considered: the closer this value is to 1, the greater the correlation between the variables. On the other hand, the ‘Direction’ column indicates the degree of reliability of the links that introduce a hierarchy between the variables: in this case, too, the closer the value is to 1, the more the direction of the link accounting for the existing relationship between the considered variables is reliable.
It is clear from
Figure 3 and
Table 4 that the correlation coefficient with the variables closest to the Repeated ticket variable is always greater than
, which implies that the proposed tree structure can be considered as highly reliable for our classification purpose.
The combinations of conditional probabilities calculated by the Bayesian network as a result of discretization generate a number of scenarios to which it is possible to associate the probability of occurrence of the event of ticket reopening. For the considered reduced dataset
, more than one thousand different simulation scenarios were generated. Namely, the 13 intervals shown in
Table 5 are combined with the 17 possible causes identified within the ticket close code variable. Constant bitrate in downstream is measured in bits per second. Attenuation in upstream is measured in dB and power in upstream is measured in dBmV.
Remark 1. The number of relevant scenarios may vary depending on the discretization type and the number of tickets associated with the different combinations. This has proven to be the best choice, given the characteristics of the considered dataset.
4.2. Model Performance Evaluation and Discussion on the Results
For the purpose of evaluating the model performance, we adopted the same approach as discussed at the beginning of
Section 3.2. However, in order to further test the robustness of the Bayesian network classifier, we also carried out the experiment of creating 1000 random pairs of training/test sets according to the 70/30 rule, i.e., 70% of the
dataset was used for training purposes and the rest for testing. The measured KPIs were very similar, thus testifying the effectiveness of the Bayesian network classifier as well as its robustness. The average values of the KPIs measured throughout these tests are reported below in
Table 6 in order to compare them with the results of the different classifiers trained in
Section 3.
The validation process was completed by comparing the accuracy measure achieved by the Bayesian network classifier against the performance of the other classifiers.
From
Table 6, it is clear that the Bayesian Network classifier trained on
outperforms the classifiers introduced in
Section 3.
Among the trained classifiers, according to the accuracy and AUC measures, the Bayesian Network classifier proves to be the most effective at minimizing the error (8).
From the results obtained, we also infer the combinations of features in that are most probably the reason for ticket reopening: namely, they are the events listed below:
- (1)
Ticket close code (d) AND Constant bitrate (downstream) in bin 2 AND Power (upstream) in bin 4 AND Attenuation (upstream) in bin 3;
- (2)
Ticket close code (k) AND Constant bitrate (downstream) in bin 1 AND Power (upstream) in bin 1 AND Attenuation (downstream) in bin 3;
- (3)
Ticket close code (i) AND Constant bitrate (downstream) in bin 4 AND Power (upstream) in bin 3 AND Attenuation (upstream) in bin 3;
- (4)
Ticket close code (i) AND Constant bitrate (downstream) in bin 3 AND Power (upstream) in bin 3 AND Attenuation (upstream) in bin 4;
- (5)
Ticket close code (i) AND Constant bitrate (downstream) in bin 2 AND Power (upstream) in bin 2 AND Attenuation (upstream) in bin 3;
- (6)
Ticket close code (i) AND Constant bitrate (downstream) in bin 3 AND Power (upstream) in bin 2 AND Attenuation (upstream) in bin 1;
- (7)
Ticket close code (p) AND Constant bitrate (downstream) in bin 2 AND Power (upstream) in bin 3 AND Attenuation (upstream) in bin 3;
- (8)
Ticket close code (p) AND Constant bitrate (downstream) in bin 3 and Power (upstream) in bin 4 AND Attenuation (upstream) in bin 4;
- (9)
Ticket close code (p) AND Constant bitrate (downstream) in bin 4 AND Power (upstream) in bin 1 AND Attenuation (upstream) in bin 2.
Table 7 reports them with the corresponding number of occurrences of such combinations of QoS parameters.
In general, as can be seen from
Table 7, the trained classifier provides the customer service of a network operator with a reliable tool for effectively monitoring customer tickets that, despite being already closed, are at risk of being reopened due to unsolved technical issues related to the perceived QoS.
The complexity of the Bayesian Network classifier, namely the most successful one, is linear in the number of training examples and in the number of features characterizing each training example. Instead, almost all other methods exhibit increased runtime complexity: more precisely, the Decision Tree, Random Forest and Gradient Boosting approaches are such that their complexity is logarithmic in the number of training examples, whereas the complexity of the SVM approach is quadratic in the number of training examples. Only the ANN and the Logistic Regression techniques have comparable computational complexity with respect to the Bayesian Network classifier, but with lower predictive performance (as shown in
Table 6).
5. Conclusions
The paper proposes a data-driven approach based on machine learning for predicting technical ticket reopening in customer service platforms of telecommunications companies providing 5G fiber optic networks, namely with respect to ensuring that, between end user and service provider, the Service Level Agreement in terms of perceived Quality of Service is satisfied.
The activity was carried out within the framework of an extensive joint research initiative on Next Generation Networks between ELIS Innovation Hub and a major network service provider in Italy over the years 2018–2021.
The authors compare the performance of different approaches to classification—ranging from decision trees to Artificial Neural Networks and Support Vector Machines—and establish that a Bayesian network classifier is the most accurate at predicting whether a monitored ticket will be reopened or not.
In addition, the authors propose a suitable dimensionality reduction strategy that proves to be successful at increasing the computational efficiency by reducing the size of the relevant training dataset by two orders of magnitude with respect to the original dataset.
Numerical simulations show the effectiveness of the proposed approach, proving it can be a very useful tool for service providers in order to identify the customers that are most at risk of reopening a ticket due to an unsolved technical issue.
As future work, the authors look forward to testing the proposed method on Quality of Service datasets coming from additional sources and/or related to other 5G networks, as well as to testing the same method on even larger datasets in orders to further assess its scalability properties.


 ,
, 


